athena wealth management investment research … department...is us dollar predominant no longer? us...
TRANSCRIPT

Athena Wealth Management
Investment Research Report
November 2008

3
Latest Global Stock Price Indices on November 14
Dow Jones 8497.31
NASDAQ 1516.85
S&P500 873.29
Philadelphia Semi-Conductor 201.39
Mexico 19562.10
Brazil 35789.10
Argentina 1022.81
German DAX 4710.24 London Financial Times 4232.97
French CAC 3291.47
Italian MIB 21581.00
Russian RTS 644.02
Pan-European Dow Jones STOXX 2458.31
Taiwan Weighted 4452.70
Japanese Nikkei 225 8462.39
Japanese Nikkei 225 846.91
Tokyo Stock Exchange Second Section
1975.35
KOPSI 1088.26
SH Composite 1986.44
SH Composite 2086.68
SH B-Share 106.45
SZ Composite 545.34
SZ A-Share 573.69
SZ B-Share 253.01
Heng Seng 13542.66
Singapore Strait 1759.14
Philippine Composite 1978.05
Indonesia Composite 1264.38
Thailand SET 429.97
Malaysia 881.65
India 9385.42
New Zealand 2767.66
Australia ASX 3726.00
ustra
lia A
SX
Index
New
Zeala
nd
India
Mala
ysia
Thaila
nd S
ET
Index
Indon
esia
Com
posite
S
tock P
rice In
dex
Philip
pin
e C
om
posite
S
tock In
dex (P
HIS
IX)
Sin
gap
ore
Stra
it Index
Hong K
ong H
eng S
eng
Index
ShangZ
he
n B
-Share
S
tock P
rice In
dex
ShangZ
he
n A
-Share
S
tock P
rice In
dex
ShangZ
he
n C
om
posite
S
tock P
rice In
dex
(SZ
CS
PI)
Shangh
ai B
-Share
Sto
ck
Pric
e In
dex
Shangh
ai A
-Share
Sto
ck
Pric
e In
dex
ShangH
ai C
om
posite
S
tock P
rice In
dex
(SH
CS
PI)
Kore
a C
om
posite
Sto
ck
Pric
e In
dex (K
OP
SI)
Tokyo
Sto
ck E
xchang
e
Second S
ectio
n In
dex
TO
PIX
Index
Japan
ese N
ikkei 2
25
index
Taiw
an W
eig
hte
d In
dex
Jones S
TO
XX
index
Pan-E
uro
pe
an D
ow
Russia
n R
TS
Index
Italia
n M
IB In
dex
Fre
nch C
AC
Index
Index
Lond
on F
inancia
l Tim
es
Germ
an D
AX
Index
Arg
entin
a
Bra
zil
Mexic
oP
hila
delp
hia
Sem
i-C
onducto
r Index
S&
P 5
00
NA
SD
AQ
Index
Dow
Jones In
dex
Performance of Global Stock Markets during November 1-14
Year-to-Date Performance of Global Stock Markets

貶值
升值
貶值
升值
4
US Dollar Exchange Rate Table – November 14
TW new dollar 33.0790
British pound 0.6711
Euro 0.7833
Japanese yen 97.41
Australian
dollar 1.5145
Canadian dollar 1.2204
Swiss franc 1.1884
HK dollar 7.7495
Renminbi 6.8235
Indonesian
rupiah 11655
Malaysian
ringgit 3.5920
New Zealand
dollar 1.7756
Swedish krona 7.9652
Singapore
dollar 1.5157
Thai baht 34.9200
US Dollar Index 86.3650
貶值
升值
US
Dolla
r Index
Thai b
aht
Sin
gap
ore
dolla
r
Sw
edis
h k
ron
a
New
Zeala
nd
dolla
r
Mala
ysia
n rin
ggit
Indon
esia
n ru
pia
h
Renm
inbi
Hong K
ong d
olla
r
Sw
iss fra
nc
Canadia
n d
olla
r
Austra
lian d
olla
r
Japan
ese ye
n
Euro
Britis
h p
oun
d
Taiw
an n
ew
dolla
r
US
Dolla
r Index
Thai b
aht
Sin
gap
ore
dolla
r
Sw
edis
h k
ron
a
New
Zeala
nd
dolla
r
Mala
ysia
n rin
ggit
Indon
esia
n ru
pia
h
Renm
inbi
Hong K
ong d
olla
r
Sw
iss fra
nc
Canadia
n d
olla
r
Austra
lian d
olla
r
Japan
ese ye
n
Euro
Britis
h p
oun
d
Taiw
an n
ew
dolla
r
Performance of the US dollar during November 1 to 14
Year-to-Date Performance of the US dollar

Is US Dollar predominant no longer?
US Dollar, as the uniform settlement currency worldwide, used to maintain the order ofglobal trade and bring about an unprecedented prosperity of world economy. However,tremendous change has taken place in world economy since the establishment of IMF andWorld Bank. The market economy of many emerging countries develops rapidly whileintegration of industrialized countries advances further. Accordingly IMP and World Bankare required to do some change in their function, operation adjustment and restructuringand the like. Particularly, US Dollar is entirely predominant for a long time, thuscontrolling the artery of world economy. Consequently, an unequal situation occurs thatbenefits are solely enjoyed by America while risks are borne by the world. With the rapiddevelopment of global economy and the international trade, the hegemony of US Dollarcollapses sooner and later because the global settlement system based on the currency ofa nation, with the change in the domestic and global economy, will undoubtedly becomeinstable and infirm so that it is difficult to push forward the overall growth of worldeconomy.
This financial crisis of America is as well the crisis of US Dollar. Under the system of foreignexchange reserve in US Dollar terms, each country has to share losses arising fromAmerican crisis. As a result, these countries such as Russia, Japan, feel discontent andintensively appeal to the breakdown of hegemony of US Dollar. Denis Sassou Nguesso,the president of Congo(B), on behalf of various African countries, requests to attendthe reform of international financial system and play a great role in the prospective newsystem. The peak of competition among those countries will reach at the turn of the oldand new systems. The collapse of US Dollar’s dominant position arouses manycountries’ ambition to replace it with their own currencies. Since the crash of an oldsystem means the forthcoming of a new opportunity, have we prepared ourselves?
This financial crisis reveals that there are disadvantages and risks in the dominant status ofUS Dollar. Therefore, we need to find out a solution in conformity with the irresistibletendency of globalization. A uniform currency unit transcending over each nation isnecessary for the establishment of a fair, reasonable and scientific international financialsystem. Yet it is unrealistic just as a world language. There is a tiny possibility that a newBretton Woods System is built within the short time because of a significant interestdivergence among different countries.
At the meantime, in one hand, IMF and World Bank should speed up the reform inmanagement, such as reexamining and determining fund quotas, expanding basic voteright, increasing portion of developing countries, preventing the minority of developedcountries from vetoing factually. On the other hand, IMF must establish a supervising andcoordinating system between it and Federal Reserve or other main developed economies,introduce leverage system to financial transactions and demand these economies tostrengthen control and alert of liquidity of transnational capital in order to maintain thestability of international finance.
America
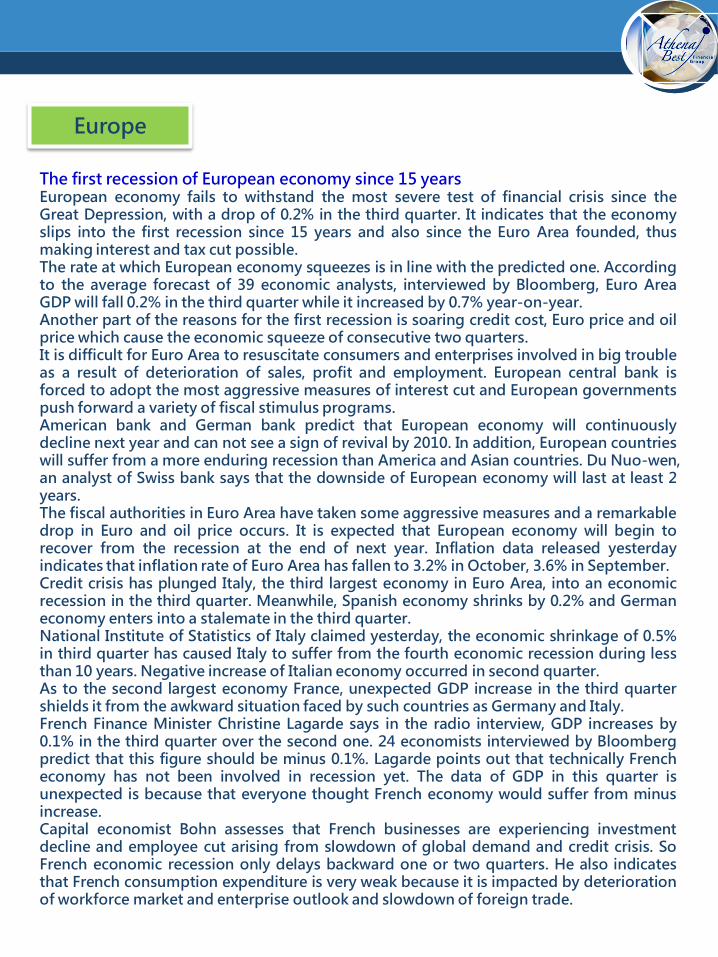
The first recession of European economy since 15 yearsEuropean economy fails to withstand the most severe test of financial crisis since theGreat Depression, with a drop of 0.2% in the third quarter. It indicates that the economyslips into the first recession since 15 years and also since the Euro Area founded, thusmaking interest and tax cut possible.The rate at which European economy squeezes is in line with the predicted one. Accordingto the average forecast of 39 economic analysts, interviewed by Bloomberg, Euro AreaGDP will fall 0.2% in the third quarter while it increased by 0.7% year-on-year.Another part of the reasons for the first recession is soaring credit cost, Euro price and oilprice which cause the economic squeeze of consecutive two quarters.It is difficult for Euro Area to resuscitate consumers and enterprises involved in big troubleas a result of deterioration of sales, profit and employment. European central bank isforced to adopt the most aggressive measures of interest cut and European governmentspush forward a variety of fiscal stimulus programs.American bank and German bank predict that European economy will continuouslydecline next year and can not see a sign of revival by 2010. In addition, European countrieswill suffer from a more enduring recession than America and Asian countries. Du Nuo-wen,an analyst of Swiss bank says that the downside of European economy will last at least 2years.The fiscal authorities in Euro Area have taken some aggressive measures and a remarkabledrop in Euro and oil price occurs. It is expected that European economy will begin torecover from the recession at the end of next year. Inflation data released yesterdayindicates that inflation rate of Euro Area has fallen to 3.2% in October, 3.6% in September.Credit crisis has plunged Italy, the third largest economy in Euro Area, into an economicrecession in the third quarter. Meanwhile, Spanish economy shrinks by 0.2% and Germaneconomy enters into a stalemate in the third quarter.National Institute of Statistics of Italy claimed yesterday, the economic shrinkage of 0.5%in third quarter has caused Italy to suffer from the fourth economic recession during lessthan 10 years. Negative increase of Italian economy occurred in second quarter.As to the second largest economy France, unexpected GDP increase in the third quartershields it from the awkward situation faced by such countries as Germany and Italy.French Finance Minister Christine Lagarde says in the radio interview, GDP increases by0.1% in the third quarter over the second one. 24 economists interviewed by Bloombergpredict that this figure should be minus 0.1%. Lagarde points out that technically Frencheconomy has not been involved in recession yet. The data of GDP in this quarter isunexpected is because that everyone thought French economy would suffer from minusincrease.Capital economist Bohn assesses that French businesses are experiencing investmentdecline and employee cut arising from slowdown of global demand and credit crisis. SoFrench economic recession only delays backward one or two quarters. He also indicatesthat French consumption expenditure is very weak because it is impacted by deteriorationof workforce market and enterprise outlook and slowdown of foreign trade.
Europe

International oil price International oil price keeps dropping since OPEC reduced production in November, evencrude oil in London Brent plunged to US$50/barrel on November 13. OPEC decidedtemporarily to hold additional conference about oil production reduction. Stimulated bythis news, future oil price in New York rise by 3.7%, to US $ 58/barrel.To stem international oil price from keeping sinking, OPEC declared to reduce oilproduction in November but the downward trend of crude oil did not change thereby.Therefore, experts from big financial institutions internationally uphold that internationalfuture market of crude oil was influenced significantly by American subprime mortgagecrisis so that international oil price is difficult to rebound substantially. OPEC can not waitto the routine conference in December 17 and decides to add another conference aboutreducing production.
Commodity and Future
International oil price
International gold priceGold is expecting favorable news from G20 summit after a sharp rise by US$40/ounce in Americaon Thursday.
Shanghai Lion King Gold Co., Ltd says that leaders from G20 countries will discuss the currentexchange rate regime. French president Sarkozy will put forward that US Dollar is not a uniqueworld currency any longer and make some explanation to it. This is likely to be good news forgold. International gold price

Reserving opinions of medium-term rebound if still above the previous low
Preface:The global stock markets largely pulled back last week,but only the minority of them fell below the previous low,such as scientific shares and semi-conductor shares. Atpresent, most of analysts hold a conservative opinion ofthe economic revival of the fourth quarter. IMF lowers theexpected growth rate of 2008 GDP again to 3.7% andgrowth rate of 2009 to 2.2% and estimates that globaleconomy will not come to recover until the late part of2009. In fact, at least 20-22 weeks are necessary forcorrection (see chart on the right), judging from the time ofthe bearish correction of stock market in the past.Furthermore, stock markets usually respond withbottoming out or reversal prior to the overall economy.According to IMF’s forecast and technical analysis, it is agreat possibility that stock markets touch bottom duringJuly to August, 3 to 4 months earlier than the overalleconomy. This deserves attention of the investors.However, a bounce may be possible during the backingand filling of the declining markets. Recently, most of stockmarkets form the pattern of pulling back to test thesupport level after going upward in the previous week. Theweekly Candlestick will have a good chance to form anascending pattern if the stock markets begin to rally beforereaching a new low. In such a case, the opinions ofmedium-term rebound keep unchanged. Otherwise, thebearish correction will appear gain. So the investors shouldkeep an eye on any market change next week.
America Currently, The Dow Jones Index and S&P 500 Index has not fallen below previous-wave low yet. A
Rebound of long position is expected to continue if the Long White Candlestick with surging volumeappears, bringing about an ascending pattern next week. Presently NASDAQ Index and PhiladelphiaSemi-Conductor Index drop just below the previous low. The investors have to wait and see whetherthere will be signals of curbing decline next week. In absence of such signals, the indices tend to keepsinking.
Europe The German, London and French Indices; Presently the three indices pull back to test the support line
after surging in the previous week, closing above the previous low. An intermediate-term bounce maybe expected if Long White Candlestick appears next week.
Middle East: The MSCI GCC INDEX, influenced by the plunge in global stock markets and oil prices in the short
term, remained depressed. Its prospect will depend on the performance of the global stock markets.Asia The Japanese Nikkei 225 index, KOPSI, Malaysia’s stock market, Singapore’s stock market, Heng
Seng Index, Indonesian Index, Philippine stock market and Vietnamese Index; the indices are expectedto rebound continuously if stock markets stage a rally next week in the short term. The TaiwanWeighted Index and Thailand’s stock market are undergoing a weak correction. If the stock marketsfall below the previous low again, a bearish correction will continue.
BRIC In the event that Brazil’s stock market begins to rally in the short term next week, the index is
estimated to remain a rebound. This case is applied to India’s stock market. Russian stock market isstill embarking on a feeble correction in the short term. Such a bearish correction will prolong if thestock market hits a new low. China’s stock markets begin to gain after backing and filling at the lowlevel. It is advised to buy in China’s stock markets.
Other markets The Australian Index is embarking on a weak backing and filling in the short term. Such a downside
correction will continue if the stock market closes below the previous low. The Mexican Index will goon with a rebound if it stages a short-term rally next week. CRB Index entered into a short-termcorrection at the low level. The crude oil stocks have slowed down its plunge. The index may remain arebound if it can begin to rally in the short term next week. The Street TRACKS Gold Trust pulled backto test the downward trendline. It is expected to bounce if it can keep steady in the short term. Theinterest rate percentage of 10-Year US Treasury bond is volatile in a given range, with a sign of bearishtrend. The US Dollar Index will slow down its bounce in the short term. It may head downhill nextweek. There is a great chance that the Taiwan new dollar versus US Dollar will go up to 32.5 in theshort term. From: IOM Asset Management
Correction Period of Each Stock Disaster
Event Period
Great Depression in 1929 34 months
Dollar Credit Crisis in 1970 20 months
Petroleum Crisis in 1974 22 months
Saving and Loan Crisis in 1986 6 months
Japanese Real Estate Bubble in
1989
32 months
Asian Financial Storm in 1997 13 months
Technological Bubble in 2002 30 months
Average Correction Period 22.4 months
American Credit Crisis ?
Data Source: Bloomberg Li Juanping/Tabling

圖表來源:第一銀行、鉅亨網、MSCI
America
The Dow Jones Index closed down in a correction at 8497 on
November 14. Technically speaking, although the long term
trend remains bearish, the index kept above the previous low
in the short term last week. Otherwise, a sharp decline is
possible. If Long White Body forms next week, an ascending
pattern will appear and help promote a bounce in the medium
term. The short-term resistance and support levels are at
9653 and 7882, respectively.
The NASDAQ Index closed down at 1516.85 on November
14. Technically speaking, the index turned weak and fell
below the previous low. Keep conservative if it declines
below 1652 points and continue downward. The short-term
resistance and support levels are at 1680 and 1428,
respectively.
The S&P500 Index closed in a downward correction at
873.29 on November 14. Technically speaking, the long-
term trend remains bearish, but in the short term, the index
pulled back to the last-wave low. Hope it will not continue to
go down. Otherwise, it may remain bearish. But the Long
White Candlestick can form next week, the short-term
downward trend may be turned over and a medium rebound
is expected. The short-term resistance and support levels
are at 1007 and 818, respectively.
The Philadelphia Semi-Conductor Index closed in a
downward correction at 201.39 on November 14.
Technically speaking, the long-term trend remains
bearish, and the index may dip to a new low. Keep
cautious. The downward trend can slow down only if it
closes at the cross next week. The short-term
resistance and support levels are at 226 and 185,
respectively.
Dow Jones Index NASDAQ Index
S&P500 Index Philadelphia Semi-Conductor Index
圖表來源:第一銀行、鉅亨網、MSCI
Europe and Australia
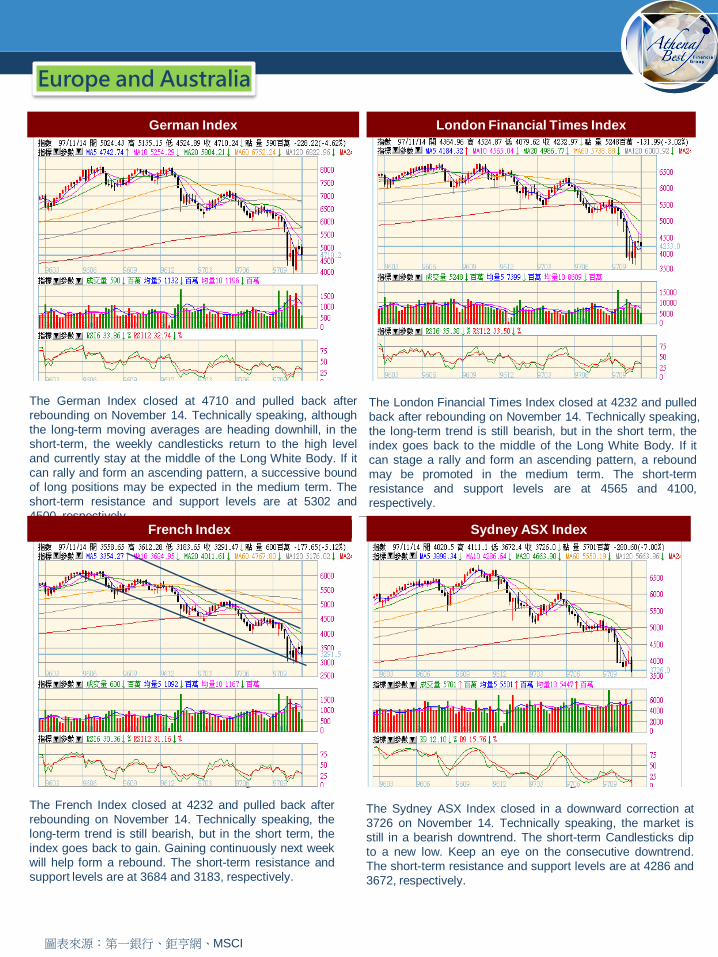
The German Index closed at 4710 and pulled back after
rebounding on November 14. Technically speaking, although
the long-term moving averages are heading downhill, in the
short-term, the weekly candlesticks return to the high level
and currently stay at the middle of the Long White Body. If it
can rally and form an ascending pattern, a successive bound
of long positions may be expected in the medium term. The
short-term resistance and support levels are at 5302 and
4500, respectively.
The London Financial Times Index closed at 4232 and pulled
back after rebounding on November 14. Technically speaking,
the long-term trend is still bearish, but in the short term, the
index goes back to the middle of the Long White Body. If it
can stage a rally and form an ascending pattern, a rebound
may be promoted in the medium term. The short-term
resistance and support levels are at 4565 and 4100,
respectively.
The French Index closed at 4232 and pulled back after
rebounding on November 14. Technically speaking, the
long-term trend is still bearish, but in the short term, the
index goes back to gain. Gaining continuously next week
will help form a rebound. The short-term resistance and
support levels are at 3684 and 3183, respectively.
The Sydney ASX Index closed in a downward correction at
3726 on November 14. Technically speaking, the market is
still in a bearish downtrend. The short-term Candlesticks dip
to a new low. Keep an eye on the consecutive downtrend.
The short-term resistance and support levels are at 4286 and
3672, respectively.
German Index London Financial Times Index
French Index Sydney ASX Index

MSCI GCC COUNTRIES
圖表來源:第一銀行、鉅亨網、MSCI
Middle East and Asia-1
The Japanese Nikkei 225 Index closed at 8462 and pulled
back after rebounding at a low level on November 14.
Technically speaking, the long-term trend is still bearish but
in the short term, the index returns to the middle of the
White Candlestick last week. An ascending pattern sparked
by a rally next week will help form a rebounding layout. The
short-term resistance and support levels are at 9720 and
8148, respectively.
The MSCI GCC COUNTRIES Index closed in an extended
correction at 386.3 on November 14. Technically speaking,
owing to the volatility of global stock markets, the Index is
undergoing a wide range of correction. The investors are
suggested to wait and see where the stock markets go in the
short term. The short-term resistance and support levels are
at around 450 and 350, respectively.
The Vietnamese Index closed in a low-level correction at
352.07 on November 14. Technically speaking, the current
weekly Candlesticks are forming gradually a gold cross at
the low level. However, a rebound will be more likely to
available if the index jumps beyond 402 next week. The
short-term resistance and support levels are at 402and 313,
respectively.
The Heng Seng Index closed at 13542 with a rebound at a low
level on November 14. Technically speaking, the Index is still
heading downhill in the long term, but in the short term, the
index still settles at the middle of Long White Candlestick last
week. A bullish reversal is likely to continue if the Long White
Body appears in the weekly bar chart again next week. The
short-term resistance and support levels are at 15876 and
12943, respectively.
Japanese Nikkei 225 Index
Vietnamese Index Heng Seng Index

圖表來源:第一銀行、鉅亨網、MSCI
Asia-2
The Korean Index closed at 1088.26 with a rebound at a
low level on November 14. Technically speaking, the
index still remains bearish in the long term but the short-
term indicator returns to the middle of the Long White
Body this week and remains steady currently. A gain next
week may spark an extending rebound. The short-term
resistance and support levels are at 1252 and 1000,
respectively.
The Taiwan Weighted Index, pulling back after rebounding,
closed at 4452 on November 14. Technically speaking, the long-
term trend is still downward and in the short term the index is
likely to hit a new low. The bearish correction may go on unless
the index begins to rebound. The short-term resistance and
support levels are at 5000 and 4110, respectively.
The Singapore Strait Index, pulling back after low-level
rebounding, closed to settle at 1759.14 on November 14.
Technically speaking, the long-term trend remains bearish,
but the short-term indicator returns to the middle of the Long
White Body this week. If a rally appears next week, a wave of
rebound will continue. The short-term resistance and support
levels are at 2068 and 1700, respectively.
The Thailand Index closed at 429.97 on November 14, in a
downward correction. Technically speaking, the long-term
trend remains bearish and in the short term, the Long Black
Candlestick formed and offset the previous advance last
week. If the index closes at a new low, a bearish backing
and filling will extend. The short-term resistance and support
levels are at 500 and 383.6, respectively.
Korean Index Taiwan Weighted Index
Singapore Strait Index Thailand Index

圖表來源:第一銀行、鉅亨網、MSCI
Asia-3 and Latin America
The Indonesian index closed in a downward correction at
1264.38on November 14. Technically speaking, the long-
term trend remains bearish and the short-term indicator
pulled back last week. A wave of rebound is expected to
continue if the index does not reach a new low and begins
to turn upward. The short-term resistance and support
levels are at 1420 and 1089, respectively.
The Philippine index closed in a low-level correction at
1978.05 on November 14. Technically speaking, the long-
term bearish trend remains unchanged. If the index can
jump above 2227 in the short term, a rebound will initiate. In
the event of a decline below the last-week low, a downward
correction may arise again. The short-term resistance and
support levels are at 2227 and 1684.75, respectively.
The Malaysian index closed in a downward correction at
881.65 on November 14. Technically speaking, the market
is still bearish in the long term, but the candlesticks at the
low level show a signal of forthcoming volatility. If the index
may hold above 944, a wave of rebound may be expected.
The short-term resistance and support levels are at 944
and 801, respectively.
The Mexican Index pulled back after a bounce and closed
at 19562 on November 14. Technically speaking, presently,
the index returns to the middle of the White Candlestick.
An upward trend next week may spark an extending
rebound. The short-term resistance and support levels are
at 21694 and 18000, respectively.
Indonesian index Philippine index
Malaysian index Mexican Index

俄羅斯RTS美元指數(週線)
a
BRIC
The Brazilian Index pulled back after a bounce at a low level
and closed at 35789 on October 14. Technically speaking,
in the short term, the index pulls back after a harami line
takes shape. A wave of rebound is likely to appear if the
index goes upward next week. The short-term resistance
and support levels are at 41394 and 35000, respectively.
The Russian RTS index pulled back and closed at 644.02
on November 14. Technically speaking, the overall trend is
still depressed in the long term and the bearish correction
may extend if the short-term index break the previous-
week low. Only a jump above 926 can initiate a wave of
rebound. Pay attention to whether it falls below the
previous low. The short-term resistance and support levels
are at 926 and 549, respectively.
The Indian index pulled back after a bounce and
closed at 9385on November 14. Technically speaking,
the long-term trend is still downward but the short-term
index returns to the support line last week. If it can
stage a rally, a wave of rebound may be expected.
The short-term resistance and support levels are at
11281 and 8000, respectively.
The Chinese Shanghai A-Share Index closed at 2086.68 on
November 14, after backing and filling at low level.
Technically speaking, the bearish trend seems to end in the
long term and begins to rebound from the bottom. The
investors are suggested to increase their positions with fixed
term, fixed amount investments. The short-term resistance
and support levels are at 2438 and 1700, respectively.
Brazilian Index Russian RTS index
Indian index SENSEX 30K Chinese Shanghai A-Share Index

厚德石油探勘指數基金(週線)道富SPDR能源指數基金(週線)
圖表來源:第一銀行、鉅亨網、MSCI
近期原油(週線)
Commodity and Energy
The CRB Index closed in a continuous correction at
247.63 on November 14. Technically speaking, the index
is still bearish in the short term. But a bullish trend is
possible so long as it breaks through 262.2. The short-
term resistance and support levels are at 262.2 and 230,
respectively.
The crude oil futures closed at US$57.04 on November 14.
Technically speaking, there is still room for further
downward correction in the short term. The investors may
first observe whether the oil prices may hold above
US$50.The short-term resistance and support levels are at
US$64 and US$50, respectively.
The Select Sector Energy SPDR in a continuous correction
closed at 47.77 on November 14. Technically speaking,
the index was dragged down by the declining oil prices.
Presently, if the index may close above 55, a rebound may
be expected. The short-term resistance and support levels
are at 55 and 40, respectively.
Oil Service HOLDRS Trust continued falling to close at
85.25on November 14. Technically speaking, the index still
remains weak in the short term. But presently a rebound
may be triggered if the index does not hit a new low and
goes upward next week. The short-term resistance and
support levels are at 100 and 80, respectively.
Oil Service HOLDRS Trust
(Weekly)
The Select Sector Energy
SPDR (Weekly)
Crude Oil (Weekly)
CRB Index

Source:First Bank, cnYES, MSCI
Gold, Securities and Foreign Exchange
Source: IOM Asset Management
The streetTRACKS Gold Trust
(Weekly)
The streetTRACKS Gold Trust closed at 73.3 on
November 14. Technically speaking, the index pulled back
to test the descending trendline in the short term and
divergence pattern formed at the low level. It is estimated
that the index may initiate a bounce. The short-term
resistance and support levels are at 82 and 70,
respectively.
The interest rate percentage of the 10-Year US Treasury
bond closed at 3.731 on November 14. Technically
speaking, the interest rate is undergoing correction and
volatility. Watch out since it is faced with a turning point. If
the interest rate rises, the bond price will head down. The
short-term resistance and support levels are at 3.9 and 3.6,
respectively.
The US Dollar to Taiwan new dollar exchange rate
closed at 33.079 on November 14. Technically speaking,
the last-week bounce is still sluggish after the Index
undertook a downward backing and filling at a high level.
It is estimated that the exchange rate stands a chance to
climb. The short-term resistance and support levels are
at 33.5 and 32.5, respectively.
The US Dollar Index closed at 86.365 on November 14.
Technically speaking, the index presently begins to pull
back and is expected to test the support level of 85.3 in the
short term. If the index declines below this support line, the
US Dollar will have of risk depreciating. The short-term
resistance and support levels are at 87 and 85.3,
respectively.