atex style emulateapj v. 12/16/11 - arxiv.org e-print … · preprint typeset using latex style...
TRANSCRIPT

Accepted to the Astrophysical JournalPreprint typeset using LATEX style emulateapj v. 12/16/11
THE ATMOSPHERIC CIRCULATION OF THE SUPER EARTH GJ 1214B: DEPENDENCE ON COMPOSITIONAND METALLICITY
T. Kataria, A.P. ShowmanDepartment of Planetary Sciences and Lunar and Planetary Laboratory, The University of Arizona, Tucson, AZ 85721
J.J. FortneyDepartment of Astronomy & Astrophysics, University of California, Santa Cruz, CA 95064
M.S. MarleyNASA Ames Research Center 245-3, Moffett Field, CA 94035
and
R.S. FreedmanSETI Institute, 189 Bernardo Ave #100, Mountain View, CA 94043 and
NASA Ames Research Center 245-3, Moffett Field, CA 94035
Accepted to the Astrophysical Journal
ABSTRACT
We present three-dimensional atmospheric circulation models of GJ 1214b, a 2.7 Earth-radius, 6.5Earth-mass super Earth detected by the MEarth survey. Here we explore the planet’s circulationas a function of atmospheric metallicity and atmospheric composition, modeling atmospheres with alow mean-molecular weight (i.e., H2-dominated) and a high mean-molecular weight (i.e. water- andCO2-dominated). We find that atmospheres with a low mean-molecular weight have strong day-nighttemperature variations at pressures above the infrared photosphere that lead to equatorial superro-tation. For these atmospheres, the enhancement of atmospheric opacities with increasing metallicitylead to shallower atmospheric heating, larger day-night temperature variations and hence strongersuperrotation. In comparison, atmospheres with a high mean-molecular weight have larger day-nightand equator-to-pole temperature variations than low mean-molecular weight atmospheres, but dif-ferences in opacity structure and energy budget lead to differences in jet structure. The circulationof a water-dominated atmosphere is dominated by equatorial superrotation, while the circulation ofa CO2-dominated atmosphere is instead dominated by high-latitude jets. By comparing emergentflux spectra and lightcurves for 50× solar and water-dominated compositions, we show that observa-tions in emission can break the degeneracy in determining the atmospheric composition of GJ 1214b.The variation in opacity with wavelength for the water-dominated atmosphere leads to large phasevariations within water bands and small phase variations outside of water bands. The 50× solaratmosphere, however, yields small variations within water bands and large phase variations at othercharacteristic wavelengths. These observations would be much less sensitive to clouds, condensates,and hazes than transit observations.Keywords: atmospheric effects, methods: numerical, planets and satellites: atmospheres, planets and
satellites: composition, planets and satellites: individual (GJ 1214b)
1. INTRODUCTION
As the number of extrasolar planets detected by var-ious ground- and space-based surveys grows, so too dothe number of so-called “super Earths”, exoplanets withmasses of 1-10 Earth masses. Many of these super Earthstransit their host stars along our line of sight, which allowus to directly observe their atmospheres using the sametechniques as for hot Jupiters (e.g., Redfield et al. 2008).Such a case is true for GJ 1214b, a 2.7 Earth-radius, 6.5Earth-mass super Earth detected by the MEarth survey(Charbonneau et al. 2009). Because GJ 1214A is an M-type star only 13 parsecs away, the system has provento be a favorable target for follow-up observations (e.g.,Bean et al. 2010, 2011; Berta et al. 2012; Croll et al. 2011;Crossfield et al. 2011; Narita et al. 2012; de Mooij et al.
2012; Fraine et al. 2013; Teske et al. 2013; Kreidberg etal. 2014).
Charbonneau et al. (2009) concluded that the mea-sured mass and radius of GJ 1214b is most consis-tent with an interior that is water-dominated, with ahydrogen-helium envelope that is 0.05% the mass of theplanet. Rogers & Seager (2010) modeled the planet’s in-terior structure, and concluded that if water were presentin the planet’s atmosphere, it would be a supercriticalfluid. Hence, GJ 1214b should not have a solid sur-face. Nettelmann et al. (2011) also modeled the interiorof GJ 1214b assuming a two-layer (homogeneous enve-lope overlying a rock core) structure, and found theirresults favor a composition similar to that of Charbon-neau et al. (2009). Valencia et al. (2013) ran a range ofinternal structure/evolution models (H/He or H2O enve-lope overlying an Earth-like nucleus), finding that only asmall amount of H/He is needed to explain the planet’s
arX
iv:1
401.
1898
v2 [
astr
o-ph
.EP]
4 M
ar 2
014

2 Kataria et al.
mass and radius.In anticipation of follow-up observations of GJ 1214b,
Miller-Ricci & Fortney (2010) modeled transmission andemission spectra for a range of atmospheric composi-tions, from hydrogen-dominated (i.e., those with a lowmean-molecular-weight [MMW] atmosphere) to CO2-and H2O-dominated (i.e., those with a high mean-molecular weight). They found that if the planet’s atmo-sphere were H2/He-dominated, the primary transit depthwould show larger variations with wavelength than if theplanet had an H2O- or CO2-dominated atmosphere; thisis because of the larger atmospheric scale height for anH2-dominated atmosphere as compared to a high-MMWatmosphere. This would lead to enhanced spectral fea-tures that should be detectable by current ground- andspace-based instrumentation.
Transit spectroscopic observations by most groups,however, favor a flat transmission spectrum, consistentwith a high-MMW (e.g., water) atmosphere or an atmo-sphere with high-altitude clouds or hazes (e.g., Bean etal. 2010, 2011; Berta et al. 2012; Narita et al. 2012; deMooij et al. 2012; Fraine et al. 2013). Still, observationsby other groups favor a low-MMW atmosphere (Croll etal. 2011), particularly if methane is depleted (Crossfieldet al. 2011). Photochemical modeling by Miller-RicciKempton et al. (2012) also support a methane depletion,consistent with methane photolysis, but note that thisprocess is not efficient at the pressure levels probed bytransmission spectroscopy.
The composition will affect not only the atmosphericopacities (hence absorption of starlight and emission ofinfrared radiation) but also the atmospheric scale height,dry adiabatic lapse rate, and hence the dynamical sta-bility and circulation of the atmosphere. The circulationwill determine the location of hot and cold regions in theatmosphere, which, in turn, shapes lightcurve and spec-tral behavior at photospheric levels. In light of these con-siderations, we model the atmospheric circulation of GJ1214b, testing a multitude of atmospheric compositions.The circulation of GJ 1214b has been explored by othergroups (Menou 2012; Zalucha et al. 2012). However, ourcirculation model incorporates the most rigorous radia-tive transfer scheme used to model the atmosphere thusfar (see below). In Section 2, we describe our generalcirculation model, the SPARC/MITgcm, and describeour model integrations. In Section 3, we present resultsfrom our model integrations, and identify general trendsin circulation and temperature structure with metallic-ity and composition. In Section 4, we generate emergentflux spectra and lightcurves in anticipation of future in-strumentation aboard the James Webb Space Telescope(JWST), Thirty Meter Telescope (TMT) and other otherground- and space-based facilities.
2. MODEL
2.1. The SPARC/MITgcm
The atmospheric circulation of GJ 1214b is modeledusing the Substellar and Planetary Atmospheric Radia-tion and Circulation (SPARC) Model (Showman et al.2009), which couples the MITgcm, a general circulationmodel (GCM) maintained at the Massachusetts Instituteof Technology (Adcroft et al. 2004), with a two-streamimplementation of the multi-stream, non-gray radiative
400 600 800 1000 1200 1400 1600 1800
10−6
10−4
10−2
100
102
Temperature (K)
Pre
ssur
e (b
ars)
CO
2
H2O
CO2/H
2O
1x solar30x solar50x solar
Figure 1. 1-D initial pressure-temperature (P-T) profiles for ourmodel integrations, adapted from Miller-Ricci & Fortney (2010).Each profile assumes 4π redistribution of incident sunlight.
transfer scheme developed by Marley & McKay (1999).To emphasize its heritage, we refer to this model asthe SPARC/MITgcm. The MITgcm solves the primitiveequations, a simplification of the Navier-Stokes equationsassuming local hydrostatic balance, which is valid in sta-bly stratified atmospheres with horizontal length scalesgreatly exceeding vertical length scales. The primitiveequations are solved on a cubed sphere grid, allowing forlonger timestepping and better accuracy near the polesas compared to a latitude-longitude grid. The radiativetransfer code solves for the upward and downward fluxesthrough a given vertical column of atmosphere in theGCM, which determines the heating rate used to updatethe temperature and winds. For each chosen atmosphericcomposition (see below) the opacities are divided into 11frequency bins using the correlated-k method (Goody etal. 1989; for more details on the SPARC/MITgcm, in-cluding recent updates to the model, see Showman et al.2009 and Kataria et al. 2013). Each model integrationhas a horizontal resolution of C32 (∼ 64×128 in latitudeand longitude) and 40 or 76 pressure levels. The pres-sure levels extend from a mean pressure of 200 bars atthe bottom to 0.2 mbar at the top, evenly spaced in logpressure. The top level extends from a pressure of 0.2mbar to zero.
The SPARC/MITgcm has been successfully adaptedto investigate a variety of aspects of the atmospheric dy-namics of hot Jupiters and hot Neptunes (Showman etal. 2009, 2013; Lewis et al. 2010; Parmentier et al. 2013;Kataria et al. 2013). While the MITgcm is classically anEarth GCM, this is the first time the SPARC/MITgcmin its entirety has been used to model the circulationof a super Earth. However, given the likelihood that GJ1214b does not have a solid surface based on its mass, ra-dius and temperature, we can use the SPARC/MITgcmwith few adjustments. Utilizing the SPARC/MITgcmfor rocky, terrestrial exoplanets will be a task for futurestudies.
2.2. Model integrations
We model six atmospheric compositions for GJ 1214b,adapted from Miller-Ricci & Fortney (2010). First, wemodel H2-dominated (i.e., low-MMW) compositions at1×, 30×, and 50× solar, which have mean molecular

Atmospheric circulation of GJ 1214b 3
Table 1Molecular weight, Specific heat (cp) and Scale height (H) values for each atmospheric composition.
Atmospheric composition cp (J kg−1 K−1) H (km) Mean-molecular weight (g mol−1)
1× solar 13000 230 2.22830× solar 9440 175 2.93650× solar 8213 150 3.424H2O-dominated (99% H2O, 1% CO2) 1981 28 18.026CO2-dominated (99% CO2, 1% H2O) 1016 12 43.97450% CO2, 50% H2O 1296 17 31.00
weights of 2.228, 2.936, and 3.424 g mol−1, respectively.These models assume molecular species are in chemi-cal equilibrium abundances at the local temperature andpressure, accounting for rainout of species that have con-densed. For the high metallicity cases, all species exceptfor H2/He are enhanced by their respective factors. Sec-ond, we model an H2O-dominated atmospheric compo-sition, which is composed of 99% H2O, and 1% CO2.Third, we model a CO2-dominated atmospheric compo-sition (99% CO2, 1% H2O). Lastly, we model an interme-diate high-MMW case, with a composition of 50% CO2
and 50% H2O.For each model integration, we assume the winds to be
initially zero, and assign each vertical atmospheric col-umn the global-mean radiative-equilibrium temperature-pressure profile calculated using a one-dimensional (1-D)radiative transfer code. Liu & Showman (2013) haveshown that hot, synchronously rotating exoplanets ex-hibit circulation patterns that are insensitive to initialconditions. Figure 1 shows the pressure-temperature(P-T) profiles used in these initial conditions. Thehydrogen-dominated 1-D P-T profiles were calculated us-ing the radiative-transfer code of Fortney et al. (2005,2006, 2008) adapted from Marley & McKay (1999). TheH2O- and CO2-dominated 1-D profiles were generatedusing the code of Miller-Ricci et al. (2009). Both codescalculate the temperature structure self-consistently as-suming radiative equilibrium. The SPARC/MITgcmself-consistently solves for the flow as dynamics and heat-ing evolve.
In changing the atmospheric composition, we are alsochanging the mean-molecular weight, the specific heat,and the scale height. We calculate the specific heat us-ing the method described in Cooper & Showman (2006).This is given on a per mass basis as
cp = cp1 ·X1 + cp2 ·X2 + · · ·+ cpn ·Xn (1)
where cpn and Xn are the specific heat and mixing ratioof the nth atmospheric constituent, respectively.
The scale height, H, is given by H = RsT/g, whereRs is the specific gas constant, T is the effective tem-perature, and g is the planetary gravity. The values ofmolecular mass, cp and H for each composition are listedin Table 1, and vary over an order of magnitude.
For each simulation, we use a dynamical timestep of 25or 10 seconds with a radiative timestep of 500 or 200 sec-onds. The simulations were each run for approximately5000 Earth days, with outputs every 100 days.
3. RESULTS
3.1. Hydrogen-dominated atmospheric composition
For all three H2/He-dominated models, the atmo-spheres possess an equatorial superrotating jet, withspeeds exceeding 1 km s−1. Each model also exhibitsa pair of jets in the high-latitudes. This is seen in Figure2, which plots the zonal-mean zonal wind1 averaged overa planetary orbit for the 1×, 30× and 50× solar com-position. Overplotted in red are zonal-mean isentropes,contours of constant potential temperature. For the 1×solar case, the high-latitude jets are centered at roughly60, with peak speeds comparable those at the equator.For the high metallicity cases, the high-latitude jets arecentered at ∼ 70, with speeds of 700 m s−1.
Two trends in circulation are seen as the metallicityis increased. First, the peak speeds of the jet increase;equatorial jet speeds range from ∼ 1.1 km s−1 in the 1×solar case to greater than 1.7 km s−1 in the 50× solarcase. Second, the depth of the high-latitude jets decreasewith increasing metallicity; jets in the solar case extendto pressures of approximately 1 bar, while the jets inhigher metallicity cases extend to only ∼300 mbar. Sim-ilar trends are seen in circulation models of hot NeptuneGJ 436b (Lewis et al. 2010). The trends in circulationare a result of enhanced opacity associated with highermetallicities, which leads to shallower heating in the at-mosphere (Fortney et al. 2008, Dobbs-Dixon & Lin 2008,Showman et al. 2009, Lewis et al. 2010).
This enhanced opacity with higher metallicity leads todifferences in the planet’s horizontal and vertical tem-perature structure. In our models, the temperaturedifference from dayside to nightside varies with heightthroughout observable regions of the atmosphere for allthree metallicities. However, at a given pressure, thisday-night temperature difference is greater for highermetallicities. We compare the temperature variationsas a function of pressure in Figures 3 and 4. Figure3 plots the wind and temperature profiles for each at-mospheric metallicity at three pressure levels: 1 mbar,30 mbar, and 1 bar, which approximately bracket therange of pressures over which infrared photons escapeto space (Figure 3). Indeed, at the shallowest pressure,1 mbar, the 50× solar model exhibits the highest day-night temperature variations. At 30 mbar, day-nighttemperature differences are small, but the 50× solar casenevertheless exhibits the largest temperature variationfrom equator to pole. At 1 bar, only the 1× solar caseexhibits significant temperature variation, as stellar en-ergy is deposited deeper at low metallicity. These trendsare illustrated further in Figure 4, which plots the max-
1 The zonal wind is defined as the east-west wind, where posi-tive (negative) values denote an eastward (westward) wind; a zonalmean denotes an average in longitude. All zonal means are aver-aged in longitude along surfaces of constant pressure.

4 Kataria et al.
−80 −60 −40 −20 0 20 40 60 80
10−3
10−2
10−1
100
101
102
latitude (°)
pres
sure
(bar
)1x solar
−100
−100
0 0 0 0
0 00
0
0
0
0
0
0
0
00000
0
0
100 100
100200 200
200
300
300300
300400
400
400
500
500
500600
600
600700
700
700800
800
800
900
900
900
1000
500 500 500
1000
1000
1000
1500 15001500
2000 2000 20002500 2500 25003000 3000 30003500 3500 35004000 4000 40004500 4500 45005000 5000 50005500 5500
55006000 6000
(m s−1)
0
200
400
600
800
1000
1200
1400
1600
−80 −60 −40 −20 0 20 40 60 80
10−3
10−2
10−1
100
101
102
latitude (°)
pres
sure
(bar
)
30x solar
−100
−100
0 0 0
000 0
0
0
0
0
0
0
0
0
0
000 0
000
0
0
0 0
0
00
0
0
100
100
100200
200 200300
300300
400
400400
500500
500
600
600600
600
700800900100011001200
13001400
500 500 500
1000 1000 1000
1500
1500
1500
20002000
2000
25002500
25003000
30003000
35003500 3500
4000 4000 40004500 4500 45005000 5000 50005500 5500 55006000 6000 6000
(m s−1)
0
200
400
600
800
1000
1200
1400
1600
−80 −60 −40 −20 0 20 40 60 80
10−3
10−2
10−1
100
101
102
latitude (°)
pres
sure
(bar
)
50x solar
−100
−100
0
0 0 0 000
0
00
0
0
0
0
0
0
0
00
0
0
0
0
00
00
00
100
100
100200
200200
300
300
300
400
400400
500
500500
600
600
600
600
700
700
700
80090010001100120013001400
500 500 500
1000 1000 1000
1500
1500
1500
20002000
2000
25002500
25003000
30003000
35003500 3500
4000 4000 40004500 4500 45005000 5000 50005500 5500 55006000 6000 6000
(m s−1)
0
200
400
600
800
1000
1200
1400
1600
Figure 2. Zonal-mean zonal wind for H2-dominated compositions of GJ 1214b. The plots correspond to atmospheric compositions of 1×,30×, and 50× solar. Zonal-mean isentropes (potential temperature contours) are overplotted in red in intervals of 500 K. Note the windsare plotted on the same colorscale.
imum dayside-nightside temperature difference at eachpressure level for each atmospheric composition. Thisis calculated at each pressure level by first latitudinally-weighting the temperature at each longitudinal slice. Wethen determine whether each slice is on the dayside ornightside, then subtract the minimum (weighted) tem-perature on the nightside from the maximum (weighted)temperature on the dayside to determine the maximumdayside-nightside temperature difference. As shown inFigure 4, above photospheric pressures (less than ∼10mbar), the day-night temperature variation at each pres-sure increases with increasing metallicity. Given the ex-pectation that the day-night heating drives the equato-rial superrotation (Showman & Polvani 2011; Kataria etal. 2013), this would imply stronger superrotation withincreasing metallicity, qualitatively explaining the trendseen in Figure 2. At pressures greater than 10 mbar,where radiative time constants are longer, the tempera-ture varies in longitude by less than ∼25 K. These trendsin temperature and wind structure will affect resultantsynthetic lightcurves and spectra (see Section 5).
3.2. Water and Carbon-dioxide atmosphericcompositions
A comparison of high-MMW atmospheric composi-tions yield major differences in the dynamical and tem-perature regimes of GJ 1214b. If the atmosphere is H2O-dominated (Figure 5, top row), the atmosphere still pos-sesses an equatorial superrotating jet, with peak speedsof ∼ 900 m s−1, and high-latitude jets with speeds ex-ceeding 500 m s−1. For a CO2-dominated atmosphere,however, equatorial superrotation is much weaker; in-stead, the dynamics are dominated by high-latitude jets,with peak speeds exceeding 500 m s−1 (Figure 5, bottomrow). The 50% CO2, 50% H2O case, as expected, ex-hibits an intermediate behavior, whereby the atmosphereis dominated by broad, high-latitude jets and moderateequatorial superrotation (Figure 5, middle row). How-ever, all three cases have higher equator-to-pole and day-night temperature variations at photospheric pressures(∼10 mbar) than the low-MMW models. These >100K variations extend as deep as 100 mbar, an order ofmagnitude greater than the low-MMW cases (Figure 4).
The changes in dynamical and temperature regimesbetween low- and high-MMW atmospheres and between

Atmospheric circulation of GJ 1214b 5
−150 −100 −50 0 50 100 150−80
−60
−40
−20
0
20
40
60
80
longitude (°)
latit
ude
(°)
1x solar, 1.09 mbar
(K)350
400
450
500
550
600
650
−150 −100 −50 0 50 100 150−80
−60
−40
−20
0
20
40
60
80
longitude (°)
latit
ude
(°)
30x solar, 1.09 mbar
(K)350
400
450
500
550
600
650
−150 −100 −50 0 50 100 150−80
−60
−40
−20
0
20
40
60
80
longitude (°)
latit
ude
(°)
50x solar, 1.09 mbar
(K)350
400
450
500
550
600
650
−150 −100 −50 0 50 100 150
−80
−60
−40
−20
0
20
40
60
80
longitude (°)
lati
tud
e (
°)
1x solar, 29.01 mbar
(K)450
500
550
600
650
−150 −100 −50 0 50 100 150
−80
−60
−40
−20
0
20
40
60
80
longitude (°)
lati
tud
e (
°)
30x solar, 29.01 mbar
(K)450
500
550
600
650
−150 −100 −50 0 50 100 150−80
−60
−40
−20
0
20
40
60
80
longitude (°)
latit
ude
(°)
50x solar, 29.01 mbar
(K)450
500
550
600
650
−150 −100 −50 0 50 100 150−80
−60
−40
−20
0
20
40
60
80
longitude (°)
latit
ude
(°)
1x solar, 1.11 bar
(K)
850
900
950
1000
1050
1100
−150 −100 −50 0 50 100 150−80
−60
−40
−20
0
20
40
60
80
longitude (°)
latit
ude
(°)
30x solar, 1.11 bar
(K)
850
900
950
1000
1050
1100
−150 −100 −50 0 50 100 150−80
−60
−40
−20
0
20
40
60
80
longitude (°)
latit
ude
(°)
50x solar, 1.11 bar
(K)
850
900
950
1000
1050
1100
Figure 3. Wind and temperature at approximately 1 mbar (top row), 30 mbar (middle row) and 1 bar (bottom row) for H2-dominatedcompositions of GJ 1214b. Each column corresponds to atmospheric compositions of (from left to right) 1×, 30×, and 50× solar. Theblack line denotes the substellar longitude. Each row is plotted on the same colorscale.
0 100 200 300 400 500
10−4
10−3
10−2
10−1
100
101
102
103
Maximum dayside−nightside temperature difference (K)
Pres
sure
(bar
s)
1x solar30x solar50x solarH2O−dominated
50% H2O, 50% CO2
CO2−dominated
Figure 4. Maximum day-night temperature difference as a func-tion of pressure for all modeled atmospheric compositions of GJ1214b. This was calculated by first computing a weighted-averageof temperature as a function of longitude, then differencing themaximum and minimum temperatures on the dayside and night-side, respectively.
water- and CO2-dominated atmospheres can be at-tributed to differences in the vertical opacity structureand hence heating budget. For a CO2-dominated at-mosphere, the atmosphere is more transparent to visibleradiation. Hence, the stellar energy is deposited deeper
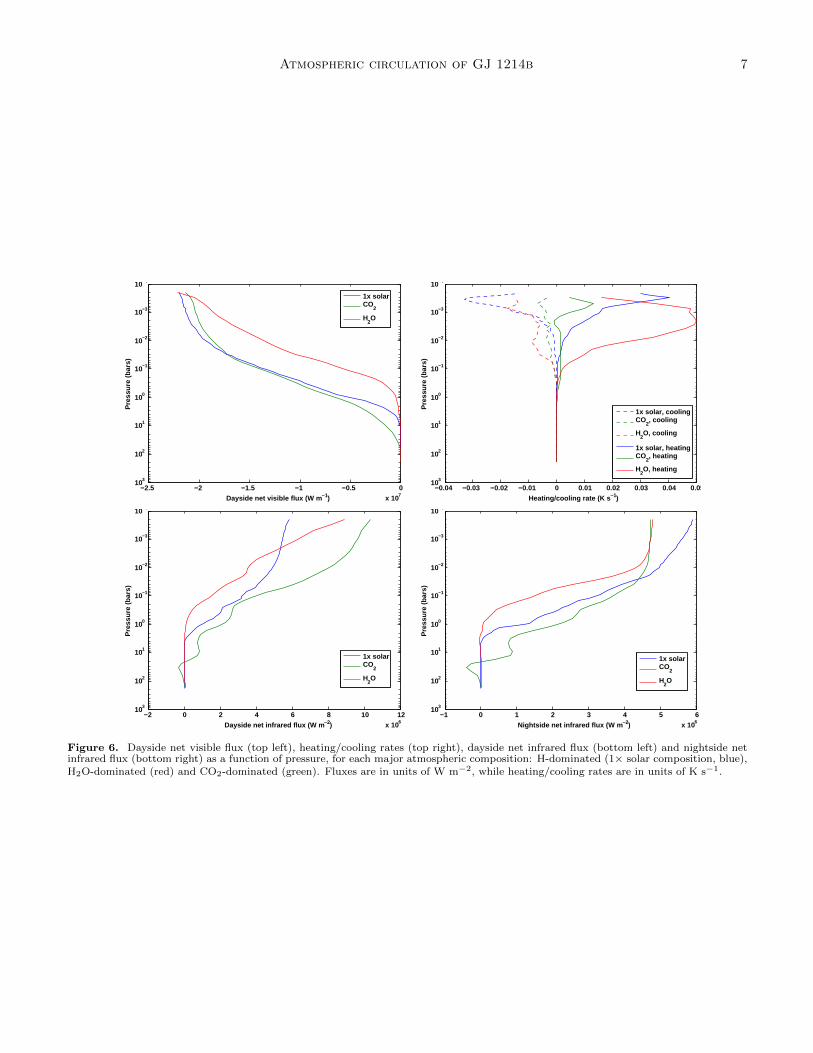
in the atmosphere as compared to hydrogen- and water-dominated atmospheres. The qualitative picture can befurther confirmed by plotting the heating/cooling ratesand visible and IR fluxes on the dayside and nightside(Figure 6). The top left panel shows the dayside net vis-ible flux, which has a net downward direction. The watercase absorbs the incoming stellar energy much higher inthe atmosphere as compared to the solar and CO2 cases,which corresponds to a much larger specific heating rateat the top of the atmosphere where the atmospheric massis much less (top right panel). Note also that the heat-ing and cooling rates are smallest for the CO2-dominatedcase, helping to explain the weak superrotation. Thelarge variation in visible flux with height for the water-dominated case leads to a large specific heating rate atlow pressures, where the atmospheric mass is less. Thebottom two panels plot the net IR flux at the substellarand antistellar points, respectively. They show that thewater-dominated case also emits flux at lower pressurescompared to the other two compositions. Overall, theplots show that the CO2-dominated case absorbs energydeepest, and the water-dominated case highest.
Based on the results presented in Showman & Polvani(2011), one would expect that the 1× solar case, whichhas the strongest superrotation, should absorb visibleflux at lower pressures compared to the other two com-positions, where day-night temperature variations and

6 Kataria et al.
−80 −60 −40 −20 0 20 40 60 80
10−3
10−2
10−1
100
101
102
latitude (°)
pres
sure
(bar
)
H2O−dominated
0 0
00
0
0
0
0 0
0
0 0
0
0
100 100 100
200
200
200300
300
300
400
400
400
500
500
500
600700
800
500 500 500
750750
750
1000
1000
10001250
1250
12501500
1500
15001750
1750
175020002000
20002250 225022502500 250025002750 2750
27503000 3000
(m s−1)−100
0
100
200
300
400
500
600
700
800
−150 −100 −50 0 50 100 150−80
−60
−40
−20
0
20
40
60
80
longitude (°)
latit
ude
(°)
H2O−dominated, 29.16 mbar
(K)300
350
400
450
500
550
600
650
700
−80 −60 −40 −20 0 20 40 60 80
10−3
10−2
10−1
100
101
102
latitude (°)
pres
sure
(bar
)
50% H2O, 50% CO2
00
0
0
0
00
0 0
0 0
00
0
0
0
0 0
00
00100 100
100100
100
200
200
200
200
200
300
300
300
400
400
500500
750
750
7501000
1000
10001250 1250
12501500 1500
15001750 1750
17502000 200020002250 2250
(m s−1)−100
0
100
200
300
400
500
600
700
800
−150 −100 −50 0 50 100 150−80
−60
−40
−20
0
20
40
60
80
longitude (°)
latit
ude
(°)50% H2O, 50% CO2, 29.16 mbar
(K)300
350
400
450
500
550
600
650
700
−80 −60 −40 −20 0 20 40 60 80
10−3
10−2
10−1
100
101
102
latitude (°)
pres
sure
(bar
)
CO2−dominated
−200
−200
−100
−100
0
00
0 00
00
0
0
0
0
0
0100
100
100
100
00
100100 10 10
010
0
200
200200
200
200
200
300
300
300
300
400
400
500
500600
25
250
250
250 250 25
0
250
500
500 500
500
750 750
750
1000
1000
1000
1250
1250
12501500
1500
1500 1750 1750
(m s−1)−100
0
100
200
300
400
500
600
700
800
−150 −100 −50 0 50 100 150−80
−60
−40
−20
0
20
40
60
80
longitude (°)
latit
ude
(°)
CO2−dominated, 29.16 mbar
(K)300
350
400
450
500
550
600
650
700
Figure 5. Zonal-mean zonal wind (left column) and wind and temperature at 30 mbar (right column) for high MMW atmosphericcompositions of GJ 1214b. Each pair of plots correspond to atmospheric compositions of (from top to bottom) 99% H2O, 1% CO2; 50%H2O, 50% CO2; and 99% CO2, 1% H2O. Zonal-mean isentropes are overplotted in red in intervals of 250 K. The panels in each columnare shown with the same colorscale.
Atmospheric circulation of GJ 1214b 7
−2.5 −2 −1.5 −1 −0.5 0x 107
10−4
10−3
10−2
10−1
100
101
102
103
Dayside net visible flux (W m −1)
Pre
ssur
e (b
ars)
1x solarCO
2
H2O
−0.04 −0.03 −0.02 −0.01 0 0.01 0.02 0.03 0.04 0.05
10−4
10−3
10−2
10−1
100
101
102
103
Heating/cooling rate (K s −1)
Pre
ssur
e (b
ars)
1x solar, coolingCO
2, cooling
H2O, cooling
1x solar, heatingCO
2, heating
H2O, heating
−2 0 2 4 6 8 10 12x 106
10−4
10−3
10−2
10−1
100
101
102
103
Dayside net infrared flux (W m −2)
Pre
ssur
e (b
ars)
1x solarCO
2
H2O
−1 0 1 2 3 4 5 6x 10⁶
10−4
10−3
10−2
10−1
100
101
102
103
Nightside net infrared flux (W m −2)
Pre
ssur
e (b
ars)
1x solarCO
2
H2O
Figure 6. Dayside net visible flux (top left), heating/cooling rates (top right), dayside net infrared flux (bottom left) and nightside netinfrared flux (bottom right) as a function of pressure, for each major atmospheric composition: H-dominated (1× solar composition, blue),H2O-dominated (red) and CO2-dominated (green). Fluxes are in units of W m−2, while heating/cooling rates are in units of K s−1.

8 Kataria et al.
100 101 10210−10
10−5
100
105
1010
Wavelength (µm)
o
Figure 7. Optical depth as a function of wavelength for pure-water (blue), pure-CO2 (green), and pressure-induced absorption(PIA) due to CO2-CO2 collisions (red). The dotted grey linesdenote the boundaries of the 11 spectral bins used in the correlated-k calculation. Note that the CO2-CO2 PIA is only prominent inthe longest wavelength (shortest wavenumber) bin.
forcing are largest. However, as described above, thewater-dominated case has the shallowest flux deposi-tion. This suggests that the differences in specific heat(and therefore scale height) might also play a role inthe differences in energy budget and dynamical regimes.To test this hypothesis, we ran two models, the firstwith 1× solar atmospheric opacities but a specific heat,mean-molecular weight, and scale height set to the CO2-dominated value, and a second model which has the re-verse (CO2-dominated atmospheric opacities, 1× solarspecific heat, MMW and scale height). The 1× solaropacity case does show flow features similar to that ofthe CO2-dominated case in Figure 5, with high latitudejets and weak superrotation at the equator. A detailedanalysis of these differences, specifically for the CO2-dominated case, will be a task for future studies.
4. COMPARISON TO OTHER CIRCULATION MODELS OFGJ 1214B
We can compare our results to the other circulationmodels of GJ 1214b, particularly Menou (2012), whichmodels three of the atmospheric compositions includedin this paper (water-dominated, 1× and 30× solar),though with a different circulation model (the Inter-mediate General Circulation Model), radiative transferscheme (double-grey), and model setup. In comparingthe hydrogen-dominated models (see Figure 2 in Menou2012), one can see broad agreement, with equatorial su-perrotation in the 1-2 km s−1 range, and high-latitudeeastward winds. However, the jet structure is different–the equatorial jets in Menou (2012) extend to deeperpressures than our models. These differences could stemfrom differences in radiative transfer scheme, but alsodifferences in bottom boundary (10 bars vs. 100 bars inour model).
In comparing water-dominated circulation models ofGJ 1214b, we can also include results from Zalucha etal. (2013), who use a different setup of the MITgcmcoupled to a Newtonian relaxation scheme, including asurface at varying pressures. In all three models thereis again broad agreement, with an eastward equatorialjet with a width of approximately 50-60 degrees. How-ever, the models again differ in jet speeds and structure.
Equatorial wind speeds are greatest in Menou (2012),and Zalucha et al. (2013) model the weakest. Further-more, both Menou (2012) and our results include east-ward winds at high latitudes, while Zalucha et al. haswestward winds at the same latitudes. These differencesare most likely due to differences in the bottom boundaryand radiative heating schemes.
5. INCLUDING EFFECTS DUE TO CO2-CO2 PIA
While we already include opacity effects due topressure-induced absorption (PIA) from H2-H2 and H2-He collisions (see Kataria et al. 2013), here we testthe importance of including opacity effects due to PIAfrom CO2-CO2 collisions. Figure 7 compares the opticaldepth, τ , of this opacity source with the optical depthsfor a pure water and pure CO2 atmosphere. This op-tical depth is calculated as a product of the number ofmolecules per cm−2, N , and the absorption coefficients,K. The value of N is defined as nH, where n is the num-ber density (in units of m−3) and H is the scale height.This can be further simplified using the ideal gas law asN = P/mg. Here we calculate the optical depths foreach composition in each wavelength interval at a tem-perature of 725 K and a pressure of 1 bar (106 cgs).
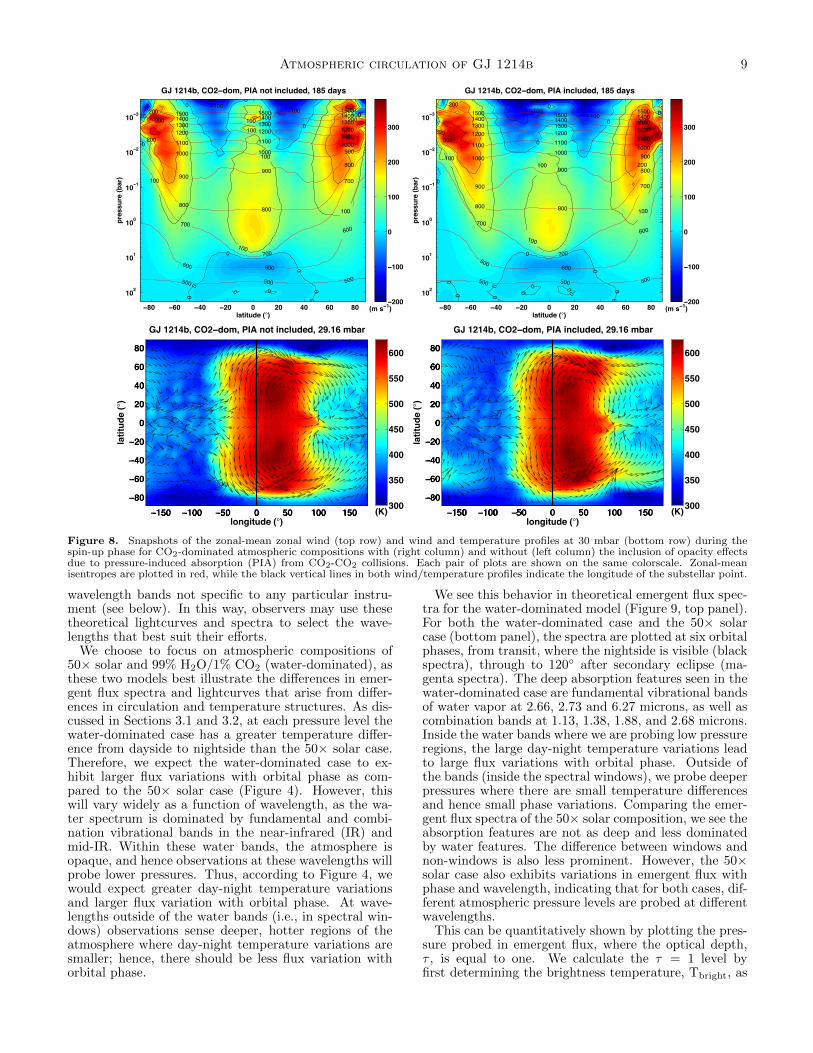
As shown in Figure 7, the CO2-CO2 PIA is most im-portant in the longest wavelength (shortest wavenum-ber) frequency bin (denoted by grey dotted lines). Onlya small fraction of the planet’s flux is emitted in thiswavelength range, and therefore we expect that the in-clusion of CO2-CO2 PIA should not significantly affectthe dynamical structure. Figure 8 compares the tran-sient spin-up phase of two CO2-dominated runs with(right column) and without (left column) the inclusionof CO2-CO2 PIA in zonal-mean zonal wind (top row)and wind/temperature profiles at 30 mbar (bottom row).There are minor differences between both cases; the west-ward flow at the top of the atmosphere extends to deeperpressures at the equator when PIA is included, and thePIA case exhibits a slightly different flow pattern at ∼30mbar. However, the bulk features remain the same: thespeeds and horizontal/vertical extent of the high lati-tude jets, and the temperature and shape of the hottestregions on the dayside do not differ significantly. There-fore, while it is important to include this opacity source,it does not dramatically change the dynamical and ther-mal structure of the atmosphere.
6. SIMULATED LIGHTCURVES AND SPECTRA
Using the outputs from our model integrations, we cangenerate lightcurves and spectra of GJ 1214b for each at-mospheric composition. Most ground- and space-basedobservations of GJ 1214b have been obtained duringtransit, but their flat transmission spectra suggest thepresence of clouds that prevent easy characterization ofthe atmosphere. Therefore, only dayside emergent fluxspectra obtained at secondary eclipse and lightcurves willbe able to constrain the planet’s atmospheric compo-sition. Observations with the Spitzer Space Telescopewere able to detect secondary eclipse (Fraine et al. 2013,Gillon et al. 2013) and future instrumentation on theJames Webb Space Telescope (JWST) and the Thirty-Meter Telescope (TMT) will improve on those observa-tions. In anticipation of these and other future instru-ments, we generate theoretical spectra and lightcurves at
Atmospheric circulation of GJ 1214b 9
−80 −60 −40 −20 0 20 40 60 80
10−3
10−2
10−1
100
101
102
latitude (°)
pres
sure
(bar
)
GJ 1214b, CO2−dom, PIA not included, 185 days
−100
−1000
00
0
0
0
0
0
0
0
0
0
00
100
100
100
100
100
100100
200200
200
200
300
300
500 500 500
600 600
600700
700
700
800800
800
900900
9001000 100010001100 11001100
1200 1200 12001300 1300 13001400 1400 14001500 1500 1500
(m s−1)−200
−100
0
100
200
300
−80 −60 −40 −20 0 20 40 60 80
10−3
10−2
10−1
100
101
102
latitude (°)
pres
sure
(bar
)
GJ 1214b, CO2−dom, PIA included, 185 days
−200−100
−100
00
0
0
0
0
0
0
0
0
0
0
00
0
0
0
100
100
100
100
200
200
200
300
300
500 500 500
600600
600700
700
700
800 800
800
900
900
90010001000
10001100 11001100
1200 1200 12001300 1300 13001400 1400 14001500 1500 1500
(m s−1)−200
−100
0
100
200
300
−150 −100 −50 0 50 100 150−80
−60
−40
−20
0
20
40
60
80
longitude (°)
latit
ude
(°)
GJ 1214b, CO2−dom, PIA not included, 29.16 mbar
(K)300
350
400
450
500
550
600
−150 −100 −50 0 50 100 150−80
−60
−40
−20
0
20
40
60
80
longitude (°)
latit
ude
(°)
GJ 1214b, CO2−dom, PIA included, 29.16 mbar
(K)300
350
400
450
500
550
600
Figure 8. Snapshots of the zonal-mean zonal wind (top row) and wind and temperature profiles at 30 mbar (bottom row) during thespin-up phase for CO2-dominated atmospheric compositions with (right column) and without (left column) the inclusion of opacity effectsdue to pressure-induced absorption (PIA) from CO2-CO2 collisions. Each pair of plots are shown on the same colorscale. Zonal-meanisentropes are plotted in red, while the black vertical lines in both wind/temperature profiles indicate the longitude of the substellar point.
wavelength bands not specific to any particular instru-ment (see below). In this way, observers may use thesetheoretical lightcurves and spectra to select the wave-lengths that best suit their efforts.
We choose to focus on atmospheric compositions of50× solar and 99% H2O/1% CO2 (water-dominated), asthese two models best illustrate the differences in emer-gent flux spectra and lightcurves that arise from differ-ences in circulation and temperature structures. As dis-cussed in Sections 3.1 and 3.2, at each pressure level thewater-dominated case has a greater temperature differ-ence from dayside to nightside than the 50× solar case.Therefore, we expect the water-dominated case to ex-hibit larger flux variations with orbital phase as com-pared to the 50× solar case (Figure 4). However, thiswill vary widely as a function of wavelength, as the wa-ter spectrum is dominated by fundamental and combi-nation vibrational bands in the near-infrared (IR) andmid-IR. Within these water bands, the atmosphere isopaque, and hence observations at these wavelengths willprobe lower pressures. Thus, according to Figure 4, wewould expect greater day-night temperature variationsand larger flux variation with orbital phase. At wave-lengths outside of the water bands (i.e., in spectral win-dows) observations sense deeper, hotter regions of theatmosphere where day-night temperature variations aresmaller; hence, there should be less flux variation withorbital phase.
We see this behavior in theoretical emergent flux spec-tra for the water-dominated model (Figure 9, top panel).For both the water-dominated case and the 50× solarcase (bottom panel), the spectra are plotted at six orbitalphases, from transit, where the nightside is visible (blackspectra), through to 120 after secondary eclipse (ma-genta spectra). The deep absorption features seen in thewater-dominated case are fundamental vibrational bandsof water vapor at 2.66, 2.73 and 6.27 microns, as well ascombination bands at 1.13, 1.38, 1.88, and 2.68 microns.Inside the water bands where we are probing low pressureregions, the large day-night temperature variations leadto large flux variations with orbital phase. Outside ofthe bands (inside the spectral windows), we probe deeperpressures where there are small temperature differencesand hence small phase variations. Comparing the emer-gent flux spectra of the 50× solar composition, we see theabsorption features are not as deep and less dominatedby water features. The difference between windows andnon-windows is also less prominent. However, the 50×solar case also exhibits variations in emergent flux withphase and wavelength, indicating that for both cases, dif-ferent atmospheric pressure levels are probed at differentwavelengths.
This can be quantitatively shown by plotting the pres-sure probed in emergent flux, where the optical depth,τ , is equal to one. We calculate the τ = 1 level byfirst determining the brightness temperature, Tbright, as

10 Kataria et al.
a function of wavelength, and finding the pressure levelat which the globally-averaged temperature is equal toTbright. The results are plotted in Figure 10 with acolorscale corresponding to the maximum temperaturevariation at each pressure level from Figure 4. For bothatmospheric compositions, the wavelength regions withsmall (large) phase variations correspond to deeper (shal-lower) pressures, where day-night temperature variationsare smaller (larger).
Lightcurves of each composition further illustrate thedifferences between low- and high-MMW compositions.We plot the planet/star flux ratio as a function orbitalphase for the water- and 50× solar compositions in Fig-ure 11. In each case, an orbital phase of 0.0 correspondsto transit, while an orbital phase of 0.5 corresponds tosecondary eclipse. Six lightcurves are plotted at the gen-eral wavelength bands a−f listed in Table 2 and denotedin Figures 9 and 10. For the water-dominated case, fluxvariations are large in all but one band (band a, blackline). At this band the τ = 1 level corresponds to a pres-sure level of 0.1 bars, where day-night temperature vari-ations are small. All other wavelength bands probe highin the atmosphere, where day-night temperature varia-tions are large (Figure 10). For a 50× solar composition,the flux variations are large for bands a, b, and c whichprobe low-pressure regions where day-night temperaturevariation is high. Bands d, e and f probe deeper pres-sures, and hence exhibit smaller phase variations.
Our results demonstrate that one can break the de-generacy in determining the atmospheric composition ofGJ 1214b by observing the planet in thermal emission.Large phase variations within water absorption bandsand small variations in its spectral windows would indi-cate a water-dominated atmosphere. Other high-MMWspecies that are highly absorbing, such as carbon dioxide,ammonia, or methane, might in principle exhibit theirown characteristic pattern of lightcurve amplitude withwavelength, depending on the wavelengths of their ab-sorption bands and spectral windows. As shown in Fig-ure 9 and 11, a hydrogen-dominated atmosphere shouldexhibit a pattern of lightcurve amplitude with wave-length that differs significantly from that of a high-MMWatmosphere such as one that is water-dominated.
While we present this method in a generalized sense,one should be able to utilize space-based instrumentssuch as the Near-Infrared Spectrograph (NIRSpec)aboard JWST or the Wide Field Camera 3 (WFC3) onHST, although the latter has less spectral coverage andwould require a multitude of orbits to achieve sufficientsignal-to-noise. Instruments on the next generation ofground-based telescopes might also be able to utilize thistechnique, such as the near-infrared spectrometer (GMT-NIRS) on GMT or the Infrared Multi-object Spectrom-eter (IRMS) on TMT. However, full-phase lightcurveswould be difficult to obtain from the ground in a sin-gle observation, and one would have to contend with thewater vapor in Earth’s atmosphere. Therefore, reductionof ground-based observations would be much more diffi-cult. In either case, in order to probe inside and outsidewater bands effectively as the method requires, spectralobservations are necessary. Observations in photomet-ric passbands (i.e., broadband observations like those onthe Spitzer Space Telescope) might be able to apply thismethod, but would smear out these spectral features.
Figure 9. Emergent flux density (in units of ergs−1cm−2Hz−1)for water-dominated (top panel) and 50× solar (bottom panel)compositions at six orbital phases: transit, when nightside is visible(black line); 60 after transit (red line); 120 after transit (green);secondary eclipse, when the dayside is visible (dark blue); 60 aftersecondary eclipse (light blue); and 120 after secondary eclipse(magenta). These phases are illustrated in the inset figure, shownin the bottom right of each panel. Black horizontal lines indicatethe wavelength bands chosen for lightcurves plotted in Figure 11,from band a to band f .
These results are particularly favorable because theywould generally be independent of the the presence ofclouds, minor equilibrium condensates or photochemi-cal haze. In transit, slant optical depths through theplanet’s terminator can be dozens of times larger thanvertical optical depths (Fortney 2005), which can sup-press absorption features. In emission, however, pathsare closer to vertical, suggesting that it is much easierfor hazes to flatten the transmission spectrum than theemission spectrum. Still, if the clouds or hazes are suf-ficiently thick, they would absorb and scatter the emer-gent flux which could in turn suppress emission featuresand flux phase variations. Given recent Kreidberg et al.(2014) results that GJ 1214b likely has clouds or hazes,future work will include exploring how clouds with vary-ing compositions and particle sizes as well as photochem-ical hazes can affect the phase variations presented here.
7. CONCLUSIONS
We present three-dimensional atmospheric circulationmodels of the super-Earth GJ 1214b, exploring changesin circulation as a function of metallicity and compo-sition. For hydrogen-dominated atmospheres, atmo-

Atmospheric circulation of GJ 1214b 11
Figure 10. τ = 1 pressure level as a function of wavelength forthe water-dominated (top) and 50× solar (bottom) cases. Thecolorscale corresponds to the maximum temperature variation fromdayside to nightside, as plotted in Figure 4. Black horizontal linesindicate the wavelength bands chosen for lightcurves plotted inFigure 11, from band a to band f .
Table 2Wavelength bands shown in Figures 9, 10 and 11 in units of
microns.
Wavelength band Left bound (µm) Right bound (µm)
a 2.2 2.45b 2.5 2.9c 3.2 3.5d 4.25 4.4e 5.5 7.0f 14.0 16.0
spheric opacities are enhanced with increasing metallic-ity, leading to shallower atmospheric heating. This yieldsstrong dayside-nightside heating/forcing that increaseswith metallicity, which in turn produces the highest day-night temperature variations and hence the strongestequatorial superrotation in the 50× solar model.
The water-dominated composition also exhibits super-rotation at the equator and eastward jets at high lati-tudes, but the circulation of the CO2-dominated modelis dominated mainly by high-latitude jets. All three high-
Figure 11. Lightcurves plotted as a function of orbital phase forwater-dominated (top) and 50× solar (bottom) atmospheric com-positions. Transit occurs at an orbital phase of 0.0, while secondaryeclipse occurs at a orbital phase of 0.5. Each pair of lightcurvescorrespond to the wavelength bands shown in Figure 9: from bot-tom to top, bands a (2.2-2.45 µm, black), b (2.5-2.9 µm, red), c(3.2-3.5 µm, green), d (4.25-4.4 µm, dark blue), e (5.5-7.0 µm, lightblue), and f (14.0-16.0 µm, magenta). Note the lightcurves have abell-shape because they are plotted on a log scale.
MMW models have higher horizontal temperature varia-tions at a given (low) pressure than the low-MMW mod-els. These differences in temperature structure and cir-culation can be attributed to differences in opacity struc-ture and scale height.
The theoretical dayside lightcurves and spectra pre-sented here lead to a major prediction for how to breakthe current observational degeneracy in the compositionof GJ 1214b’s atmosphere. In particular, the water bandsdominate the spectra of the 99% H2O, 1% CO2 case.Within water absorption bands, large day-night temper-ature variations lead to large flux variations with phase.Outside of the water bands (within atmospheric win-dows), these phase variations are small. In comparison,a 50× solar atmosphere generally yields small phase vari-ations at those wavelength bands and large phase varia-tions at other characteristic bandpasses. Therefore, ob-serving in emission would break the degeneracy to deter-mining the atmospheric composition of GJ 1214b. Onecould potentially constrain the existence of water or otherhighly-absorbing species by selecting wavelength bandsinside and outside of their atmospheric windows, andcomparing the extent of phase variations with that ofa low-MMW atmosphere. This diagnostic is much less

12 Kataria et al.
sensitive than transit spectra to clouds, condensates andhazes. However, sufficiently thick clouds and hazes wouldabsorb and scatter emergent flux, therefore diminishingemission features and flux variations with orbital phase.
This work was supported by Origins grantNNX12AI79G to APS. T.K. also acknowledges supportfrom the Harriet P. Jenkins Pre-Doctoral FellowshipProgram (JPFP). Resources supporting this work wereprovided by the NASA High-End Computing (HEC)Program through the NASA Advanced Supercomputing(NAS) Division at Ames Research Center. We thankRoxana Lupu for comments and for providing opacitytables for CO2-CO2 pressure-induced absorption. Wealso thank Daniel Apai, Nikole Lewis, Robert Zellem forinsightful discussions. Lastly, we thank the anonymousreferee for their helpful comments and suggestions.
REFERENCES
Adcroft, A., Campin, J.-M., Hill, C., & Marshall, J. 2004,Monthly Weather Review, 132, 2845
Bean, J. L., Kempton, E. M.-R., & Homeier, D. 2010, Nature,468, 669
Bean, J. L., Desert, J.-M., Kabath, P., et al. 2011, ApJ, 743, 92Berta, Z. K., Charbonneau, D., Desert, J.-M., et al. 2012, ApJ,
747, 35Charbonneau, D., et al. 2009, Nature, 462, 891Cooper, C. S., & Showman, A. P. 2006, ApJ, 649, 1048Croll, B., Albert, L., Jayawardhana, R., et al. 2011, ApJ, 736, 78Crossfield, I. J. M., Barman, T., & Hansen, B. M. S. 2011, ApJ,
736, 132de Mooij, E. J. W., Brogi, M., de Kok, R. J., et al. 2012, A&A,
538, A46Fortney, J. J. 2005, MNRAS, 364, 649Fortney, J. J., Marley, M. S., Lodders, K., Saumon, D., &
Freedman, R. 2005, ApJ, 627, L69Fortney, J. J., Cooper, C. S., Showman, A. P., Marley, M. S., &
Freedman, R. S. 2006, ApJ, 652, 746
Fortney, J. J., Lodders, K., Marley, M. S., & Freedman, R. S.2008, ApJ, 678, 1419
Fraine, J. D., Deming, D., Gillon, M., et al. 2013, ApJ, 765, 127Gillon, M., Demory, B.-O., Madhusudhan, N. Deming, D., et al.
2013, arXiv:1307.6722Goody, R., West, R., Chen, L., & Crisp, D. 1989,
J. Quant. Spec. Radiat. Transf., 42, 539Kataria, T., Showman, A. P., Lewis, N. K., et al. 2013, ApJ, 767,
76Knutson, H. A., et al. 2007, Nature, 447, 183Kreidberg, L., Bean, J. L., Desert, J.-M., et al. 2014, Nature, 505,
69Lewis, N. K., Showman, A. P., Fortney, J. J., Marley, M. S.,
Freedman, R. S., & Lodders, K. 2010, ApJ, 720, 344Liu, B., & Showman, A. P. 2013, ApJ, 770, 42Marley, M. S., & McKay, C. P. 1999, Icarus, 138, 268Miller-Ricci, E., Seager, S., & Sasselov, D. 2009, ApJ, 690, 1056Menou, K. 2012, ApJ, 744, L16Miller-Ricci, E., & Fortney, J. J. 2010, ApJ, 716, L74Miller-Ricci Kempton, E., Zahnle, K., & Fortney, J. J. 2012, ApJ,
745, 3Narita, N., Nagayama, T., Suenaga, T., et al. 2013, PASJ, 65, 27Nettelmann, N., Fortney, J. J., Kramm, U., & Redmer, R. 2011,
ApJ, 733, 2Parmentier, V., Showman, A. P., & Lian, Y. 2013, A&A, 558, A91Redfield, S., Endl, M., Cochran, W. D., & Koesterke, L. 2008,
ApJ, 673, L87Rogers, L. A., & Seager, S. 2010, ApJ, 716, 1208Showman, A. P., Fortney, J. J., Lian, Y., Marley, M. S.,
Freedman, R. S., Knutson, H. A., & Charbonneau, D. 2009,ApJ, 699, 564
Showman, A. P., Fortney, J. J., Lewis, N. K., & Shabram, M.2013, ApJ, 762, 24
Showman, A. P., & Polvani, L. M. 2011, ApJ, 738, 71
Teske, J. K., Turner, J. D., Mueller, M., & Griffith, C. A. 2013,MNRAS, 920
Valencia, D., Guillot, T., Parmentier, V., Freedman, R. S. 2013,ApJ, 775, 10
Zalucha, A. M., Michaels, T. I., & Madhusudhan, N. 2013, Icarus,226, 1743