atbd-ast-08 algorithm theoretical basis document for
TRANSCRIPT

1
ATBD-AST-08ALGORITHM THEORETICAL BASIS DOCUMENT
FOR
ASTER DIGITAL ELEVATION MODELS(STANDARD PRODUCT AST14)
VERSION 3.0
REVISED 5 FEBRUARY 1999
HAROLD R. LANG, JPLROY WELCH, UNIVERSITY OF GEORGIA

2
TABLE OF CONTENTS Page
ACKNOWLEDGEMENTS ...........................................................................................................4
1.0 INTRODUCTION....................................................................................................................4
2.0 OBJECTIVE AND BACKGROUND....................................................................................52.1 Experimental Objective...........................................................................................122.2 Historical Perspective..............................................................................................122.3 Instrument Characteristics .......................................................................................15
3.0 ALGORITHM DESCRIPTION AND IMPLEMENTATION ............................................153.1 Accuracy, Precision and Resolution: Error Estimates........................................223.2 Practical Considerations.........................................................................................25
3.2.1 Numerical Computation Considerations ..................................................303.2.2 Calibration and Validation..........................................................................323.2.3 Quality: Assessment, Control and Diagnostics......................................323.2.4 Exceptional Handling..................................................................................32
4.0 CONSTRAINTS, LIMITATIONS, ASSUMPTIONS......................................................34
5.0 BIBLIOGRAPHY.................................................................................................................36
LIST OF APPENDICES
6-1 MEMBERSHIP AND CHARTER OF THE ASTER DIGITAL ELEVATION MODELWORKING GROUP 42
6-2 AUTOMATIC STEREO CORRELATION ALGORITHM FOR GENERATING DEMSFROM DIGITAL STEREO DATA THAT WAS CONSIDERED FOR THESTEREOSAT MISSION 43
6-3 WHITE PAPER ON DEM PRODUCTION OPTIONS 466-4 WHITE PAPER ON GCPS 576-5 UNITED STATES NATIONAL MAP ACCURACY STANDARDS 656-6 DEFINITION OF ROOT MEAN SQUARE ERROR WITH RESPECT TO
CARTOGRAPHY 676-7 ASPRS ACCURACY STANDARDS FOR LARGE-SCALE MAPS 68

3
LIST OF FIGURES
1.0-1 DIAGRAM OF ASTER PRODUCT INTERDEPENDENCIES 61.0-2 ASTER ALONG-TRACK STEREO GEOMETRY 72.0-1 ACCUMULATED PERCENTAGES OF CLOUD-FREE ACQUISITION 92.0-2 INADEQUATELY MAPPED REGIONS 102.0-3 GEOMETRIC PRINCIPLE/ALGORITHM 133.0-1 IMPLEMENTATION SCHEDULE 163.0-2 DEM GENERATION PROCESS 173.1-1 HISTOGRAM OF ELEVATION ERRORS, SIMULATED ASTER DEM 243.1-2 RELATIONSHIP BETWEEN PLANIMETRY AND HEIGHTING 263.1-3 VERTICAL DATUMS 273.2-1 GROUND CONTROL POINT (GCP) DISTRIBUTIONS 31
LIST OF TABLES
2.0-1 SPECIFICATIONS OF AVAILABLE DEMS 112.0-2 SPECIFICATIONS OF DEMS FROM SPACE-ACQUIRED DATA 143.0-1 SPECIFICATIONS FOR STANDARD ASTER DEM PRODUCTS 193.1-1 CELL SIZE VERSUS SLOPE ERROR 283.1-2 RMSE VERSUS MAP SCALE 293.2-1 VALIDATION SITES 333.2-2 QA AND METADATA 35

4
ACKNOWLEDGMENTS
This document is based on information and ideas developed by members of theASTER Digital Elevation Model Working Group (ADEMWG) (Appendix 6-1). Work bythe JPL ASTER Project Office, particularly that of Bob Hekl and Ron Cohen in the areaof mission planning, has made this document possible. Geometric analysis of theASTER stereo system by Kohei Arai, Saga University, Japan, provided essentialinformation. USGS personnel at the Land DAAC, especially Bryan Bailey and GlennKelly, provided important operational input. Craig Leff and Nancy King, JPL, helpedcreate the electronic version of this document that is on the EOS Project ScienceOffice and ASTER home pages.
Earlier versions of this document were released 28 February 1994, 3 April1995, and 16 August 1996 (Version 2.0, JPL D13751). These earlier versions werereviewed by EOS project panels chaired by Berrien Moore on 16 May 1994, and 10December 1996. A SWAMP (Science Working Group AM Platform) panel chaired byJohn Miller reviewed the 3 April 1995 version on 16 May 1996. Constructive reviewsof early drafts of this document by Hiroshi Murakami, Acting ADEMWG Co-Chair, andMike Abrams, ASTER Team Associate, were helpful. Dean Gesch and Jim Conelprovided written reviews as part of the EOS ATBD review process; their valuablesuggestions have been incorporated. Written reviews by J. P. Muller and ananonymous reviewer also provided input. This, the fourth revision, incorporatescorrections and additions based on all of these reviews as well as information fromannual ADEMWG meetings.
The research described in this document was carried out in part at the JetPropulsion Laboratory, California Institute of Technology, under contract with theNational Aeronautics and Space Administration, and at the University of Georgiaunder contract with JPL. Reference herein to any specific commercial product, proc-ess or service by trade name, trademark, manufacturer, or otherwise does not consti-tute or imply endorsement by the United States Government or the Jet PropulsionLaboratory, California Institute of Technology.
1.0 Introduction
This document fulfills the EOS Project requirement as the Algorithm TheoreticalBasis Document (ATBD) for the ASTER Digital Elevation Model (DEM) standard dataproduct AST14. Not discussed here are plans for producing special data productDEMs at the Product Generation System facility in Japan, which are described inWelch et al. (1998) and documented in DWG (1997).
The outline and format of this ATBD were specified by the EOS Project ScienceOffice. An electronic version of this document is available at: http://eospso.gsfc.nasa.gov. This document also serves as the ASTER Standard Product DEM Users Guide, adocument that is being developed by the ADEMWG to serve as a basic reference forthose interested in using ASTER stereo data and Standard Product DEMs. The UsersGuide will be modified as is appropriate over the course of the EOS Project; a revisedversion will be reviewed by the ADEMWG during joint meetings of the ASTER ScienceTeam. Information contained in this document was incorporated in a Request for

5
Proposals (RFP) released in February 1997 by the Land DAAC (USGS), for selectinga commercial system for deriving Standard Product DEMs from ASTER stereo data.
The Advanced Spaceborne Thermal Emission and Reflection Radiometer(ASTER) is a high-spatial-resolution multispectral imager currently scheduled forlaunch into Earth orbit in mid-1999, on the first platform of NASAÕs Earth ObservingSystem (EOS AM1). Overviews of the entire ASTER system and ASTER experimentgoals are provided by Kahle et al. (1991), Tsu et al. (1996), Yamaguchi et al. (1993),and Yamaguchi et al. (1998). Figure 1.0-1 illustrates how ASTER DEMs fit into theoverall scheme of ASTER standard product generation.
A six year ASTER mission is planned. ASTER has an 8 minute/orbit duty cycle.The ASTER stereoscopic subsystem consists of nadir and rear-viewing telescopesoperating in the visible-near infrared wavelengths. This subsystem, configured to pro-vide a base-to-height ratio of 0.6, will acquire along-track, digital stereo data at 15 mresolution over a 60 km ground swath (Figure 1.0-2). Thus, ASTER incorporates capa-bilities for digital photogrammetry first proposed for the Stereosat (NASA, 1979) andMapsat (Itek, 1981) mission concepts of the late 1970s.
This document describes the algorithm/process that will be used to producestandard product DEMs from along-track ASTER stereo data. These DEMs will beproduced, after launch of the EOS AM platform, when ASTER Level 1 input data areavailable. Commercial off-the-shelf software, the PCI OrthoEngine, will be used toimplement the automated, stereo correlation approach.
2.0 Objective and Background
Probably the most fundamental geophysical measurement of the planet Earth isthe shape of the land surface. For hundreds of years, this has been the focus of thefields of cartography and geodesy. Literally all disciplines of scientific research invol-ving the EarthÕs land surface require topographic data and derivative slope, slopeaspect, and orthoimage cartographic products (Topographic Science Working Group,1988; Gesch, 1993).
Production of geocoded, orthorectified raster images, a necessity for incorpo-rating image data in a GIS database, requires DEM data (Hohle, 1996; Thorpe, 1996).Topographic information is also required for many of the geometric, radiometric andatmospheric corrections of satellite data from optical and microwave instruments. Forexample, correction of data from MODIS, MISR as well as ASTER itself requires use ofthe sort of digital topographic data that ASTER stereo can provide. These require-ments are described in algorithm theoretical documents for the data products fromthose instruments. ASTER class DEMs are also required for two-look radar inter-ferometry measurements of cm-scale Earth deformation due to earthquakes, volcan-ism or landslides (Gens and Van Genderen, 1996).
With its 8% duty cycle, ASTER is capable of acquiring a maximum of 771 stereoscenes/day. Because of mission operations and processing limitations, this maximumwill not be realized. The first six months of the mission will be devoted primarily tosystem engineering, testing and ramping-up of Level 1 data production.Subsequently, the present plan calls for processing 310 ASTER scenes per day to

6
SURFACE EMISSIVITY AND
SURFACE KINETIC TEMPERATURE
DECOMMUTATEDDATA WITH
APPENDED INFO
CALIBRATED,REGISTEREDRADIANCE AT
SENSOR
DECOMMUTATEDDATA WITH
APPENDED INFO
CALIBRATED,REGISTEREDRADIANCE AT
SENSOR
DECOMMUTATEDDATA WITH
APPENDED INFO
CALIBRATED,REGISTEREDRADIANCE AT
SENSOR
DECOR STRETCH-VNIR, SWIR, AND TIR (INCLUDES CLOUDS
CLASSIFICATION PRE-PROCESSOR)
BRIGHTNESSTEMPERATURE
RADIANCE AT SURFACE (VNIR, SWIR) AND SURFACE REFLECTANCE
RADIANCE ATSURFACE (TIR)
FINE CLOUDCLASSIFICATION PROCESSOR
POLAR CLOUD MAP
ASTER DEMDEM DB*
VNIR SWIR TIR
1A
1B
2
3
*REFERS TO A DATABASE OF DEM DATA REGARDLESS OF THE SOURCE
FIGURE 1.0-1. DIAGRAM SHOWING INTERDEPENDENCIES OF THE STANDARDASTER DATA PRODUCTS. EITHER LEVEL 1A OR SOM-PROJECTED LEVEL 1BASTER DIGITAL STEREOPAIRS FORMED BY VNIR BANDS 3N AND 3B ARE USEDAS INPUT FOR ASTER DEM PRODUCTION.

7
FIGURE 1.0-2. IMAGING GEOMETRY (APPROXIMATELY TO SCALE) AND DATAACQUISITION TIMING FOR ASTER ALONG-TRACK STEREO.
Level 1 (Fujisada, 1998) (Figure 1.0-1), yielding over 1/2 million stereo pairs duringthe 5-1/2 year operational phase of the mission.
During the mission, ASTER will be capable of acquiring the 45,000 cloud-free,digital stereo pairs required to cover the land surface of the Earth. This conclusion isbased on nine mission simulation results summarized in Figure 2.0-1. Withoutpointing, latitudinal coverage, based on the EOS AM-1 platform's orbital inclination of98.2° is restricted to below 82°N and S.

8
Five of the simulations used to construct Figure 2.0-1 were conducted prior to1994, during early mission planning. All five incorporated WillardÕs (1992) cloudclimatology. Each simulation utilized a different value for acceptable percent cloudcover and window size for estimating cloud cover; these values ranged from 0% to20% and 30 km to 90 km, respectively. These simulations also incorporated seasonaland latitude restrictions to assure optimal illumination. Specifically, winter solsticeacquisitions were restricted to below 35°N latitude; spring equinox acquisitions wererestricted to the region between 60°N and 45°S; summer solstice acquisitions wererestricted to the region above 35°S; and autumnal equinox acquisitions were restrictedto the region between 45°N and 60°N. Four other simulatons, conducted in late 1998and early 1999, resulted in the lowest acquisition rate. These incorporated theadditional requirement that all known EOS study targets be observed by ASTERmultitemporally, whenever possible. They also incorporated extremely conservativemission operation scenarios and assumed low efficiency for the cloud predictionalgorithm that is in the ASTER scheduler.
All nine simulations results, which vary substantially during mid years of themission, show that acquisition of one cloud-free, stereo data set covering 80% of theland surface of the Earth is fairly certain by the end of the six year mission (Figure 2.0-1). These results are consistent with simulations reported for Stereosat (NASA, 1979)and Mapsat (Itek, 1981), as well as the actual results from Landsat reported by Welchand Marko (1981).
ASTER topographic data derived from this stereo dataset will augment thatavailable from other sources (Figure 2.0-2; Table 2.0-1; see also Gittings, 1993, Wolfand Wingham, 1992, and Bohme, 1993). Absolute ASTER DEMs will be more accu-rate than National Imagery and Mapping Agency (NIMA; formerly Defense MappingAgency, DMA) DTED-1 data, which has become the baseline prelaunch EOS digitaltopographic data set, even though they do not provide complete coverage of the landsurface. The highest resolution global DEM data set available to the civil community isGTOPO30, with only 1 km posting and variable accuracy as bad as 2 km horizontaland ±650 m vertical (Table 2.0-1). The NIMA data set, with coverage outside the U.S.only available to the U.S. military community, provides only partial coverage of theland surface (Figure 2.0-2A) with 90 m posting, ±130 m horizontal and ±30 m verticalaccuracy (Table 2.0-1). Existing land topographic mapping at a scale and accuracyequivalent to that provided by ASTER DEMs is similarly incomplete globally (Figure2.0-2B).

9
FIGURE 2.0-1. ACCUMULATED PERCENTAGES OF CLOUD-FREE GLOBALLAND AREA COVERAGE BY ASTER STEREO FROM NINE CLOUD/MISSIONPRIORITY SIMULATIONS. SEE TEXT FOR EXPLANATION.
100
75
50
25
00 1 2 3 4 5 6
YEARS AFTER LAUNCH
CLO
UD
-FR
EE
LA
ND
CO
VE
RA
GE
(%
)

10
FIGURE 2.0-2. REGIONS OF THE WORLD WHERE ASTER DEMs WILLREPRESENT MAJOR CONTRIBUTIONS TO THE EXISTING TOPOGRAPHICDATABASE. A. AREAS NOT COVERED (BLACK) BY NIMA DTED-1 DIGITALELEVATION DATA (TABLE 2.0-1). B. AREAS INADEQUATELY MAPPED ATSCALES OF 1:50,000 OR LARGER WITH RELIEF GREATER THAN 200 m.(COMPILED FROM MURPHY, 1968, AND BOHME, 1993).

11
TABLE 2.0-1. SPECIFICATIONS OF SELECTED, AVAILABLE DIGITALELEVATION MODELS (FROM GESCH, 1993). Only ETOP05 and GTOPO30provide complete coverage of the EarthÕs land area.
Note: CE and LE refer to NMAS method for map accuracy assessment (Appendix6-5).
PRODUCT CELL SIZEHORIZONTALACCURACY
VERTICALACCURACY
ETOP05 5Õ (10 km) Not available Not available
GTOPO30 30Ó (1 km) 2000 m (CE)* ±650 m (LE)*
NIMA DTED-1 3Ó (90 m) 130 m (CE) ±30 m (LE)
USGS 1/24 K DEMs 30 m 3 m (RMSE) ±7-15 m (RMSE)
* Based on least accurate input source data

12
The ASTER DEM capability is based on simple principles of geometry that wereprobably first documented by Pythagoras around 450 BC; and principles of photo-grammetry that have been well understood and used routinely with stereo aerialphotographs for nearly 70 years (von Gruber, 1930; American Society of Photogram-metry, 1952) (Figure 2.0-3). Application of these principles to digital satellite stereodata was inherent in the Stereosat (NASA, 1979; Welch and Marko, 1981) and Mapsat(Itek, 1981) missions which were first conceived 20 years ago. Practical imple-mentation of digital photogrammetry has been demonstrated with results using datafrom numerous satellite systems (Table 2.0-2). The viability of a computer-automatedprocedure of stereo correlation for parallax difference/height measurement from digitalstereoscopic data was first described and evaluated over 20 years ago (Appendix 6-2;Panton, 1978; Ackermann, 1984 and 1994), and has been demonstrated practically bycommercial systems (Bolstad and Stowe, 1994, and Trinder et al., 1994) available for10 years, even on personal computers (Gagnon et al., 1990, and Welch, 1989). Thus,it is evident that ASTER DEMs will be extremely valuable data products that can beproduced using well understood principles and commercial, off-the-shelf software.
2.1 Experimental Objective
The objectives of the ASTER along-track stereo experiment during the six yearmission are: 1) to acquire cloud free stereo coverage of 80% of the Earth's landsurface between 82°N and 82°S; and 2) to produce, with commercial software,standard product DEMs at a rate of one per day at the Land DAAC.
ASTERÕs capacity for accomplishing objective 1) was described in Section 2.0.Objective 2) deserves further comment. The low, one-scene-per-day, production ratewas selected for programmatic reasons by the EOS Senior Project Scientist based onreview of three alternative production capabilities (Appendix 6-3). The productionoption selected will demonstrate that high quality ASTER DEMs, meeting thespecifications in Table 3.0-1, can be produced using commercial software. We expectthat the demonstrated methodologies likely will be adopted and refined by privateindustry and academic institutions. Individual scientists with appropriate computersand software will be able to create their own DEMs using ASTER Level 1 stereoimages obtained from archives at the Land DAAC.
2.2 Historical Perspective
The ASTER stereo subsystem represents implementation of the Stereosat/Mapsat concept to acquire global, along-track, digital stereo coverage of the land witha system designed specifically for photogrammetry. The only satellite systems thathave provided digital, along-track stereo are the OPS system on the Japanese EarthResources satellite (JERS-1) launched in 1993 (Nishidai, 1993), and the GermanMOMS system (Table 2.0-2). The JERS-1 system was designed primarily to deliverhard-copy stereo pictures for stereoscopic viewing and manual interpretation, andtherefore has a base/height ratio (B/H) of only 0.3 (versus 0.6 for ASTER). Few pub-lished examples of OPS DEM results are available (GSI, 1993; Nishidai, 1993).

13
FIGURE 2.0-3. ALGORITHM FOR MEASURING HEIGHT (Dh) FROM PARALLAXDIFFERENCE (Dp) IN AN ASTER STEREO PAIR (NOT TO SCALE). BASE (B) ISEQUAL TO X1. FOR THE NADIR (VERTICAL) AND AFT CAMERA CONFIGURATION,Dh IS RELATED TO THE CAMERA ORIENTATION ANGLE (a) AND THE TIMEINTERVAL (Dt)REQUIRED TO RECORD BOTH THE TOP AND THE BOTTOM OF THEOBJECT. IN THE NADIR/AFT STEREOPAIR, Dt IS REPRESENTED BY (X1-X2) = Dp.

14
TABLE 2.0-2. SPECIFICATIONS OF SELECTED SPACE MISSIONSTHAT PROVIDE OPTICAL STEREO DATA AND REPORTED RMSExyz OFDERIVED DEMs
Resolution MaximumRMSE-Accuracy
(m) Swath WidthInstrument/Mission Agency/Year Pixel Size (m) Base/Height Z XY (km)
TMLandsat
NASA1982-present
30 £0.2* 40 30 185
Metric CameraSpacelab-1/STS-9
ESA/DFVLR1983
~13** ~0.3 15 15 190
Large Format CameraSTS-41C
NASA1984
~8** £1.3 10 10 100
HRVSPOT
CNES1986-present
10 £1.0 10 10 60
MEOSSSROSS-II
DFVLR/ISRO1988
80 1.0 ~50 ~30 255
LISSIRS
DS1989-present
36 ~0.1 ~35 ~15 148
Metric CameraAtlas-1
DFVLR/NASA1991
5 £0.6 ~10 ~10 190
Stereo-MOMSSpacelab-D2
DFVLR/NASA1991/1992
5-10 1.0 ~10 ~10 32
OPSJERS
JAROS1992-present
24 0.3 ~35 ~35 75
IRS-1C DS1994-present
6 1.0 ~5 ~5 75
* In regions where adjacent swaths have narrow sidelap** Film

15
Examples of satellite systems that have provided either along track analog dataor cross-track digital data also exist (Table 2.0-2). An example of the former is theLarge Format Camera flown on only one Shuttle mission in 1984, and now moth-balled. Examples of the latter include SPOT-1 through -3 systems, available since1986. Also in Table 2.0-2 is the 6 m resolution, IRS-1C panchromatic system,launched in 1994 and providing cross-track digital stereo data with a B/H similar toSPOT.
The ASTER stereo subsystem design and DEM algorithm concept have bene-fited substantially from what has been learned from using Large Format Camera,Landsat, SPOT and IRS LISS stereo data for DEM generation (e.g., Al-Rousan andPetri, 1998; Al-Rousan et al., 1997 and 1998; Cheng and Toutin, 1998; Clavet et al.,1993; Derenyi and Newton, 1987; Ehlers and Welch, 1987; Rao et al., 1996; Researchand Engineering Directorate, 1984; Theodossiou et al., 1990; Welch, 1989; Welch etal., 1985, 1990, and 1998).
2.3 Instrument Characteristics
Figure 1.0-2 depicts the ASTER along track stereo imaging geometry. The mostimportant specifications of the ASTER stereo subsystem that govern the DEMgeneration capabilities, include: stereo geometry (one nadir viewing and one aft-viewing telescope, 27.6° off nadir); platform altitude of 705 km and ground speed of6.7 km/sec; B/H of 0.6; IFOV of 15 m; bandpass of 0.76-0.86 micrometers (nearinfrared) in channel 3N (nadir) and 3B (aft), both with an MTF of 0.24; 9 secondsrequired to acquire a 60 x 60 km scene; 64 seconds required to acquire a stereo pair.
3.0 Algorithm Description and Implementation
A digital stereo correlation approach will be used to calculate parallax differen-ces and derive DEMs from ASTER Level 1 stereo pairs. The mathematical concept ofone approach to stereo correlation is described in Appendix 6-2; other mathematicaltreatments of equivalent procedures are provided by Ackermann (1984), Ehlers andWelch (1987), and Rao et al. (1996). ASTER standard product DEM production willuse the PCI commercial off-the-shelf photogrammetric software to implement theprocedure. This commercial system has been acquired and will operate at the LandProcesses DAAC to produce the DEM standard data product at a rate of one scene perday, starting upon receipt of ASTER Level 1 stereo imagery, which will begin after ini-tial engineering checkout, now planned to be completed 53 days after launch(Appendix 6-3).
Our plan for implementing this approach is summarized in Figure 3.0-1 and theDEM generation process is shown in Figure 3.0-2. It is very important to understandthat the use of ASTER data in the DAAC environment requires some modification ofthe PCI software to achieve efficient processing of ASTER stereo data. Given thecurrent knowledge of how ASTER stereo data will be supplied, it is anticipated that theDAAC will process the ASTER data on a scene-by-scene basis. For correlation andediting this is a reasonable approach. However, it may not be the best for the initialrectification/geocoding required before stereo correlation. As illustrated in Figure 3.2-1, GCPs will not be needed in every 60 x 60 km ASTER stereo pair to produce an

16
CALENDAR YEAR
1994 1995 1996 1997 1998 1999
ATBD drafts/reviews (Lang & Welch) ▲ ----------------- ▲ ----------------------▲---------------▲---------------- ▲ -------------- ▲
Define std product (ADEMWG) ▲ ----------------------▲---------------▲---------------- ▲ -------------- ▲
Simulate ASTER stereo experiment with ▲ ----------------------------------------------------- ▲
existing DEM systems (ADEMWG)
Prepare procurement plan (ADEMWG ▲------------- ▲
& DAAC w/ EOS project approval)
Prepare RFP (DAAC) ▲------------- ▲
Release RFP (DAAC) ▲
Receive proposals (DAAC) ▲
Select & procure system ▲ ----- ▲
(DAAC w/ ADEMWG support)
Procure hardware (DAAC) ▲---- ▲
Install system (DAAC) ▲
ÑInitial ▲
ÑFinal prelaunch
Test system (DAAC w/ ADEMWG support) ▲ -- ▲
ÑInitialÑFinal prelaunch ▲ ----- ▲
Develop staffing plan (DAAC) ▲
Complete ops concept plan ▲
(DAAC w/ ADEMWG support)
Hire ops staff (DAAC) ▲▲
Train ops staff (DAAC) ▲ -- ▲
End-to-end systems tests (DAAC) ▲------▲
Operational readiness tests (DAAC) ▲ ----▲
Launch of AM-1 (EOS Project) ▲
Postlaunch software modification (DAAC) ▲---▲
Install postlaunch software (DAAC) ▲
Operate system (DAAC) ▲ --
▲ SCIENCE TEAM DEFINES EXPERIMENT GOALS
FIGURE 3.0-1. IMPLEMENTATION SCHEDULE (AND RESPONSIBILITIES) FORACQUIRING, TESTING AND OPERATING ASTER DEM GENERATION SYSTEM ATTHE LAND DAAC (ASSUMING JULY, 1999 LAUNCH).

17
RUN STEREO CORRELATION/GENERATE DEM
GCPs AVAILABLE
RUN REGISTRATION OF3B TO 3N
EDIT DEM
CREATE OUTPUT FILE/ABSOLUTE DEM
SELECT TIE POINTS ON3N & 3B
RUN REGISTRATION OF3B TO 3N
GCPs NOT AVAILABLE
RUN STEREO CORRELATION/GENERATE DEM
EDIT DEM
CREATE OUTPUT FILE/RELATIVE DEM
RECEIVE REQUEST(WITH GCPs, IF AVAILABLE)
GET BAND 3N AND 3B DIGITAL STEREO DATA(LEVEL 1, STANDARD PRODUCT)
LOAD DATA INTO SYSTEM
RUN STEREO CORRELATION/GENERATE DEM
RUN RECTIFY/GEOCODE 3N
SELECT TIE POINTS ON3N & 3B
ENTER GCPS
FIGURE 3.0-2. FLOW CHART SUMMARIZING STANDARD PRODUCT DEMGENERATION PROCESS (SUBJECT TO MODIFICATION AS DISCUSSED IN TEXT)

18
absolute DEM. This approach of block adjustment to extend the effect of groundcontrol is very valuable. The system should be flexible enough to handle blocks ofASTER stereo scenes. Alternatively, the control selection/rectification processing canbe accomplished simultaneously for groups of scenes from the same swath and/oradjacent swaths, with correlation and editing performed on an individual scene basisin the DEM generation system. We will also investigate stereo correlation on a swathbasis, with final editing and output on a scene basis. The effects of the differentapproaches on accuracy and quality (i.e., edge matching of adjacent DEMs) also willbe characterized by the DAAC. This work will continue until the system is operationalat launch, which is now expected in July, 1999.
The PCI system to be used for ASTER DEM generation has the capability toperform simultaneous adjustment of several scenes from different swaths (block ad-justment), several scenes from a single swath (swath adjustment), or scene-by-sceneadjustment. As noted above, the advantage of simultaneously processing large areasis that the number of ground control points required per unit area can be reduced.Also, the problem of edge joins is mitigated. Due to the large number of computationsand processing times, the correlation and editing will be performed on a scene-by-scene basis. Since the imagery will be introduced into the system in units of onescene, the actual process will be a Òstrip adjustmentÓ (several individual scenes simul-taneously adjusted) rather than a true Òswath adjustmentÓ (a single long, contiguousstrip of data adjusted as one unit). This will have little, if any, measurable affect on theefficiency of the process or accuracy of the output DEM.
The process for generating DEMs using the PCI or other commercial systems isoutlined in Figure 3.0-2. Table 3.0-1 shows specifications of the standard ASTERDEM data product. The process depicted in Figure 3.0-2 shows that the generation ofDEMs requires the construction of a stereo pair by registering two images of the sameground area recorded from different positions in space. In the stereo pair, anypositional differences parallel to the direction of satellite travel (parallax differences,Dp) are attributed to displacements caused by relief (Figure 2.0-3). Relative groundelevations are determined by measuring Dp in the registered images. The Dp areconverted to relative or absolute elevations (Z-coordinates) in a subsequent step.
The ASTER aft-camera image (band 3B) can be registered to the nadir (band3N) reference image by establishing transformation equations for conjugate imagelocations. The result of the transformation computation is a set of coefficients that de-fine the relationship between both images of the stereo pair. In the process of devel-oping DEMs, it is important to minimize resampling operations to retain the originalimage data quality and to reduce disk transfer time and storage requirements. Thetransformation equations which register the 3B to the nadir 3N images can be imple-mented using image segments in the correlation process. No resampling is requiredat this stage.

19
TABLE 3.0-1. DEFINITION/SPECIFICATIONS FOR STANDARD ASTERDEM DATA PRODUCT(S)
UNIT OF COVERAGE: 60 km x 60 km ASTER scene
FORMAT: Data consist of a regular array of elevations (in meters) refe-renced to either the lowest elevation in the scene (ÒrelativeDEMÓ) or to mean sea level (Òabsolute DEMÓ) and projectedin the Universal Transverse Mercator (UTM) coordinatesystem.
RESOLUTION: 1. X-Y; 30 m (posting)2. Z; 1 m (smallest increment)
PRODUCT NAME# OF GCPs(MINIMUM)
GCP (RMSExyz)ACCURACY
DEM (RMSExyz)ACCURACY
Relative DEM 0 N/A 10 - 30 m*
Absolute DEM 1 15 - 30 m 15 - 50 m**
Absolute DEM 4 5 - 15 m 7 - 30 m**
* Z values referred to lowest elevation pixel in the DEM, and ÒaccuracyÓ is relative to this pixel.** Z values referred to absolute vertical datum (mean sea level)

20
Because of inadequate pointing and ephemeris information for use with 15 mASTER pixels, absolute DEMs must be referenced to a map coordinate system usingground control points (GCPs). This is because platform pointing knowledge for theEOS AM-1 platform is expected to be about 300 m in X and Y, according to OÕNeill andDowman (1993); and the X-Y accuracy of ASTER Level 1 data should be about 50 maccording to Fujisada (1998). GCPs are features that are distinct and identifiable onthe image, and for which the X, Y and Z coordinates are known (Appendix 6-4). Theaccuracy requirements for GCPs is shown in Table 3.0-1. The coordinates of allASTER GCPs will be recorded in the Universal Transverse Mercator (UTM) coordinatesystem referenced to the World Geodetic System of 1984 (WGS84) ellipsoid forforeign areas, and to the North American Datum of 1983 (NAD83) for areas within theUnited States and Canada (Snyder, 1982; Pearson, 1977). GCP information,including ASTER input image line and sample coordinates, will be provided by thecustomer. These image coordinates of the GCPs in conjunction with their UTM mapcoordinates will permit the development of transformation equations needed toregister the stereo images and eventually geodetically rectify them to the EarthÕssurface.
The stereo correlation procedure is statistical and is utilized to derive automati-cally a digital elevation model (DEM) from the registered stereo pair (Ackerman, 1984;Ehlers and Welch, 1987; Rao et al., 1996; Welch, 1989; Welch et al., 1998). It is acomplex task requiring large numbers of floating point computations on 16 million pix-els in each ASTER image forming the stereo pair.
After transformation coefficients have been calculated, the band 3N and theband 3B full scene images must be ÒmatchedÓ to establish Dp values. To accomplishthis, a correlation window of specified size (e.g., 11 x 11 pixels), defined prior to initia-ting the correlation procedure, is automatically centered over a 15 m pixel in the band3N image. The area on the band 3B image within which the conjugate pixel is locatedis defined by a search window sized to account for the maximum possible imagedisplacements due to terrain relief. The correlation window is then moved pixel-by-pixel across the search window and the correlation coefficient computed at every pixellocation. The pixel location at which the correlation coefficient reaches a maximum isconsidered to be the Òmatch pointÓ. The difference in pixel location (in the conjugateimages) parallel to the direction of satellite motion is the Dp value, and is proportionalto the terrain elevation relative to the vertical datum (Figure 2.0-3). This procedure issystematically repeated across image space.
Although it is not necessary to determine Dp values for every image pixel, thematching process must be operated on a per pixel basis. This optimizes reliability ofthe correlation coefficient and accounts for high frequency terrain variations. SubpixelDp values can be achieved by interpolation. Early ADEMWG simulation results on asingle Pentium-based, PC workstation indicate a performance rate of 50 to 200elevation posts per second (the wide range is due to variations in workstationperformance, algorithmic design, image quality and relief). Based on this example, 6to 22 hours of computation time will be required to generate a DEM with 30 m spacingfrom an ASTER stereo pair using commercial systems such as those described byWelch (1989) and Trinder et al. (1994). Based on simulations and data supplied byPCI as part of their response to the request for proposals for commercial system

21
selection, the actual ASTER DEM workstation should perform the autocorrelation ofone ASTER stereoscopic image pair in about three to six hours, depending in thevariables noted above.
Upon completion of the correlation step, all pixels must be geodetically rectifiedto the UTM coordinate system. This rectification process includes scaling, translation,rotation, warping and resampling of the data pixels.
For some pixels, the correlation will fail or produce inadequate results in a typi-cal scene. Therefore, completion of the DEM generation process requires a final edit-ing step using a series of batch and interactive processes provided by the PCI soft-ware. It has been shown that with these standard image processing routines, the DEMcan be filtered to correct for spikes and outliers in the dataset (Giles and Franklin,1996; Kok et al., 1987).
The process described here may differ somewhat from that of the PCI system asfinally used operationally by the DAAC. For instance, Figure 3.0-2 shows locating ofGCPs on the nadir image, followed by rectification, and then tie point selection be-tween the nadir and aft images to accomplish registration. An alternative approach issimultaneous rectification and registration of the nadir and aft images by locating theGCPs on both images at the same time; so that they serve as tie points for the initialimage 3N and 3B registration as well.
The PCI software performs the rectification and registration processes simulta-neously. The output from the system autocorrelation process is in ground space.Consequently any required editing will be conducted in ground space. These differ-ences from the generalized processing flow shown in Figure 3.0-2 will have little or noeffect on the efficiency or accuracy of the overall process.
Another example of the potential difference between the Figure 3.0-2 processand how the PCI system will be used operationally is the stage at which imagecorrelation occurs and Dp values are converted to elevations. Correlation/editing canbe performed in image space and then Dp values are converted to elevations andrectified into ground/map space, or all correlation and editing can be performed inground/map space.
The PCI software will make use of the ephemeris and attitude informationrecorded in the ASTER metadata. These ephemeris and attitude data are used tocalculate the transformation coefficients between the map and image coordinate sys-tems. Such an approach greatly reduces the number of ground control points neededto create a DEM. Scientists from the Geographical Survey Institute in Japan, for exam-ple, have successfully used ephermeris and attitude data in conjunction with widelyspaced GCPs to generate absolute DEMs from JERS-1 stereo image data (GSI, 1993).Although the RMSExyz values of these DEMs as evaluated against GCPs withheldfrom the adjustment procedure degraded by about a factor of two compared to DEMsproduced with full ground control, this approach does provide a means for producingDEMs to sufficient accuracies for creating orthoimage products or for topographiccorrection of other EOS data products in areas without GCPs. It is important to notethat the Òrelative accuracyÓ of the Z values will be correct to within the threshold ofmeasurement, i.e., approximately ±20 m. Thus, DEMs with this sort of relative

22
accuracy can be used effectively to aid geomorphic, geologic and vegetation studiesin remote areas of rugged terrain.
An important topic of ongoing research and development is how to reduce therequirement for human intervention in the DEM generation process. The stereo corre-lation process is highly automated, but based on our experience manual editingremains a necessary and time-consuming task. The degree to which editing isrequired depends greatly on the nature of the stereo imagery. The only existing, rou-tinely available satellite sources of optical stereo imagery is SPOT, and the temporaldifferences in the images due to its repeat pass cross-track stereo collection modeusually results in a need for significant manual editing. Because ASTER stereo pairswill be acquired along-track and nearly simultaneously (Figure 1.0-2), these largetemporal differences will not be present. Our ongoing experiments with JERS-1 stereodata will provide some insight into improvements resulting from the along-track stereomode. However, there will always be areas of clouds, shadows, water, and lowcontrast ground cover where correlation will fail, or be unreliable, and operatorintervention is required. Research into ways to reduce or even eliminate manualediting will be a continuing activity at the Land DAAC DEM production facilitythroughout the mission.
Another area in which improvements would reduce the need for operator inter-vention is in the selection of ground control/tie points. Methods for automating, andthereby speeding up, the process would result in significant enhancement of the DEMgeneration process.
The use of ancillary topographic information, such as geomorphic feature data(streams, ridgelines, lake shorelines, spot heights, local depressions, etc.) derivedfrom other sources as input to the DEM correlation and editing processes have some-times been used in DEM processing. The current version of PCI software at the LandDAAC does not have the capability to utilize these ancillary sources of information toconstrain the autocorrelation process or to support the editing. Although this could bea valuable tool for the generation of more accurate DEMs, it was not given a highpriority in the procurement because it has been our experience that the ancillary digitaldata, such as the examples noted in the preceeding paragraph, usually becomeavailable after, not before, a DEM is produced.
3.1 Accuracy, Precision and Resolution: Error Estimates
Here we first provide a description of the parameters of interest in characterizingaccuracy, precision, and resolution of ASTER DEMs. We then describe how we esti-mate values for these parameters for ASTER DEMs.
Planimetric and elevation error standards have existed for paper cartographicproducts (maps) for over half a century (Bureau of the Budget, 1947, and Appendix 6-5). With the advent of digital cartographic data, these standards, based on map meas-urements and hence map-scale dependent, have been refined to incorporate statisti-cally based measurements of accuracy. Commonly used statistical measures of mapaccuracy are the Root Mean Square Error (RMSE) in XY (planimetry) and Z(elevation). RMSE is defined in Appendix 6-6; an RMSE-based map accuracy stan-dard is provided in Appendix 6-7.

23
Reported accuracies for GTOPO30 and NIMA DTED-1 data use the Bureau ofthe Budget (1947) method, and the USGS 1:24,000 scale DEMs use the RMSEmethod (Table 2.0-1). We will use the RMSE measure for ASTER DEM accuracyassessment. Integrated results from geometric analyses, analogy with other satellitesystems and simulations of ASTER data have been used to estimate RMSExyz forASTER DEMs (Table 3.0-1). Comparison of Table 3.0-1 to Table 2.0-1 shows thatabsolute ASTER DEMs will be more accurate than DTED-1 DEMs which are thebaselilne prelaunch EOS digital topographic data, but do not provide complete globalcoverage of the land (Figure 2.0-2B).
A simple geometry-based photogrammetric rule that is applicable to assess-ment of ASTER DEM accuracy is:
Dh =HDp
B(Welch 1989)
where H/B is the inverse of the B/H ratio (in the case of ASTER 1.0/0.6 or 1.7), and Dpis the difference in parallax (xy displacement) of a point in the two images forming thestereo pair. Assuming Dp correlation errors in the range of 0.5 to 1.0 pixels (7-15 m),Dh errors (RMSEz) would be in the ±12 m to ±26 m range. This estimate accounts fortypical errors due to correlation alone. It does not account for the fact that knowledgeof imaging geometry is imperfect. According to AraiÕs (1992) accuracy assessmentthat incorporated available information about ASTER system geometry and a moregeneralized error analysis for high resolution satellite photogrammetry by Li (1998)GCP and correlation errors are the primary factors affecting DEM accuracy. Theseanalyses show that with GCPs with RMSExyz of about ±8 m, resulting ASTER DEMswould have RMSEx of ±15 m, RMSEy of ±11 m and RMSEz better than ±46 m. Theseconservative results are similar to those obtained in equivalent analysesindependently by OÕNeill and Dowman (1993). More recently, Tokiunaga and Hara(1996) and Tokunaga et al. (1996) estimated that ASTER RMSEz values of ±12.5 mshould be possible.Table 2.0-2 includes actual DEM accuracies obtained using stereo data from othersatellite systems. In all cases RMSE values obtained using actual data are better thanwould have been expected based on prelaunch information alone. Overall, actualresults reported in Table 2.0-2 show that, in spite of a wide range of platform andsystem characteristics, RMSExyz approximately equivalent to system instantaneousfield of view (or pixel size) should be expected. This expectation is also supported byresults from our analyses of DEMs generated from simulated ASTER data sets. Weused SPOT stereo data with the ASTER B/H of 0.6. SPOT data were resampled to 15m resolution ASTER pixels. Error assessment was accomplished by subtracting theASTER-simulated Z values on a pixel by pixel basis from those on an existing DEM ofknown accuracy. All differences were assumed to result from errors in the simulatedASTER DEM. Figure 3.1-1 displays these results from the area covered by theHuntsville, Alabama, USGS 7-1/2 minute digital elevation model. Posting of ASTER-simulated Z values was 30 m to match that of the USGS model. The resulting RMSEzis ±13 m. It should be noted that the USGS DEM has an RMSEz of ±7-15 m, based onspecifications. Equivalent results were obtained in a similar analysis conducted inde-pendently over Kiso-Komagatake, Japan, by Arai (1992). Other independent, SPOT-

24
FIGURE 3.1-1. HISTOGRAM OF ELEVATION DIFFERENCES BETWEEN USGS 7.5MINUTE DEM (RMSEz 7-15 m) COVERING THE HUNTSVILLE, ALABAMA,QUADRANGLE AND THE CORRESPONDING ASTER-SIMULATED DEM DERIVEDFROM SPOT DATA RESAMPLED TO 15 m.
10000
1000
100
10
1
FR
EQ
UE
NC
Y
-100 -75 -50 -25 0 +25 +50 +75 +100
DIFFERENCE (M)

25
based ASTER simulations by Dowman and Neto (1994) yielded RMSE ofapproximately ±13 m (XY) and ±26 m (Z) for a site in SW France; and by Giles andFranklin (1996) yielded RMSExyz of ±22 m.
As pointed out by Gesch (1993), Bolstad and Stowe (1994), and Ackermann(1994) RMSExyz alone is an insufficient measure of DEM data quality for those whouse the DEM data for scientific applications. Other parameters include: 1) the spacingof the DEM grid in XY (also referred to as posting, pixel size or XY precision), 2) theresolution of the DEM in Z (also referred to as Z precision, and numerically thesmallest Z increment), 3) slope measurement accuracy (a derived value, dependenton RMSEz as well as the measurement distance in XY), and 4) equivalent map scalebased on map accuracy standards. Figure 3.1-2 depicts the relationship of three ofthese parameters diagrammatically. Figure 3.1-2C requires additional comment. Forabsolute ASTER DEMs (Table 3.0-1) data consist of a regular array of elevations, Zvalues, which are referenced to mean sea level. As noted by the TopographicScience Working Group (1988), over 18 mean sea level datums are used by thevarious cartographic agencies that produce topographic maps worldwide (Figure 3.1-3). Errors in these datums would be introduced into ASTER DEMs through GCPs. TheTopographic Science Working Group considered this sort of problem sufficient tofatally compromise any approach to global topographic mapping that required the useof GCPs. Fortunately, this concern is unfounded. According to an inhouse study bythe U.S. National Geodetic Survey (Dave Zykowski, 1994, personal communications)the RMSEz of all of these datums world-wide is 1.5 m over a total range of error of only3 m. Errors of this magnitude are inconsequential for the 1:50,000Ñ1:250,000 scalemap accuracy requirements of an ASTER-class DEM, and would even be inconse-quential for 1:24,000 scale mapping.
As summarized in Table 3.0-1, posting in ASTER DEMs will be 30 m; verticalresolution will be 1 m. Table 3.1-1 shows that, based on expected RMSEz values forASTER DEMs (±10-50 m, according to Table 3.0-1), slope accuracies of 5° should beobtainable over measurement distances in the 100 m to 500 m and longer range.
The cartographic value of DEM data can be measured by determining equiva-lent map scale. This can be done by considering RMSExyz values as well as the XYposting and Z resolution in the context of the Appendices 6-5 and 6-7 map accuracystandards. Welch and Marko (1981) quantified these relationships (Table 3.1-2). Weestimate conservatively that ASTER DEMs will be generally useful at mapping scalesin the 1:100,000 to 1:250,000 range. In some cases, ASTER DEMs will be of sufficientquality for 1:50,000 scale mapping.
3.2 Practical Considerations
Our basic DEM processing concept requires that one or more GCPs per scenebe provided by the requestor if an absolute DEM is requested (Table 3.0-1). Therequestor will provide the line and sample pixel locations of GCPs on the ASTERLevel 1 band 3N and 3B images that will be used to produce the DEM.

26
FIGURE 3.1-2. ILLUSTRATION OF RELATIONSHIP OF PLANIMETRIC ANDHEIGHTING RESOLUTION AND ACCURACY
A. REGULAR POSTING SCHEME FOR DEM RASTER DATA.
B. MAP VIEW (XY, PLANIMETRIC) ACCURACY.
C. CROSS SECTION VIEW (Z, HEIGHTING/VERTICAL) ACCURACY.
SEE TEXT FOR EXPLANATION.
EASTING (X)
NO
RT
HIN
G (
Y)
A. B. RMSExy
RMSExy
Dh
RMSEz
RMSEz
LANDSURFACE
C.

27
EUROPEANPULKOVO
SOUTHAMERICAN
NORTHAMERICAN
CAPE ARC AUSTRALIAN
INDIAN
TOKYO
A.
GEOID
ELLIPSOID
N
Hh
P
LANDSURFACE
B.
FIGURE 3.1-3. THE VERTICAL DATUM ISSUE.A. MAP SHOWING MAJOR BLOCKS IN WHICH DIFFERENT VERTICAL (MEAN
SEA LEVEL) DATUMS ARE USED (FROM TOPOGRAPHIC SCIENCEWORKING GROUP, 1988).
B. DIAGRAMMATIC CROSS SECTION VIEW ILLUSTRATING THERELATIONSHIP OF THE GEOID, ELLIPSOID AND GROUND SURFACE (FROMSCHERRER, 1985). P IS A POINT ON THE EARTHÕS SURFACE; N IS THEGEOID SEPARATION; h IS THE ELLIPSOIDAL HEIGHT; H IS THE HEIGHTABOVE THE GEOID. H IS MOST USUALLY KNOWN AS THE HEIGHT ABOVEMEAN SEA LEVEL, AND IS USED FOR MAP DESIGNATION OF ELEVATION.THE RMSEz VARIATION OF THE MEAN SEA LEVEL DATUMS USED IN ALLTHE AREAS SHOWN ON A. IS ONLY 1.5 m GLOBALLY.

28
TABLE 3.1-1. RELATIONSHIP OF MAP DISTANCE (CELL SIZE =POSTING) AND HEIGHT ERROR THAT RESULT IN SLOPEMEASUREMENT ERROR OF 5°.
Note: ASTER DEMs should provide slope measurement errors less than 5° overmap distances of about 100 m and greater.
DEM CELLSIZE/LENGTH OFHORIZONTAL MEASUREMENT
CELL HEIGHT ERROR CAUSING 5°SLOPE ERROR (APPROXIMATE)
30 m 2.6 m
50 m 4.5 m
100 m 8.7 m
200 m 17.5 m
500 m 43.7 m
1000 m 87.0 m

29
TABLE 3.1-2. EQUIVALENT RMSE ACCURACY REQUIREMENTS FORTOPOGRAPHIC DATA THAT MEET NATIONAL MAP ACCURACYSTANDARDS (APPENDIX 6-5). (AFTER WELCH AND MARKO, 1981).
Map scale RMSExy (m) RMSEz (m)*
1:500,000 150 30
1:250,000 75 15-30
1:100,000 30 6-15
1:50,000 15 6
1:25,000 7.5 3
* Based on spot height measurements and contour intervals used for typical topographic maps of the
specified scales.

30
Depending upon their distribution, however, fewer GCPs will be needed, on-average, per scene. A few examples of practical situations that lead to this conclusionare illustrated in Figure 3.2-1. For example, Dowman and Neto (1994) show that for3000 km long strips of ASTER data, as few as six GCPs should provide sufficient con-trol to meet accuracies specified in Table 3.0-1. Taking advantage of this approach toGCP economy, however, requires that an accessible archive of all GCPs submittedduring the mission be maintained (Appendix 6-4).
Other practical considerations related to GCPs include their characteristics,potential sources, and cost. To be of use in the processing scheme portrayed in Fig-ure 3.0-1, and in addition to RMSExyz specifications that are shown in Table 3.0-1, aGCP must be locatable at the 15 m pixel level on an ASTER Level 1 Band 3N image.We therefore require that the ASTER absolute DEM requestor provides the line andsample locations of all GCPs on the ASTER Level1 Band 3N and 3B input images.
As described by Clavet et al. (1993) and Kardoulas et al. (1996), sources forGCPs for use in satellite photogrammetry include existing topographic maps,photogrammetric triangulation from aerial photographic surveys, and globalpositioning system (GPS) data. Topographic map sources at 1:25,000 scale will satisfyour most stringent GCP accuracy requirement. In most cases, 1:100,000 or 1:50,000scale sources will probably provide sufficient accuracy (Table 3.0-1). GCPs withRMSExyz better than 15 m can be obtained from 1:50,000 scale maps that meetNational Map Accuracy Standards (Appendix 6-5 and Table 3.1-2); RMSExyz of 15-30m can be obtained from 1:100,000 scale maps. As documented by Bohme (1993),such data exist for much of the land area of the world (Figure 2.0-2.3). As determinedby Clavet et al. (1993), differential GPS measurements, using inexpensive, off-the-shelf, hand-held receivers, provide GCP data that satisfy the better than 15 mRMSExyz ASTER requirement.
Selection of the 30 m posting for ASTER DEMs (Table 3.0-1) is based on bothexpected RMSExy as well as practical consideration. Although successful stereocorrelation of all 15 m ASTER pixels may be accomplished in exceptional situations,normally correlation failures will occur. The 30 m posting requires successful stereocorrelation of one, 15 m ASTER pixel out of every four (a 25% or greater success rate)and distributed evenly planimetricly. In situations where a lower success rate isaccomplished, no ASTER DEM will be produced. The criteria for a ÒsuccessfulÓ corre-lation will be clearly defined, as will an Òeven planimetric distributionÓ of successfulcorrelations. This will be reported as part of the Quality Assurance metadata (see 3.2.3below). This data layer will be useful to ASTER DEM users for characterizing the spa-tial distribution of successful or failed correlations, and for identifying areas in a par-ticular DEM where accuracy should be verified.
3.2.1 Numerical Computation Considerations
Assessing accurately the computational needs and costs for ASTER DEMproduction requires information about the exact number of ASTER DEMs that will beproduced during the mission. Based on a study of the costs/benefits of threeproduction rate options (Appendix 6-3), the EOS Project selected the one scene/day

31
FIGURE 3.2-1. DIAGRAM ILLUSTRATING THE FACT THAT UNDER ACTUALCONDITIONS, THE NOMINAL BASELINE REQUIREMENT OF FOUR OR MORE GCPs/ASTER STEREO PAIR FOR PRODUCTION OF ABSOLUTE DEMs (TABLE 3.0-1) ISEXCESSIVE. THE FIGURE SHOWS A SERIES OF ASTER STEREO SCENES, WITHREGIONS OF OVERLAP DEPICTED BY THE DASHED LINES; THE DISTRIBUTIONOF GCPs IS DEPICTED BY DOTS. STEREO PAIR ÒAÓ SATISFIES THE FOURGCPs/SCENE REQUIREMENT. STEREO PAIR ÒBÓ HAS NO GROUND CONTROLPOINTS, BUT AN ABSOLUTE DEM CAN BE GENERATED FOR THIS SCENEBECAUSE CONTINUOUS CONTROL IS AVAILABLE ALONG ITS UPPER ANDLOWER EDGE FROM ABSOLUTE DEMs GENERATED FROM ADJACENT SCENESWITH GROUND CONTROL. A SIMILAR CASE EXISTS WITH SCENE ÒDÓ. SCENESLABELLED ÒEÓ ARE WITHIN A BOX REPRESENTING THE AREA COVERED BY AUTM-PROJECTED TM SCENE OR BY A 1:50,000 SCALE TOPOGRAPHIC MAP.REGISTRATION OF THESE SCENES TO THE TM SCENE OR TOPOGRAPHIC MAPAND USE OF AS FEW AS TWO GCPs SHOULD BE SUFFICIENT TO MEET THEPLANIMETRIC ACCURACY SPECIFICATIONS.
EE
EE
C A
D B

32
option. This requires one dedicated work station with commercially available softwareand two operators.
3.2.2 Calibration and Validation
An overview of ASTER data product calibration and validation (includingstandard product DEMs) is provided in Thome et al. (1998). Planimetric and heightingcalibration of ASTER DEMs is provided by GCPs. In situations where one or fewerGCPs are used, planimetric calibration will be inherited from the input Level 1, band3N data product (Figure 1.0-1). This calibration information is documented in thealgorithm theoretical basis document for the ASTER Level 1 data product, which issummarized in Fujisada (1998).
Because of the well established and operational nature of the DEM generationalgorithm (Ackermann, 1994, and Figure 2.0-3), its validation is unnecessary. We will,however, specify performance standards and test the PCI system (Figure 3.0-1).
Figure 3.1-1 provides an example of one of the three methods that will be usedto validate the accuracy of ASTER DEMs. Over the 11 validation sites that wereselected by the ASTER Science Team (Table 3.2-1), we plan to subtract Z values fromhighly accurate DEMs, obtained from other sources, from Z values from ASTER DEMscovering the same sites, on a pixel-by-pixel basis. Results will be reported in the sameformat as Figure 3.1-1 and RMSEz values will be calculated under the assumption thatthe highly accurate DEM values are correct. Minimum, maximum, means and 1 sigmadifference values will also be determined. In order to validate the planimetric accuracyof ASTER DEMs, we will use two other methods to validate ASTER DEMs for the 11validation sites: 1) measure X-Y displacement of distinct topographic features onelevation profiles derived from ASTER DEMs with respect to the same features on thesame lines of profile derived from 1:25,000 scale or better topographic maps or DEMsfrom other sources (a method discussed by Giles and Franklin, 1996); and 2) measureX-Y displacements of GCPs that were not used for DEM production (a methoddiscussed by McGwire, 1996). Repeat measurements of these three validationparameters for the 11 validation sites, at least once per year using DEMs from newlyacquired ASTER stereo pairs, will validate system stability over the six year mission.All of these validation data will be archived at the Land DAAC.
3.2.3 Quality: Assessment, Control and Diagnostics
The relevant quality control and related metadata information that will beprovided in the header of each ASTER DEM are identified on Table 3.2-2.
3.2.4 Exceptional Handling
As part of our definition of the specific objective of the ASTER along-track stereoexperiment (Section 2.1) we are identifying regions where stereo correlations willprobably be poor. These areas will probably produce poor DEMs and/or require moreoperator intervention than elsewhere.

33
TABLE 3.2-1. ASTER DEM STANDARD PRODUCT VALIDATION SITES(LISTED IN PRIORITY ORDER).
SITE PI
Mt. Kiso-Komagatake, Japan Arai, Saga University
Huntsville, Alabama Welch, University of Georgia
Mt. Fuji, Japan Murakami, Geographical Survey Institute, Japan
Taxco/Iguala, Mexico Lang, JPL
Mt. Tsukuba, Japan Murakami, Geological Survey Institute, Japan
Drum Mountains, Utah Bailey, USGS-EDC
Mt. Aso, Japan Miyazaki, Geological Survey of Japan
Mt. Etna, Italy Pieri, JPL
Mt. Unzen, Japan Murakami, Geographical Survey Institute, Japan
Saga Plain, Japan Arai, Saga University
Lake Okoboji, Iowa Bailey, USGS-EDC

34
An important recommendation of the ADEMWG (Appendix 6-1) that would beexceptional handling, based on the present concept of allowable EOS data formats, isthat ASTER Band 3N and 3B, SOM-projected Level 1B image data products beavailable in 1:250,000 scale, photographic hardcopy format. We believe that there willbe substantial demand by the science user community for pictures of this type forstereoscopic viewing, manual interpretation and analysis. But although pastexperience (e.g., Berger et al., 1992, and Nishidai, 1993) with data from all highresolution, orbital, land imaging systems support this expectation, no plan exists forproducing any EOS data in hard copy format at the DAAC.
4.0 Constraints, Limitations, Assumptions
All constraints, limitations and assumptions used to prepare this document aredescribed elsewhere in the document, and therefore are not repeated here.

35
TABLE 3.2-2. RELEVANT QUALITY ASSURANCE AND RELATEDMETADATA REPORTED IN HEADER RECORD FOR EVERY STANDARDPRODUCT ASTER DEM.
1. CARRY THROUGH FOR THE TWO LEVEL 1 INPUT SCENES (3N AND 3B)a. Scene datesb. Scene-unique ID numbersc. Cloud assessment Ñ percentd. Bad/suspect pixel QA image data plane
2. GCP INPUT DATAa. Numberb. Locations Ñ line and samplec. Locations Ñ x, y, z and horizontal and vertical reference datumsd. Provider(s) Ñ name and address, etc.e. Source Ñ e.g., GPS instruments type, surveying, map, photogrammetryf. Type of feature - e.g., road intersection, stream intersection
3. PRODUCT SPECIFICATIONSa. Cell spacingb. Relative or absolutec. % successful correlationsd. Correlation method and matrix/window size usede. Lowest and highest elevation valuesf. Filtered or not Ñ type filter usedg. Edited Ñ yes or noh. Overall quality assessment per operator and TBD criteria (1, 2 or 3)i. Correlation coefficient QA image data plane

36
5.0 Bibliography
Ackermann, F., 1984, Digital image correlation: performance and potential applicationin photogrammetry: Photogrammetric Record, v. 11, n. 64, p. 429-439.
Ackermann, F., 1994, Digital elevation models Ñ techniques and application, qualitystandards, development: International Archives of Photogrammetry and RemoteSensing, v. 30, p. 4, p. 421-432.
Al-Rousan, N., P. Cheng, G. Petrie, T. Toutin, and M.J. Valadan Zoej, 1997, AutomatedDEM extraction and orthoimage generation from SPOT Level 1B imagery: Photo-grammetric Engineering and Remote Sensing, v. 63, n. 8, p. 965-974.
Al-Rousan, N., and G. Petrie, 1998, System calibration, geometric accuracy testing andvalidation of DEM and orthoimage data extracted from SPOT stereopairs using com-mercially available image processing systems: International Archives of Photogram-metry and Remote sensing, v. 32, part 4, p. 8-15.
Al-Rousan, N., G. Petrie, T.R. Jordan, R. Welch, and H. Lang, 1998, Geometric accu-racy of DEMs and orthoimages extracted from SPOT stereopairs using a low cost PC-based softcopy system: Technical Papers, ASPRS-ARTI 1998 Annual Conference,Tampa, Florida, March 30-April 3, p. 1230-1231.
American Society of Photogrammetry, 1952, Manual of Photogrammetry, 2nd ed.:Washington, DC, 876 p.
American Society for Photogrammetry and Remote Sensing, 1990, ASPRS accuracystandards for large-scale maps: Photogrammetric Engineering and Remote Sensing,v. LVI, n. 7, pp. 1068-1070.
Arai, K., 1992, Accuracy assessment of DEM with EOS-a/ASTER: Department of Infor-mation Science, Saga University, Japan, unpublished report to the ASTER DEMWorking Group, 9 p.
Berger, Z., T. H. L. Williams, and D. W. Anderson, 1992, Geologic stereo mapping forgeologic structures with SPOT satellite data: American Association of Petroleum Geo-logists Bulletin, v. 76, n. 1, p. 101-120.
Bohme, R., Compiler, 1993, Inventory of world topographic mapping: Elsevier, Perma-gon Press Inc., New York, The ICA International Cartographic Association, v. 1, 2 and3, 1070 p.
Bolstad, P.V., and T. Stowe, 1994, An evaluation of DEM accuracy: Elevation, slope,and aspect: Photogrammetric Engineering and Remote Sensing, v. 60, n. 1, p. 1327-1332.
Borgeson, W. T., R. M. Batson, and H. H. Kieffer, 1985, Geometric accuracy of Land-sat-4 and Landsat-5 Thematic Mapper images: Photogrammetric Engineering andRemote Sensing, v. 51, n. 12, p. 1893-1898.

37
Bureau of the Budget, 1947, United States National Map Accuracy Standards: U.S.Bureau of the Budget, Washington, DC, 1 p.
Cheng, P., and T. Toutin, 1998, Unlocking the potential for IRS-1C data: EOM, v. 7, n.3, p. 24-26.
Clavet, D., M. Lasserre and J. Pouliot, 1993, GPS control for 1: 50,000-scale topo-graphic mapping from satellite images: Photogrammetric Engineering and RemoteSensing, v. 59, n. 1, p. 107-111.
Derenyi, E., and L. Newton, 1987, Control extension utilizing Large Format Cameraphotography: Photogrammetric Engineering and Remote Sensing, v. 53, n. 5, p. 495-499.
Dowman, I., and F. Neto, 1994, The accuracy of along track sterescopic data for map-ping: Results from simulations and JERS OPS: International Archives of Photogram-metry and Remote Sensing, v. 30, n. 4, p. 216-221.
DWG (DEM Working Group, Japan), 1997, ASTER DEM data product specification(Science Version), Version 2.1: Japan, ERSDAC Document, 79 p.
Ehlers, M., and R. Welch, 1987, Stereo correlation of Landsat TM images: Photo-grammetric Engineering and Remote Sensing, v. 53, n. 9, p. 1231-1237.
Elassal, A.A., and V.M. Caruso, 1983, USGS digital cartographic data standards.Digital elevation models: U. S. Geological Survey, Circular 895-B, 40 p.
Fujisada, H., 1998, ASTER Level 1 data processing algorithm: IEEE Transactions onGeoscience and Remote Sensing, v. 36, n. 4, p. 1101-1112.
Fukue, K., H. Fujisada, and M. Tokunaga, 1996, New approach to ASTER orthoimagegeneration: Proceedings of the International Society for Optical Engineering, InfraredSpaceborne Remote Sensing IV, p. 98-105.
Gagnon, P.A., J.P. Agnard, C. Nolette, C., and M. Boulianne, 1990, A microcomputer-based general photogrammetric system: Photogrammetric Engineering and RemoteSensing, v. 56, n. 5, p. 623-625.
Gens, R., and J.L. Van Genderen, 1996, Review article SAR interferometry Ñ issues,techniques, applications: International Journal of Remote Sensing, v. 17, n. 10, p.1803-1835.
Gesch, D., 1993, Topographic data requirements for EOS global change research(4/30/93 draft): U.S. Geological Survey, EDC, Unpublished internal report for theLPDAAC Science Advisory Panel (in review), 57 p.
Giles, P.T., and S.E. Franklin, 1996, Comparison of derivative topographic surfaces ofa DEM generated from stereoscopic SPOT images with field measurements: Photo-grammetric Engineering and Remote Sensing, v. 62, n. 10, p. 1165-1171.

38
Gittings, B., 1993, Catalogue of digital elevation data (October, 1993): University ofEdinburgh, unpublished listing with disclaimer, 8 p. [Available electronically athttp://www.geo.ed.ac.uk/home/ded.html]
GSI, 1993, Report on the development of terrain relief measurement methods usingJERS-1 stereo image correlation (in Japanese). Geographical Survey Institute (GSI)of Japan, 52 p.
Hohle, J., 1996, Experience with the production of digital orthophotos: Photogramme-tric Engineering and Remote Sensing, v. 62, n. 10, p. 1189-1194.
Itek Optical Systems, 1981, Conceptual design of an automated mapping satellitesystem (MAPSAT): Itek Optical Systems, a Division of Itek Corporation, Lexington,Massachusetts, 285 p.
Kahle, A.B., F.D. Palluconi, S.J. Hook, V.J. Realmuto, and G. Bothwell, 1991, TheAdvanced Spaceborne Thermal Emission and Reflectance Radiometer (ASTER):International Journal of Imaging Systems and Technology, v. 3, p. 144 -156.
Kardoulas, N.G., A.C. Bird, and A.I. Lawman, 1996, Geometric correction of SPOT andLandsat imagery: A comparison of map- and GPS-derived control points: Photogram-metric Engineering and Remote Sensing, v. 52, n. 10, p. 1173-1177.
Kok, A.L., J.A.R. Blais, and R.M. Rangayyan, 1987, Filtering of digitally correlated Ges-talt elevation data: Photogrammetric Engineering and Remote Sensing, v. 53, n. 5, p.535-538.
Konecny, G., 1996, Paradigm changes in ISPRS from the first to the eighteenth con-gress in Vienna: Photogrammetric Engineering and Remote Sensing, v. 62, n. 10, p.1117-1124.
Labovitz, M.L., and J.W. Marvin, 1986, Precision in geodetic correction of TM data as afunction of the number, spatial distribution, and success in matching control points: asimulation: Remote Sensing of Environment, v. 20, p. 237-252.
Lang, H.R., and E.D. Paylor, 1994, Spectral stratigraphy: remote sensing lithostrati-graphic procedures for basin analysis, central Wyoming examples: Journal of Nonre-newable Resources, Oxford Press, v. 3, n. 1, p. 25-45.
Lee, J.E. and S.D. Johnson, 1985, Expectancy of cloudless photographic days in thecontiguous United States: Photogrammetric Engineering and Remote Sensing, v. 51,n. 12, p. 1883-1891.
Level-1 Data Working Group, 1995, Algorithm Theoretical Basis Document for ASTERLevel-1 Data Processing: ERSDAC document LEL/7-13, version 2.1 (December 26,1995), available from JPL ASTER Project Office, 107 p.
Li, R., 1998, Potential of high-resolution satellite imagery for national mappingproducts: Photogrammetric Engineering and Remote Sensing, v. 64, n. 12, p. 1165-1169.

39
Light, D.L., 1990, Characteristics of remote sensors for mapping and Earth scienceapplications: Photogrammetric Engineering and Remote Sensing, v. 56, n. 12, p.1613-1623.
Maruyama, H., R. Kojiroi, T. Ohtsuka, Y. Shimoyama, S. Hara, and H. Masaharu, 1994,Three dimensional measurement by JERS-1, OPS stereo data: International Archivesof Photogrammetry and Remote Sensing, v. 30, p. 4, p. 210-215.
McGuire, K.C., 1996, Cross-validated assessment of geometric accuracy: Photogram-metric Engineering and Remote Sensing, v. 62, n. 10, p. 1179-1182.
Murphy, R.E., 1968, Map supplement no. 9 based on Goode base map: in, J.P. Trem-blay, Cartography, New York, John Wiley and Sons.
National Aeronautics and Space Administration, 1979, Preliminary Stereosat missiondescription: Jet Propulsion Laboratory, California Institute of Technology, Pasadena,California, Publication 720-33, p. 1-1Ñ12-9.
Nishidai, T., 1993, Early results from ÒFuyo-1Ó JapanÕs Earth resources satellite(JERS-1): International Journal of Remote Sensing, v. 14, n. 9, p. 1825-1833.
Novak, K., and R. Tudhope, Editors, 1993, Foreword: Photogrammetric Engineeringand Remote Sensing, v. 59, n. 11, p. 1609.
OÕNeill, M.A., and I.J. Dowman, 1993, A simulation study of the ASTER sensor using aversatile general purpose rigid sensor modelling system: International Journal of Re-mote Sensing, v. 14, n. 3, p. 565-585.
Panton, D.J., 1978, A flexible approach to digital stereo mapping: PhotogrammetricEngineering and Remote Sensing: v. 44, n. 12, p. 1499-1512.
Pearson, II, F., 1977, Map projection equations: Defense Mapping Agency, Washing-ton, DC, Final Report TR 3624, 342 p.
Rao, T.C.M., K.V. Rao, A.R. Kumar, D.P. Rao, and B.L. Deckshatula, 1996, Digital ter-rain model (DTM) from India Remote Sensing (IRS) satellite data from the overlap areaof two adjacent paths using digital photogrammetric techniques: PhotogrammetricEngineering and Remote Sensing, v. 62, n. 6, p. 727-731.
Research and Engineering Directorate, 1984, LFC Payload: Lyndon B. JohnsonSpace Center, Houston, Publication JSC-18986, 1 sheet.
Scherrer, R., 1985, The WM GPS Primer: Satellite Survey Company, Wild-HeerbruggSwitzerland, 41 p.
Snyder, J.P., 1982, Map projections used by the U.S. Geological Survey: U.S. Geolo-gical Survey Bull., v. 1532, 313 p.
SPOT Image Corporation, 1993 (June), General information (DTM) SPOT digital ter-rain models: Reston, Virginia, SPOT Image Corp., 1 p.

40
Theodossiou, E.I., and I.J. Dowman, 1990, Heighting accuracy of SPOT: Photogram-metric Engineering and Remote Sensing, v. 56, n. 12, p. 1643-1649.
Thome, K., K. Arai, S. Hook, H. Kieffer, H. Lang, T. Matsunaga, A. Ono, F. Palluconi, H.Sakuma, P. Slater, T. Takashima, H. Tonooka, S. Tsuchida, R.M. Welch, and E.Zalewski, 1998, ASTER preflight and inflight calibration and the validation of Level 2products: IEEE Transactions on Geoscience and Remote Sensing, v. 36, n. 4, p. 1161-1172.
Thorpe, J., 1996, Aerial photography and satellite imagery: Competing or comple-mentary?: Earth Observation Magazine, v. 5, n. 6, p. 35-39.
Tokunaga, M., and S. Hara, 1996, DEM accuracy derived from ASTER data: Proceed-ings of the 17th Asian Conference on Remote Sensing, p. J-7-1 Ñ J-7-5.
Tokunaga, M., S. Hara, Y. Miyazaki, and M. Kaku, 1996, Overview of DEM productgenerated by using ASTER data: International Archives of Photogrammetry andRemote sensing, v. 31, part B4, p. 874-878.
Topographic Science Working Group, 1988, Topographic Science Working Groupreport to the Land Processes Branch, Earth Science and Applications Division, NASAHeadquarters: Lunar and Planetary Institute, Houston, Texas, 64 p.
Trinder, J.C., A. Vuillemin, B .E. Donnelly, and V.K. Shottigara, 1994, A study of proce-dures and tests on DEM software for SPOT images: International Archives of Photo-grammetry and Remote Sensing, v. 30, p. 4, p. 449-456.
Tsu, H., Y. Yamaguchi, and A.B. Kahle, 1996, ASTER science mission overview: Pro-ceedings, The International Society for Optical Engineering, SPIE v. 2817, p. 52-59.
University NAVSTAR Consortium, 1993, UNAVCO News: UNAVCO, P.O. Box 3000,Boulder, CO 80307, Summer 1993 Issue, 4 p.
von Gr�ber, O., 1930, Photogrammetry. Collected essays and lectures. EnglishTranslation: Amer. Photogr. Publ. Co., Boston, 1932 p.
Welch, R., 1980, Measurements from linear array camera images: PhotogrammetricEngineering and Remote Sensing, v. 46, n. 3, p. 315-318.
Welch, R., 1989, Desktop mapping with personal computers: Photogrammetric Engi-neering and Remote Sensing, v. 55, n. 11, p. 1651-1662.
Welch, R. and W. Marko, 1981, Cartographic potential of spacecraft line-array camerasystem: Stereosat: Photogrammetric Engineering and Remote Sensing, v. 47, n. 8, p.1173-1185.
Welch, R., and D. Papacharalampos, 1992, Three-dimensional terrain visualization onpersonal computers: an application with stereo SIR-B images: Photogrammetric Engi-neering and Remote Sensing, v. 58, n. 1, p. 71-75.

41
Welch, R., T.R. Jordan, and M. Ehlers, 1985, Comparative evaluations of the geodeticaccuracy and cartographic potential of Landsat-4 and Landsat-5 Thematic Mapperimage data: Photogrammetric Engineering and Remote Sensing, v. 51, n. 9, p. 1249-1262.
Welch, R., T.R. Jordan, and J.C. Luvall, 1990, Geocoding and stereo display of tropicalforest multisensor datasets: Photogrammetric Engineering and Remote Sensing, v. 56,n. 10, p. 1389-1392.
Welch, R., T. Jordan. H. Lang, and H. Murakami, 1998, ASTER as a source for topo-graphic data in the late 1990Õs: IEEE Transactions on Geoscience and Remote Sens-ing, v. 36, n. 4, p. 1282-1289.
Willard, J. H., 1992, Data base blending for the climatology of cloud statistics program:Phillips Laboratory, Hanscom Air Force Base, Massachusetts, Publication PL-TR-92-2344, 57 p.
Wolf, M., and D. Wingham, 1992, The status of the worldÕs public-domain digital topo-graphy of the land and ice: Geophysical Research Letters, v. 19, n. 23, p. 2325-2328.
Yamaguchi, Y., H. Tsu, and H. Fujisada, 1993, A scientific basis of ASTER instrumentdesign: SPIE Proceedings, p. 150-160.
Yamaguchi, Y., A.B. Kahle, H. Tsu, T. Kawakami, and M. Pniel, 1998, Overview ofAdvanced Spaceborne Thermal Emission and Reflection Radiometer (ASTER): IEEETransactions on Geoscience and Remote Sensing, v. 36, n. 4, p. 1062-1071.

42
APPENDIX 6-1
MEMBERSHIP AND CHARTER OF THE ASTER DIGITAL ELEVATION MODELWORKING GROUP (ADEMWG)
(8/16/96)
MEMBERS
CO-CHAIR. Y. Miyazaki, Geological Survey of Japan, H. Murakami (Acting),Geographical Survey Institute of Japan; and Roy Welch, University of Georgia.
MEMBERS. M. Abrams, JPL; K. Arai, Saga University; B. Bailey, USGS; H.Lang, JPL; H. Maruyama, Geographical Survey Institute of Japan; S. Obayashi,Science University of Tokyo; T. Osanai, JAPEX Geoscience Institute; D. Pieri, JPL.
CHARTER
The purpose of the ASTER Digital Elevation Model Working Group (ADEMWG)is to provide:
a. Overall direction for the creation and validation of ASTER digitaltopographic models based on the ASTER stereo viewing capability.
b. A forum to explore and evaluate innovative techniques and applicationsfor ASTER stereo data.
The ADEMWG will review the Level 1 Data Working GroupÕs softwareimplementation activities in order to confirm that appropriate software routines are inplace prior to the EOS-AM1 Platform launch.
Some aspects of this effort include:1. Developing ASTER simulation test data sets for prelaunch algorithm
studies.2. Understanding platform stability, position knowledge, and jitter issues
with regard to DEM precision and accuracy, and providing sciencerequirement inputs to the EOS Project in that context.
3. Consulting with the ASTER instrument design team on DEM sciencerequirements.
4. Defining the ASTER DEM data product format.5. With the ASTER Level 1 (Geometry) Working Group, developing
specifications for the content and format of a Ground Control Point (GCP)library and recommending a process for building (ÒpopulatingÓ) the GCPlibrary.
6. With the Level 1 Working Group, recommending the coordinate systemand resolution to be used for Level 1 data products.

43
APPENDIX 6-2
AUTOMATIC STEREO CORRELATION ALGORITHM FOR GENERATING DEMs FROMDIGITAL STEREO DATA THAT WAS CONSIDERED FOR THE STEREOSAT MISSION(EXTRACTED FROM NATIONAL AERONAUTICS AND SPACE ADMINISTRATION,1979). THIS EXAMPLE IS PROVIDED AS AN ILLUSTRATION ONLY. THE ACTUALALGORITHM THAT WILL BE USED FOR ASTER AUTOMATIC STEREOCORRELATION WILL PROBABLY BE PROPRIETARY, IN DETAIL BECAUSE WE WILLUSE OFF-THE-SHELF COMMERCIAL SOFTWARE.
9.4 DIGITAL PHOTOGRAMMETRY
Because Stereosat images are already in digital format, and becausegeometric deviations between adjacent images are expected to be less than a singlepixel, it is an attractive idea to try to produce DEMs directly by digital cross-correlation.Similar efforts have been successful in part although somewhat expensive, so thistechnique may not be appropriate for mass production, but just for regions which areexceptionally interesting. Plans and preliminary results for such a procedure areoutlined below.
9.4.1 Method
The method actually used to compute DEMs from convergent line-arraystereo pairs is rather straightforward, but time-consuming. Essentially, a cross-correlation must be performed between one of the pictures, called the referenceimage, and the other, here called the displaced picture. Because only the componentof parallax which is parallel to the base-line (along-track) differs between the twopictures, in the ideal case a one-dimensional cross-correlation is adequate to computeparallax. In the real case we must expect residual geometric errors of about one pixelin the cross-track or scan direction caused by spacecraft attitude changes betweenpictures. Because of this, the cross-correlation window should probably measurethree pixels in the scan direction rather than one. The actual cross-correlationalgorithm for discrete images is given by
c (s, t, p) = i=-1
1å
j=-N
Nå REF (s+ i, t + j) DISP (s + i, t + j + p) (9-4)
where s and t are the pixel coordinates of the spot being evaluated in the scan andtrack directions, p is the parallax, 2N + 1 is the dimension of the correlation window inthe track direction, c is the cross-correlation coefficient, and REF and DISP arebrightness values or gray levels from the reference and displaced images. Thisexpression must be evaluated for all points in the reference image (s, t) and for all

44
parallaxes possible at each point. Because parallaxes are not generally integervalues, this latter requirement cannot be met. Instead, c for a sampling of possibleparallax values is evaluated, and the exact parallax is estimated by interpolating apolynomial least squares fit to the c values to find the maximum cross-correlation,which coincides with the best registration of the two images at the point (s, t) beingconsidered.
In practice, values of C may be normalized by the auto correlation of thereference image, so that
c (s, t, p) = i=-1
1
åj=-N
N
å REF (s + i, t + j) DISP (s + i, t + j + p)
i=-1
1
åj=-N
N
å REF s + i, t + j( )2(9-5)
This has the effect of removing regional brightness gradients from c, makinginterpretation of the performance of the algorithm simpler. Finally, it has provendesirable in the past to further remove the effects of brightness gradients and, in fact,brightness differences between equivalent points in the reference and displaceimages, using a high-pass filter. Brightness differences can easily develop in differentpictures of the same scene because of changes in the viewing angle. This is not truefor a Lambert surface because the decrease in radiative flux with oblique viewingangles is exactly compensated by the increased area of the IFOV; but, for different realsurfaces (e.g., a specular surface) brightness differences can be significant. The high-pass filter, which exaggerates edges and small detail and suppresses regionalbrightness variations, must be carefully chosen to minimize ringing and theintroduction of directional artifacts, as well as to avoid undue exaggeration of high-frequency noise. Thus if a uniform-weight or "box" filter is used, the cross-correlationalgorithm as implement is given by
c (s, t, p) = i=-1
1
åj=-N
N
å REF(s+i, t+ j) - (2m +1)-1(2n +1)-1
k=-m
må
j=-n
n
å REF(s+i+k, t+ j+l)
é
ëêê
ù
ûúú DISP(s+l, t+ j+p) - (2m +1)-1(2n +1)-1
k=-m
m
å i=-n
n
å DISP(s+i+k, t+ j+p+i)é
ëêê
ù
ûúú
l=-l
1
åj=-N
N
å REF(s+i, t+ j) - (2m +1)-1(2n +1)-1 k=-m
m
å l=-n
n
å REF(s+i+k, t+ j+p+i)é
ëêê
ù
ûúú
In practice, cross-correlation is performed on pictures which have been filteredalready. In this way, computational short-cuts in the filtering may be utilized, whichreduces running time.
Choice of the window sizes used in filtering (m and n) and in cross-correlation(N) may be left to the analyst and may, in fact, be varied from scene to scene. Choice

45
of the order of the polynomial used to fit the array of correlation coefficients at eachpixel (for different values of parallax) is also open, as is the number of c values used tospecify the polynomial. Computational costs increase with the number of points used,while, if the order is too high, stability of the solution is reduced (there may be spuriouspeaks in the polynomial). If the order is too low, resolution in the estimation of theactual parallax may be lost.
If, instead of interpolating to find the actual parallax, the nearest integer value ofparallax is adopted, then for a stereo pair consisting of a down-looking and an obliqueline-array image, the elevation may be measured only to the nearest 15 meters. Onthe other hand, by interpolating the parallax it should be possible to identify the bestregistration to within perhaps 0.25 pixels, leading to an elevation resolution of fourmeters.
It should be emphasized that the accuracy of this method is predicated onaccurate knowledge of spacecraft altitude and attitude. Consequently, while relativetopography maybe readily derived, DEMs of cartographic quality will probably requirefitting to several ground control points.

46
APPENDIX 6-3WHITE PAPER ON DEM PRODUCTION OPTIONS (9/27/94)
Options for the Production of DEMs as Standard ASTER DataProducts
byEOS ASTER Science Team Topographic Working Group
andLand Processes DAAC Topographic Data Team
1.0 Introduction
1.1 Purpose
The purpose of this paper is to endorse digital elevation models (DEMs),produced from ASTER stereo data at the Land Processes DAAC, as a stan-dard EOS data product. Furthermore, this paper presents the characteris-tics and estimated costs of three alternative production capabilitiesranging from 1 DEM per day to 25 DEMs per day.
1.2 Scope
This paper summarizes requirements for an ASTER DEM standard productand describes the components and characteristics of a representative DEMproduction system. Capability and cost options for an actual DAAC systemalso are provided. A basic assumption of this analysis is that the systemand capabilities endorsed here are intended to meet specific data process-ing and science requirements of individual users, and they are not intendedto be a "global DEM production system". However, it should be recognizedthat ASTER-based DEMs produced at the Land Processes DAAC would bearchived there, along with qualifying DEMs produced elsewhere, leading toa gradual buildup of a library of DEMs for areas from around the world.This paper is intended only as a contribution to the decision-making andplanning processing. Any necessary implementation documents will bewritten once a specific option is selected.
1.3 Background and Status
The general configuration of the Earth's land surface, including its reliefand the position of its natural features, is the physical earth propertycommonly referred to as "topography". In spite of being perhaps the mostfundamental and evident of Earth's geophysical properties, the detail andaccuracy with which the Earth's topography has been measured and des-

47
cribed, particularly on a global scale, is surprisingly poor. For example,the highest resolution topographic data, with global coverage and publicavailability in digital form, are the ETOP05 data which have elevationsposted every 10 kilometers.
Literally all disciplines of scientific study involving the Earth's landsurface exploit topographic data and/or their derivative measurements ofslope and aspect. In recent years, with growing public awareness of envi-ronmental issues and increasing emphasis on global change science, requi-rements for digital topographic data have both increased and become morerigorous. Certainly, this is the case as pertains to EOS, where new andvariably strict requirements have scientists, engineers, and program man-agers alike scrambling to identify existing and/or new DEMs with suffi-cient resolution and accuracy to meet their requirements.
Between now and the launch of EOS-AM1, the likelihood is good thatthere will be at least an order of magnitude improvement (to 1 km) in theresolution of the best available global DEM. Assuming public release ofthe Defense Mapping Agency's digital terrain elevation data (DTED), up to75% of the Earth's land surface will have DEM coverage available with100-meter grid spacing and vertical accuracy of 30 meters. Nevertheless,many important EOS-related DEM data requirements will remain unsatis-fied (Topographic Science Working Group, 1988). However, the opportunityexists to meet certain of the more rigorous requirements by producing, ona routine basis, some quantity of DEMs derived from stereo image dataacquired by ASTER.
2.0 Product Description
2.1 Definition
The ASTER DEM standard product will be a regular grid of elevation valuesrecorded in units of whole meters. The cell dimension (posting) will beeither 30 meters or 60 meters as described in the ASTER DEM ATBD. TheDEM, covering an area equal to the nadir image of 60 x 60 kilometers, willbe referenced in the UTM projection coordinate system. DEMs normallywill not be produced unless virtually cloud-free stereo data have beenacquired.
2.2 Accur acy and Scale
Accuracy of the absolute DEM product will be measured by calculation ofthe root mean square error (RMSE). The ASTER DEM Working Group has con-ducted several studies that show the expected vertical RMSE is in the 7-50 meter range. The number and accuracy of the control points used for

48
rectification of the stereo pair have a significant effect on the resultantDEM accuracy. The test results also show that a slope accuracy of 5 degr-ees should be attainable from ASTER DEMs when slopes are determinedover a measurement distance greater than 100 meters. The DEM WorkingGroup has estimated conservatively that ASTER DEMs will be useful formapping in the 1:100,000- to 1:250,000-scale range, and in some caseseven for 1:50,000-scale applications (Lang and Welch, 1994).
2.3 Relative or Absolute
The ASTER DEM will be absolute (in reference to mean sea level) whensuitable ground control points (with known X, Y, X) are available for rec-tification of the stereo pair. Topographic map sources ranging from1:25,000- to 1:100,000-scale should provide control of sufficient accu-racy for processing ASTER stereo data. When ground control is not avail-able, a relative DEM still may be produced.
3.0 Rationale and Justification
3.1 General Requirements
Topographic data requirements for EOS can be divided into two generalcategories: instrument and science. Instrument requirements are thoserelated to the processing of the sensor data to produce a set of radiomet-rically and geometrically corrected data products. DEM resolution andaccuracy requirements vary and depend primarily on the resolution of thesensor data being corrected. ASTER, MODIS, MISR, and CERES on the AM1Platform have instrument-related topographic data requirements, as doAIRS and EOSP (see Gesch, 1994).
Science requirements are those that relate to the ability of the userto develop and generate higher-order data products which present specificgeophysical variables or affect the user's ability to interpret scientificinformation or model physical processes. knowledge of slope needed incalculating basin run-off or in modeling the advance of a glacier andknowledge of elevation and aspect needed to model rate of snow melt arebut a few examples of the many and varied science requirements that willbe levied on topographic data during the EOS time frame. Here again, DEMresolution and accuracy requirements vary depending on research objec-tives and on sensor resolution. However, in general, science requirementslevied on topographic data are more rigorous than instrument require-ments because of the scale on which many processes of interest operate.Consequently, the significance of ASTER as a potential source of DEM datafor certain process-based and site-specific studies must be recognized.

49
3.2 Specific Requirements
In-depth analyses of general and specific topographic data requirementsfor EOS specifically, and earth science studies in general are presented byGesch (1994) and the NASA Topographic Science Working Group (1988),respectively. Such in-depth treatment of requirements is beyond thescope of this paper, suffice to say that the ASTER DEM has significantpotential for meeting certain identified EOS instrument and sciencetopographic data requirements, some of which are noted below.
Most MODIS and MISR topographic data requirements related to radio-metric and geometric correction can be met by a DEM with 100 meter gridspacing and a vertical accuracy of 30 meters (Gesch, 1994). As notedabove, a DEM that meets these criteria may be available for 75% of theEarth's land surface by EOS-AM1 launch. For the remainder of the Earth'sland surface, another source of digital topographic data will be required.ASTER-derived DEMs may be the only alternative, for some parts of theworld, with the potential to meet the grid spacing and vertical accuracyrequirements. Topographic data requirements for radiometric and geom-etric correction of ASTER data have not yet been definitively established.However, it is clear that the precision and accuracy of such correctionswill improve with higher resolution and more accurate DEMs. Conse-quently, availability of ASTER-derived DEMs for areas where DEMs with15-meter (or better) grid spacing and 7-meter to 50-meter vertical accu-racy do not exist will improve ASTER radiometric and geometric correc-tion capabilities. Furthermore, it is important to recognize that the pre-cision, accuracy, and ultimate usability of all subsequent products, gene-rated from radiometrically and/or geometrically corrected MODIS, MISR,or ASTER data are strongly influenced by the precision and accuracy ofthose initial corrections.
Specific examples of this latter point exist with respect to four orfive of the other Level 2 ASTER standard data products. These productseither generate atmospherically corrected radiances or use atmospheri-cally corrected ASTER data as input to the product. Consequently, theprecision and accuracy of those products will be greater in instanceswhere the DEMs used to correct the data had finer resolution grid spacingand greater vertical accuracy.
Thirteen of 29 EOS IDS teams have identified topographic dataspecifically as an input data set required for them to generate scienceproducts or interpret information from EOS data. Of these, seven teamshave indicated that some or all of their requirements can be met by ASTERDEMs. Examples of products or information required by IDS investigatorsinclude topographic elevation and slope, land surface roughness, ice sheetelevation, and volcano elevation. Clearly, selected production of ASTER

50
DEMs will contribute substantially to the ability of scientists to meaning-fully analyze EOS data and to make interpretations necessary forunderstanding global change processes.
3.3 DAAC Location Rationale
Substantial and significant EOS requirements exist for ASTER-derivedDEMs to be produced. Consequently, it is incumbent upon the EOSDIS pro-ject to provide that capability in support of EOS scientists, and it is onlylogical that such a capability be located at the Land Processes DAACwhere other ASTER data products are produced. This is not to say, how-ever, that ASTER DEMs should not be produced elsewhere by others quali-fied to do so. In fact, DEM generation by other science users and commer-cial entities should be encouraged as a mechanism to more rapidly expandcoverage by higher-resolution DEMs. Pursuant to this goal, the LPDAACshould establish and encourage population of a central DEM repository,leading to the gradual buildup of a library of DEMs, and perhaps associatedground control, thereby eliminating the necessity to recompute DEMs forthe same ground location. The institutional expertise resident at theDAAC would be applied not only to providing science support to users (andother producers) of ASTER DEMs, but also to setting standards and moni-toring the quality of DEMs produced by others for inclusion in the centralrepository.
4.0 Product Generation System
4.1 General Description
The ASTER DEM product generation system (PGS) will be located at theLPDAAC. The assumption here, as stated in the ASTER DEM AlgorithmTheoretical Basis Document (ATBD), is that the DEM PGS will be based oncommercial-off-the-shelf (COTS) components. Generation of DEMs fromdigital stereo imagery is a well established technique, and as such, thereis a good variety of fully functional systems offered commercially. Areview of the 1994 ASPRS Directory of the Mapping Sciences shows thatat least 15 vendors offer systems for DEM production.
ASTER Level 1 data will be the input for the ASTER DEM system. Ifground control point processing is not part of the standard Level 1processing (not currently planned), then the DEM system must have thecapability for selection and use of ground control points. if the DEMsystem needs control point capabilities, additional peripheral inputdevices (e.g., digitizing table or map scanner) would be required. If theLevel 1 ASTER stereo data are registered and geocoded before ingest to

51
the DEM system then the required functionality of the DEM software issimplified.
4.2 Key Elements and Options
4.2.1 Hardware
The available DEM packages run on a wide variety of hardware platforms,but the most common is the workstation class machine. Some systemsare also available for personal computers. While the choice of hardwarefor the DEM PGS ultimately will be based on the required throughputcapacity, it is envisioned that the package will reside on one or severalworkstations with network access to the necessary peripherals. SomeDEM packages make use of special image processing boards in addition tothe main CPU for the compute-intensive processing such as resamplingand correlation. Requirements for any special processing hardware willbe driven by the particular DEM production package selected.
An important hardware component for any DEM system is the stereodisplay. Stereo viewing of the source imagery is crucial for the operatorduring editing and validation stages of product generation. Graphics aresuperimposed in three dimensions to provide the operator with visualiza-tions of the DEM over the stereo pair. Several techniques are employed todisplay stereo images on a computer monitor, including passive displaywith polarized glasses and monitor, active display with shuttered glassessynchronized to the monitor, and anaglyphic display on a standard colormonitor viewed with anaglyphic glasses.
4.2.2 Software
The COTS DEM generation software must have a wide array of functional-ity. An important characteristic is that it must be able to handle variousforms of ASTER stereo data, i.e., single 60 x 60 km scenes and longerswaths. The system should allow production of a relative DEM in theabsence of suitable ground control, as described in the ASTER DEM ATBD.The system should be programmable to the greatest extent possible,allowing batch processing and stringing together the various stages ofDEM production, thus reducing the requirement for operator intervention.Computational speed and efficiency of the software also are critical char-acteristics, but the requirements for such are driven by the throughputcapacity ultimately specified for the DEM PGS.
It is envisioned that the most effective user interface will be onethat is highly graphical and intuitive in nature. This is especially impor-tant for the labor intensive functions which require an operator to inter-act extensively with imagery and graphics, such as control point selection

52
and DEM editing and validation. Features of the software which willenhance productivity and output product quality include: a diverse suite ofDEM editing and filtering tools; the ability to import and use ancillarytopographic information, such as geomorphic feature data derived formother sources, in the correlation and editing processes; creation and easyaccess to a "measurement quality" data set registered to the DEM as an aidfor editing and quality assurance; block adjustment of input imagery sothat available ground control can be extended to simultaneously correct ablock of adjacent scenes prior to correlation; expression of parallaxtranslated into DEM vertical units during editing to increase the operator'sintuitive feel for DEM quality; and selection of various correlationstrategies to that DEM generation can be optimized for specific image andterrain conditions.
4.2.3 Operations
Operation of the DEM PGS will be integrated into the larger LPDAAC prod-uct generation capability. As currently projected, the DEM PGS will be ofa smaller scale (one to several workstations) that can be run efficientlyby only one or two operators per shift. Much of the DEM generation pro-cess, especially resampling and correlation, can run unattended, so theoperator can perform the necessary interactive processing while justbeing available to monitor the background processing. Operators will berequired to have the necessary photogrammetric training and knowledge togenerate digital topographic data.
4.2.4 Quality Assurance
As outlined the ASTER DEM ATBD, validation will consist of quantitativecomparison of ASTER DEMs with highly accurate DEMs from other sourcesover selected test sites. Much of this work could be accomplished at theLPDAAC with the DEM PGS itself. The PGS should have wide ranging cap-abilities for visualization of the DEM and, if corresponding highly accurateDEMs exist, statistical reporting capabilities to fully describe the accu-racy and quality. Another useful quality assurance approach involvescreating and plotting derivative products from the DEM (slope, aspect,shaded relief, perspective views, basins, ridges, flowlines, etc.) as manytimes these products show evidence of data anomalies not readily seen inother standard representations of the DEM. Another important aspect ofquality assurance is the consistency of data in the overlap areas of adja-cent DEMs, and this must be monitored routinely.

53
4.2.5 Maintenance
System maintenance is to be provided by the vendors. Particularly impor-tant are resolution of problem reports, enhancement requests, andupgrades for the DEM generation software. Open access to the systemwould facilitate implementation of improvements to correlation, editingtools, or filtering routines developed at the LPDAAC or by the ASTERScience Team.
4.3 Scalability Issues
Of utmost importance for the DEM PGS residing at the LPDAAC is that it bescalable. If demand for ASTER DEMs is great, the system may have to beaugmented to increase its production capacity. The configuration mustnot be so rigid that the only way to increase capacity is to add complete,identical systems. A more economic and efficient approach would perhapsbe to just add the necessary software modules and hardware componentsand to operate subsystems for specific tasks, e.g., control point selection,resampling and correlation, visual editing, and output.
5.0 Capability and Cost Scenarios
5.1 Background
Numerous variable affect the production and cost of digital elevation datageneration. Data preprocessing, postprocessing, system functionality andcapability, quantity and quality production requirements, and the skill ofthe system operator(s) are some of the factors that can significantlyaffect production rates and costs. In this section, estimates are present-ed of the resources required to implement and maintain a digital elevationmodel (DEM) production capability at three levels: one scene per day, 10scenes per day, and 25 scenes per day. Work hour estimates are based onrecent experience in generating DEMs from satellite data, and they assumethat ground control point data which may be applied are readily availableto the operators.
5.2 One Scene Per Day (365 scenes per year)
A production level of one scene per day would enable the Program todevelop and maintain a high level of expertise, albeit limited to a smallnumber of individuals, and to meet a number of EOS-related requirementsfor DEM data. Production of one scene per day could be accomplished withone dedicated workstation, host computer, software and peripheraldevices, capable of performing image preprocessing, DEM generation and

54
postprocessing functions. It would require two operators performinginteractive tasks, primarily pre- and postprocessing tasks, about 80 hoursper week. (Six to eight hours of preprocessing, two to four hours ofpostprocessing, and one hour miscellaneous activities per scene.) Back-ground or batch tasks (DEM generation) would likely be ongoing 24 hoursper day.
Using current cost figures, acquisition of workstation with therequired capability likely would cost in the neighborhood of $150K. Twofull-time operators would be about $200K per year, and maintenance,supplies, and training about $25K per year. Based on the above estimatesand a five year life time, the yearly cost of this scenario is about $260K,or somewhat more than $700 per scene.
5.3 Ten Scenes Per Day (3650 scenes per year)
This level of production would meet most, if not all, of the EOS-relatedrequirements for DEM data. At this level of production, some economy ofscale could be realized. Both personnel requirements and hardware/soft-ware costs per DEM could be substantially reduced. Hardware, software,and personnel would perform specific tasks within the processing flowrather than end-to-end processing, and data could be processed moreefficiently; for example, processing swaths of imagery rather than singlescenes.
Using current cost figures, the total expenditure for hardware andsoftware would be in the neighborhood of $1 million. The system wouldrequire perhaps 15 to 17 full time personnel (about $1.7 million per year),and training, maintenance, and supplies would be about $100K per year.Based on the above estimates and a five year lifetime, the yearly cost ofthis scenario is about $2 million, or somewhat less than $550 per scene.
5.4 Twenty-five Scenes Per Day (9000 scenes per year)
At this level of production nearly every cloud free stereo pair of imageryacquired would be processed into a DEM. (ATBD for ASTER Digital Eleva-tion Models, Section 2.0.) Again, some economy of scale could be realized,but at this level of production estimates of costs or savings associatedwith individual system components would be very uncertain without muchmore extensive study. However, an assumption that the cost per unitproduct could be reduced by a factor 10 percent relative to the cost perunit product at the 10-scene-per-day production level is not unreasonable.
Based on the above assumption and a five year life time, the yearlycost of this scenario is about $4.5 million, or about $500 per scene.

55
6.0 Summary and Conclusions
Still at issue in the development of EOSDIS in general, and capabilities atthe Land Processes DAAC specifically, is the question of whether or not anASTER-based DEM will be provided as an ASTER standard data product.Prompt resolution of this issue is needed.
Generation of a global DEM is well beyond the scope and feasibility ofan ASTER standard product DEM generation capability. However, numerousimportant EOS instrument and science requirements exist, which are regi-onal or site-specific in scope and which have the potential of being met byan ASTER DEM. These requirements justify the development and imple-mentation of an ASTER DEM standard data product generation capability.Placement of such a production capability at the Land Processes DAAC isdictated by the logic of colocation with other ASTER standard productgeneration systems and ease of entry into a growing central repository ofglobally distributed DEMs.
At issue, then, is the size and scope of the ASTER DEM standard prod-uct generation system to be implemented. These should be determinedbased the best possible projection of user demand.
7.0 Selected ReferencesGesch, D.B., 1993, Identification of requirements and sources for global
digital topographic data, in Pecora 12 Symposium, Land Informationfrom Space-Based Systems, Sioux Falls, South Dakota, August 1993,Proceedings: Bethesda, Maryland, American Society for Photogramme-try and Remote Sensing, in press.
Gesch, D.B., 1994, Topographic data requirements for EOS global changeresearch: U.S. Geological Survey Open-File Report 94-626.
Lang, H.R., and Welch, R., 1994, Algorithm Theoretical Basis Document forASTER Digital Elevation Models: Jet Propulsion Laboratory, May 31,1994, draft report to the EOS Project.
Muller, J.P., 1993, Topography requirements for MODIS: University CollegeLondon, unpublished report.
Schier, M., ed., 1993, The science objectives of the Advanced SpaceborneThermal Emission and Reflectance Radiometer (ASTER): Jet PropulsionLaboratory, Pasadena, CA, unpublished report.
Science Processing Support Office (SPSO), 1992, Earth Observing Systemoutput data products and input requirements - version 2.0 (3 volumes):NASA Goddard Space Flight Center, Greenbelt, MD.
Topographic Science Working Group, 1988, Topographic science workinggroup report to the Land Processes Branch, Earth Science and Applica-tions Division, NASA Headquarters: Lunar and Planetary Institute,Houston, TX, 64 pp.

56
Wolf, M., and Wingham, D.J., 1992, A survey of the world's digital elevationdata Ñ Mullard Space Science Laboratory Report 4010/05-91/002:Mullard Space Science Laboratory, Dorking, Surrey, United Kingdom, 87pp.

57
APPENDIX 6-4
WHITE PAPER ON GCPs(4/14/94, BY EDC PERSONNEL)
GROUND CONTROL POINT LIBRARIES FOR THEPRECISION CORRECTION OF REMOTE SENSING IMAGERY
by D. R. Steinwand, C. E. Wivell, and L. R. Oleson
I. Introduction: The need for ground truth information
Spaceborne remote sensing imagery can provide a consistent, accurateview of the Earth's surface in a timely and repeatable fashion. Users ofthese data often wish to combine these data with data from other sourcesin a consistent geometric base, usually a map projection. This requiresprecision geometric correction, including terrain corrections, of thesatellite imagery, often to subpixel accuracy.
The geometric accuracy of the image is directly related to the accuracy ofthe geometry models and the ancillary information used in the correctionprocess. The geometric characteristics of the sensor (instrument) areusually well known and can be modelled accurately. When combined withsatellite position and attitude information, this usually yields imagerywith very good internal (relative) accuracy The absolute pixel-to-groundaccuracy however is directly related to the knowledge of the satellite'sposition and attitude at a given instant of time.
Future satellite remote sensing systems maybe able to achieve subpixelaccuracy using information directly from the satellite. However, mostsystems do not provide satellite position and attitude information withsufficient accuracy to achieve subpixel registration accuracy. For exam-ple, Landsat 4, 5 Thematic Mapper (TM) imagery which has been systemat-ically corrected (using no ground control) to a map projection with a pixelsize of 28.5 meters has been shown to be internally very accurate, butabsolute image-to-ground measurements are not (Thormodsgard andDeVries, 1983; Welch and Usery, 1984). AVHRR imagery can displayimage-to-ground accuracies of 5-8 km when systematically corrected to amap projection and 1 km pixels. In order to achieve subpixel image-to-ground accuracy, additional information is required. In these and in othercases, ground control points can be applied to refine the satellite's posi-tion and attitude information. A ground control point is simply the iden-

58
tification of a pixel in the image and it's corresponding geographic loca-tion (usually latitude, longitude, elevation). These locations are measuredto fractional pixel locations.
II. What is a GCP library and how is it used?
A ground control point library (GCPLIB) is a collection of image subwin-dows (often referred to as image "chips") which contain features that aremeasurable on some reference base (i.e., a map in many cases) for initial,manual selection, but that are also spectrally relevant to the matchingalgorithm in use. Each of these chips have associated with them a lati-tude, longitude, and elevation of a point marked in the chip, as well asother information as to the chip's origin and usage statistics. Usual sizesfor image chips are 32 by 32 pixels or 64 by 64 pixels, although othersizes may also be used. Figure 1 shows a sketched example of a Landsatcontrol point chip and associated information.
In general, the application of ground control points from a GCPLIB is asfollows:
1. Using the ephemeris and attitude information collected with thescene to be registered and a geometric model of the satellite andsensor (systematic model), the geographic extent of the imageryto be registered is calculated.
2. Image chips and their associated data that are located within thegeographic extent of the image are extracted from the GCPlibrary. In fully populated GCPLIBs, additional information (suchas band number or season/date) may be used to limit the numberof chips extracted from the library.
3. For each chip extracted from the GCPLIB, the approximate corres-ponding location in the raw image is calculated using the syste-matic model.
4. Before the typical matching algorithms can be applied the proj-ection and scale of the two surfaces to be matched must be thesame Ñ these matching algorithms can find displacements duemainly to translational errors; differences due to rotation orscaling effects can cause poor performance. Therefore, either theimage chip from the GCPLIB is mapped to the geometry of thecorresponding image neighborhood in the uncorrected image orvise versa.
5. Most current systems match GCPLIB chips with the imagery usingvariants of cross-correlation. One of the more commonly usedvariants is the normalized cross-correlation which adjusts thecorrelation surface for brightness differences in the image or

59
chip (Wood and Sellman, 1987; Kiss and others, 1981). Othervariants include various edge enhancement techniques or phase-only adjustments (Pearson and others, 1977).
6. After point matching, the resulting image offsets between loca-tions predicted by the systematic model and actual GCPLIB loca-tions are used to update the geometry model parameters (usuallytime, roll, pitch, yaw, altitude, and their rates). During thisupdate process, outliers or blunders in the matching process canbe identified by relating updated model parameters to knownphysical limits of those parameters. This assist in constrainingthe correction.
The geometric base of the GCPLIB should be given some consideration.Some GDPLIBs store chips in path-oriented, basically raw (not map proj-ected) geometry, whereas other GCPLIBs store ships in a map projection.Storing chips in a map projected format enhances their utility because thegeographic locations of all pixels in the chip are known, not just the pointselected for control pointing purposes. Storing a chip in a map projectionalso aids in the geometric transformation into raw image space asdescribed in step 4 above.
Various schools of thought exist as to the best features to select asground control point chips (Hogan and others, 1980). Some preferland/water interfaces due to the large contrast between the two; thislarge contrast often aids in the automated matching process. Othersprefer roads or other manmade features. The "best" feature is one thatperforms nicely with the matching algorithm used and one that does notchange with time. Changes in spectral signatures due to different sea-sons, changing water levels, tides, and human-induced changes(new/different roads, new water bodies, different crop types or conside-ration when determining the characteristics of the GCPLIB. Static libra-ries Ñ those that are built and left to run with little or no maintenance Ñmay degrade in performance as time goes on due to ground featurechanges. Some level of library maintenance or updates should therefore bebuilt into the design of a GCPLIB system.
III. The number of chips required for correction
The number of ground control points required to correct a satellite imageis dependent on a number of factors, such as the method used to geometri-cally correct the imagery, the stability of the sensor and satellite sys-tem, the accuracy of the knowledge of the attitude and ephemeris data,the accuracy of the control information, and the amount of cloud cover.

60
The two methods most commonly used to precisely geometrically correctsatellite imagery are the warping of a systematically corrected imageusing polynomials, and updating the ephemeris and attitude data used inthe satellite/sensor model. The image warping method first produces asystematic product (no ground control used) and then uses low order poly-nomials to fit ground control information to the systematic product. Thisresults in an image product which has been resampled twice, but can alsolead to problems in identifying outliers in the ground control points. Asimple polynomial fit does not relate the control points back to the physi-cal characteristics of the sensor/satellite, and may thus result in a "cor-rection" (warp) which is not characteristic of the sensor's geometry. Thismethod requires at least one control point for each of the coefficientsused in the polynomial and the control points must be distributed through-out the image. These constraints cause the number of control pointsrequired to warp an image to be in the 15 to 25 point range when loworder polynomials are used. In the second method, the correction of theephemeris and attitude assumes the errors in the imagery are caused bybiases mainly in the ephemeris and attitude data. This method requires atleast three control points to find correction values for the bias errors ofroll, pitch, yaw and altitude and the rates for the roll and pitch correctionvalues. The stability of the sensor and satellite system as well as theknowledge of the ephemeris and attitude are factors in the length of timefor which the assumption that the errors in the imagery are biases holds.The accuracy of the control points may require the use of a filter toreduce the error inherent in the control information. Thus, the number ofcontrol points as well as their sources may need to be greatly increaseddepending on the accuracy of the control. The percentage of cloud coverover a region and the number of control points are directly related, due tothe probability that a given control point may be covered by a cloud.
IV. Research topics
Much of the discussion to this point has been based on the experience ofthe staff at the EROS Data Center with the Landsat 2, 3 MSS GCPLIB, theLandsat 4, 5 MSS and TM GCPLIBs and various reference images of AVHRRimagery. The Landsat libraries have been of limited use and are not curr-ently used in a production process at EDC. These are path-oriented (notmap projected) and the libraries are static. The use of reference imagerywith AVHRR registrations has been very successful and is used in an aut-omated production process at EDC. The reference imagery for AVHRR ismerely a map projected reference image with acceptable registration.The matching process extracts chips from it rather than from a GCPLIB.
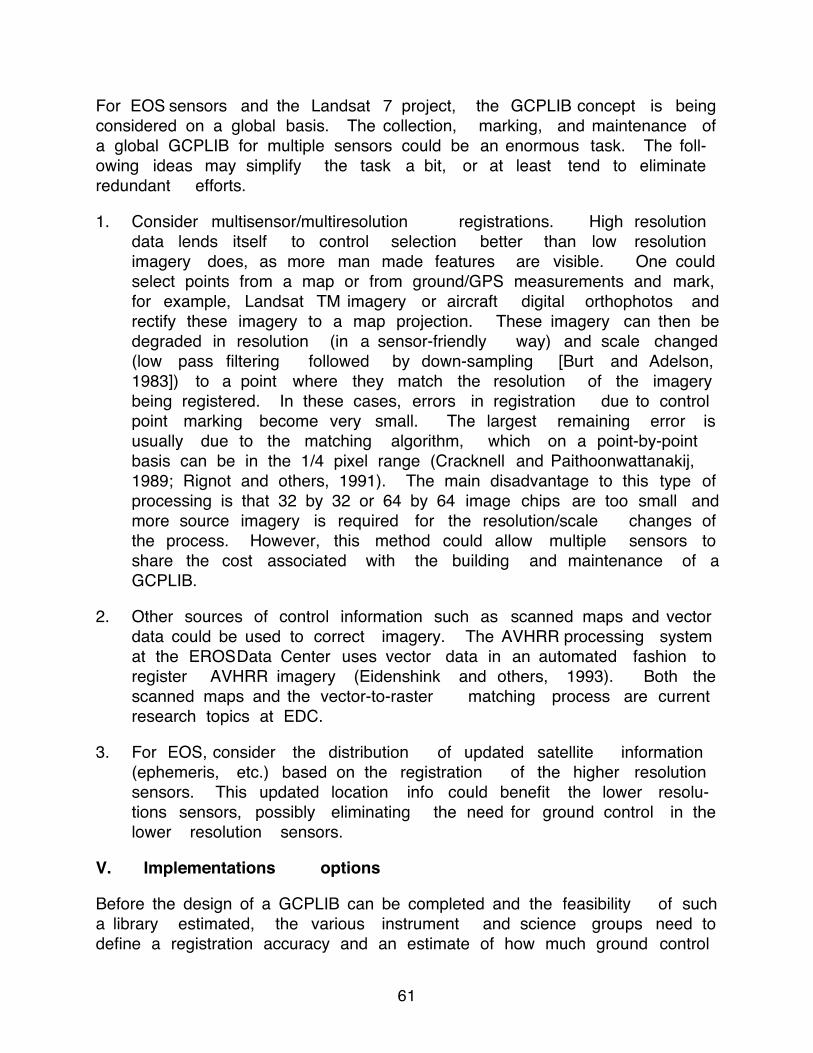
61
For EOS sensors and the Landsat 7 project, the GCPLIB concept is beingconsidered on a global basis. The collection, marking, and maintenance ofa global GCPLIB for multiple sensors could be an enormous task. The foll-owing ideas may simplify the task a bit, or at least tend to eliminateredundant efforts.
1. Consider multisensor/multiresolution registrations. High resolutiondata lends itself to control selection better than low resolutionimagery does, as more man made features are visible. One couldselect points from a map or from ground/GPS measurements and mark,for example, Landsat TM imagery or aircraft digital orthophotos andrectify these imagery to a map projection. These imagery can then bedegraded in resolution (in a sensor-friendly way) and scale changed(low pass filtering followed by down-sampling [Burt and Adelson,1983]) to a point where they match the resolution of the imagerybeing registered. In these cases, errors in registration due to controlpoint marking become very small. The largest remaining error isusually due to the matching algorithm, which on a point-by-pointbasis can be in the 1/4 pixel range (Cracknell and Paithoonwattanakij,1989; Rignot and others, 1991). The main disadvantage to this type ofprocessing is that 32 by 32 or 64 by 64 image chips are too small andmore source imagery is required for the resolution/scale changes ofthe process. However, this method could allow multiple sensors toshare the cost associated with the building and maintenance of aGCPLIB.
2. Other sources of control information such as scanned maps and vectordata could be used to correct imagery. The AVHRR processing systemat the EROS Data Center uses vector data in an automated fashion toregister AVHRR imagery (Eidenshink and others, 1993). Both thescanned maps and the vector-to-raster matching process are currentresearch topics at EDC.
3. For EOS, consider the distribution of updated satellite information(ephemeris, etc.) based on the registration of the higher resolutionsensors. This updated location info could benefit the lower resolu-tions sensors, possibly eliminating the need for ground control in thelower resolution sensors.
V. Implementations options
Before the design of a GCPLIB can be completed and the feasibility of sucha library estimated, the various instrument and science groups need todefine a registration accuracy and an estimate of how much ground control

62
will be required to obtain this accuracy. Consideration should be given topass processing, multisensor/resolution processing (the sharing ofresources described above), and cloud cover probabilities. Once the num-ber of control points needed per scene or pass is estimated, this estimateshould be extended to estimate the number of GCPs required for globalimage processing. The next task is to determine how this ground truthwill be collected and from what sources.
A. Fully populated and validated GCP libraries
The ideal GCP library for a given satellite/sensor system would be fullypopulated with precision corrected image chips of sufficient number anddistribution to support an automated correction processing operation andensure as consistent a level of accuracy as possible across all scenes.Such libraries require significant resources to develop and maintain.Typically, each point must be hand picked and validated. The actualnumber and distribution of these points will vary from system to systemand be dependent on factors such as the type of chips and correlation beingemployed, the resolution of the system, and whether the processing isorbital-segment- or scene-based. For global coverage systems, the popu-lation and validation of control points for some remote or poorly mappedgeographic regions can be particularly challenging. Although other datasources can serve as the source for control point chips, the ideal source isa sensor system's own data which, of course, delays the availability of afully populated library for some time after launch. Also, such librariesrequire continual update to maintain accuracies.
B. Partially populated and validated GCP libraries
Such libraries would also be populated with precision corrected imagechips of sufficient number and distribution to support an automated corr-ection processing operation and ensure as consistent a level of accuracyas possible, but only for portions of the full geographic extent of thesatellite/sensor system. The population of such libraries could beaccomplished by geographic regions, such as countries or continents, or byscientific study areas. The guidelines and procedures for developing andmaintaining partial coverage libraries would be the same as for the fullcoverage libraries allowing them to evolve to become a fully populatedlibrary.
C. User provided and validated GCP sets
In such cases, users are given the option of supplying their own GCP set(s)to the data producer for application during user product generation. The

63
data producer will typically place limits on the format any type of controlpoints accepted. The data producer might maintain an informal library ofcontributed GCP sets supplied by users but will not give any guaranteesregarding accuracy. The accuracy of the contributed control points is theresponsibility of the user, but once validated by the data producer, theseuser contributed GCP sets could become part of a formal partially popula-ted and validated GCP library.
VI. References
Burt, P., and Adelson, E., 1983, The Laplacian Pyramid as a compact image,IEEE Transactions on Communications, COM-31(4), 532-540.
Cracknell, A.P., and Paithoonwattanakij, K., 1989, Pixel and subpixel accu-racy in geometrical correction of AVHRR imagery, International Jour-nal of Remote Sensing, 19(4/5), 661-667.
Eidenshink, J.C., Steinwand, D.R., Wivell, C.E., Hollaren, D.M., and Meyer, D.J.,1993, Processing techniques for global land 1-km AVHRR data, Proce-edings of Pecora 12 Symposium on Land Information from Space-basedSystems, August, 1993.
Hogan, Markarian, Shipman, and Spieler, 1980, GCP location enhancementstudy, IBM Corporation, NASA Contract NAS5-25509, Goddard SpaceFlight Center.
Kiss, P., Arnold, P., and Golstine, J., 1981, Image registration system inthe Landsat-D production environment, Proceedings of the 1981Machine Processing of Remotely Sensed Data Symposium.
Pearson, J., Hines, D., Golosman, S., and Kuglin, C., 1977, Video-rate imagecorrelation process, SPIE, 119, 197-205.
Rignot, E., Kowk, R., Curlander, J., and Pang, S., 1991, Automated multisen-sor registration: Requirements and techniques, Photogrammetric Eng-ineering and Remote Sensing, 57(8), 1029-1038.
Thormodsgard, J.M., and DeVries, D.J., 1983, Geocoding accuracy of Landsat4 multispectral scanner and thematic mapper data, Proceedings Land-sat 4 Science Characterization Early Results Symposium, pp. 132-142.
Welch, R., and Usery, E.L., 1994, Cartographic accuracy of Landsat 4 MSSand TM image data, IEEE Transactions on Geoscience and RemoteSensing, GE-22(3), 281-288.

64
Wood, L., and Sellman, A.N., 1987, State of the art survey of automatedregistration and control point chip library systems, Final report number323901-1-F, ERIM, Ann Arbor, Michigan, August.

65
APPENDIX 6-5
UNITED STATES NATIONAL MAP ACCURACY STANDARDS(EXTRACTED FROM BUREAU OF THE BUDGET, 1947)
With a view to the utmost economy and expedition in producing maps whichfulfill not only the broad needs for standard or principal maps, but also the reasonableparticular needs of individual agencies, standards of accuracy for published maps aredefined as follows:
1. Horizontal accuracy. For maps on publication scales larger than 1:20,000,not more than 10% of the points tested shall be in error by more than 1/30inch, measured on the publication scale; for maps on publication scales of1:20,000 or smaller, 1/50 inch. These limits of accuracy shall apply in allcases to positions of well-defined points only. Well-defined points arethose that are easily visible or recoverable on the ground, such as thefollowing: monuments or markers, such as bench marks, propertyboundary monuments; intersections of roads, railroads, etc.; corners oflarge buildings or structures (or center points of small buildings); etc. Ingeneral, what is well-defined will also be determined by what is plottableon the scale of the map within 1/100 inch. Thus, while the intersection oftwo road or property lines meeting at right angles, would come within asensible interpretation, identification of the intersection of such linesmeeting at an acute angle would obviously not be practicable within 1/100inch. Similarly, features not identifiable upon the ground within close limitsare not to be considered as test points within the limits quoted, eventhough their positions may be scaled closely upon the map. In this classwould come timber lines, soil boundaries, etc.
2. Vertical accuracy, as applied to contour maps on all publication scales,shall be such that not more than 10% of the elevations tested shall be inerror more than one-half the contour interval. In checking elevations takenfrom the map, the apparent vertical error may be decreased by assuming ahorizontal displacement within the permissible horizontal error for a map ofthat scale.
3. The accuracy of any map may be tested by comparing the positions ofpoints whose locations or elevations are shown upon it with correspondingpositions as determined by surveys of a higher accuracy. Tests shall bemade by the producing agency, which shall also determine which of itsmaps are to be tested, and the extent of such testing.
4. Published maps meeting these accuracy requirements shall note this factin their legends, as follows: "This map complies with National MapAccuracy Standards."
5. Published maps whose errors exceed those aforestated shall omit fromtheir legends all mention of standard accuracy.

66
6. When a published map is a considerable enlargement of map drawing(manuscript) or of a published map, that fact shall be stated in the legend.For example, "This map is an enlargement of a 1:20,000-scale mapdrawing", or "This map is an enlargement of a 1:24,000-scale publishedmap".
7. To facilitate ready interchange and use of basic information for mapconstruction among all Federal mapmaking agencies, manuscript mapsand published maps, wherever economically feasible and consistent withthe use to which the map is to be put, shall conform to latitude andlongitude boundaries, being 15 minutes of latitude and longitude, or 7-1/2minutes, or 3-3/4 minutes in size.

67
APPENDIX 6-6
DEFINITION OF ROOT MEAN SQUARE ERROR WITH RESPECT TO CARTOGRAPHYExtracted from American Society for Photogrammetry and Remote Sensing, 1990
The "root mean square" (rms) error is defined to be the square root of the averageof the squared discrepancies. In this case, the discrepancies are the differences incoordinate or elevation values as derived from the map and as determined by anindependent survey of higher accuracy (check survey). For example, the rms error inthe X coordinate direction can be computed as:
rmsx = D2/n where:
D2 = d12 + d22 + ....... + dn2
d = discrepancy in the X coordinate direction= Xmap - Xcheck
n = total number of points checked on the map in the X coordinatedirection

68
APPENDIX 6-7
ASPRS ACCURACY STANDARDS FOR LARGE-SCALE MAPSExtracted from American Society for Photogrammetry and Remote Sensing, 1990.
1. Horizontal Accuracy:
Horizontal map accuracy is defined as the rms error in terms of the project's
planimetric survey coordinates (X,Y) for checked points as determined at full (ground)
scale of the map. The rms error is the cumulative result of all errors including those
introduced by the processes of ground control surveys, map compilation and final
extraction of grund dimensions from the map. The limiting rms errors are the maximum
permissible rms errors established by this standard. These limiting rms errors for
Class 1 maps are tabulated in Table 1E (feet) and Table 1M (meters) along with typical
map scales associated with the limiting errors. These limits of accuracy apply to tests
made on well-defined points only.
Table 1E. Planimetric coordinate accuracy requirement (ground X or Y in
feet) for well-defined points - Class 1 maps
PLANIMETRIC (X OR Y) ACCURACY
(limiting rms error, feet) TYPICAL MAP SCALE
0.05 1:60
0.1 1:120
0.3 1:360
0.4 1:480
0.5 1:600
1.0 1:1200
2.0 1:2400
4.0 1:4800
5.0 1:6000
8.0 1:9600
10.0 1:12000
16.7 1:20000

69
Table 1M. Planimetric coordinate accuracy requirement (ground X or Y
in meters) for well-defined points - Class 1 maps
PLANIMETRIC (X OR Y) ACCURACY
(limiting rms error, meters) TYPICAL MAP SCALE
0.0125 1:50
0.025 1:100
0.050 1:200
0.125 1:500
0.25 1:1000
0.50 1:2000
1.00 1:4000
1.25 1:5000
2.50 1:10000
5.00 1:20000
2. Vertical Accuracy:
Vertical map accuracy is defined as the rms error in elevation in terms of the
project's elevation datum for well-defined points only. For Class 1 maps the limiting
rms error in elevation is set by the standard at one-third the indicated contour interval
for well-defined points only. Spot heights shall be shown on the map within a limiting
rms error of one-sixth of the contour interval.
3. Lower-Accuracy Maps:
Map accuracies can also be defined at lower spatial accuracy standards. Maps
compiled within limiting rms errors of twice or three times those allowed for a Class 1
map shall be designated Class 2 or Class 3 maps respectively. A map may be
compiled that complies with one class of accuracy in elevation and another in plan.
Multiple accuracies on the same map are allowed provided a diagram is included
which clearly relates segments of the map with the appropriate map accuracy class.