astronomy c eso 2016 astrophysics - digital.csic:...
TRANSCRIPT
A&A 588, A59 (2016)DOI: 10.1051/0004-6361/201527307c© ESO 2016
Astronomy&
Astrophysics
Photometry of dust grains of comet 67P and connectionwith nucleus regions
G. Cremonese1, E. Simioni1,15, R. Ragazzoni1, I. Bertini2, F. La Forgia3, M. Pajola2, N. Oklay4, S. Fornasier5,M. Lazzarin3, A. Lucchetti1,2, H. Sierks4, C. Barbieri3, P. Lamy6, R. Rodrigo7,8, D. Koschny9, H. Rickman10,11,
H. U. Keller12, M. F. A’Hearn13,4, J. Agarwal4, M. A. Barucci5, J. -L. Bertaux14, V. Da Deppo15, B. Davidsson10,M. De Cecco16, S. Debei17, M. Fulle18, O. Groussin6, C. Güttler4, P. J. Gutierrez19, S. F. Hviid20, W.-H. Ip21, L. Jorda6,
J. Knollenberg20, J.-R. Kramm4, M. Kueppers22, E. Kürt20, L. M. Lara19, S. Magrin3, J. J. Lopez Moreno19,F. Marzari3, S. Mottola20, G. Naletto23,16,2, F. Preusker20, F. Scholten20, N. Thomas24, C. Tubiana4, and J.-B. Vincent4
1 INAF-Astronomical Observatory of Padova, Vicolo dell’Osservatorio 5, 35131 Padova, Italye-mail: [email protected]
2 Center of Studies and Activities for Space (CISAS) “G. Colombo”, University of Padova, via Venezia 15, 35131 Padova, Italy3 Dipartimento di Fisica e Astronomia, University of Padova, Vic. Osservatorio 3, 35122 Padova, Italy4 Max-Planck-Institut für Sonnensystemforschung, Justus-von-Liebig-Weg 3, 37077 Göttingen, Germany5 LESIA, Observatoire de Paris, PSL Research University, CNRS, Sorbonne Universités, Univ. Paris Diderot, Sorbonne Paris Cité,
UPMC Univ. Paris 06, 5 place J. Janssen, 92195 Meudon Pricipal Cedex, France6 Aix-Marseille Université, CNRS LAM (Laboratoire d’Astrophysique de Marseille), UMR 7326, 13388 Marseille, France7 Centro de Astrobiologia, CSIC-INTA, 28850 Torrejon de Ardoz, Madrid, Spain8 International Space Science Institute, Hallerstrasse 6, 3012 Bern, Switzerland9 Scientific Support Office, European Space Research and Technology Centre/ESA, Keplerlaan 1, Postbus 299,
2201 AZ Noordwijk ZH, The Netherlands10 Department of Physics and Astronomy, Uppsala University, Box 516, 75120 Uppsala, Sweden11 PAS Space Research Center, Bartycka 18A, 00716 Warszawa, Poland12 Institut für Geophysik und extraterrestrische Physik, TU Braunschweig, 38106 Braunschweig, Germany13 University of Maryland, Department of Astronomy, College Park, MD 20742-2421, USA14 LATMOS, CNRS/UVSQ/IPSL, 11 boulevard d’Alembert, 78280 Guyancourt, France15 CNR-IFN UOS Padova LUXOR, via Trasea 7, 35131 Padova, Italy16 University of Trento, via Sommarive 9, 38123 Trento, Italy17 Department of Industrial Engineering, University of Padova, via Venezia 1, 35131 Padova, Italy18 INAF Osservatorio Astronomico di Trieste, via Tiepolo 11, 34014 Trieste, Italy19 Instituto de Astrofísica de Andalucía-CSIC, 18008 Granada, Spain20 Deutsches Zentrum für Luft- und Raumfahrt (DLR), Institut für Planetenforschung, Rutherfordstrasse 2, 12489 Berlin, Germany21 National Central University, Graduate Institute of Astronomy, 300 Chung-Da Rd, 32054 Chung-Li, Taiwan22 Operations Department, European Space Astronomy Centre/ESA, PO Box 78, 28691 Villanueva de la Canada, Madrid, Spain23 Department of Information Engineering, University of Padova, via Gradenigo 6/B, 35131 Padova, Italy24 Physikalisches Institut der Universität Bern, Sidlerstr. 5, 3012 Bern, Switzerland
Received 4 September 2015 / Accepted 19 January 2016
ABSTRACT
Aims. Multiple pairs of high-resolution images of the dust coma of comet 67P/Churyumov-Gerasimenko have been collected byOSIRIS onboard Rosetta allowing extraction and analysis of dust grain tracks.Methods. We developed a quasi automatic method to recognize and to extract dust tracks in the Osiris images providing size, FWHMand photometric data. The dust tracks characterized by a low signal-to-noise ratio were checked manually. We performed the photo-metric analysis of 70 dust grain tracks observed on two different Narrow Angle Camera images in the two filters F24 and F28, centeredat λ = 480.7 nm and at λ = 743.7 nm, respectively, deriving the color and the reddening of each one. We then extracted several imagesof the nucleus observed with the same filters and with the same phase angle to be compared with the dust grain reddening.Results. Most of the dust grain reddening is very similar to the nucleus values, confirming they come from the surface or subsurfacelayer. The histogram of the dust grain reddening has a secondary peak at negative values and shows some grains with values higherthan the nucleus, suggesting a different composition from the surface grains. One hypothesis comes from the negative values point atthe presence of hydrated minerals in the comet.
Key words. comets: general – comets: individual: 67P/Churyumov-Gerasimenko
Article published by EDP Sciences A59, page 1 of 8

A&A 588, A59 (2016)
Table 1. Name of the NAC-OSIRIS images utilized for the dust grainsanalysis.
Image nameNAC-2014-09-10T03.59.24.765Z-ID20-1397549900-F28NAC-2014-09-10T03.59.44.755Z-ID20-1397549000-F24NAC-2014-09-10T04.04.24.802Z-ID30-1397549600-F28NAC-2014-09-10T04.04.44.787Z-ID20-1397549700-F24NAC-2014-09-10T04.09.24.793Z-ID20-1397549300-F28NAC-2014-09-10T04.09.44.759Z-ID20-1397549400-F24NAC-2014-09-10T04.14.24.786Z-ID20-1397549000-F28NAC-2014-09-10T04.14.44.781Z-ID20-1397549100-F24NAC-2014-09-10T04.19.24.758Z-ID20-1397549700-F28NAC-2014-09-10T04.19.44.797Z-ID20-1397549800-F24NAC-2014-09-10T04.24.24.824Z-ID20-1397549400-F28NAC-2014-09-10T04.24.44.754Z-ID20-1397549500-F24
1. Introduction
Comets are known to be the most pristine objects in our solarsystem. Their study therefore provides unique knowledge of thematerials and the processes that formed and shaped the earlysolar nebula, leading then to form planets and moons.
Comets have two main constituents: refractory dust andvolatile solid ices. Although historically these objects were con-sidered as dirty snowballs with ices as main matrix component,there is evidence that in many cases the dust is comparable inmass to the ice, if not even dominant (Küppers et al. 2005).
The ESA Rosetta mission has been orbiting the Jupiter-family comet 67P/Churyumov-Gerasimenko (67P) since the be-ginning of August 2014. The instruments onboard the space-craft are providing an unprecedented view of a cometary nucleusand its inner coma environment. Among these instruments, theOSIRIS two-camera telescope (Keller et al. 2007) is giving avivid picture of the dust surrounding the nucleus. A previousstudy of the dust/ice ratio in comet 67P, using remote and in situRosetta instruments data, proved that the dust is dominant withthe aforementioned ratio ∼4 (Fulle et al. 2015a). Thus the knowl-edge of the composition of the dust particles released from thenucleus tell us what the components of the abundant refractorymaterials are that form the comet and what the relationship iswith the surface materials. This provides hints about the dust re-lease process in the comet and the mechanisms that are regulat-ing the onset of the activity. Recently, Schulz et al. (2015) ana-lyzed several dust grains collected with the COSIMA instrumentand found that at heliocentric distances greater than 3 AU, suchgrains are most likely coming from a dusty crust that quenchesthe material outflow activity at the comet surface. After reach-ing a heliocentric distance lower than 3 AU, the nucleus wouldthen shed its mantle, and unprocessed material starts to supplythe developing coma, radically changing its dust component.
During its continuous monitoring of the nucleus and innercoma, OSIRIS took several images of dust grains. We focus ouranalysis on images acquired on 10 September 2014, when 67Pwas at heliocentric distance rh = 3.395 AU and Rosetta wasabout 29 km from the comet. The images were acquired withthe Narrow Angle Camera (NAC) in the blue (F24, centered at480.7 nm) and in the red (F28, centered at 743.7 nm) filters. InTable 1 we report the names of the images utilized. The imageswere acquired every 20 s with an exposure time of about sixseconds. All the images were obtained at a phase angle of 93◦.
We analyzed six pairs of images and found 70 grain tracks.No track is visible on more than one pair, where we measuredthe photometry of each track and derived their reddening color,
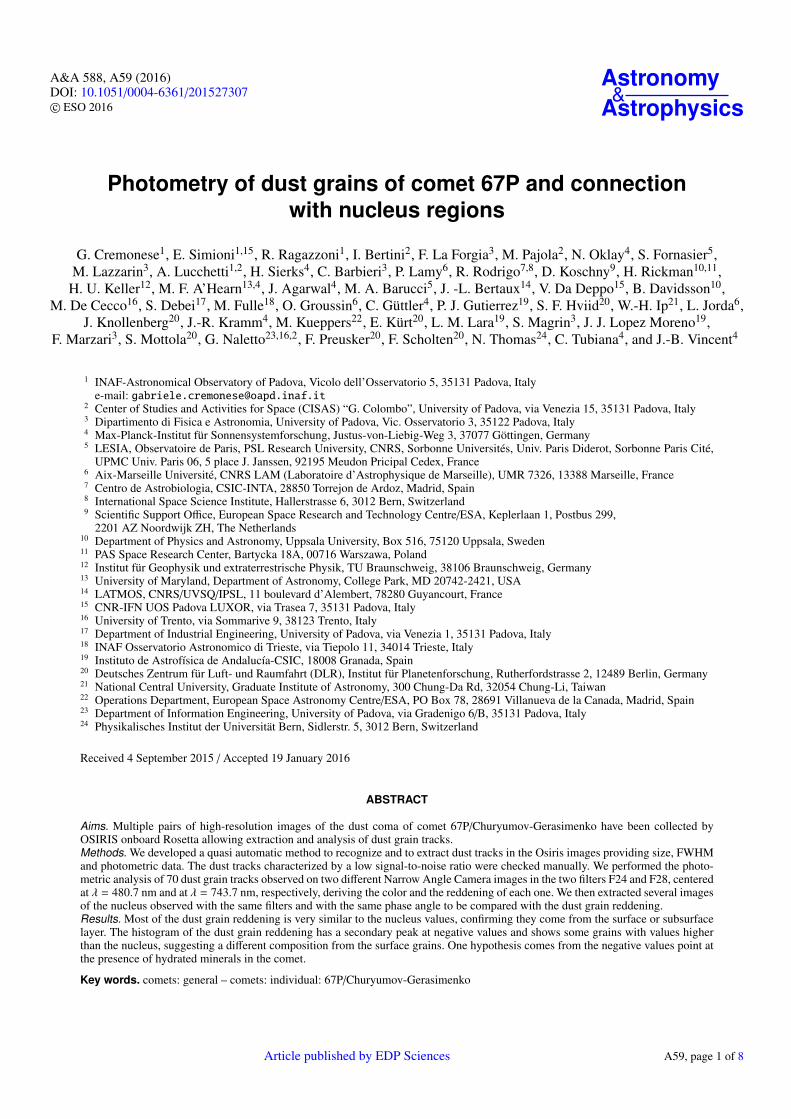
Fig. 1. a) An example of the result of the Laplace filtering of the dif-ference of two following NAC images. b) Boolean mask of the graintrack identified by the definition of an adequate threshold. c) Result ofthe dilatation process. Finally, d) shows the result (after erosion filter-ing). In red is the isocurve of the border of the grain and in green theellipsoid fit (expanded for visibility) used to distinguish the grain fromother features by eccentricity.
both giving clues to their composition. We decided to only workon this set of images, even if OSIRIS obtained several other setsof images of the dust grains in subsequent months, but with dif-ferent phase angles, distances from the comet, and heliocentricdistances. This would have meant adding more uncertainties intothe statistics and the comparison because of the different physi-cal and thermal conditions during the observations. Moreover,the grain photometry was compared with nucleus colors ob-tained with the same observational geometry as the grain datain order to constrain the possible source on the surface. The re-sults of our analysis are shown in this paper.
2. Data analysis
The main aim of this work is to perform a photometric analysisof the dust tracks visible on pairs of images obtained with differ-ent filters, thereby i) getting the reddening of each dust grain andii) comparing it with the reddening of some nuclear region. Toapply the same procedure for extracting the track size, we real-ized a semi-automatic method of recognizing the tracks on bothimages and making the photometric calculations in a similar wayto aperture stellar photometry.
A Laplace filtering is used to detect the regions in which thepresence of a grain generates a peak in the second spatial deriva-tive of the image. The signal-to-noise ratio (S/N) of the faintesttracks is around three, which makes difficult to detect them au-tomatically with respect to the sky background; moreover, sometracks have a few pixels along their length with lower S/N pro-ducing interruptions along the track, when using a fixed thresh-old in the S/N. To avoid this problem, a Boolean mask is appliedto the images assuming a threshold chosen with a trial-and-errorprocedure because of the different background between the im-ages. The masks pass through a process of morphologic operatordilatation and erosion (see Fig. 1) to fill the interruptions due tothe noise and grain rotation (Fulle et al. 2015b).
At the end of this process, the obtained Boolean mask is con-sidered as float function with codomain between 0 and 1. The
A59, page 2 of 8
G. Cremonese et al.: Photometry of dust grains of comet 67P and connection with nucleus regions
Fig. 2. Definition of the trapezoid that approximates a grain signal bothin FWHM a) and length b) definition. Blue indicates the image signalwith a cross signature for selected points, an empty circle for outliers,and in green the first and second approximations of the stretch.
boundary of the track is defined as the isocurve of the functionwith value 0.5 to define the correct grain track. This procedureallows the grain tracks to be defined automatically in any sin-gle image. During this process even some noise peaks and starsmight be considered as grains. Fitting the obtained curves withellipses (see Fig. 1d) allows separating the grain track from thenoise, or star, thereby imposing a lower limit on the eccentricityof the ellipses. Each track is divided locally in columns or rows,depending on whenever the inclination of the track on the frameis larger or lower than 45◦, and generating local sections of thetrack. Owing to pixel discretization, all the columns represent afunction with a maximum next to the center of the track. The setof peaks in the sections can be used to define the effective incli-nation of the same track. This information is needed to rotate theimage domain in order to have track length on the x-axis. Thisallows a horizontal slide of the rotated image, which can be usedfor defining the length (see Fig. 2).
The signal is now used to fit the grain track by an isoscelestrapezoid along the direction of the moving grain through thefollowing steps:
1. Definition of a centroid;2. Definition of the best fit with a trapezoid centered on the cen-
troid (first estimate affected by the definition of the centroid);
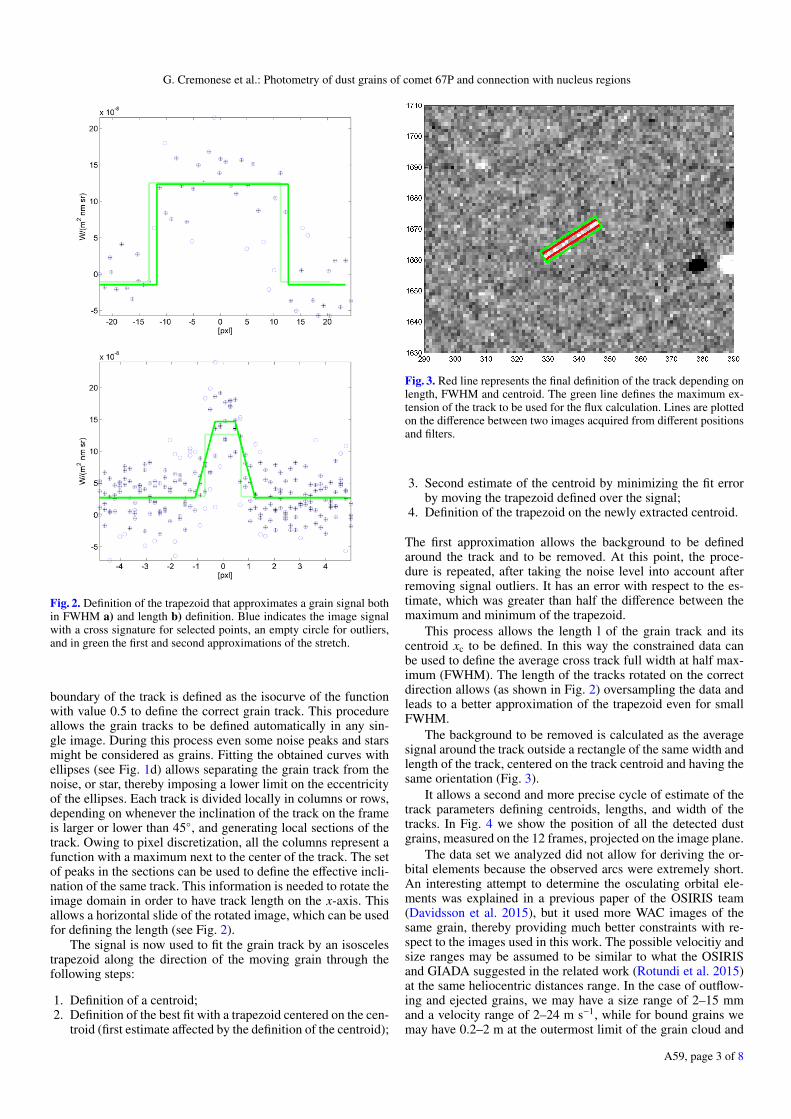
Fig. 3. Red line represents the final definition of the track depending onlength, FWHM and centroid. The green line defines the maximum ex-tension of the track to be used for the flux calculation. Lines are plottedon the difference between two images acquired from different positionsand filters.
3. Second estimate of the centroid by minimizing the fit errorby moving the trapezoid defined over the signal;
4. Definition of the trapezoid on the newly extracted centroid.
The first approximation allows the background to be definedaround the track and to be removed. At this point, the proce-dure is repeated, after taking the noise level into account afterremoving signal outliers. It has an error with respect to the es-timate, which was greater than half the difference between themaximum and minimum of the trapezoid.
This process allows the length l of the grain track and itscentroid xc to be defined. In this way the constrained data canbe used to define the average cross track full width at half max-imum (FWHM). The length of the tracks rotated on the correctdirection allows (as shown in Fig. 2) oversampling the data andleads to a better approximation of the trapezoid even for smallFWHM.
The background to be removed is calculated as the averagesignal around the track outside a rectangle of the same width andlength of the track, centered on the track centroid and having thesame orientation (Fig. 3).
It allows a second and more precise cycle of estimate of thetrack parameters defining centroids, lengths, and width of thetracks. In Fig. 4 we show the position of all the detected dustgrains, measured on the 12 frames, projected on the image plane.
The data set we analyzed did not allow for deriving the or-bital elements because the observed arcs were extremely short.An interesting attempt to determine the osculating orbital ele-ments was explained in a previous paper of the OSIRIS team(Davidsson et al. 2015), but it used more WAC images of thesame grain, thereby providing much better constraints with re-spect to the images used in this work. The possible velocitiy andsize ranges may be assumed to be similar to what the OSIRISand GIADA suggested in the related work (Rotundi et al. 2015)at the same heliocentric distances range. In the case of outflow-ing and ejected grains, we may have a size range of 2–15 mmand a velocity range of 2–24 m s−1, while for bound grains wemay have 0.2–2 m at the outermost limit of the grain cloud and
A59, page 3 of 8
A&A 588, A59 (2016)
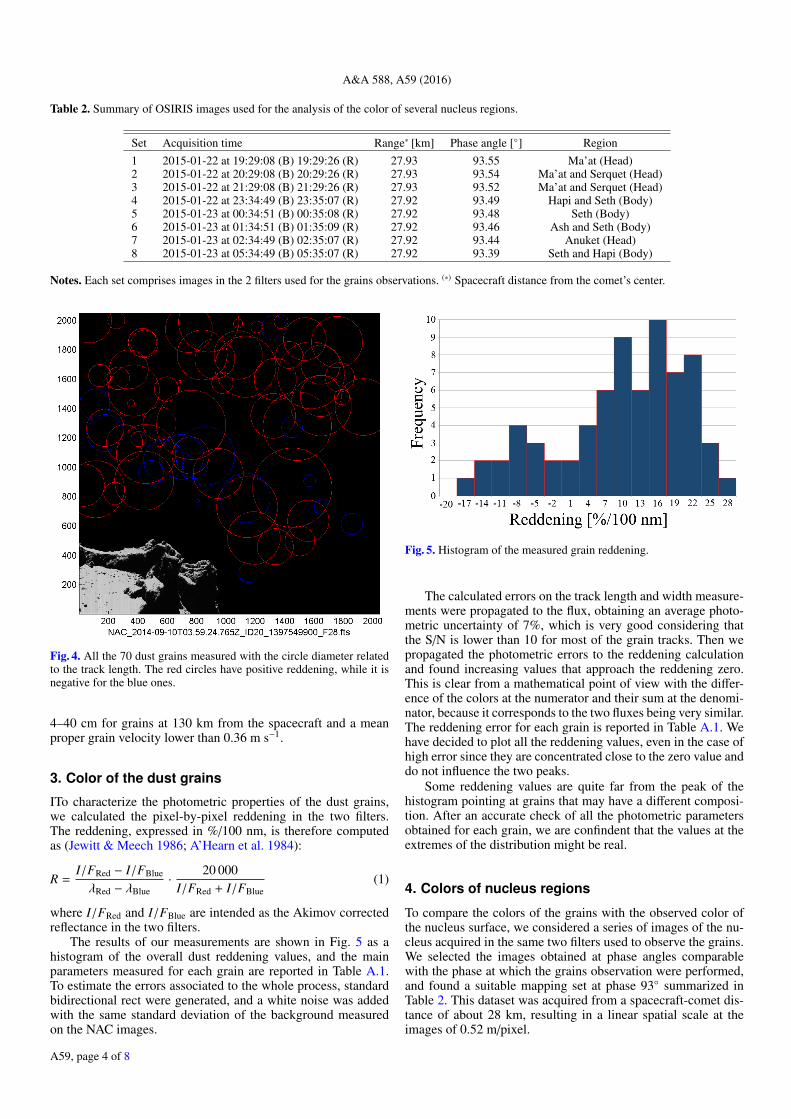
Table 2. Summary of OSIRIS images used for the analysis of the color of several nucleus regions.
Set Acquisition time Range∗ [km] Phase angle [◦] Region1 2015-01-22 at 19:29:08 (B) 19:29:26 (R) 27.93 93.55 Ma’at (Head)2 2015-01-22 at 20:29:08 (B) 20:29:26 (R) 27.93 93.54 Ma’at and Serquet (Head)3 2015-01-22 at 21:29:08 (B) 21:29:26 (R) 27.93 93.52 Ma’at and Serquet (Head)4 2015-01-22 at 23:34:49 (B) 23:35:07 (R) 27.92 93.49 Hapi and Seth (Body)5 2015-01-23 at 00:34:51 (B) 00:35:08 (R) 27.92 93.48 Seth (Body)6 2015-01-23 at 01:34:51 (B) 01:35:09 (R) 27.92 93.46 Ash and Seth (Body)7 2015-01-23 at 02:34:49 (B) 02:35:07 (R) 27.92 93.44 Anuket (Head)8 2015-01-23 at 05:34:49 (B) 05:35:07 (R) 27.92 93.39 Seth and Hapi (Body)
Notes. Each set comprises images in the 2 filters used for the grains observations. (∗) Spacecraft distance from the comet’s center.
Fig. 4. All the 70 dust grains measured with the circle diameter relatedto the track length. The red circles have positive reddening, while it isnegative for the blue ones.
4–40 cm for grains at 130 km from the spacecraft and a meanproper grain velocity lower than 0.36 m s−1.
3. Color of the dust grains
ITo characterize the photometric properties of the dust grains,we calculated the pixel-by-pixel reddening in the two filters.The reddening, expressed in %/100 nm, is therefore computedas (Jewitt & Meech 1986; A’Hearn et al. 1984):
R =I/FRed − I/FBlue
λRed − λBlue·
20 000I/FRed + I/FBlue
(1)
where I/FRed and I/FBlue are intended as the Akimov correctedreflectance in the two filters.
The results of our measurements are shown in Fig. 5 as ahistogram of the overall dust reddening values, and the mainparameters measured for each grain are reported in Table A.1.To estimate the errors associated to the whole process, standardbidirectional rect were generated, and a white noise was addedwith the same standard deviation of the background measuredon the NAC images.
Fig. 5. Histogram of the measured grain reddening.
The calculated errors on the track length and width measure-ments were propagated to the flux, obtaining an average photo-metric uncertainty of 7%, which is very good considering thatthe S/N is lower than 10 for most of the grain tracks. Then wepropagated the photometric errors to the reddening calculationand found increasing values that approach the reddening zero.This is clear from a mathematical point of view with the differ-ence of the colors at the numerator and their sum at the denomi-nator, because it corresponds to the two fluxes being very similar.The reddening error for each grain is reported in Table A.1. Wehave decided to plot all the reddening values, even in the case ofhigh error since they are concentrated close to the zero value anddo not influence the two peaks.
Some reddening values are quite far from the peak of thehistogram pointing at grains that may have a different composi-tion. After an accurate check of all the photometric parametersobtained for each grain, we are confindent that the values at theextremes of the distribution might be real.
4. Colors of nucleus regions
To compare the colors of the grains with the observed color ofthe nucleus surface, we considered a series of images of the nu-cleus acquired in the same two filters used to observe the grains.We selected the images obtained at phase angles comparablewith the phase at which the grains observation were performed,and found a suitable mapping set at phase 93◦ summarized inTable 2. This dataset was acquired from a spacecraft-comet dis-tance of about 28 km, resulting in a linear spatial scale at theimages of 0.52 m/pixel.
A59, page 4 of 8

G. Cremonese et al.: Photometry of dust grains of comet 67P and connection with nucleus regions
Fig. 6. Slope maps of all image set, as reported in Table 2.
All OSIRIS images are calibrated in radiance (expressedin W m−2 nm−1 sr−1) using the OSIRIS standard calibrationpipeline described in Tubiana et al. (2015) and Magrin et al.(2015), and then converted to reflectance (also known as radi-ance factor) using
I/Fmeas =πr2
hImeas
F�(2)
where Imeas is the measured radiance, F�/π is the solar irradianceat 1 AU measured at the central wavelength for each filter, andrh is the heliocentric distance of the comet in AU.
Given the high value of the observing phase angle and thevery rough surface of the comet, we considered it important totake the effects of illumination and observing conditions into ac-count before deriving the nucleus color. We therefore applied aphotometric correction based on Akimov parameterless functionfollowing the method used by La Forgia et al. (2015) in the anal-ysis of Philae landing site. Their results indeed indicate that thismethod represents the best approximation to a more complexHapke model with the advantage that the parameter is free.
The Akimov corrected reflectance is therefore computed, foreach pixel of the images, using
I/Fcorr,λ =I/Fmeas,λ
D(α, i, e, λ)(3)
where α, i, and e are the phase, incident, and emission angles,respectively. Here, D(α, i, e, λ) is the disk function, which de-scribes how the reflectance varies over the surface at a constantphase angleIt is given by
D(α, β, γ) = cosα
2cos(
π
π − α
(γ −
α
2
)) (cos β)α/(π−α)
cos γ, (4)
with β and γ being the photometric latitude and longitude, re-spectively, which in turn depend on the incidence, emergence,and phase angles as follows:
cos i = cos β cos(α − γ) (5)cos e = cos β cos γ. (6)
The computation of i, e, and α, for each pixel, required a high-resolution shape model of the surface, in order to correctly takethe local topography into account. For this application we usedthe SPG model of Preusker et al. (2015), together with the mostup-to-date NAIF-SPICE kernels and its IDL code toolkit (Acton1996), to produce high-resolution synthetic images and maps ofincidence, emergence, and phase angles. The used SPG shapemodel of 67P consists of about 16 million facets with 2 m hori-zontal sampling and a typical vertical accuracy at the decimeterscale.
Small errors in the pointing of the spacecraft and/or smalldifferences between the geodetic datum of the shape model ref-erence frame compared to that of the used recent SPICE ker-nels cause a few pixel offset between the original images and thesynthetic ones. The perfect alignment has been searched witha cross-correlation semi-automatic method looking for χ2 min-ima. We excluded all the non-illuminated (i > 90◦) and the non-observable (e > 90◦) regions from the analysis, but they areunfortunately quite extended on the frames because of the highobserving phase.
The images in different filters are not acquired simultane-ously but sequentially, and owing to the rotation of the cometand the spacecraft movements, they need to be co-registered fora correct color analysis. Therefore a control-point procedure hasbeen developed to coregister the blue and red images togetherand obtain a reliable color cube for each set. A variable numberof control points from 10 to 50 has been provided for each set,depending on the visible region and on the features observablein the frames.
The slope maps for all frames are shown in Fig. 6. Given thesmall field of view of each frame and the high observing phasecasting large shadows, it is quite hard to recognize the nucleusregions that were imaged. Therefore we used the SPG shapemodel and the SPICE kernels to produce a synthetic projec-tion of the nucleus with the observing conditions of each frame,and we highlighted the observed frame in each panel with a redsquare (Fig. 7).
A59, page 5 of 8

A&A 588, A59 (2016)
Fig. 7. Orientation of 67P nucleus at the observing time and portion of the nucleus observed for each slope map panel in Fig. 6.
Fig. 8. Normalized histograms of the reflectance distribution for each slope map panel in Fig. 6 (black curve) and comparison with the grains one(red curve). The histograms have a bin equal to 3 in reddening.
Various morphological regions are imaged, and they show avariable color distribution over the nucleus. The average redden-ing of all the regions is 17.22%/100 nm, which is consistent withthe high global nucleus spectral slope measured at lower phaseangles and the high phase reddening reported by Fornasier et al.(2015).
To compare the nucleus region colors with the colors of thegrains, we plotted the histograms of the reddening distributionfor each panel in Fig. 6 and overplotted the histogram of thereddening distribution of the grains in red (Fig. 8).
The nucleus histograms are much narrower in all cases andare very similar for the various regions over the surface. The his-togram in the top righthand panel, which refers to Set 4 turnsout to be slightly bluer than the other, with a peak value at16%/100 nm, which agrees with the colors observed in the neck-Hapi region (Fornasier et al. 2015; Capaccioni et al. 2015).
5. Conclusion
The comparison between the colors measured on the dust grainsand some nuclear regions reported in Fig. 8 shows that the grain
A59, page 6 of 8

G. Cremonese et al.: Photometry of dust grains of comet 67P and connection with nucleus regions
histogram is slightly shifted toward the blue part of the spectrumwith a peak value between 12 and 16%/100 nm and a muchwider spread with respect to the nucleus. It means that most ofthe grains come from the surface or at a different depth from thesurface.
The grains having a color that is not included in the peak su-perimposed on the nucleus may have different compositions andorigins. The dust grains histogram has a secondary peak around–8 because the 16 grains have a negative reddening, pointing ata completely different slope to the nucleus. Even if we have onlytwo points in the reflectance curve of the grains, we may suggestsome hypotheses that assume that an absorption band is fallingwithin the bandwidth of one of the two filters used.
The negative values might be due to the grains character-ized by an absorption within the spectral range of 712–776 nm(F28 filter; see also Fig. 1 of Oklay et al. 2015 for such miner-als seen through OSIRIS NAC filters), for instance the 700 nmfeature associated with hydrated minerals as observed in someasteroids, Fe2+ − − > Fe3+ (Vilas & Gaffey 1989), or they mayhave a higher abundance of ice giving a bluer color.
We have also found 13 grains that have a reddening greaterthan 17, therefore higher than the surface. In this case the grainsmay have an absoprtion in the spectral range of 443–518 nm(F24 filter), and even in this case it could be a feature at 430 nmassociated with hydrated minerals, Fe3+ (Vilas et al. 1993), asobserved in some asteroids. We may also have another inter-esting analog observed on the Earth, because in some measure-ments performed in the Antarctic region on glacier ice and snow(Warren et al. 2006), it has been found that the water ice mayhave an absorption in the range 390–470 nm. However, the ab-sorption by water ice is so weak in this spectral region that itsobservability is dominated by the small amount of absorptiveimpurities present in the ice, and the position of the λmin de-pends on this amount. If the process of freezing is slow enough,it can cause the rejection of the impurities, yielding the very purewater ice pieces characterized by this absoprtion.
These hypotheses could be confirmed by the recent activityobserved in the Imhotep region (Groussin et al. 2015) that showsnew small features having a higher albedo that is most likely due
to exposed water ice or maybe to hydrated minerals that wereburied below a dust deposit. In similar events we may have therelease of tiny water ice particles.
Acknowledgements. OSIRIS was built by a consortium of the Max-Planck-Institut für Sonnensystemforschung in Göttingen, Germany; CISAS-Universityof Padova, Italy; the Laboratoire d’Astrophysique de Marseille, France; theInstituto de Astrofísica de Andalucia, CSIC, Granada, Spain; the Research andScientific Support Department of the European Space Agency, Noordwijk, TheNetherlands; the Instituto Nacional de Técnica Aeroespacial, Madrid, Spain;the Universidad Politechnica de Madrid, Spain; the Department of Physics andAstronomy of Uppsala University, Sweden; and the Institut für Datentechnik undKommunikationsnetze der Technischen Universität Braunschweig, Germany.The support of the national funding agencies of Germany (DLR), Italy (ASI),France (CNES), Spain (MEC), Sweden (SNSB), and the ESA TechnicalDirectorate is gratefully acknowledged. We thank the ESA teams at ESAC,ESOC, and ESTEC for their work in support of the Rosetta mission.
ReferencesActon, C. H. 1996, Planet. Space Sci., 44, 65A’Hearn, M. F., Schleicher, D. G., & Millis, E. A. 1984, AJ, 89, 579Capaccioni, F., Coradini, A., Filacchione, G., et al. 2015, Science, 347http://www.sciencemag.org/content/347/6220/aaa0628.full.pdf
Davidsson, B. J. R., Gutiérrez, P. J., Sierks, H., et al. 2015, A&A, 583, A16Fornasier, S., Hasselmann, P. H., Barucci, M. A., et al. 2015, A&A, 583, A30Fulle, M., Della Corte, V., Rotundi, A., et al. 2015a, ApJ, 802, L12Fulle, M., Ivanovski, S. L., Bertini, I., et al. 2015b, A&A, 583, A14Groussin, O., Sierks, H., Barbieri, C., et al. 2015, A&A, 583, A36Jewitt, D., & Meech, K. J. 1986, ApJ, 310, 937Keller, H. U., Barbieri, C., Lamy, P., et al. 2007, Space Sci. Rev., 128, 433Küppers, M., Bertini, I., Fornasier, S., et al. 2005, Nature, 437, 987La Forgia, F., Giacomini, L., Lazzarin, M., et al. 2015, A&A, 583, A41Magrin, S., La Forgia, F., Da Deppo, V., et al. 2015, A&A, 574, A123Oklay, N., Vincent, J.-B., Sierks, H., et al. 2015, A&A, 583, A45Preusker, F., Scholten, F., Matz, K.-D., et al. 2015, A&A, 583, A33Rotundi, A., Sierks, H., Della Corte, V., et al. 2015, Science, 347http://www.sciencemag.org/content/347/6220/aaa3905.full.pdf
Schulz, R., Hilchenbach, M., Langevin, Y., et al. 2015, Nature, 518, 216Tubiana, C., Güttler, C., Kovacs, G., et al. 2015, A&A, 583, A46Vilas, F., & Gaffey, M. J. 1989, Science, 246, 790Vilas, F., Hatch, E. C., Larson, S. M., Sawyer, S. R., & Gaffey, M. J. 1993, Icarus,
102, 225Warren, S. G., Brandt, R. E., & Grenfell, T. C. 2006, App. Opt., 45, 5320
A59, page 7 of 8
A&A 588, A59 (2016)
Appendix A
Table A.1. Main parameters measured for each grain: length and FWHM of the tracks in the two filters F24 and F28 and the calculated reddening.
Images Length (F24) Length (F28) FWHM (F24) FWHM (F28) Reddening Reddening error(pixels) (pixels) (pixels) (pixels) (%)
1-2 13,6 12,37 2,37 1,36 9,66 9,3424,73 24,51 1,12 1,56 13,35 8,7119,1 23,19 1,7 1,36 19,35 5,22
66,44 59,71 2,54 1,72 12,68 7,0418,86 18,09 2,35 1,55 12,38 9,2722,09 26,08 1,98 1,28 11,30 8,5616,55 18,97 2,28 1,84 23,32 7,807,06 8,06 2,22 1,52 –1,35 81,7461,2 46,17 1,55 1,67 5,23 17,91
13,15 16,28 2,52 1,9 –4.72 29,178,96 10,19 2,25 1,92 –1,18 155,64
52,35 56,32 2,21 1,77 10,17 9,623-4 21,28 24,19 2,08 1,73 13,28 7,65
15,8 17,49 1,75 1,49 17,03 4,7033,53 34,79 1,76 1,65 1,01 81,549,06 9,21 1,86 1,33 3,14 30,47
14,76 17,89 2,23 1,41 20,80 3,9216,12 13,34 1,55 1,74 14,35 11,2166,37 74,17 2,9 3 9,21 14,3427,29 29,08 1,25 1,67 14,53 12,9312,37 13,04 1,98 1,7 22,73 4,0820,88 20,88 1,91 1,32 –7,11 14,9633,83 29,73 1,95 1,32 5,23 26,0921,1 16,12 1,18 1,78 23,57 3,38
18,71 19,92 1,92 1,38 –15,24 7,7822,02 21,02 1,94 1,55 –8,44 28,749,03 8,22 1,25 2,03 –19,97 6,4126 20,22 2 1,68 17,06 19,34
33,62 35,78 2,19 1,9 12,31 8,7910,2 11,17 2,09 1,39 12,60 15,198,24 9,21 2,86 2,34 –10,25 15,22
8,062 8,944 1,83 1,69 7,61 20,0127,02 30,64 1,55 1,23 4,72 26,65
5-6 30,67 33,52 1,72 1,1 9,31 21,6538,47 44,4 1,88 1,4 7,69 12,3615,13 13,34 2,1 1,81 9,99 6,3617,45 17,46 2,11 1,5 7,24 12,1337,66 41 1,74 1,29 –12,55 6,0033,24 26,4 2,28 1,47 3,09 32,0812,59 10,44 2,18 1,43 –13,74 8,8116,49 14,87 2,51 1,59 14,43 9,1419,65 17,46 2,02 1,16 –16,86 17,3221,84 25,32 1,7 1,65 20,75 6,4925,28 25,3 1,44 1,63 20,11 9,7553,24 63,95 2,58 2,44 19,43 7,4627,78 23,85 1,56 1,32 7,62 11,83
7-8 14,76 17,09 1,77 1,73 16,45 7,2715,99 14 1,84 1,36 20,51 4,7235,36 43,83 2,06 1,57 –8,26 15,329,04 9,79 1,58 1,56 17,40 5,30
27,71 29,07 1,86 1,41 17,46 4,6236,4 41,76 1,6 1,28 8,29 11,78
29,19 33,85 1,89 1,6 14,03 16,2114 12,17 0,99 1,3 20,09 4,45
30,42 34,52 1,98 1,64 17,95 6,1227,51 22,14 2,39 1,69 –4,03 25,9851,24 53,24 1,3 1,4 14,09 6,2417,03 15,3 2,74 1,69 –7,32 17,45
9-10 17 19,03 1,64 2,02 5,84 14,3356,09 59,03 2,02 1,7 16,01 5,2330,07 28,16 1,43 1,66 13,61 8,9145,04 46,04 2,28 1,6 4,06 31,7053,83 54,11 2,9 2,3 2,43 51,0239,46 44,15 2,12 1,25 27,00 4,6056,11 61,4 2,16 1,7 6,04 11,13
11-12 14,04 13,04 2 1,76 14,97 7,9746,01 52,03 1,66 1,44 20,60 5,0335,13 35,51 1,95 1,66 15,22 5,0651,42 57,48 2,18 1,5 –8,73 8,4686,15 71,39 2,89 2,98 –6,60 22,79
A59, page 8 of 8