astronomy c eso 2006 astrophysicsrepository.ias.ac.in/91833/1/60-p.pdfa&a 455, 303 313(2006)...
TRANSCRIPT
A&A 455, 303–313 (2006)DOI: 10.1051/0004-6361:20064970c© ESO 2006
Astronomy&
Astrophysics
The Nainital-Cape Survey
II. Report for pulsation in five chemically peculiar A-type starsand presentation of 140 null results�
S. Joshi1,2, D. L. Mary2,3, P. Martinez4, D. W. Kurtz5, V. Girish6, S. Seetha7, R. Sagar2, and B. N. Ashoka7
1 Inter-University Centre for Astronomy and Astrophysics (IUCAA), Post Bag 4, Ganeshkhind, Pune 411007, Indiae-mail: [email protected]
2 Aryabhatta Research Institute of Observational Sciences (ARIES), Manora Peak, Nainital-263129, Indiae-mail: [email protected]
3 Astronomisches Rechen-Institut am Zentrum fuer Astronomie, Moenchhofstrasse 12-14, 69120, Heidelberg, Germanye-mail: [email protected]
4 South African Astronomical Observatory (SAAO), PO Box 9, Observatory 7935, South Africae-mail: [email protected]
5 Centre for Astrophysics, University of Central Lancashire, Preston PR1 2HE, UKe-mail: [email protected]
6 Tata Institute of Fundamental Research (TIFR), Homi Bhabha Road, Mumbai-400 005, Indiae-mail: [email protected]
7 ISRO Satellite Center, Airport Road, Bangalore-560 017, Indiae-mail: [email protected]
Received 6 February 2006 / Accepted 25 April 2006
ABSTRACT
Aims. We search for photometric variability in chemically peculiar A type stars in the northern hemisphere.Methods. High-speed photometric observations of Ap and Am star candidates have been carried out from ARIES (Manora Peak,Nainital) using a three-channel fast photometer attached to the ARIES 104-cm Sampurnanand telescope.Results. This paper presents three new variables: HD 113878, HD 118660 and HD 207561. During the time span of the survey (1999December to 2004 January) pulsations of the δSct type were also found for the two evolved Am stars HD 102480 and HD 98851, asreported in Joshi et al. (2002, 2003). Additionally, we present 140 null results of the survey for this time span.Conclusions. The star HD 113878 pulsates with a period of 2.31 h, which is typical of δ Sct stars. HD 118660 exhibits multi-periodicvariability with a prominent period of nearly 1 h. These periods need to be investigated and make HD 118660 a particularly interestingtarget for further observations. For HD 207561, a star classified as Am, a probable pulsation with a period of 6 min was found in thelight curves obtained on two consecutive nights. Both HD 102480 and HD 98851 exhibit unusual alternating high and low amplitudemaxima, with a period ratio of 2:1. The analysis of the null results confirms the photometric quality of the Nainital site.
Key words. stars: chemically peculiar – stars: variables: general – stars: general – stars: variables: δ Sct
1. Introduction
The Nainital-Cape Survey is a collaborative survey program tosearch for pulsational variability in chemically peculiar A-typestars in the northern hemisphere. It was initiated in 1997 betweenthe Aryabhatta Research Institute of Observational Sciences(ARIES – formerly State Observatory), Nainital, India, and theSouth African Astronomical Observatory (SAAO), Cape Town,South Africa (Seetha et al. 2001). Details of the facilities atARIES have been published by Sagar & Mary (2005). This pa-per, in which we give the current status of the survey, is the sec-ond of a series. The methods and first results of the survey werepublished by Martinez et al. (2001; hereafter, Paper I).
� Full Table 1 and Full Figs. 9 and 10 are only available in electronicform at http://www.edpsciences.org
The class of A stars contains diverse stars that range fromradiative photospheres at A0 to mainly convective photospheresby A9. The physics of these stars still challenges our knowl-edge in many respects including convection, the effects of inter-nal rotation (Yildiz 2003; Reiners & Royer 2004), the couplingof rotation with magnetic field (Arlt 2004) and with chemicalmixing (Noels et al. 2004), the origin of the magnetic field, orthe mechanisms responsible for the pulsations observed in someof these stars (Kurtz 2000; Balmforth et al. 2001; Cunha 2002;Saio 2005; Cunha 2005).
The diversity in the nature of A stars makes it very difficultto draw a clear line between “normal” and “peculiar” stars. Bya normal A-type star, it is generally understood that at classi-fication dispersion the star shows none of the anomalies char-acteristic of other classes of stars; that when subject to a localthermodynamic equilibrium analysis, it appears to have a com-position like the Sun’s; and that it exhibits no variability (Wolff1983). The problem of the resolution required to distinguish nor-mal from peculiar stars is an old, though somewhat recurrent
Article published by EDP Sciences and available at http://www.edpsciences.org/aa or http://dx.doi.org/10.1051/0004-6361:20064970

304 S. Joshi et al.: The Nainital-Cape Survey. II.
one. Those stars which present peculiar elemental abundances,the chemically peculiar (CP) stars, are mostly A-type stars, butrange from early-B to early-F.
Their abundance anomalies are generally detected by thepresence of abnormally strong and/or weak absorption linesof certain elements in their optical spectra. The peculiarity inthese stars is interpreted as atmospheric under-abundance andover-abundance of different chemical elements, and is ex-plained quite successfully by the diffusion process (Michaud1970; Michaud & Proffitt 1993; Vauclair 2004). As outlinedby Dworetsky (2004), the observed spectra are connected tochanges in the deep interior of the stars, and diffusion cannotbe regarded as only a surface phenomenon.
In the regime of CP stars, some Ap (A-peculiar) and Am(A-metallic line) stars in the spectral range A-F, lying withinor near to the δSct instability strip, show p-mode photomet-ric variability in the period range of 5.65 min to 8 h. ThoseAp stars which exhibit non-radial, low-degree, high-overtoneacoustic pulsations with observed periods between 5.65−21 minare known as rapidly oscillating Ap (roAp) stars (Kurtz 1982,1990; Kurtz & Martinez 2000). Those variables with variabilityperiods of 18.12 min (HD 34282, Amado et al. 2004) to about 8 hare known as δSct stars (see Breger 2000 for a review of thesestars). The majority of δSct stars are non-radial, low-order, low-degree, pressure (p) mode pulsators. Both roAp and δSct-likeCP stars are of interest for the present survey.
A total of 35 members of the class of roAp stars have beendiscovered so far. One of them, HD 12098, was discovered in theframework of the Nainital-Cape survey; see Paper I and Girishet al. (2001). These stars exhibit strong global magnetic fields.Recent results show that the distribution of the number of starsversus 〈H〉 is close to a negative exponential with very few starshaving more intense fields than 8 kG (Dworetsky 2004). Thesecond largest magnetic field in an Ap star (24.5 kG) was dis-covered recently in HD 154708 (Hubrig et al. 2005); this star isalso a newly-discovered roAp star (Kurtz et al., in preparation).The predominant structure of the field is dipolar, although devia-tions from the dipolar case have been discovered by Leroy et al.(1995) and modelled by Bagnulo et al. (1999).
The Ap stars exhibit chemical abundance anomalies, partic-ularly overabundances of Rare-Earth elements. Since the discov-ery that chemical peculiarity and pulsation can coexist in somemagnetic CP stars (see Kurtz 1982), many attempts have beenmade to understand the geometry and driving mechanisms ofthe corresponding pulsations. The pulsation axis is thought to bealigned with the magnetic axis, and is consequently oblique tothe rotation axis: the oblique pulsator model. See Kurtz (1982,2000), Takata & Shibahashi (1995), Saio & Gautschy (2004) andSaio (2005) for discussion of the oblique pulsator model, andalso see Bigot & Dziembowski (2002) who find that the axis ofpulsation is not necessarily aligned with the magnetic axis in thecase of relatively weak magnetic fields, Hs ≤ 1 kG, when cen-trifugal effects from rotation may dominate.
In order to explain the driving mechanism of the short-period, high-overtone modes of roAp stars, many works haveturned to the κ mechanism. This mechanism acts for δ Sct starsin the He ii ionization zone (Chevalier 1971) and leads to longperiods corresponding to fundamental/low-overtone modes; assuch, it is not able to explain directly the short-period pulsa-tions of roAp stars. Several works have investigated the respec-tive influence of the magnetic field on helium settling and onconvection efficacy (Dolez & Gough 1982), stellar wind likelyto activate the κ mechanism in the He i ionization zone (Dolezet al. 1988), the possible role played by the ionisation of Si iv
(Matthews 1988), the κ mechanism acting in the H i ioniza-tion zone (Dziembowski & Goode 1996), or mechanisms basedon the possible existence of chromospheres (Gautschy et al.1998). Apart from the κ mechanism, some works have inves-tigated other possible causes for driving the pulsations, suchas the Lorentz force (Dziembowski & Goode 1985), overstableconvective modes (Shibahashi 1983; Cox 1984), or stochasticexcitation (Houdek et al. 1999). The current understanding isthat the κ mechanism acting in the region of the first ionizationof hydrogen is probably the driving mechanism of pulsationsin roAp stars, acknowledging the facts that in this case oscil-lations are aligned with the magnetic axis, that this model leadsto frequencies as high as those observed in roAp stars, and thatthe diffusion-induced helium gradient of this model may lead toparticular asteroseismic signatures1 as observable in some roApstars. Using these ideas, Balmforth et al. (2001) have proposeda model for the excitation mechanism in roAp stars where theeffect of the magnetic field is to freeze the convection at thepoles. On the basis of this model, Cunha (2002) calculatedthe theoretical boundaries of the instability strip in theHertzsprung-Russell (H-R) diagram, and provided many theo-retical insights on the pulsations of these stars. Saio (2005) cal-culates that high-overtone p modes are excited by the κ mecha-nism for H i, and that low-overtone p modes – those typical ofδ Sct stars – are not excited in the presence of a magnetic field.These results are consistent with the short periods of the roApstars and the lack of δSct pulsations found in confirmed mag-netic stars.
So far, many Ap stars seen within the instability strip havenot been observed to pulsate despite having similar proper-ties to known roAp stars. These stars, where pulsations are notobserved, are commonly called the non-oscillating Ap (noAp)stars. Many attempts have been made to determine systematicdifferences between roAp and noAp stars (see the discussions inHubrig et al. 2000 and Cunha 2002). Hubrig et al. (2000) dis-covered that no roAp star is known to be a spectroscopic binary.Also, in the similar colour range to roAp stars, the noAp starsseem to be more evolved on average than the roAp stars (Northet al. 1997), although this may be a selection effect (Elkin et al.2005). This apparent distinction in the evolutionary stages be-tween roAp and noAp stars is supported theoretically by Cunha(2002), who showed that a magnetic field is less likely to sup-press convection in more evolved stars, and that the growthrate of unstable modes decreases as these stars evolve, so thatevolved stars are stabilized more easily. This brief review showshow theory and observations are complementary to our under-standing of the physics of these stars.
As far as the δSct stars are concerned, these are in generalchemically normal stars, either because the pulsations disruptthe element separation due to the diffusion process, or becausediffusion stabilizes the star. It was long thought for these rea-sons that metallicism and pulsations were mutually exclusive. Inthe late 1970s, theoretical models predicted however that pulsa-tions could occur in evolved Am stars: when these stars evolve,the He ii ionization is shifted more deeply into the star, wherethere is sufficient residual He to drive pulsations (Cox et al.1979). Such cases of ρPup stars2 are now not unusual. Extreme
1 I.e. modulation of frequencies due to partial reflection of the soundwave where the He gradient occurs, e.g. in HD 60435 (Vauclair &Théado 2004).
2 The group of ρ Puppis (formerly δDelphini) stars are luminous,cool, evolved stars that may exhibit low-overtone pulsation characteris-tic of δSct variability (Kurtz 1976; Turcotte et al. 2000).

S. Joshi et al.: The Nainital-Cape Survey. II. 305
cases of co-existence of metallicism and long-period pulsationshave been found in the evolved Am star HD 40765 (Kurtz et al.1995) and in the strongly peculiar star HD 188136 (Kurtz 1980;Wegner 1981). The present paper briefly discusses the existenceof two other evolved, long period Am pulsators, HD 98851 andHD 102480, also discovered during this survey and publishedJoshi et al. (2003).
Cunha (2002) predicted that longer period oscillations(20–25 min) in magnetic roAp stars should exist in the moreevolved stars. The works of Turcotte (2000) and Turcotte et al.(2000) also support this theory. Periods longer than about 16 minremained for a long time not observed in the known roAp stars,which are concentrated in the lower (fainter) part of the theoreti-cal instability strip; in fact, δ Sct type of pulsations were thoughtto be completely suppressed in roAp stars (Kurtz & Martinez2000). Recent works still support this view, and show theoreti-cally that both low-order adiabatic (Saio & Gautschy 2004) andnon-adiabatic (Saio 2005) oscillations are damped by the mag-netic field. Recently, however, Elkin et al. (2005) discovered pul-sations in an evolved and luminous Ap star HD 116114, with apulsation period of 21 min – the longest period among the knownroAp stars. This in turn may support the theory that longer pe-riods do exist in luminous stars, and that the current observa-tional distinction between the roAp and noAp stars are due toan observational bias toward fainter stars. Also, HD 21190 wasreported by Koen et al. (2001) to be both a very evolved Ap anda δ Sct star. The classification of this star is F2III SrEuSi:, whichindicates a possible magnetic nature. Since some works (e.g.Saio 2005) showed theoretically that the presence of a magneticfield stabilizes the star against low-overtone δSct pulsation, thecase of HD 21190 is particularly interesting. Beyond this partic-ular star, the search of low-overtone δ Sct pulsations in magneticAp star is very important for our understanding of magnetismand pulsations.
We note here that for the detection of pulsation, the methodof spectroscopic studies of radial velocity variations from timeseries can be more efficient than the photometric studies, as illus-trated by the cases of HD 116114 (Elkin et al. 2005), HD 154708(Kurtz et al., in preparation) and β CrB (Hatzes & Mkrtichian2004). See also the review of Kurtz (2005) on this topic.
For main sequence stars, the coexistence of spectral pe-culiarity and pulsations for a long time remained doubtful.Kurtz (1978, 1984) first found low-amplitude (a few mmag)δ Sct pulsation in the marginal Am stars HR 4594, HR 8210 andHR 3321. Kurtz (1989) further reported the discovery of the clas-sical Am star HD 1097 as a δ Sct star, thereby showing that bothclassical and evolved Am stars can pulsate. Two more classicalAm pulsators were discovered in the framework of the presentsurvey: HD 13038 and HD 13079; see Paper I.
The more detailed the analysis of pulsations in CP stars, themore complicated the picture. HD 188136 is, for instance, a verypeculiar, multiperiodic δSct star with 50-mmag peak-to-peakvariations (Kurtz 1980). The extreme peculiarity of this star issurprisingly not mixed away by the large amplitude pulsations. Itis classified as a δDel (ρPup) star, but the Rare Earth abundancesin this star suggest the possible presence of a strong magneticfield (Wegner 1981) – which, if true, would mean that magneticfields do not always prevent δSct type of pulsations.
In some stars the δSct pulsations may exhibit both p modesand g modes (e.g. HD 50018; Zhiping 2000). Henry & Fekel(2005) have shown that HD 8801 appears to be an Am star thatis also both a δSct star and a g-mode γDoradus star (see Henry& Fekel 2003 for a review of γDor stars).
In many respects, the information that we have on pulsa-tions and metallicity is therefore a puzzle. What we observe(and what the theoretical models can at least partially explain)is that evolved Am stars – i.e. ρPup, or δDel stars – can pulsate(i.e., the κ-mechanism in He ii can drive the pulsation in evolvedstars, and low-amplitude pulsations may not mix away the pe-culiarities); that marginal Am stars can be low-amplitude δ Sctstars (a sufficient amount of He remains to drive low-amplitudeoscillations) and that strong magnetic fields and high-overtonepulsation can, and actually do, coexist in the roAp stars.
Among the things still to be ascertained are the mechanismsmaking some classical Am stars δSct pulsators (in particularwhy large amplitude pulsations do not mix away the peculiar-ities), how δ Sct pulsations may occur in the presence of strongmagnetic fields, and how frequent is the occurrence of long pe-riod pulsations in evolved roAp stars. As in the past, much in-sight into these questions will most probably come from obser-vational discoveries.
Since the early 1980s, the South African working grouphas devoted a lot of time to detect mmag variations in Ap andAm stars. They discovered more than twenty new roAp stars(Martinez & Kurtz 1995) and published an extensive list of nullresults (Martinez & Kurtz 1994). Of the 31 roAp stars knownin 1997, only 3 were in the northern sky hemisphere. This situa-tion gave birth to a number of surveys in the northern hemisphereto find new members of this group (Heller & Kramer 1998;Nelson & Kreidl 1993; Dorokhova & Dorokhov 1998; Handleret al. 1999). The Nainital-Cape Survey is one of them, and assuch one of its major motivations is to search new roAp stars inthe northern hemisphere. Regarding the discussion above, thiskind of survey presents numerous other potential benefits: ba-sically, they represent the primary materials to determine sta-tistically the physical properties of the complicated classes ofstars described above, and to constrain more precisely the the-oretical models. More precisely, the instrumental setting of thepresent survey for acquiring high-precision, fast photometric ob-servations (see Sect. 2.2) is particularly well suited to search forlong periods (above ≈20 min) in magnetic Ap stars (cf. Turcotteet al. 2000; Cunha 2002; Saio 2005) to search for low-overtoneδ Sct pulsations in (either cool or evolved) A-F peculiar stars,and to search for the coexistence of p- and g-modes pulsationsin Am stars. The selection of the candidates was traditionallyoriented towards cool objects (Martinez & Kurtz 1994) but weinclude in our list evolved stars as well (see Sect. 2.1).
The rest of the paper is organized as follows: Sect. 2 summa-rizes the strategy for the selection of the candidates, the obser-vations and the data analysis procedure. Section 3 presents fivevariables discovered during this Survey. The null results are pre-sented and analysed in Sect. 4. The last section summarizes ourresults.
2. Selection of the candidates, observationsand data reduction
2.1. Selection of the candidates
In order to increase the chances of discovering variability in Apand Am stars, the strategy adopted for the current survey wasto select candidates presenting Strömgren photometric indicessimilar to those of the known variable Ap and Am stars (seePaper I). The range of the indices was also slightly extendedwith respect to Paper I to take in the evolved stars that might bepeculiar. The primary source of candidates for the survey wasfrom Strömgren photometry of A and F-type stars in the Simbad

306 S. Joshi et al.: The Nainital-Cape Survey. II.
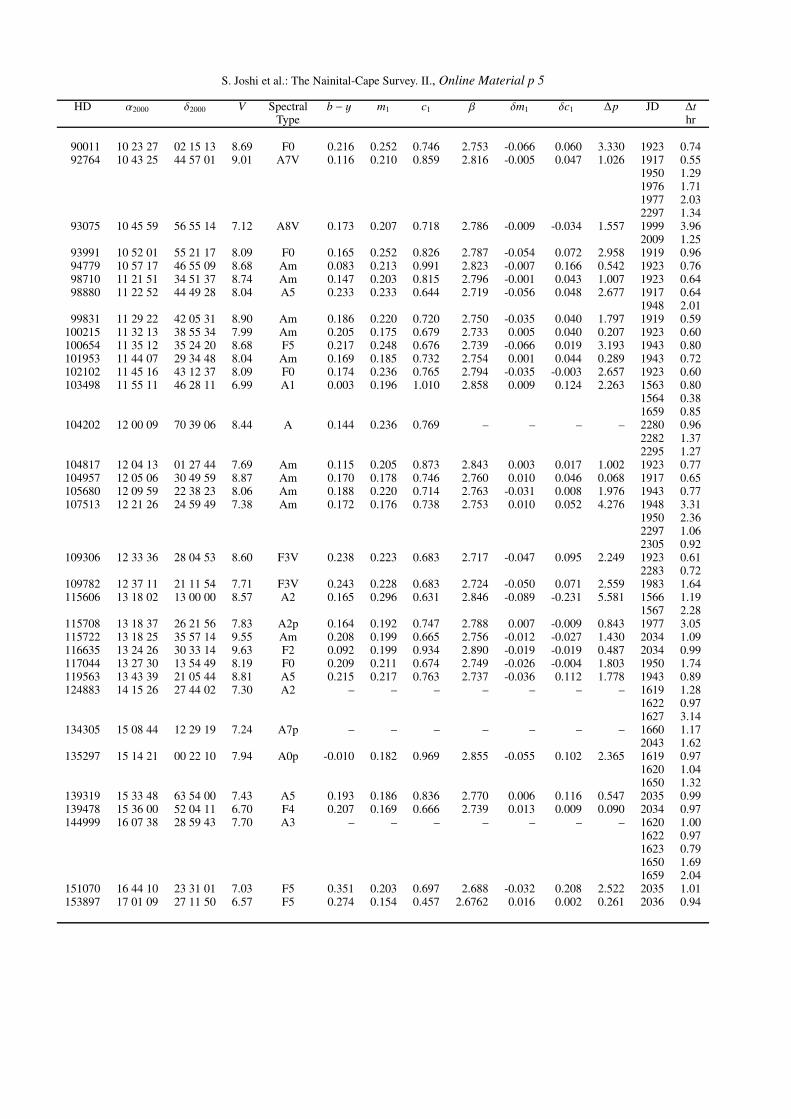
Table 1. Sample of stars classified as null results during the Nainital-Cape survey. The unprewhitened and prewhitened spectra of these stars aredepicted in Fig. 9 and Fig. 10, respectively. The columns list: HD number, right ascension α2000, declination δ2000, visual magnitude V , spectraltype, spectral indices b − y, m1, c1, β, δm1, δc1, peculiarity parameter ∆p (Masana et al. 1998), Julian dates (2 450 000+) on which the star wasobserved, and the duration of observation (∆t) in hours. The full table is available in the electronic material attached to this paper.
HD α2000 δ2000 V Spectral b − y m1 c1 β δm1 δc1 ∆p JD ∆ttype h
154 00 06 24 34 36 25 8.93 F0 0.223 0.230 0.746 2.782 –0.033 0.002 2.892 1503 1.54416 00 08 51 37 12 56 8.91 A5 0.194 0.211 0.746 2.803 –0.008 -0.040 2.064 2174 2.30573 00 10 13 25 31 36 8.90 F0III 0.208 0.253 0.783 2.780 –0.057 0.043 3.497 1832 0.96
2174 1.311607 00 20 27 22 28 47 8.67 F0 0.254 0.222 0.638 2.723 –0.044 0.029 2.544 2235 1.702123 00 26 02 67 50 46 9.60 F5 – – – – – – – 2223 1.302471 00 28 40 37 18 15 8.15 A5 0.084 0.251 0.900 2.892 –0.075 –0.058 2.449 1499 2.052523 00 29 08 11 19 12 8.08 F0 0.219 0.208 0.655 2.733 –0.028 0.016 1.675 2215 2.06
2223 1.972283 0.79
4564 00 48 00 36 12 17 8.05 A5 0.150 0.228 0.802 2.824 –0.022 –0.024 2.290 2214 2.127901 01 20 36 67 14 02 8.44 A3 0.212 0.209 0.720 2.750 –0.024 0.040 1.670 2240 1.059550 01 34 24 38 50 44 8.29 A3 0.199 0.213 0.740 2.762 –0.024 0.036 1.765 1827 1.149843 01 36 41 35 36 59 8.22 F8 0.286 0.179 0.735 2.706 –0.006 0.187 0.908 1917 1.65
1919 1.371923 1.44
data base (Hauck & Mermilliod 1998). The following range ofStrömgren photometric indices was used to select candidates:0.46 ≤ c1 ≤ 0.88; 0.19 ≤ m1 ≤ 0.33; 2.69 ≤ β ≤ 2.88;0.08 ≤ b − y ≤ 0.31; −0.12 ≤ δm1 ≤ 0.02 and δc1 ≤ 0.04,where c1 is the Balmer discontinuity parameter, an indicatorof luminosity; m1 is the line-blanketing parameter, an indicatorof metallicity; β is the Hβ line strength index, reasonably freefrom reddening, an indicator of temperature in the range fromaround A3 to F2; b − y is also an indicator of temperature, but isaffected by reddening. A more negative value of δm1 indicates astronger metallicity; a negative δc1 index is an indicator of pe-culiarity. For the more evolved, more luminous stars δc1 may bepositive, even for strongly peculiar stars, since c1 increases withluminosity.
Another indicator for peculiarity is the “∆p parameter” asdefined by Masana et al. (1998). According to these authors,50% of the late region CP stars (roughly A2 and later) shouldpresent a ∆p greater than ∆p0 = 2 mag, and only 17% of nor-mal stars should present a ∆p greater than 2 mag (see Eq. (5)of their paper; for hotter stars Eq. (4) should be used, and inter-preted with ∆p0 = 1.25 mag). Most of our stars have ∆p scat-tered around 2 mag, and ∆p > 2 mag for 60 stars (see Table 1).The mean and the median of the distribution of the ∆p are re-spectively 2.08 mag and 1.99 mag, indicating strong peculiarityfor those stars. The combination of the spectral types, Strömgrenphotometric and ∆p indices demonstrates chemical peculiarityin almost all of the stars we have studied. Some normal stars andsome hotter stars have been included to extend the range of oursearch, and for comparison.
2.2. Observations and data reduction
For the Nainital-Cape Survey, high-speed photometric observa-tions of Ap and Am star candidates are carried out from ARIES(Manora Peak, Nainital) using a three-channel fast photometerattached to the ARIES 104-cm Sampurnanand telescope (Sagar1999; Ashoka et al. 2000). Most of the selected program stars arebetween 6 and 10 mag. It is therefore very difficult in general tofind a nearby comparison star of similar magnitude and colouras those of the program star. Hence, most of the time we use
the photometer in two-channel mode (one channel measuring thetarget star plus sky background and a second channel measuringsky only). The time-series photometric observations consist ofcontinuous 10-s integrations obtained through a Johnson B filter.This filter is expected to yield the highest amplitude variationsand to maximize the number of counts. An aperture of 30′′ isused to minimize flux variations caused by seeing fluctuationsand guiding errors. The observing protocol is simple. We ac-quire time-series photometric observations of the candidate starsfor 1 to 3 h in order to be able to reveal both roAp and δ Sctpulsations on photometric nights. As a single null result is insuf-ficient to exclude a candidate from being variable, several runsare recorded for some of the same target stars (see Sect. 4).
The data reduction process comprises the following steps:(a) Visual inspection of the light curve to identify and remove allobvious bad data points; (b) correction for coincident countinglosses; (c) subtraction of the interpolated sky background; and(d) correction for the mean atmospheric extinction (〈κB〉 = 0.26for Nainital; the best extinction coefficient is calculated for eachobserving run). After applying these corrections, the times of themid-points of the observations are converted into heliocentricJulian dates (HJD) with an accuracy of 10−5 day (≈1 s). The re-duced data comprise a time-series of the HJD and B magnitudeswith respect to the mean of the run. These data are then analyzedusing an algorithm based on the Discrete Fourier Transform(DFT) for unequally spaced data (Deeming 1975; Kurtz 1985).The DFT of the time series produces an amplitude spectrumof the light curve. Since we seldom can observe a comparisonstar, there is always some degree of low-frequency sky trans-parency variations (see Sect. 4) mixed with the possible low-frequency stellar variations. The sky transparency variations arewell-separated in frequency space from possible roAp pulsationfrequencies.
3. Pulsating variables discoveredduring this survey
The pulsating variables discovered since the last survey report inPaper I are discussed below. The results about the first two starsbelow have been already published: we only summarize here themain results and discuss them.
S. Joshi et al.: The Nainital-Cape Survey. II. 307
3.1. HD 98851
HD 98851 (α2000 = 11 22 51.17; δ2000 = +31 49 41.1; mB =7.72; mV = 7.41) is a star of spectral type F2. The Strömgrenphotometric indices for this star are: b − y = 0.199, m1 = 0.222,c1 = 0.766 (Hauck & Mermilliod 1998). There is no publishedvalue of the β index. Using low resolution spectroscopy, Joshiet al. (2003) found that this is a cool star of effective tempera-ture 7000 K. The calibration of Crawford (1975) for F-type starsgives δm1 = −0.051 and δc1 = 0.236. The δm1 index is wellwithin the range of Strömgren photometric indices for the knownroAp stars; δc1 indicates that the star is evolved. Abt (1984)classified this star as a marginal Am star, with Ca ii K line,H i Balmer lines and metallic lines (respectively, K/H/M) of thetypes F1/F1 IV/F3.
Joshi et al. (2000) found δScuti pulsation with three mainfrequencies, f1 = 0.20 mHz, f2 = 0.10 mHz and f3 = 0.02 mHz.Alternating high and low amplitude cycles visible in the lightcurves indicate a nearly sub-harmonic period ratio of 2:1, a phe-nomenon not commonly observed in other Am or δ Sct stars(Joshi et al. 2003). Zhou (2001) also observed this star photomet-rically from the Xinglong Station of the National AstronomicalObservatory, China, using a three-channel fast photometer at-tached to a 85-cm Cassegrain telescope, and reported similartypes of light curves with the same periodicity.
3.2. HD 102480
The star HD 102480 (α2000 = 11 47 52.88; δ2000 = +53 00 54.5;mB = 8.78, mV = 8.45) is of spectral type F1. Its Strömgrenphotometric indices are b − y = 0.211, m1 = 0.204, c1 = 0.732(Hauck & Mermilliod 1998). The Strömgren metallicity and lu-minosity indices are δm1 = −0.034 and δc1 = 0.292. The effec-tive temperature is 6750 K derived using low-resolution spec-troscopy (Joshi et al. 2003). The K/H/M lines are also those ofa marginal Am star: Am(F2/F4/F4) (Abt 1984). The Strömgrenphotometric indices in combination with effective temperatureindicate that this is a cool, evolved marginal Am star.
The photometric variability of this star was discovered fromARIES by Joshi et al. (2002). Combining data sets closelyspaced in time, the amplitude spectra show that HD 102480 pul-sates with three frequencies: f1 = 0.107 mHz, f2 = 0.156 mHzand f3 = 0.198 mHz (Joshi et al. 2003). As with HD 98851, thelight curves present alternating high and low amplitude varia-tions with a period ratio close to 2:1.
The light curves of HD 98851 and HD 102480 are similar tothose of the luminous yellow supergiant pulsating variables RVTauri stars, which show alternating deep (primary) and shallow(secondary) minima, with a periods in the range 30–150 d and abrightness range of up to four magnitudes. This group of stars iscomposed of binaries with circumstellar or circumbinary diskswhich interchange material with the photosphere. It is thoughtthat the underlying variability in RV Tauri stars arises from pul-sations, with the alternating light curve arising from a 2:1 res-onance between the fundamental and first overtone modes. Theunusual nearly harmonic period ratios, alternating high and lowmaxima, and Am spectral types of HD 98851 and HD 102480make these stars particularly interesting objects for further ob-servational and theoretical studies.
3.3. HD 113878
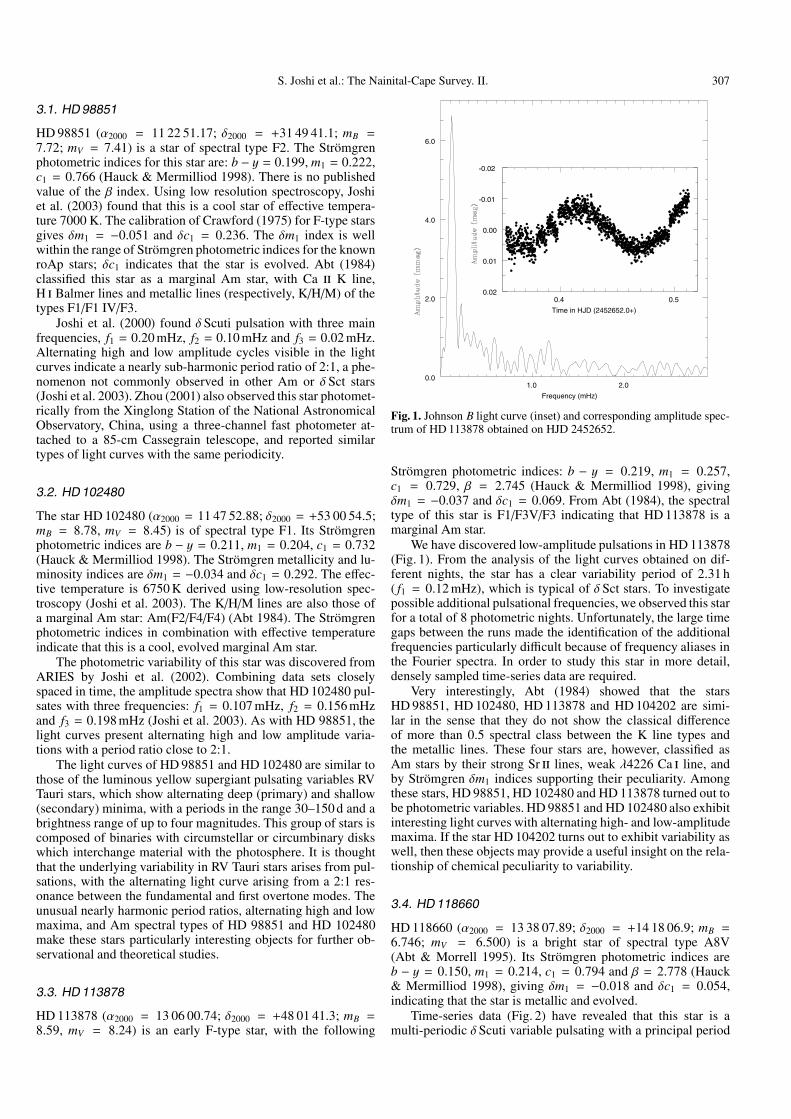
HD 113878 (α2000 = 13 06 00.74; δ2000 = +48 01 41.3; mB =8.59, mV = 8.24) is an early F-type star, with the following
1.0 2.00.0
2.0
4.0
6.0
Time in HJD (2452652.0+)
0.4 0.50.02
0.01
0.00
-0.01
-0.02
Frequency (mHz)
Fig. 1. Johnson B light curve (inset) and corresponding amplitude spec-trum of HD 113878 obtained on HJD 2452652.
Strömgren photometric indices: b − y = 0.219, m1 = 0.257,c1 = 0.729, β = 2.745 (Hauck & Mermilliod 1998), givingδm1 = −0.037 and δc1 = 0.069. From Abt (1984), the spectraltype of this star is F1/F3V/F3 indicating that HD 113878 is amarginal Am star.
We have discovered low-amplitude pulsations in HD 113878(Fig. 1). From the analysis of the light curves obtained on dif-ferent nights, the star has a clear variability period of 2.31 h( f1 = 0.12 mHz), which is typical of δ Sct stars. To investigatepossible additional pulsational frequencies, we observed this starfor a total of 8 photometric nights. Unfortunately, the large timegaps between the runs made the identification of the additionalfrequencies particularly difficult because of frequency aliases inthe Fourier spectra. In order to study this star in more detail,densely sampled time-series data are required.
Very interestingly, Abt (1984) showed that the starsHD 98851, HD 102480, HD 113878 and HD 104202 are simi-lar in the sense that they do not show the classical differenceof more than 0.5 spectral class between the K line types andthe metallic lines. These four stars are, however, classified asAm stars by their strong Sr ii lines, weak λ4226 Ca i line, andby Strömgren δm1 indices supporting their peculiarity. Amongthese stars, HD 98851, HD 102480 and HD 113878 turned out tobe photometric variables. HD 98851 and HD 102480 also exhibitinteresting light curves with alternating high- and low-amplitudemaxima. If the star HD 104202 turns out to exhibit variability aswell, then these objects may provide a useful insight on the rela-tionship of chemical peculiarity to variability.
3.4. HD 118660
HD 118660 (α2000 = 13 38 07.89; δ2000 = +14 18 06.9; mB =6.746; mV = 6.500) is a bright star of spectral type A8V(Abt & Morrell 1995). Its Strömgren photometric indices areb − y = 0.150, m1 = 0.214, c1 = 0.794 and β = 2.778 (Hauck& Mermilliod 1998), giving δm1 = −0.018 and δc1 = 0.054,indicating that the star is metallic and evolved.
Time-series data (Fig. 2) have revealed that this star is amulti-periodic δScuti variable pulsating with a principal period

308 S. Joshi et al.: The Nainital-Cape Survey. II.
1.0 2.00.0
2.0
4.0
6.0
Time in HJD (2453452.0+)
0.3 0.4
0.01
0.00
-0.01
Frequency (mHz)
Fig. 2. Johnson B light curve (inset) and amplitude spectrum ofHD 118660 obtained on HJD 2453452.
of about 1 h. Another prominent period of 2.52 h is also appar-ent. Preliminary analyses indicate that many other periods mayalso be present in the data, though we could not investigate themfurther so far. More time-series data are consequently required.At a declination of about 14◦, HD 118660 is a good target for amulti-site campaign with 0.5-m to 1.0-m class telescopes situ-ated in both northern and southern hemispheres.
3.5. HD 207561
HD 207561 (α2000 = 21 48 16.05; δ2000 = +54 23 14.6; mB =8.09; mV = 7.85) is an F0III star with Strömgren indices of b −y = 0.142, m1 = 0.220, c1 = 0.820 and β = 2.825, givingmetallicity and luminosity indices of δm1 = −0.014 and δc1 =−0.040. These indices are typical for roAp stars, but this star isclassified as an Am star (Cowley & Cowley 1965; Bertaud &Floquet 1974; Nicolet 1982).
We have discovered 6-min oscillations in the light curve ofthis star on two consecutive nights, as shown in Figs. 3 and 4. Forthis first two nights, the variability is evident. Figure 5 shows theamplitude spectra for the light curves on these three nights wherea peak at 2.75 mHz (P = 6.1 min) is clear with excellent signal-to-noise ratio on both nights. Both the light curves and amplitudespectra are typical of the roAp stars. In our experience studyingthese stars for more than 20 years, we have never seen a spuri-ous signal as clear as this for any star. Furthermore, in the nextsection we show the null results from our survey where no signalstands out like this one. This shows that our instrumentation andsky conditions do not produce false peaks such a high frequencyas we see in Fig. 5.
Thus it seems that HD 207561 is a newly discovered roApstar. However, we have been unable to reproduce the resultsshown in Figs. 3 and 5 over two following seasons. We haveobserved this star for a total of 43.5 h on 17 nights over threeobserving seasons. On some nights there is no signal at all tohigh precision, as we show in Fig. 4 and in the bottom panel ofFig. 5. On other nights we have seen possibly significant peaks,but at lower frequencies than the one detected in Figs. 3 and 5.
0 0.2 0.4 0.6 0.8 10.02
0.00
-0.02
1 1.2 1.4 1.6 1.8 20.02
0.00
-0.02
0 0.2 0.4 0.6 0.8 10.02
0.00
-0.02
1 1.2 1.4 1.6 1.8 20.02
0.00
-0.02
2 2.2 2.4 2.6 2.8 30.02
0.00
-0.02
Fig. 3. Johnson B light curves of HD 207561 obtained on two consecu-tive nights. These curves clearly show the 6-min oscillations.
0 0.2 0.4 0.6 0.8 10.02
0.00
-0.02
1 1.2 1.4 1.6 1.8 20.02
0.00
-0.02
Fig. 4. Johnson B light curves of HD 207561 obtained on a third nightfrom a different season. This curve shows a clear lack of signal at highprecision. In all the light curves, the data have been merged to 40-sintegrations and low-frequency sky transparency variations have beenprewhitened at frequencies below 0.5 mHz.
While roAp stars are oblique pulsators, so their observedamplitude varies with rotation and can decrease to zero, orrise to many mmag from night-to-night, most of them havestable frequency spectra. Exceptions to this is HD 60435(Matthews et al. 1987) where the mode lifetimes appear to beshorter than one week, and HD 217522 which had a new fre-quency at 2.02 mHz in 1989 in addition to the 1.2 mHz peakknown from 1982 (Kreidl et al. 1991). We have not previouslyseen the apparent behaviour that the light curves and amplitudespectra for the 17 nights of observations of HD 207561 show, so

S. Joshi et al.: The Nainital-Cape Survey. II. 309
0 1 2 3 4 5
2.0
4.0
2.0
4.0
2.0
4.0
Fig. 5. Amplitude spectra of the light curves shown in Figs. 3 and 4(HJDs are mentioned in each panel). The peaks at 2.75 mHz in the toptwo panels have high signal-to-noise ratio. We have never seen a casewhere signals as strong as this, and at this high frequency, have beeninstrumental or atmospheric in origin. We therefore consider them tobe real, but have not been able to confirm them on 15 other nights ofobservation. Note, however, that roAp stars can be amplitude variabledue to rotation and multiperiodicity. See the text for further discussion.
0 2 4 6 8 10 120
20
40
60
80
Number of runs per star
No.
of S
tars
0 5 10 15 20 250
20
40
60
80
Duration of the total observation per star in hours
No.
of S
tars
Fig. 6. Statistics of the runs for the Nainital-Cape Survey. Top: distri-bution of the number of runs per star. Clearly, most of the stars havebeen observed only once. A few of them, where some variability wassuspected, were observed many times. Bottom: distribution of the totaltime dedicated to observe one star (in hours). Most of the stars havebeen observed less than 2 h. The median value is 1.6 h and the mean3.2 h.
we do not claim with certainty that it is an roAp star, althoughwe strongly suspect this from the evidence shown.
From the Strömgren indices given above, HD 207561 isclearly a chemically peculiar star – either Am or Ap. These canbe confused with each other at classification dispersions, so theAm classification of the star needs to be re-examined in light ofthe possible pulsation. A definitive spectral type is needed, as isa search for the presence of a magnetic field.
If the 6-min pulsations in HD 207561 can be confirmed, thisstar will be interesting to study for its amplitude variability todetermine if it is due to short mode lifetimes or rotation. We ex-pect that it will be found to be an Ap star; if it should be an
Am star, then the short period is unique and demands exten-sive further study. Unfortunately, this star is poorly placed forobserving from ARIES. It is only observable during October toDecember from this site because the monsoon precludes observ-ing it earlier than October. The best signal-to-noise ratio for theobservations is obtained when the sky is stable and the object isnear the meridian. The sky transparency usually becomes stableonly two to three hours after the sunset at Nainital. But by thattime, HD 207561 is two to three hours west of the meridian. Thismakes it difficult to obtain long observing runs of this star fromNainital. Consequently, observations of HD 207561 from otherastronomical sites would be very useful to confirm the aboveresults.
4. Null results
As we shall see, the detection of small amplitude variations (afew mmag, or less) in roAp stars, as well as low-amplitude δ Sctpulsators, is challenging. Detection of mmag pulsations can,however, be accomplished with good conditions from a singlesite (down to about 0.3 mmag for the highest noise peaks, or aprecision of about 0.1 mmag in 1 h of observing; see Martinez& Kurtz 1994), provided that scintillation noise is sufficientlylow, and that variations in the sky transparency are sufficientlyslow3. Since the stars of our survey are brighter than mV = 10,sky transparency variations and scintillation noise are the lim-iting factors in detecting the small amplitude pulsations we aresearching for.
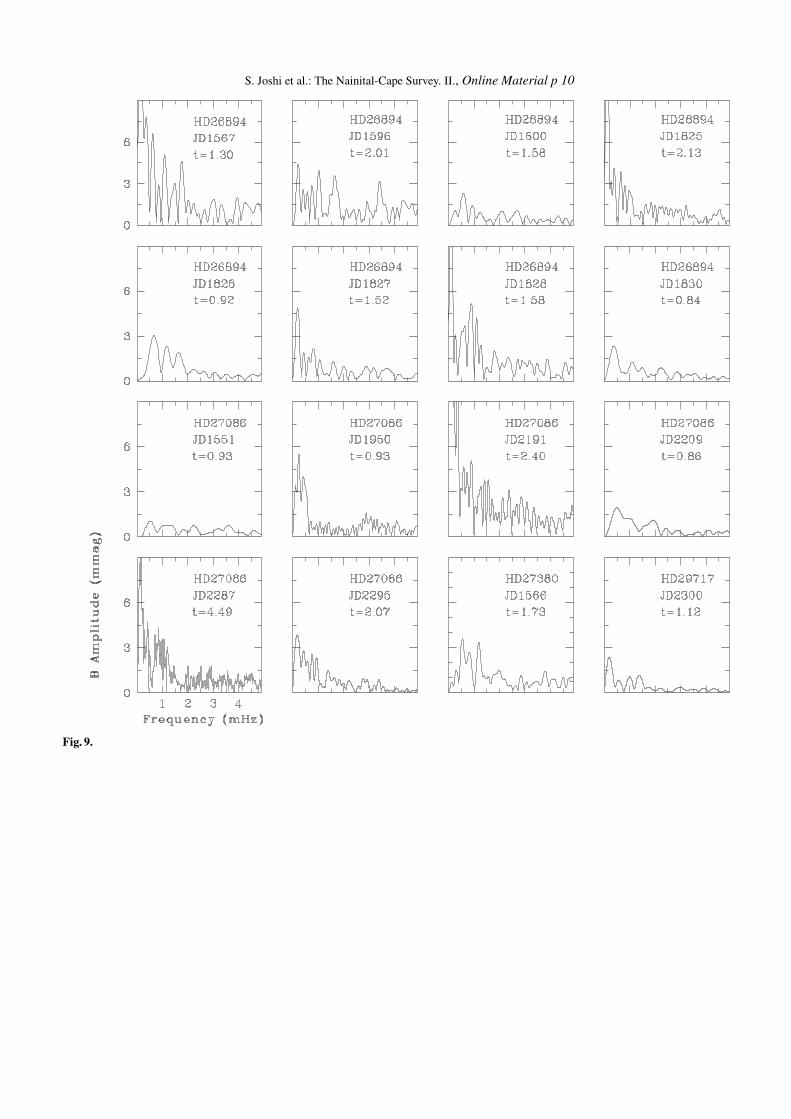
We present here null results from our survey for 140 stars.The observations cover a time range from 1999 January to 2004December. They are presented in both tabular and graphic form,and analyzed below. Table 1, Figs. 9 and 10 show examples ofthe results for a few stars; the complete table and figures areavailable in electronic form with this paper.
The fourteen columns of Table 1 list respectively, for eachstar: HD number, right ascension α2000, declination δ2000, visualmagnitude V , spectral type, spectral indices b−y, m1, c1, β, δm1,δc1, peculiar parameter ∆p (Masana et al. 1998), Julian dateson which the star was observed, and time of each observing runin hours. Figure 9 shows examples of spectra corrected for ex-tinction, but filtered for low-frequency noise that we consider tobe mostly, or completely caused by sky transparency variations.Figure 10 presents prewhitened spectra that have been filtered forlow-frequency noise. The prewhitening strategy was to removethe low-frequency peaks in the range 0−0.5 mHz, if those werehigher than peaks above 0.5 mHz. Because of this procedure,the amplitude threshold above which low frequency peaks wereremoved varies from star to star. In this sense, the spectra cor-rected only for extinction form a more homogeneous set of data,since the data reduction process is the same for all stars. On theother hand, the corresponding spectra often present a large lowfrequency peak, in the sidelobes of which stellar peaks may beburied. We decided to present the two sets of data because theyare complementary, and both are required for a proper analysisof the observations.
By observing the amplitude spectra of Fig. 9, one can no-tice that the average level of the peaks is in general higher in thelow frequency region, and decreases towards higher frequencies.This higher level is mainly caused by residual sky transparencyvariations. Above the low-frequency region, the spectrum
3 For comparison, Kurtz et al. (2005) achieved 14-µmag photomet-ric precision for the roAp star HR 1217 with a three-week multi-sitecampaign using the Whole Earth Telescope.

310 S. Joshi et al.: The Nainital-Cape Survey. II.
flattens to a level which corresponds to the scintillation noise.This tells us that the detection of a peak in the low-frequencyregion is more difficult than at higher frequencies because thenoise level is higher. Hence, detecting δ Sct pulsations (longerthan about 0.5 h) is difficult, unless they have very large ampli-tude. This is the reason why long pulsation periods are difficultto detect with our high-speed technique, and might explain whysuch pulsations are actually not detected in evolved roAp stars.In the prewhitened spectra (Fig. 10), note that the tallest peaksare not found in the [0−0.5] mHz frequency region, becauseprewhitening has removed the largest low frequency contribu-tions. Prewhitening is aimed at removing the major part of thesky transparency variations, but this process also removes anypulsations which may be hidden at low frequency.
In this regard, the null results mean that no peak in anyregion of the spectrum was sufficiently high with respect to thesurrounding noise level to be considered as the signature of apulsating star. One may be tempted to extrapolate that for anyparticular star which belongs to these null results, there is atany given frequency no pulsation higher than the noise level re-ported in the corresponding spectrum. This is true for the par-ticular epochs at which the star was observed, but it may not bethe case at other epochs. Rotational amplitude modulation andbeating between frequencies may result in pulsations not beingvisible at a particular time (see, e.g., Martinez & Kurtz 1994 andHandler 2004 for further discussions of these phenomena). It istherefore likely that some of these 140 stars are actually pulsat-ing. Many of the stars have been observed only once or a veryfew times (see full electronic figure and the table). Hence, manyof the corresponding results are inconclusive rather than nega-tive, and observers should not be discouraged from observingthese stars further.
For stars with multiple observing runs, if a null result isfound every time the star is observed, no variability or variabilitywith an amplitude below the noise level are strongly favouredconclusions. For those stars where variability could not be de-tected several times, this result is interesting, showing that thereare stars lying inside the classical instability strip that do notshow any variability at high precision. This knowledge is es-sential to our understanding of what distinguishes the pulsatingCP stars from similar non-pulsating CP stars, and helps us toidentify or refine the parameters which distinguish constant fromvariable CP stars.
For those stars that may in the future be found to be pulsat-ing, even though classified as null results here, the present spec-tra provide a useful reference about the time and the sensitivityfor which pulsations were not apparent. This was, for example,the case for HD 116114, which was observed in two photomet-ric searches for new roAp stars (Nelson & Kreidl 1993; Martinez& Kurtz 1994). No photometric variability was found in eithersurvey, and the star was considered to be a noAp star. However,Elkin et al. (2005) later discovered in HD 116114 radial velocityvariations with a period near 21 min.
We shall go a bit further in the analysis of our null results,and turn to their detection limits. Assessing a criterion to de-rive a detection limit, with the purpose that this limit is bothgeneral and significant is difficult (see Mary 2005, and refer-ences therein for the problem of asteroseismic light curve anal-ysis, and Mary 2006 for the particular problem of the detectionlimits in fast photometry). The reasons are that the level of thesky transparency variation, that of the scintillation noise, and thefrequency regions where either of these noise sources dominatesvaries from night to night, and sometimes during a given night,as well. For each particular run, one can assess the detection
0 1 2 3 4 5 60
2
4
6
8
10
12
14
16
18
20
∆ B (mmag)
No.
of L
ight
Cur
ves
Fig. 7. Distribution of the detection limits (as the tallest peak in thespectrum) in the Nainital-Cape Survey.
0 0.5 1 1.5 2 2.5 3 3.5 4 4.50
5
10
15
20
25
Position of the highest peak (mHz)
No.
of L
ight
Cur
ves
Fig. 8. Distribution of the positions of the tallest peaks in theprewhitened light curves.
limit by considering the shape of the spectrum, the noise levelin the flat frequency region, and the tallest peak of the spectrum.This tallest peak can be considered as an upper value of the de-tection limit for a particular observation. For each prewhitenedlight curve of our null results, we selected the tallest peak; thedistribution of these detection limits is displayed in Fig. 7.
In most cases, the tallest peak has an amplitude in the range0.5−1.5 mmag. For this distribution, the mean and median val-ues are respectively 1.5 and 1.3 mmag; 1.5 mmag, which is lessthan the largest amplitude of many known roAp stars. On theother hand, the number of roAp stars having small amplitudepulsations is expected to increase dramatically below 1.5 mmag,so that efforts towards pushing down this limit would most prob-ably lead to the discovery of many new variables. This may beaccomplished by increasing the duration of the observing runsfor each star. If we now turn to the frequency at which the tallestpeak occurs, we obtain the distribution of Fig. 8.
Again, it can be observed that the prewhitening procedurehas removed the peaks at very low frequency. Usually, the high-est peak is found in the low frequency region of 0.5−2 mHz; themedian value is 1.0 mHz and the mean 1.3 mHz. The occurrenceof the tallest peak at these frequencies is due to residual skytransparency variations, but probably also to undetected δ Sctand roAp stars. Above about 2 mHz, the distribution tends toflatten. It is not clear whether the bump around 1.9 mHz in thetypical range for roAp star frequencies is caused by noise, or is

S. Joshi et al.: The Nainital-Cape Survey. II. 311
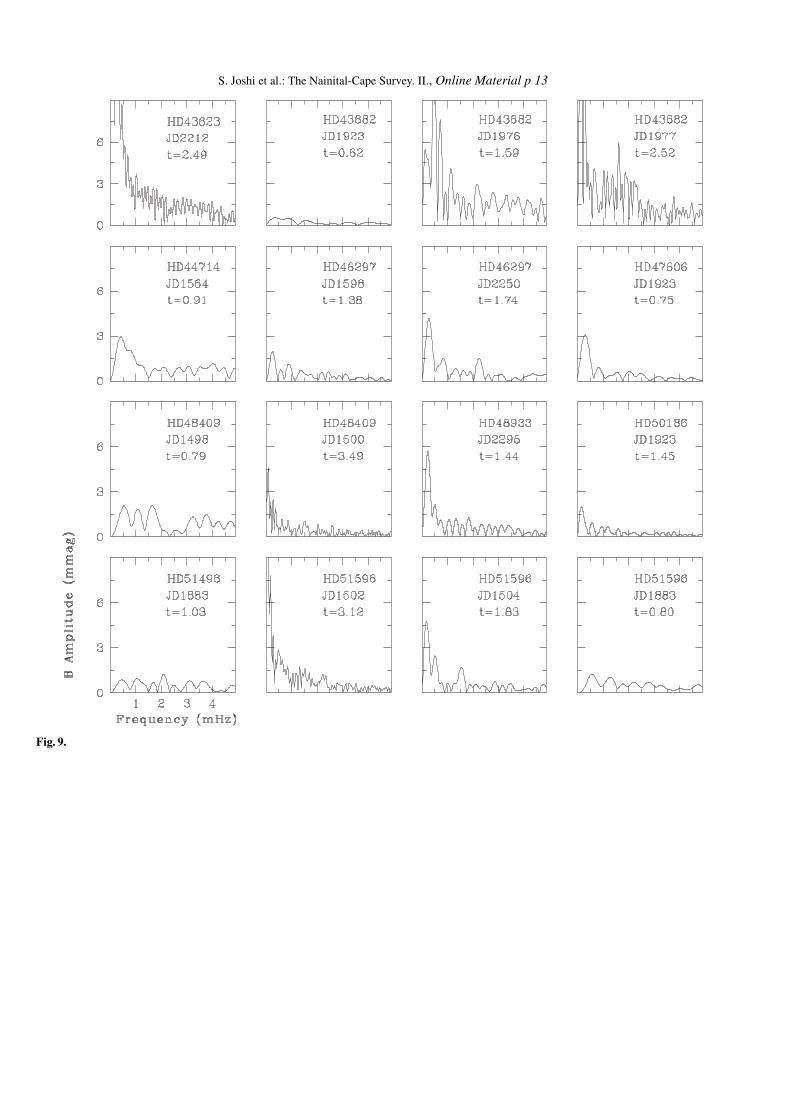
Fig. 9. Null results from the Nainital-Cape Survey: Examples of amplitude spectra for eleven sample stars corrected only for extinction, andin some cases for some very long-term sky transparency variations. Each panel contains the Fourier transform of an individual light curve,covering a frequency range of 0 to 5 mHz, and an amplitude range of 0 to 9 mmag. The name of the object, date of the observation in Juliandate (JD 2 450 000+) and duration of the observations in hours (h), are mentioned in each panel. The rest of these amplitude spectra are availableelectronically.
indicative of more pulsators in the sample. It could also be in-dicative of a low-level instrumentally-induced frequency, suchas a telescope drive oscillation, affecting the data of many stars.
The above results are very similar to those obtained at theSAAO site and discussed by Martinez & Kurtz 1994 (see in par-ticular their Figs. 1 and 2 for a comparison of Fig. 7 and Fig. 8).These analyses show in particular that Manora Peak (Nainital) isa good photometric site.
We shall make a few comments regarding the possible im-provements of our null results. As far as scintillation noise isconcerned on the one hand, its level can be reduced by in-creasing the size of the telescope and by observing at a lowerairmass (Young 1967; Dravins et al. 1998). These two factorswill be improved in the future since ARIES is building a 1.3-m
telescope 50 km further away in the mountains, and at a higheraltitude (Devasthal site, 2420 m instead of 1951 m at ManoraPeak). There is also a project to build a 3-m telescope. For thestudies of this kind of variables, such a telescope will be use-ful for photometry indeed, but also mostly for spectroscopy. Thebenefits of spectroscopic studies for asteroseismology are huge;see, for instance, the review of Kurtz (2005) on this topic, andthe cases of HD 116114 (Elkin 2005), HD 154708 (Kurtz et al.,in preparation) and β CrB (Hatzes & Mkrtichian 2004). As forreducing sky transparency variations on the other hand, it wouldbe possible to improve the detection in the low frequency rangeby increasing the duration of the runs, but this would be at theprice of investigating a reduced number of candidates – a com-promise to be dealt with in this kind of survey.

312 S. Joshi et al.: The Nainital-Cape Survey. II.
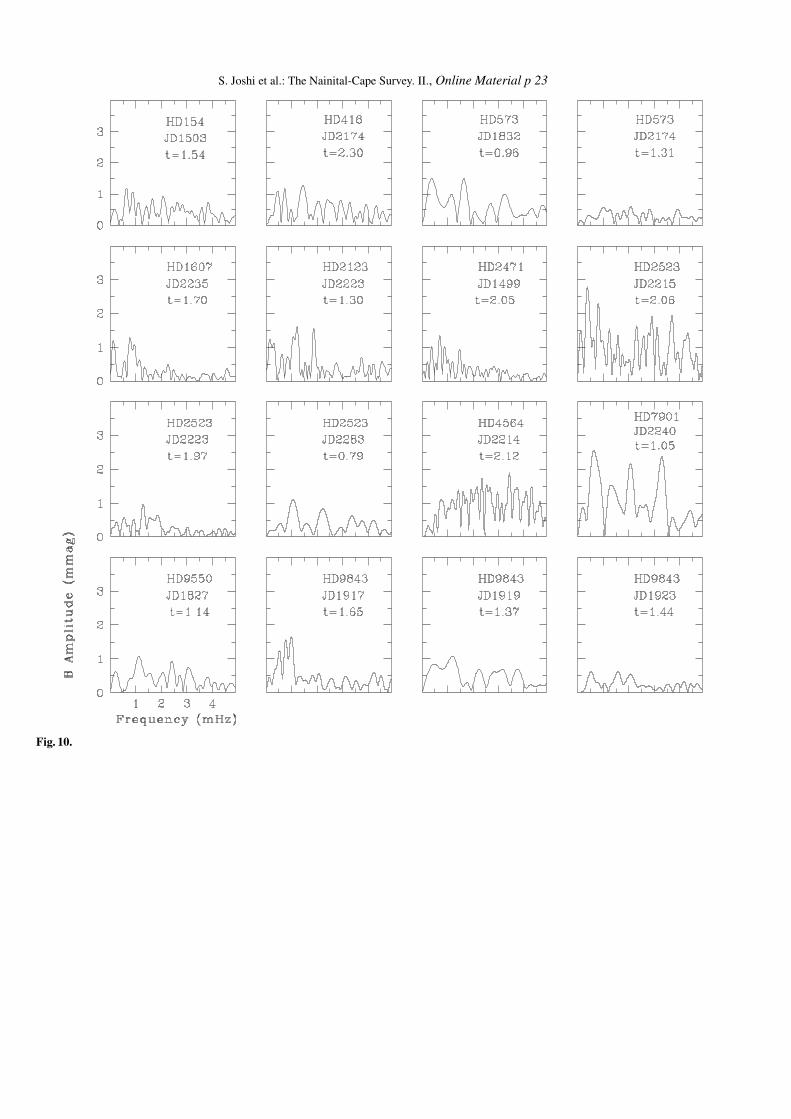
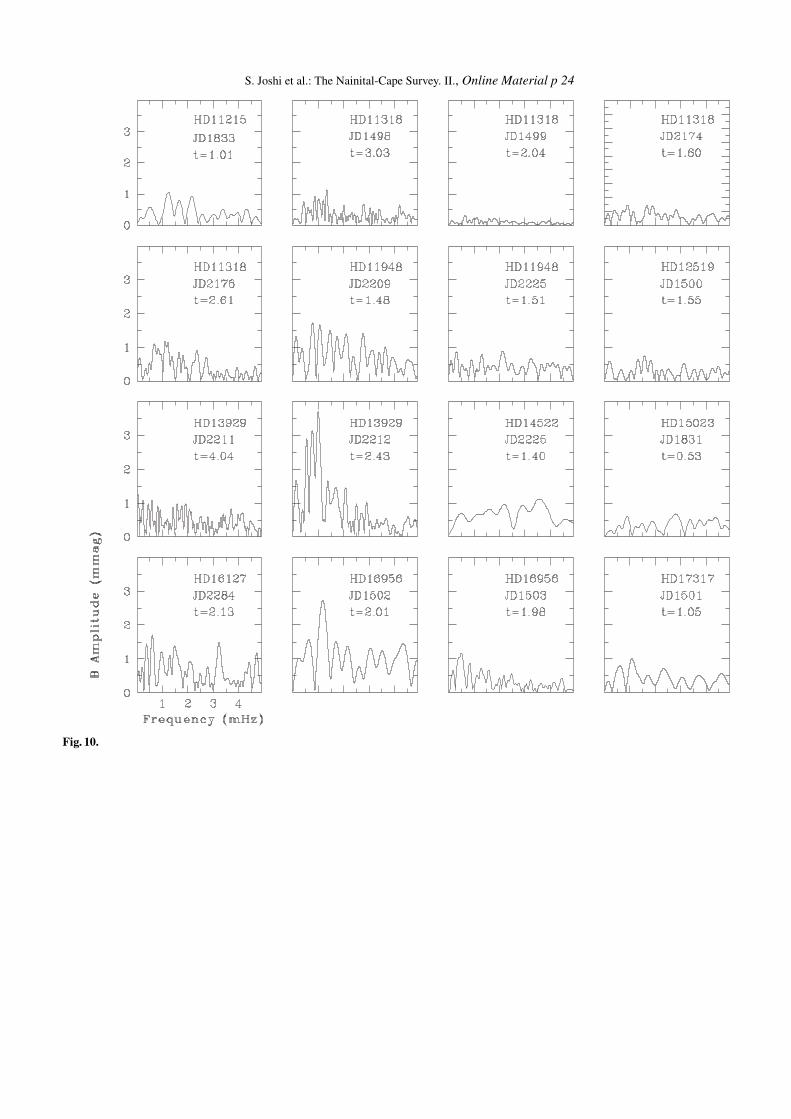
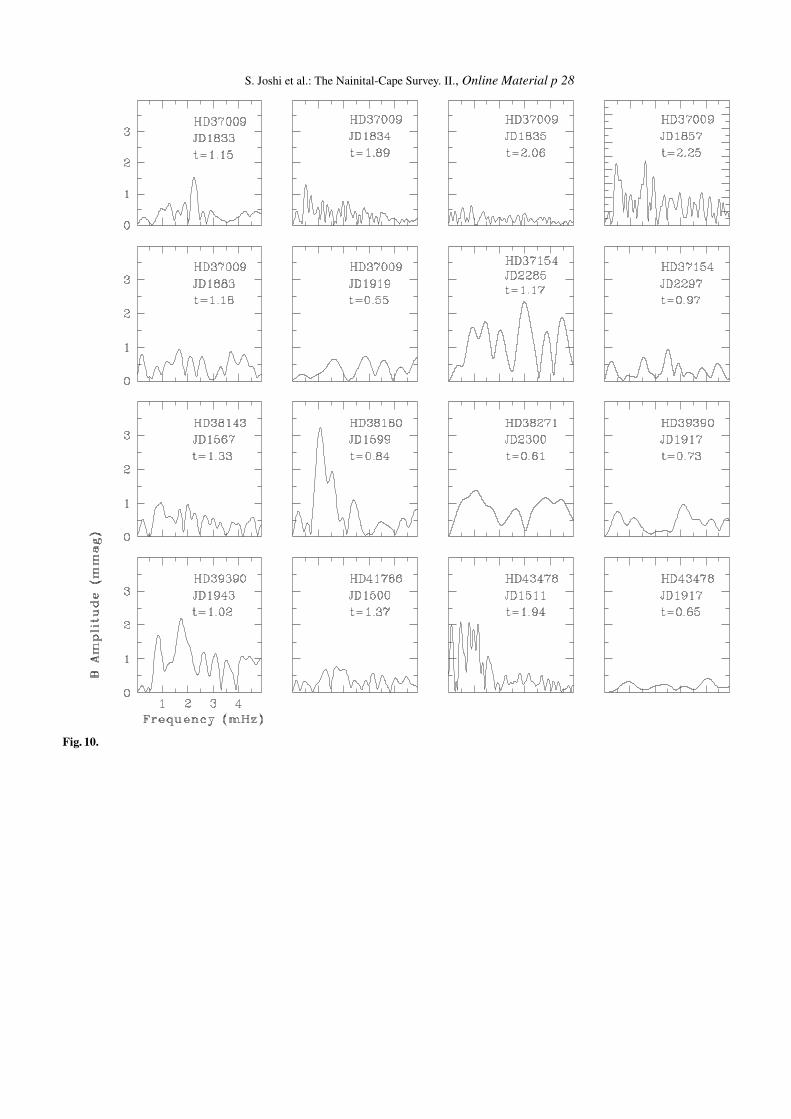
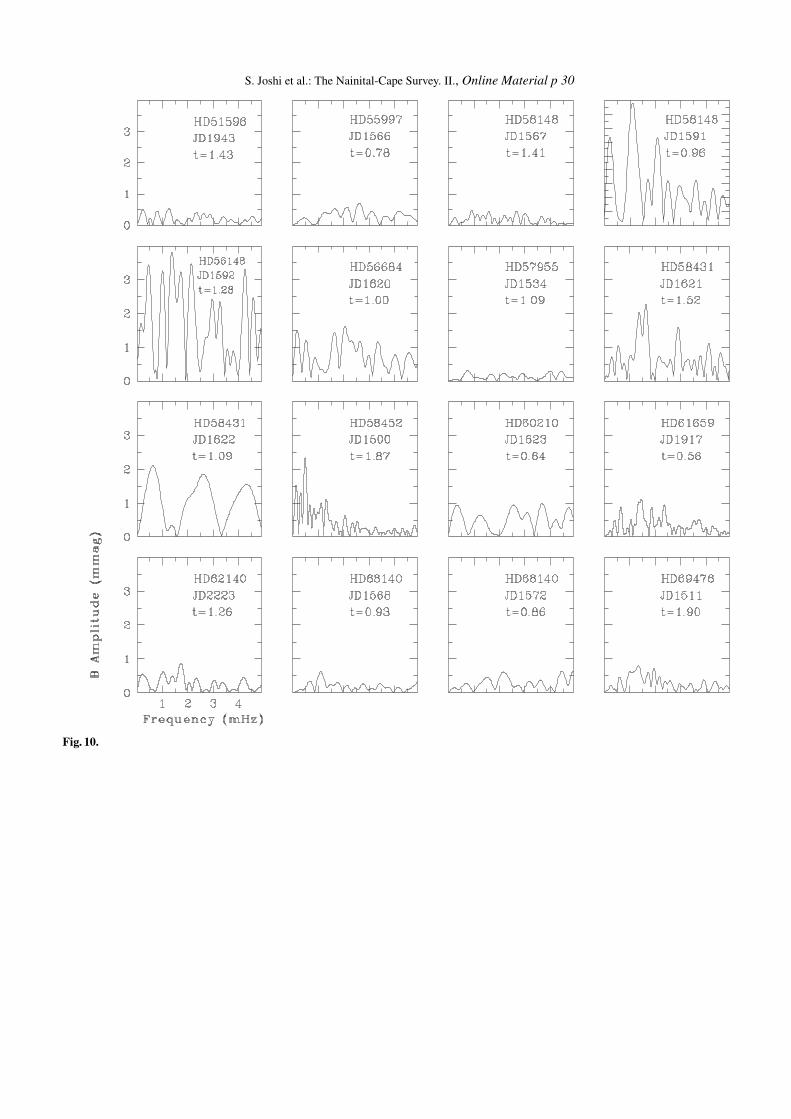
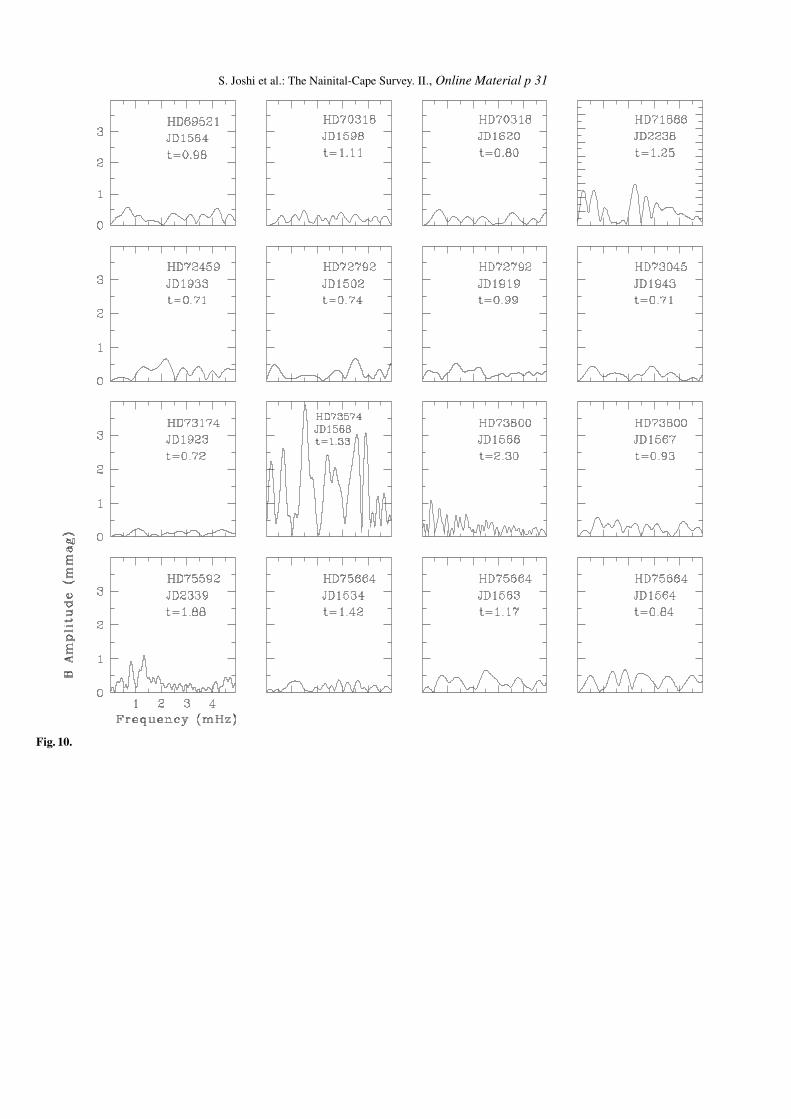
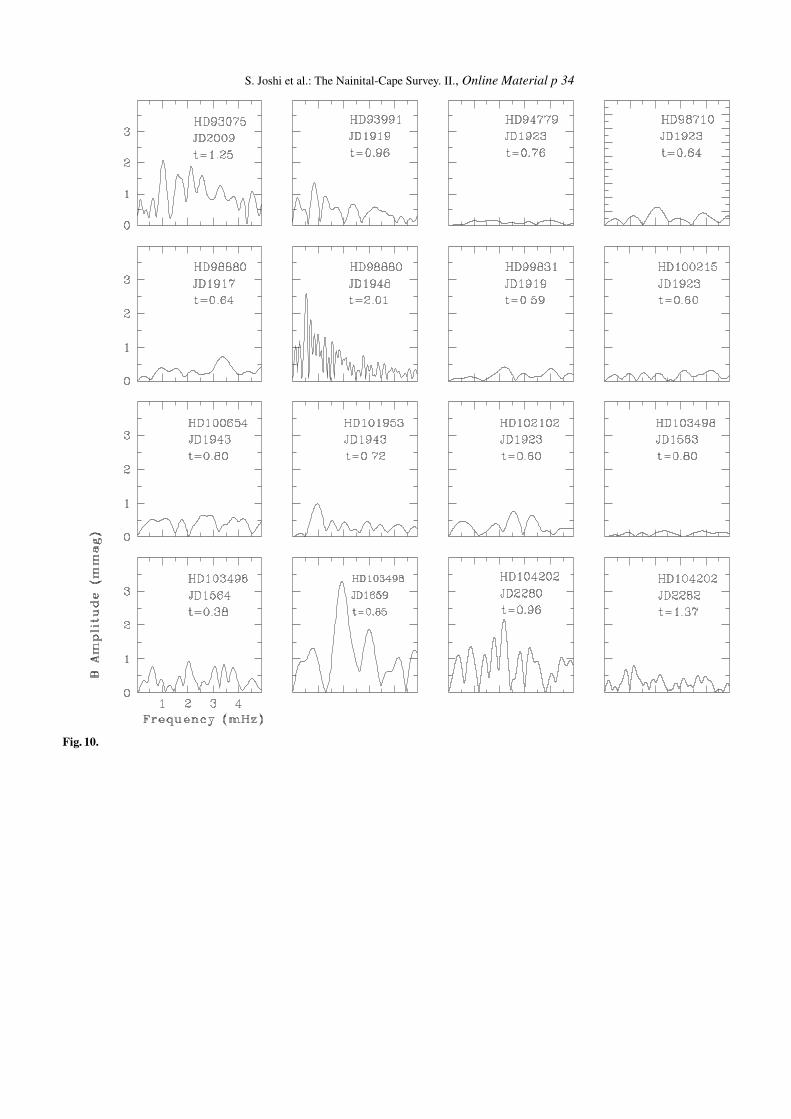
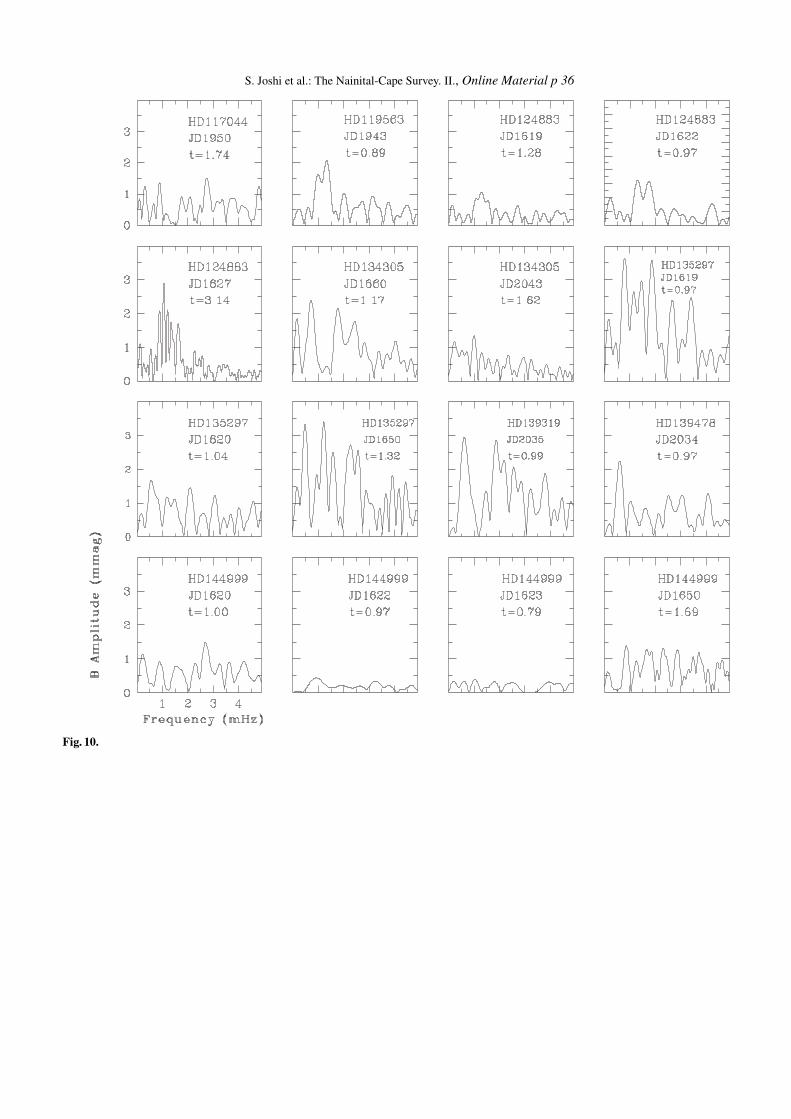
Fig. 10. Null results from the Nainital-Cape Survey: Examples of prewhitened amplitude spectra for eleven sample stars. Each panel contains theFourier transform of an individual light curve, covering a frequency range of 0 to 5 mHz, and an amplitude range of 0 to 4 mmag. The name ofthe object, date of the observation in Julian date (JD 2 450 000+) and the length duration in hours (h), are mentioned in each panel. The rest of theamplitude spectra are available electronically.
5. Conclusions
We presented in this paper results obtained from the Nainital-Cape Survey from the years 2000 to 2004. We reported thepulsation discovered in several stars with CP spectral classifi-cations during this time range; we also presented and analyzedour null results.
Pulsations of the δSct type were discovered in the evolvedAm stars HD 98851 (main frequencies: 0.20 mHz and 0.10 mHz)and HD 102480 (main frequencies: 0.09 mHz and 0.19 mHz).Very interestingly, both stars exhibit unusual and alternatinghigh and low amplitude maxima, with a period ratio of 2:1. Thestar HD 113878 pulsates with a period of 2.31 h, which is alsotypical for δ Sct stars. The three stars HD 98851, HD 102480 andHD 113878 form part of a group of four stars described by Abt(1984) and are similar in the sense that they do not show theclassical difference of more than 0.5 spectral class between theK line types and the metallic lines. These four stars are, however,
classified as Am stars by their strong Sr ii lines, weak λ4226Ca i line, and other indications of their general abnormality. Theother star in this group is HD 104202. If that star turns out tobe variable as well, these objects can provide interesting insightson the relationship of chemical composition and pulsations. Thestar HD 118660 seems to exhibit multi-periodic variability witha prominent period of nearly 1 h. Further observations are re-quired to determine the additional periods. This bright star isa good target for a multi-site campaign using small telescopes.Finally, in HD 207561, classified as an Am star, an intriguingpulsation period of 6 min was clearly detected in the light curvesobtained on two consecutive nights. It does not seem that thisoscillation is caused by instrumental noise, but this result shouldbe taken with care. The importance of the question of the coexis-tence of pulsations, chemical peculiarity and magnetic field callsfor further photometric, spectroscopic, and magnetic studies ofthis star.

S. Joshi et al.: The Nainital-Cape Survey. II. 313
The Nainital-Cape survey is an on-going project. As the sur-vey progresses, new results are obtained regularly. In order toimprove our strategy for the current and future observations,more luminous peculiar stars were recently included in our list.The peculiarity criterion defined by Masana et al. (1998) is auseful tool in this direction. Up to now, the results obtained fromthe survey (reported in Paper I and here) have brought new andimportant information regarding the general properties of vari-able Ap and Am stars. These results will contribute to, and stim-ulate other investigations of these fascinating objects.
Acknowledgements. S.J. acknowledges the help from INDU for reading themanuscript rigorously. This work was carried out under the Indo-South AfricanScience and Technology Cooperation Program as a joint project titled “Nainital-Cape Survey for roAp stars”, funded by Departments of Science and Technologyof the Indian and South African governments.
References
Abt, H. A. 1984, ApJ, 285, 247Abt, H. A., & Morrell, N. I. 1995, ApJS, 99, 135Amado, P., et al. 2004, in The A-Star Puzzle, ed. J. Zverko, W. W. Weiss, J.
Žižnovský, S. J. Adelman, & W. W. Weiss (Cambridge University Press),IAU Symp., 224, 863
Arlt, R. 2004, in The A-Star Puzzle, ed. J. Zverko, W. W. Weiss, J. Žižnovský,S. J. Adelman, & W. W. Weiss (Cambridge University Press), IAU Symp.,224, 103
Ashoka, B. N., Seetha, S., Raj, E., et al. 2000, BASI, 28, 251Bagnulo, S., Landolfi, M., & Landi degl’Innocenti, M. 1999, A&A, 343, 865Balmforth, N. J., Cunha, M. S., Dolez, N., Gough D. O., & Vauclair, S. 2001,
MNRAS, 323, 362Bertaud, C., & Floquet, M. 1974, A&AS, 1974, 16, 71Bigot, L., & Dziembowski, W. A. 2002, A&A, 391, 235Breger, M. 2000, in Delta-Scuti and Related Stars, ed. M. Breger, & H.
Montgomery (San Francisco: ASP), ASP Conf. Ser., 210, 3Chevalier, C. 1971, A&A, 14, 24Cowley, A. P., & Cowley, C. R. 1965, PASP, 77, 184Cox, J. P. 1984, ApJ, 280, 220Cox, A. N., King, D. S., & Hodson, S. W. 1979, ApJ, 231, 798Crawford, D. L. 1975, AJ, 80, 955Cunha, M. S. 2002, MNRAS, 333, 47Cunha, M. S. 2005, JApA, 26, 213Deeming, T. J. 1975, Ap&SS, 36, 137Dorokhova, T. N., & Dorokhov, N. I. 1998, in Proceedings of the 26th meeting
of the European Working Group on CP stars, ed. P. North, A. Schnell, & J.Žižnovský, Contributions of the Astronomical Observatory Skalnaté Pleso,Slovak Academy of Sciences, 27, 338
Dolez, N., & Gough, D. O. 1982, in Pulsations in Classical & Cataclys. Var.stars, Knudsen, 248
Dolez, N., Gough, D. O., & Vauclair, S. 1988, in Advances in Helio-and Asteroseismology, ed. J. Christensen-Dalsgaard, & S. Frandsen,IAU Symp., 123, 291
Dravins, D., Lindegren, L., Mezey, E., & Young, A. T. 1998, PASP, 110, 1118Dworetsky, M. M. 2004, in The A-Star Puzzle, ed. J. Zverko, W. W. Weiss, J.
Žižnovský, S. J. Adelman, & W. W. Weiss (Cambridge University Press),IAU Symp., 224, 499
Dziembowski, W. A., & Goode, P. R. 1985, ApJ, 296, L27Dziembowski, W. A., & Goode, P. R. 1996, ApJ, 458, 338Elkin, V. G., Riley, J. D., Cunha, M. S., Kurtz, D. W., & Mathys, G. 2005,
MNRAS, 358, 665ESA 1997, The Hipparcos and Tycho Catalogue, European Space Agency,
SP 1239, ESA Publications, Division, ESTEC, Noordwijk, The NetherlandsGautschy, A., Saio, H., & Harzenmoser, H. 1998, MNRAS, 301, 31Girish, V., Seetha, S., Martinez, P., et al. 2001, A&A, 380, 142Hauck, B., & Mermilliod, M. 1998, A&AS, 129, 431Handler, G. 2004, Commun. Asteroseismol., 145, 71Handler, G., & Paunzen, E. 1999, A&AS, 135, 57Hatzes, A. P., & Mkrtichian, D. E. 2004, MNRAS, 351, 2
Heller, C. H., & Kramer, K. S. 1988, PASP, 100, 583Henry, G. W., & Fekel, F. C. 2003, AJ, 126, 3058Henry, G. W., & Fekel, F. C. 2005, AJ, 129, 2026Houdek, G., Balmforth, N. J., Christensen-Dalsgaard, J., & Gough, D. O. 1999,
A&A, 351, 582Hubrig, S., Nesvacil, N., Schöller, M., et al. 2005, A&A, 440, 37Hubrig, S., Kharchenko, N., Mathys, G., & North, P. 2000, A&A, 335, 1031Joshi, S., Girish, V., Martinez, P., et al. 2000, IBVS, 4900Joshi, S., Girish, V., Sagar, R., Martinez, P., & Seetha, S. 2002, Commun.
Asteroseismol., 142, 50Joshi, S., Girish, V., Sagar, R., et al. 2003, MNRAS, 344, 431Koen, C., Kurtz, D. W., Gray, R. O., et al. 2001, MNRAS, 326, 387Kreidl, T. J., Kurtz, D. W., Bus, S. J., et al. 1991, MNRAS, 250, 477Kurtz, D. W. 1976, ApJS, 32, 651Kurtz, D. W. 1978, ApJ, 221, 869Kurtz, D. W. 1980, MNRAS, 193, 61Kurtz, D. W. 1982, MNRAS, 200, 807Kurtz, D. W. 1984, MNRAS, 206, 253Kurtz, D. W. 1985, MNRAS, 213, 773Kurtz, D. W. 1989, MNRAS, 238, 1077Kurtz, D. W. 1990, ARA&A, 28, 607Kurtz, D. W. 2000, in Delta-Scuti and Related Stars, ed. M. Breger, & H.
Montgomery (San Francisco: ASP), ASP Conf. Ser., 210, 287Kurtz, D. W. 2005, JApA, 26, 123Kurtz, D. W., Garrison, R. F., Koen, C., Hofmann, G. F., & Viranna, N. B. 1995,
MNRAS, 276, 199Kurtz, D. W., & Martinez, P. 2000, Baltic Astron., 9, 253Kurtz, D. W., Cameron, C., Cunha, M. S., et al. 2005, MNRAS, 358, 651Leroy, J. L., Landolfi, M., Landi degl’Innocenti, M., Landi degl’Innocenti, E.,
Bagnulo, S., & Laporte, P. 1995, A&A, 301, 797Martinez, P., & Kurtz, D. W. 1994, MNRAS, 271, 129Martinez, P., & Kurtz, D. W. 1995, Ap&SS, 230, 29Martinez, P., Kurtz, D., Ashoka, B. N., et al. 2001, A&A, 371, 1048 (Paper I)Mary, D. L. 2005, JApA, 26, 283Mary, D. L. 2006, A&A, 452, 715Masana, E., Jordi, C., Maitzen, H. M., & Torra, J. 1998, A&AS, 128, 265Matthews, J. M., Wehlau, W. H., & Kurtz, D. W. 1987, ApJ, 313, 782Matthews, J. M. 1988, MNRAS, 235, 7PMichaud, G. 1970, ApJ, 160, 641Michaud, G., & Proffitt, C. R. 1993, in Inside the stars, ed. W. W. Weiss, & A.
Baglin (San Francisco: ASP), ASP Conf. Ser., 40, 246Nelson, M. J., & Kreidl, T. J. 1993, AJ, 105, 1903Nicolet, B. 1982, A&AS, 48, 485Noels, A., Montalbán, J., & Maceroni, C. 2004, The A-Star Puzzle, ed. J. Zverko,
W. W. Weiss, J. Žižnovský, S. J. Adelman, & W. W. Weiss (CambridgeUniversity Press), IAU Symp., 224, 47
North, et al. 1997, in Proceedings of the ESA Symposium, Hipparcos – Venice97, Venice, Italy, ESA SP-402 (July 1997), p. 239
Reiners, A., & Royer, F. 2004, A&A, 415, 325Sagar, R. 1999, Current Science, Vol. 77, No. 5, p. 643Sagar, R., & Mary, D. L. 2005, JApA, 26, 339Saio, H. 2005, MNRAS, 360, 1022Saio, H., & Gautschy, A. 2004, MNRAS, 350, 485Seetha, S., Chaubey, U. S., Girish, V., et al. 2001, BASI, 29, 309Shibahashi, H. 1983, ApJ, 275, L5Takata, M., & Shibahashi, Hiromoto 1995, PASJ, 27, 219Turcotte, S. 2000, in Delta-Scuti and Related Stars, ed. M. Breger, & H.
Montgomery (San Francisco: ASP), ASP Conf. Ser., 210, 468Turcotte, S., Richer, J., Michaud, G., & Christensen-Dalsgaard, J. 2000, A&A,
360, 603Vauclair, S. 2004, in Variable Stars in the Local Group, ed. D. W. Kurtz, & K. R.
Pollard (San Francisco: ASP), ASP Conf. Ser., 310, 413Vauclair, S., & Théado, S. 2004, A&A, 425, 179Wegner, G. 1981, ApJ, 247, 969Wolff, S. C. 1983, The A-Type Stars: Problems and Perspectives, Monograph
series on nonthermal phenomena in stellar atmospheres Nasa SpecialPublication, 463
Yildiz, M. 2003, A&A, 409, 689Young, A. T. 1967, AJ, 72, 747Zhiping, Li 2000, A&A, 362, 595Zhou, Ai-Ying 2001, Commun. Asteroseismol., 140, 59

S. Joshi et al.: The Nainital-Cape Survey. II., Online Material p 1
Online Material

S. Joshi et al.: The Nainital-Cape Survey. II., Online Material p 2
Table 1. Stars classified as null results during the Nainital-Cape survey. A sample of the unprewhitened and prewhitened spectra of these starsare depicted in Fig. 9 and 10 of the paper, respectively. All the spectra are archived electronically. The columns list: HD number, right ascensionα2000, declination δ2000, visual magnitude V , spectral type, spectral indices b−y, m1, c1, β, δm1, δc1, peculiarity parameter ∆p (Masana et al. 1998),Julian dates (2450000+) on which the star was observed, and the duration of observation (∆t) in hours.
HD α2000 δ2000 V Spectral b − y m1 c1 β δm1 δc1 ∆p JD ∆tType hr
154 00 06 24 34 36 25 8.93 F0 0.223 0.230 0.746 2.782 -0.033 0.002 2.892 1503 1.54416 00 08 51 37 12 56 8.91 A5 0.194 0.211 0.746 2.803 -0.008 -0.040 2.064 2174 2.30573 00 10 13 25 31 36 8.90 F0III 0.208 0.253 0.783 2.780 -0.057 0.043 3.497 1832 0.96
2174 1.311607 00 20 27 22 28 47 8.67 F0 0.254 0.222 0.638 2.723 -0.044 0.029 2.544 2235 1.702123 00 26 02 67 50 46 9.60 F5 – – – – – – – 2223 1.302471 00 28 40 37 18 15 8.15 A5 0.084 0.251 0.900 2.892 -0.075 -0.058 2.449 1499 2.052523 00 29 08 11 19 12 8.08 F0 0.219 0.208 0.655 2.733 -0.028 0.016 1.675 2215 2.06
2223 1.972283 0.79
4564 00 48 00 36 12 17 8.05 A5 0.150 0.228 0.802 2.824 -0.022 -0.024 2.290 2214 2.127901 01 20 36 67 14 02 8.44 A3 0.212 0.209 0.720 2.750 -0.024 0.040 1.670 2240 1.059550 01 34 24 38 50 44 8.29 A3 0.199 0.213 0.740 2.762 -0.024 0.036 1.765 1827 1.149843 01 36 41 35 36 59 8.22 F8 0.286 0.179 0.735 2.706 -0.006 0.187 0.908 1917 1.65
1919 1.371923 1.44
11215 01 51 40 54 56 37 7.93 A2m 0.145 0.239 0.921 2.803 -0.036 0.135 2.197 1833 1.0111318 01 52 29 49 47 58 7.94 A3 0.240 0.362 0.388 2.813 -0.157 -0.418 9.219 1498 3.03
1499 2.042174 1.602176 2.61
11948 01 58 50 55 34 54 7.84 A5 0.115 0.242 0.879 2.873 -0.040 -0.037 2.514 2209 1.482225 1.51
12519 02 03 29 26 32 14 8.46 A5 0.238 0.290 0.552 2.802 -0.087 -0.232 5.985 1500 1.5513929 02 17 34 58 01 14 7.49 Am 0.134 0.237 0.840 2.826 -0.030 0.011 2.386 2211 4.04
2212 2.4314522 02 21 19 28 04 16 8.78 A2 0.141 0.229 0.913 2.901 -0.071 -0.066 2.190 2225 1.4015023 02 27 29 58 58 12 8.30 F2II 0.178 0.221 0.736 2.790 -0.021 -0.024 2.151 1831 0.5316127 02 36 22 35 32 10 9.38 A0 0.057 0.190 1.068 2.865 0.014 0.168 1.174 2281 2.1316956 02 43 41 21 08 51 7.79 A2mp 0.104 0.277 0.822 2.851 -0.071 -0.050 3.779 1502 2.01
1503 1.9817317 02 47 28 21 20 44 8.62 Am 0.230 0.226 0.780 2.750 -0.041 0.100 2.390 1501 1.05
1825 1.322300 1.16
17431 02 49 18 45 15 37 8.50 A3 0.218 0.258 0.672 2.769 -0.066 -0.046 3.921 1827 1.411830 1.452239 3.192250 2.37
19342 03 09 21 58 45 25 8.00 Am 0.310 0.198 0.772 2.733 -0.018 0.133 2.062 1832 0.9120919 03 24 19 49 13 16 9.00 A8 0.207 0.178 0.765 2.775 0.016 0.035 0.610 1834 0.8521213 03 26 03 20 14 44 8.70 A5 0.218 0.221 0.741 2.758 -0.034 0.045 2.237 1826 1.28
1830 0.851834 0.84
21527 03 30 19 48 29 58 8.89 A7I – – – – – – – 1926 0.8523734 03 48 10 21 19 45 7.97 A5 0.125 0.211 0.820 2.808 -0.007 0.024 1.175 2283 1.8325515 04 05 36 50 45 35 8.70 F3III 0.262 0.177 0.745 2.706 -0.004 0.197 0.540 1832 0.7826894 04 19 12 63 57 29 7.97 F0 0.118 0.228 0.847 2.847 -0.021 -0.017 1.993 1565 1.79
1566 2.071567 1.301596 2.011600 1.581825 2.131826 0.921827 1.521828 1.581830 0.84

S. Joshi et al.: The Nainital-Cape Survey. II., Online Material p 3
HD α2000 δ2000 V Spectral b − y m1 c1 β δm1 δc1 ∆p JD ∆tType hr
27086 04 18 22 37 34 38 8.47 F0 0.217 0.190 0.920 2.833 0.017 0.080 1.408 1551 0.931950 0.932191 2.402209 0.862287 4.492295 2.07
27380 04 23 44 65 59 28 9.16 G5 – – – – 1566 1.7329717 04 40 58 02 30 21 8.09 F0 0.239 0.223 0.760 2.769 -0.031 0.042 2.630 2300 1.1230110 04 48 12 59 14 27 7.48 Fm 0.192 0.202 0.729 2.760 -0.014 0.029 1.268 1568 1.01
1571 3.231572 5.021591 1.261594 2.531919 0.591948 1.51
32444 05 06 21 55 07 15 8.51 A3 0.362 0.233 0.753 2.769 -0.041 0.035 4.411 2212 1.412223 2.92
32608 05 06 01 35 56 12 6.50 A5V 0.094 0.202 0.908 2.838 0.006 0.061 0.542 2238 3.3332633 05 06 08 33 55 09 7.07 B9p -0.012 0.132 0.534 2.725 -0.029 0.108 5.062 2296 1.04
2305 2.0133619 05 13 24 41 18 54 8.65 A5 0.186 0.211 0.745 2.784 -0.014 -0.003 1.775 1503 1.29
1923 0.742225 1.15
37009 05 38 12 50 31 58 8.06 F0 0.216 0.196 0.732 2.736 -0.015 0.084 1.046 1830 0.891833 1.151834 1.891835 2.061857 2.251883 1.181919 0.55
37154 05 39 57 57 08 14 8.81 F0 0.215 0.279 0.654 2.769 -0.087 -0.064 4.727 2285 1.172297 0.97
38143 05 44 22 18 31 37 8.41 A2 0.208 0.205 0.698 2.786 -0.007 -0.054 1.919 1567 1.3338180 05 45 10 28 15 10 8.43 A5 0.212 0.250 0.776 2.782 -0.053 0.032 3.465 1599 0.8438271 05 44 43 03 11 38 8.58 A2 0.102 0.255 0.895 2.858 -0.050 0.009 2.789 2300 0.6139390 05 56 03 59 01 44 8.53 Fm 0.199 0.183 0.701 2.723 -0.005 0.092 0.300 1917 0.73
1943 1.0241786 06 08 02 21 17 43 7.29 F0 0.193 0.275 0.690 2.782 -0.078 -0.054 4.393 1500 1.37
1917 0.6443478 06 17 51 32 30 16 7.50 A3 0.259 0.240 0.663 2.721 -0.063 0.060 3.213 1511 1.9443623 06 19 07 39 46 28 9.23 F0 0.199 0.231 0.732 2.791 -0.031 -0.030 2.788 2212 2.4943682 06 18 11 15 57 09 8.43 Am 0.195 0.190 0.736 2.776 1.007 0.004 1.008 1923 0.62
1976 1.591977 2.52
44714 06 23 29 05 36 09 8.63 A5 0.146 0.209 0.801 2.846 -0.002 -0.061 1.679 1564 0.9146297 06 34 02 33 31 40 8.56 A2 0.015 0.272 0.849 2.874 -0.071 -0.069 2.599 1598 1.38
2250 1.7447606 06 42 52 56 41 35 7.32 A5 0.130 0.209 0.997 2.804 -0.005 0.209 0.728 1923 0.7548409 06 45 46 49 04 51 8.40 A3 0.213 0.308 0.517 2.838 -0.100 -0.330 6.779 1498 0.79
1500 3.4948933 06 45 57 01 15 10 8.79 A2 0.090 0.181 1.010 2.839 0.027 0.161 1.825 2295 1.4450186 06 53 06 25 18 41 7.40 Am 0.157 0.261 0.716 2.766 -0.071 0.004 3.219 1923 1.4551496 07 00 57 56 51 13 9.83 F5 – – – – – – – 1883 1.0351596 06 58 03 00 22 09 7.50 A2 0.180 0.209 0.670 2.768 -0.018 -0.046 1.618 1502 3.12
1504 1.831883 0.801943 1.43
55997 07 15 57 16 44 29 9.09 A5III 0.200 0.224 0.683 2.762 -0.035 0.021 2.320 1566 0.78

S. Joshi et al.: The Nainital-Cape Survey. II., Online Material p 4
HD α2000 δ2000 V Spectral b − y m1 c1 β δm1 δc1 ∆p JD ∆tType hr
56148 07 19 48 61 35 31 9.00 F0 0.204 0.178 0.628 2.722 -0.001 0.022 0.316 1567 1.411591 0.961592 1.28
56684 07 19 14 26 59 59 8.31 F0 0.193 0.180 0.673 2.719 -0.003 0.077 0.143 1620 1.0057955 07 23 48 06 56 46 7.65 A2 0.201 0.290 0.636 2.763 -0.101 -0.070 4.961 1534 1.0958431 07 25 53 06 42 49 7.84 F0 0.190 0.193 0.683 2.750 -0.008 0.003 0.893 1621 1.52
1622 1.0958452 07 27 21 37 36 31 8.76 A3 0.173 0.247 0.704 2.820 -0.041 -0.116 3.453 1500 1.8760210 07 33 29 00 16 10 9.03 A2 – – – – – – – 1623 0.6461659 07 42 36 46 29 29 8.65 Am 0.182 0.237 0.797 2.806 -0.033 0.005 2.839 1917 0.5662140 07 46 28 62 49 53 6.47 F0 0.143 0.265 0.735 2.854 -0.059 -0.143 3.965 2223 1.2668140 08 12 04 25 10 50 8.74 F0 0.143 0.254 0.772 2.809 -0.050 -0.026 3.132 1568 0.93
1572 0.8669476 08 18 15 29 04 46 8.26 A3 0.239 0.232 0.633 2.718 -0.056 0.041 2.722 1511 1.9069521 08 18 39 31 48 34 8.77 A3 0.032 0.195 0.651 2.868 0.008 -0.255 0.278 1564 0.9870318 08 21 54 17 36 05 8.20 A3 0.203 0.233 0.707 2.761 -0.045 0.005 2.633 1598 1.11
1620 0.8071866 08 31 10 40 13 29 6.71 A0 0.014 0.264 0.823 2.845 -0.057 -0.037 2.236 2238 1.2572459 08 35 13 50 22 52 8.53 A5V 0.095 0.211 1.036 2.863 -0.007 0.140 0.742 1933 0.7172792 08 37 26 55 59 11 7.63 F0 0.217 0.231 0.714 2.738 -0.050 0.060 2.451 1502 0.74
1919 0.9973045 08 36 48 18 52 59 8.62 Am 0.211 0.199 0.759 2.775 -0.005 0.029 1.469 1943 0.7173174 08 37 37 19 43 58 7.76 Am 0.089 0.243 0.954 2.858 -0.038 0.068 2.057 1923 0.7273574 08 39 42 20 05 10 7.75 A5V 0.127 0.207 0.871 2.799 -0.004 0.093 0.843 1566 1.3373800 08 40 28 07 08 38 8.58 F0 0.218 0.178 0.608 2.718 -0.002 0.016 0.481 1566 2.30
1567 0.9375592 08 52 14 37 56 33 9.32 F0 0.180 0.214 0.725 2.751 -0.029 0.043 1.501 2339 1.8875664 08 51 23 02 13 16 8.65 A5 0.159 0.232 0.740 2.787 -0.034 -0.014 2.316 1534 1.42
1563 1.171564 0.841567 1.15
76310 08 55 59 21 41 33 8.54 Am 0.168 0.211 0.770 2.775 -0.017 0.040 1.419 1568 0.961571 0.861572 1.251591 1.061943 1.93
76444 08 57 07 29 12 58 9.11 F0 0.176 0.191 0.752 2.745 -0.008 0.082 0.455 1598 1.551599 1.251620 0.76
77081 09 00 20 03 31 48 8.94 A3 0.187 0.239 0.724 2.804 -0.035 -0.064 3.111 1533 1.2778140 09 07 23 28 07 13 9.09 F0 0.171 0.225 0.734 2.779 -0.029 -0.004 2.109 2246 0.6378214 09 06 54 -02 19 00 9.82 F8 – – – – – – – 1948 1.5978388 09 09 52 49 49 57 7.61 FIII 0.231 0.172 0.710 2.709 0.002 0.153 0.101 1917 0.55
1948 2.281950 1.491983 1.442296 2.622297 3.622305 1.86
79798 09 18 42 60 53 12 8.61 A2 0.155 0.188 0.814 2.778 0.007 0.078 0.333 2239 0.8681029 09 23 15 03 30 04 7.30 F0 0.200 0.199 0.727 2.737 -0.018 0.076 1.001 1943 0.7581722 09 33 49 77 41 34 8.31 G5 0.616 0.342 0.430 – 1919 0.7683920 09 42 47 43 03 15 8.68 A7 0.179 0.221 0.707 2.750 -0.036 0.027 1.785 1917 0.5885216 09 50 53 19 19 25 8.39 A3 0.180 0.218 0.760 2.777 -0.023 0.026 1.865 1923 0.7186167 09 57 27 29 10 19 8.39 A5 0.190 0.225 0.682 2.754 -0.039 -0.006 2.159 1923 0.65
S. Joshi et al.: The Nainital-Cape Survey. II., Online Material p 5
HD α2000 δ2000 V Spectral b − y m1 c1 β δm1 δc1 ∆p JD ∆tType hr
90011 10 23 27 02 15 13 8.69 F0 0.216 0.252 0.746 2.753 -0.066 0.060 3.330 1923 0.7492764 10 43 25 44 57 01 9.01 A7V 0.116 0.210 0.859 2.816 -0.005 0.047 1.026 1917 0.55
1950 1.291976 1.711977 2.032297 1.34
93075 10 45 59 56 55 14 7.12 A8V 0.173 0.207 0.718 2.786 -0.009 -0.034 1.557 1999 3.962009 1.25
93991 10 52 01 55 21 17 8.09 F0 0.165 0.252 0.826 2.787 -0.054 0.072 2.958 1919 0.9694779 10 57 17 46 55 09 8.68 Am 0.083 0.213 0.991 2.823 -0.007 0.166 0.542 1923 0.7698710 11 21 51 34 51 37 8.74 Am 0.147 0.203 0.815 2.796 -0.001 0.043 1.007 1923 0.6498880 11 22 52 44 49 28 8.04 A5 0.233 0.233 0.644 2.719 -0.056 0.048 2.677 1917 0.64
1948 2.0199831 11 29 22 42 05 31 8.90 Am 0.186 0.220 0.720 2.750 -0.035 0.040 1.797 1919 0.59
100215 11 32 13 38 55 34 7.99 Am 0.205 0.175 0.679 2.733 0.005 0.040 0.207 1923 0.60100654 11 35 12 35 24 20 8.68 F5 0.217 0.248 0.676 2.739 -0.066 0.019 3.193 1943 0.80101953 11 44 07 29 34 48 8.04 Am 0.169 0.185 0.732 2.754 0.001 0.044 0.289 1943 0.72102102 11 45 16 43 12 37 8.09 F0 0.174 0.236 0.765 2.794 -0.035 -0.003 2.657 1923 0.60103498 11 55 11 46 28 11 6.99 A1 0.003 0.196 1.010 2.858 0.009 0.124 2.263 1563 0.80
1564 0.381659 0.85
104202 12 00 09 70 39 06 8.44 A 0.144 0.236 0.769 – – – – 2280 0.962282 1.372295 1.27
104817 12 04 13 01 27 44 7.69 Am 0.115 0.205 0.873 2.843 0.003 0.017 1.002 1923 0.77104957 12 05 06 30 49 59 8.87 Am 0.170 0.178 0.746 2.760 0.010 0.046 0.068 1917 0.65105680 12 09 59 22 38 23 8.06 Am 0.188 0.220 0.714 2.763 -0.031 0.008 1.976 1943 0.77107513 12 21 26 24 59 49 7.38 Am 0.172 0.176 0.738 2.753 0.010 0.052 4.276 1948 3.31
1950 2.362297 1.062305 0.92
109306 12 33 36 28 04 53 8.60 F3V 0.238 0.223 0.683 2.717 -0.047 0.095 2.249 1923 0.612283 0.72
109782 12 37 11 21 11 54 7.71 F3V 0.243 0.228 0.683 2.724 -0.050 0.071 2.559 1983 1.64115606 13 18 02 13 00 00 8.57 A2 0.165 0.296 0.631 2.846 -0.089 -0.231 5.581 1566 1.19
1567 2.28115708 13 18 37 26 21 56 7.83 A2p 0.164 0.192 0.747 2.788 0.007 -0.009 0.843 1977 3.05115722 13 18 25 35 57 14 9.55 Am 0.208 0.199 0.665 2.756 -0.012 -0.027 1.430 2034 1.09116635 13 24 26 30 33 14 9.63 F2 0.092 0.199 0.934 2.890 -0.019 -0.019 0.487 2034 0.99117044 13 27 30 13 54 49 8.19 F0 0.209 0.211 0.674 2.749 -0.026 -0.004 1.803 1950 1.74119563 13 43 39 21 05 44 8.81 A5 0.215 0.217 0.763 2.737 -0.036 0.112 1.778 1943 0.89124883 14 15 26 27 44 02 7.30 A2 – – – – – – – 1619 1.28
1622 0.971627 3.14
134305 15 08 44 12 29 19 7.24 A7p – – – – – – – 1660 1.172043 1.62
135297 15 14 21 00 22 10 7.94 A0p -0.010 0.182 0.969 2.855 -0.055 0.102 2.365 1619 0.971620 1.041650 1.32
139319 15 33 48 63 54 00 7.43 A5 0.193 0.186 0.836 2.770 0.006 0.116 0.547 2035 0.99139478 15 36 00 52 04 11 6.70 F4 0.207 0.169 0.666 2.739 0.013 0.009 0.090 2034 0.97144999 16 07 38 28 59 43 7.70 A3 – – – – – – – 1620 1.00
1622 0.971623 0.791650 1.691659 2.04
151070 16 44 10 23 31 01 7.03 F5 0.351 0.203 0.697 2.688 -0.032 0.208 2.522 2035 1.01153897 17 01 09 27 11 50 6.57 F5 0.274 0.154 0.457 2.6762 0.016 0.002 0.261 2036 0.94

S. Joshi et al.: The Nainital-Cape Survey. II., Online Material p 6
HD α2000 δ2000 V Spectral b − y m1 c1 β δm1 δc1 ∆p JD ∆tType hr
162705 17 51 47 15 00 24 7.53 F0 0.218 0.219 0.766 2.765 -0.029 0.056 2.184 2034 0.97166894 18 10 54 38 57 40 7.80 A2 0.066 0.187 1.090 2.879 0.013 0.162 0.681 2036 1.17168605 18 19 50 19 10 17 8.19 A0p 0.037 0.101 1.089 2.828 0.106 0.257 – 1659 1.66
1660 1.01177332 19 04 10 03 19 50 6.72 A5 0.071 0.204 1.088 2.857 0.001 0.204 0.070 2034 0.92191742 20 09 47 42 32 28 8.16 A7 0.114 0.232 0.960 2.884 -0.040 0.021 1.946 1825 1.51
1826 1.31192224 20 12 08 41 21 01 8.86 Ap – – – – – – – 1830 1.18200177 21 00 06 48 40 46 7.34 B9p -0.017 0.200 0.845 2.873 -0.069 -0.063 3.075 1829 1.00
2209 1.00203819 21 22 43 54 13 50 7.87 A0p 0.013 0.153 1.086 2.890 0.027 0.133 – 2190 1.64203922 21 24 12 35 01 35 8.52 A2 – – – – – – – 1824 1.54204038 21 25 00 33 41 16 8.38 F1V 0.291 0.158 0.668 2.691 0.013 0.170 0.211 1831 0.99206977 21 44 54 36 11 26 9.01 A5 0.109 0.191 1.016 2.886 -0.003 0.072 0.202 1829 1.38
1830 0.57207564 21 49 42 10 42 41 9.50 F8 – – – – – – – 2215 3.33208525 21 55 24 51 00 13 9.06 A2 – – – – – – – 1826 1.43210433 22 08 35 59 17 22 7.15 A0 – – – 2.846 – – – 1827 1.55221072 23 28 18 63 23 27 8.32 F5 0.302 0.211 0.698 2.702 -0.039 0.162 2.360 1830 1.02223247 23 47 46 28 24 26 8.13 F0 0.182 0.217 0.773 2.772 -0.024 0.049 1.765 1832 1.01
1833 1.18228112 20 10 29 41 09 28 9.03 Ap – – – – – – – 1827 1.29

S. Joshi et al.: The Nainital-Cape Survey. II., Online Material p 7
Fig. 9.

S. Joshi et al.: The Nainital-Cape Survey. II., Online Material p 8
Fig. 9.

S. Joshi et al.: The Nainital-Cape Survey. II., Online Material p 9
Fig. 9.
S. Joshi et al.: The Nainital-Cape Survey. II., Online Material p 10
Fig. 9.

S. Joshi et al.: The Nainital-Cape Survey. II., Online Material p 11
Fig. 9.

S. Joshi et al.: The Nainital-Cape Survey. II., Online Material p 12
Fig. 9.
S. Joshi et al.: The Nainital-Cape Survey. II., Online Material p 13
Fig. 9.

S. Joshi et al.: The Nainital-Cape Survey. II., Online Material p 14
Fig. 9.

S. Joshi et al.: The Nainital-Cape Survey. II., Online Material p 15
Fig. 9.

S. Joshi et al.: The Nainital-Cape Survey. II., Online Material p 16
Fig. 9.

S. Joshi et al.: The Nainital-Cape Survey. II., Online Material p 17
Fig. 9.

S. Joshi et al.: The Nainital-Cape Survey. II., Online Material p 18
Fig. 9.

S. Joshi et al.: The Nainital-Cape Survey. II., Online Material p 19
Fig. 9.

S. Joshi et al.: The Nainital-Cape Survey. II., Online Material p 20
Fig. 9.

S. Joshi et al.: The Nainital-Cape Survey. II., Online Material p 21
Fig. 9.

S. Joshi et al.: The Nainital-Cape Survey. II., Online Material p 22
Fig. 9.
S. Joshi et al.: The Nainital-Cape Survey. II., Online Material p 23
Fig. 10.
S. Joshi et al.: The Nainital-Cape Survey. II., Online Material p 24
Fig. 10.

S. Joshi et al.: The Nainital-Cape Survey. II., Online Material p 25
Fig. 10.

S. Joshi et al.: The Nainital-Cape Survey. II., Online Material p 26
Fig. 10.

S. Joshi et al.: The Nainital-Cape Survey. II., Online Material p 27
Fig. 10.
S. Joshi et al.: The Nainital-Cape Survey. II., Online Material p 28
Fig. 10.

S. Joshi et al.: The Nainital-Cape Survey. II., Online Material p 29
Fig. 10.
S. Joshi et al.: The Nainital-Cape Survey. II., Online Material p 30
Fig. 10.
S. Joshi et al.: The Nainital-Cape Survey. II., Online Material p 31
Fig. 10.

S. Joshi et al.: The Nainital-Cape Survey. II., Online Material p 32
Fig. 10.

S. Joshi et al.: The Nainital-Cape Survey. II., Online Material p 33
Fig. 10.
S. Joshi et al.: The Nainital-Cape Survey. II., Online Material p 34
Fig. 10.

S. Joshi et al.: The Nainital-Cape Survey. II., Online Material p 35
Fig. 10.
S. Joshi et al.: The Nainital-Cape Survey. II., Online Material p 36
Fig. 10.

S. Joshi et al.: The Nainital-Cape Survey. II., Online Material p 37
Fig. 10.

S. Joshi et al.: The Nainital-Cape Survey. II., Online Material p 38
Fig. 10.