astronomy 6 lab manual - sacramento · pdf fileactivity from the previous csus astronomy 6 lab...
TRANSCRIPT
Astronomy 6 Lab Manual
Spring 2007
Jason Ybarra
California State University, Sacramento

2

1 Using the Starmaps
Activity from the previous CSUS Astronomy 6 lab manual
1. Determine the R.A. of the side borders of the SC001 chart
2. Determine the declination of the upper and lower borders of the SC001 chart
3. Determine where 0 hrs. R.A. is on the SC001 chart
4. Determine the declination of the outer circle of the SC002 chart
5. Determine the declination of the center of the SC002
6. Determine which way the R.A. values increase on the SC002 chart, CW or CCW
7. Using the Star Charts SC001 and SC002 find the stars listed below and theircoordinates.
Star Right Ascension (R.A.) Declination (δ)Aldebaran
Caph
Betelgeuse
19h 45m +8.5◦
Sirius
Regulus
Deneb
6h 20m +30◦
3

2 Introduction to the Planisphere (starwheel)
Based on previous CSUS Astronomy 6 lab manual
2.1 Objective
The planisphere is a tool used to locate objects in the sky. We will use the planisphereto find which objects will be in the sky during our observing sessions
2.2 Introduction
The planisphere is a polar projection of the sky that pivots on the polar axis. Thisallows us see what objects are in the night sky by turning the planisphere to set thetime and date of our observation. The wheel has dates printed that can aligned tostandard times. By matching the time of our observation with the date, the portionof the sky that is visible will be shown on the planisphere.
During daylight savings time subtract one hour
2.3 Procedure
1. Set the wheel for today’s date and the time of observation. Make sure to accountfor Daylight Savings Time if needed.
2. Record one prominent constellation in each of the cardinal directions. Recordany first or zero magnitude stars in these constellations
Constellation Name 0-1 Magnitude Stars
North
East
South
West
3. Locate the asterism the “Summer Triangle”. Name the first magnitude stars inthe asterism and the constellations they belong to
4
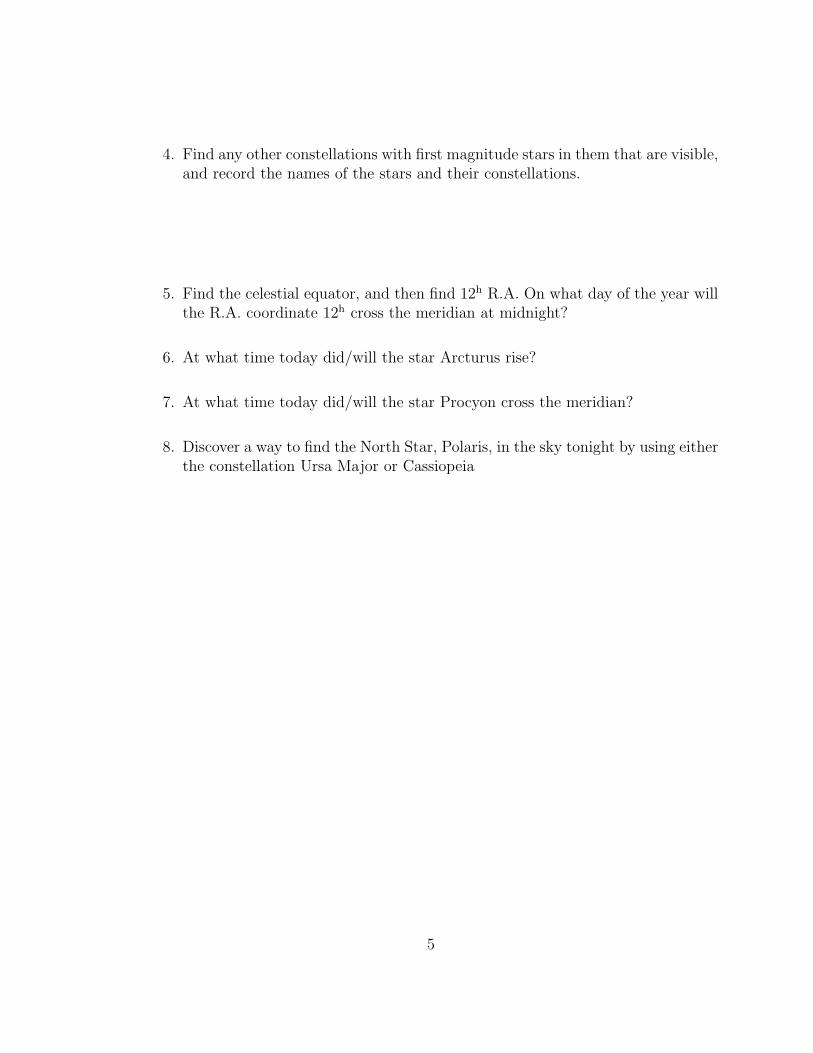
4. Find any other constellations with first magnitude stars in them that are visible,and record the names of the stars and their constellations.
5. Find the celestial equator, and then find 12h R.A. On what day of the year willthe R.A. coordinate 12h cross the meridian at midnight?
6. At what time today did/will the star Arcturus rise?
7. At what time today did/will the star Procyon cross the meridian?
8. Discover a way to find the North Star, Polaris, in the sky tonight by using eitherthe constellation Ursa Major or Cassiopeia
5
3 Introduction to the telescope
Based on the previous CSUS Astronomy 6 lab manualThe telescopes used in this lab are 8” Schmidt-Cassegrain telescopes. Record your
observations on the observation sheets.
3.1 Telescope Setup
1. ‘Polar Align’ the telescope by pointing the forks of the telescope at Polaris (theNorth Star).
2. Plug in the clock drive of the telescope and turn it on.
3.2 Eyepieces
1. Open the eyepiece case and identify all of the eyepieces.
2. Put in the 40 mm eyepiece.
3. Use the TELRAD to find your target. If the TELRAD is aligned properly yourtarget should be visible in the 40 mm eyepiece. When moving the telescope becareful unlock it first.
4. Use the fine adjustment knob to get the target into the center of the field ofview.
5. Record your observations of the target. Include the numbers of other objectsin the field of view
6. Change to the 26 mm eyepiece and observe the difference from the 40 mmeyepiece. You might have to refocus the telescope.
7. View the target with the 17 mm, 12.5 mm, and 7.5 mm. Record your observa-tions.
8. If the target is a double star, use the 12.5 mm reticle eyepiece with its illuminatorand measure the separation.
9. Repeat 2-8 for another target
6

4 Spectrum Analysis
Based on the previous CSUS Astronomy 6 lab manual
4.1 Part A
Using the diffraction grating
1. Is the spectrum of an incandescent light bulb continuous, emission line, orabsorption line?
2. When the bulb is dim what colors do you see? What colors are faint? Whatcolors are bright?
3. When the bulb is brightest what colors do you see? What difference in colorsis there when the bulb is dim and when it is bright?
According to Wein’s Law the wavelength of maximum intensity is shorter whenthe temperature of the object is hotter. The equation is
λmax =2.9× 10⁷
T
where λmax is in Angstroms (10−10 meters) and T is in Kelvins.
4. Why is Wein’s Law important in astronomy?
4.2 Part B
Using the Spectroscope
1. Observe the gas discharge tubes. Sketch the positions of the most visible emis-sion spectra on the scales for stations 1-6
7

2. Compare the emissions of stations 16 with those of the spectra on the chartprovided. Try to identify the elements in the gas discharge tubes
Station Element1
2
3
4
5
6
3. What properties of a star can be deduced from its spectrum?
8
5 Parallax Lab
Jason Ybarra
5.1 Introduction
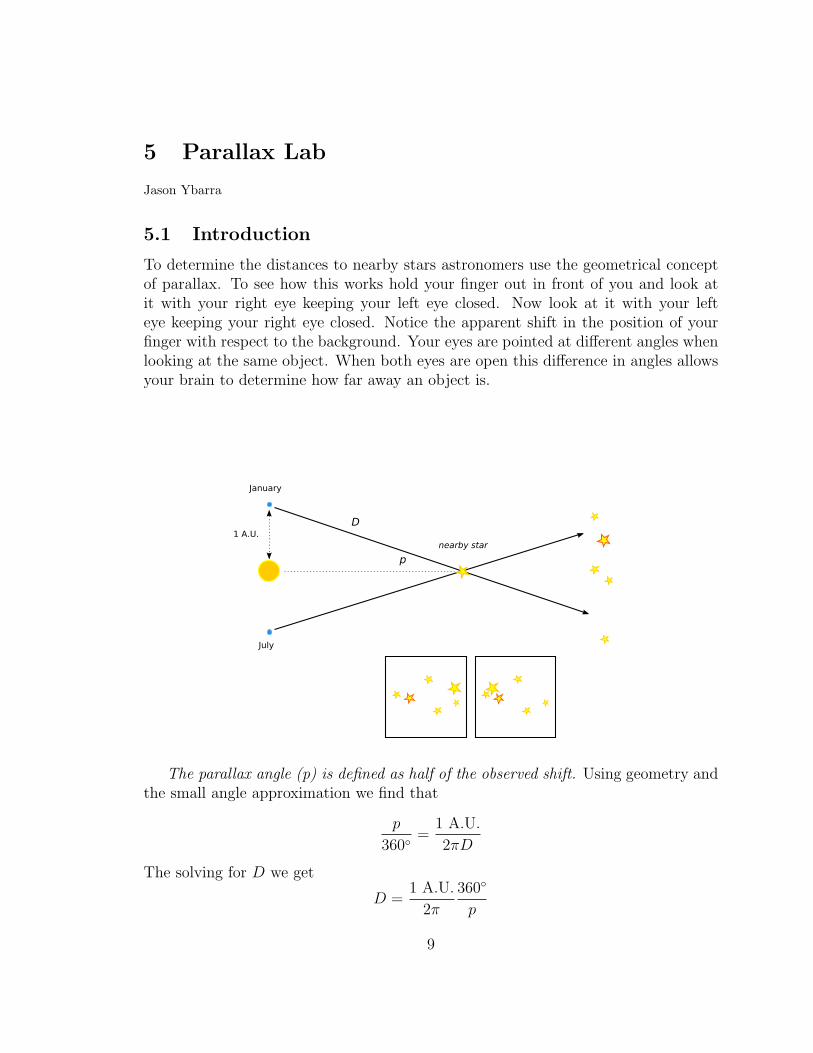
To determine the distances to nearby stars astronomers use the geometrical conceptof parallax. To see how this works hold your finger out in front of you and look atit with your right eye keeping your left eye closed. Now look at it with your lefteye keeping your right eye closed. Notice the apparent shift in the position of yourfinger with respect to the background. Your eyes are pointed at different angles whenlooking at the same object. When both eyes are open this difference in angles allowsyour brain to determine how far away an object is.
The parallax angle (p) is defined as half of the observed shift. Using geometry andthe small angle approximation we find that
p
360◦=
1 A.U.
2πD
The solving for D we get
D =1 A.U.
2π
360◦
p
9

A unit of length that astronomers often use is a parsec. A parsec is defined as thedistance to an object with a parallax angle of 1 arcsecond (1′′), or 1/3,600 degree.Using these units our parallax formula becomes
D (in parsecs) =1
p (in arcseconds)
5.2 Procedure
For todays lab we will look at two (synthetic) images of the same part of the sky taken6 months apart. The plate scale of the images is such that 1 mm = 0.1 arcseconds.
a) Find the stars in the second image that have shifts in position from the firstimage.
b) Measure the shifts with a ruler and record them in your notebook. Then cal-culate the distances of the stars.
c) In photographic and CCD images when a star is brighter it appears larger onthe image. This is an optical effect as the stars are so far away they are points oflight. If all stars had the same luminosity you would expect that far away stars aredimmer than closer stars. Does this agree with your lab results? Write a paragraphabout your conclusions.
Star Shift (mm) Shift (arc sec) Parallax (arc sec) Distance (pc)
10
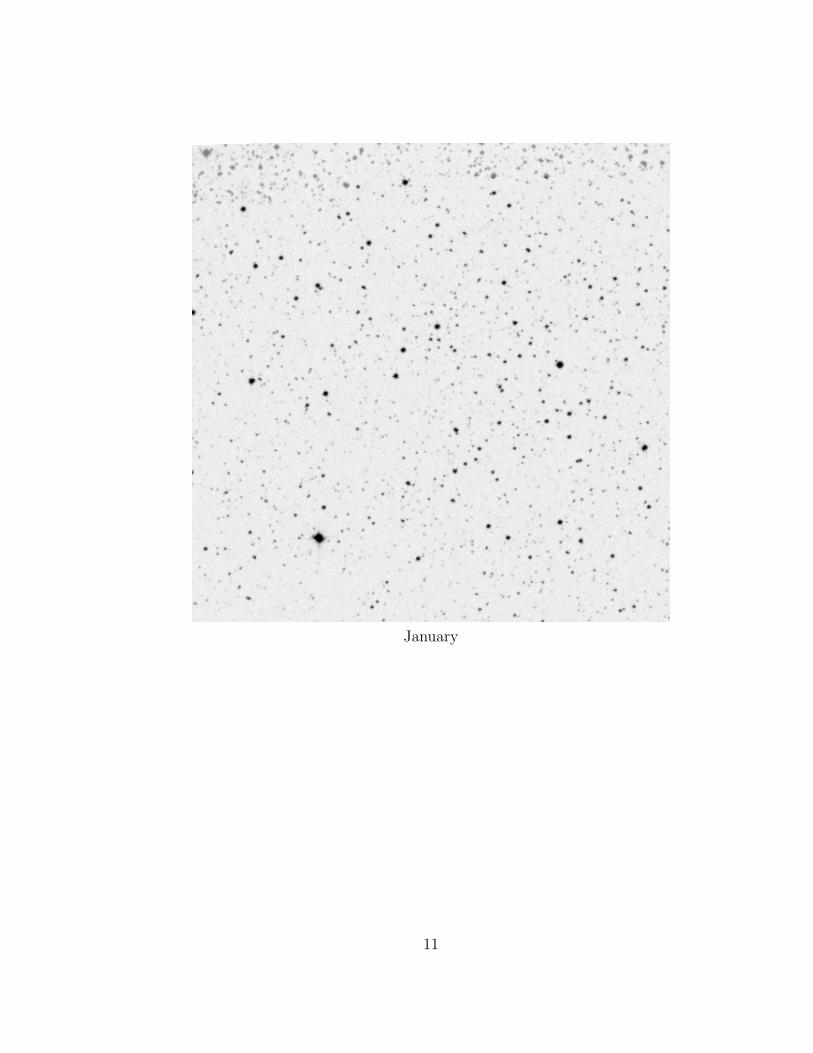
January
11

12

July
13

14
6 Planetary Nebula
6.1 Introduction
At the end of a stars nuclear-burning phase it ejects its outer layers. This expandingshell of gas is ionized by the UV radiation from the core and glows brightly. Theexposed core of the star is very hot and bright and is known as a white dwarf.
The figure on the following page is a Hubble Space Telescope image of the ringnebula. The ring nebula is a cylinder of glowing material that surrounds its centralstar. The material was ejected from the star at the end of it nuclear-burning phase.The image is taken through a filter centered at 5007 Angstroms or 500.7 nm, whichis also the wavelength of an oxygen emission line [O III].
6.2 Procedure
a) From the figure determine the plate scale of the image with your ruler.
plate scale =30′′
length of line in mm
b) Determine the angular radius of nebula. Measure from the central star to theedge of brightest emission. Records your answer in mm and arcseconds.
c) The ring nebula is 0.7 kpc (700 pc) away. Using the small angle formuladetermine the radius in parsecs.
radius (pc) = D × angular radius (arcsec)× (5× 10⁻⁶)
radius = pc
d) Find its radius in km and A.U. (3× 10¹³ km = 1 pc ; 1.5× 10⁸ km = 1 A.U.)
radius = km = A.U.
15
e) The nebula has a rate of expansion of 25 km/s. Estimate the age of the nebulain years (neglecting acceleration).
16

Figure 1: [O III] image of the Ring Nebula
17

18

7 Measuring the Motion of a Coronal Mass Ejec-
tion
based on a SOHO Education and Outreach team activity
7.1 Purpose
Calculate the velocity and acceleration of a coronal mass ejection (CME) event usinga series of images from the LASCO instrument on the SOHO satellite.
7.2 Instructions
1. Look at the series of images taken by a LASCO coronagraph. On the right isa CME erupting. In each of the images a dark “loop”- or “hook”-like featureis visible. Measure the distance from the center of the Sun to the edge of thatfeature with a ruler (in mm). Record your data in the column “r (image)”.
2. The tick marks along the bottom of the images are separated by a distance thatrepresents one solar diameter. Measure the separation with a ruler in mm.
(image mm) = 1 solar diameter = 1.4× 10⁶ km
image scale = (km/image mm)
3. Average velocity is the distance traveled divided by that time period. We willuse ∆r to denote the distance traveled; which we will get by subtracting a finaldistance from a initial distance. On the table, for each row use the distance onthat row as the final distance and the distance on the previous row as the initialdistance.
∆r[row n] = r[row n] − r[row (n−1)]
Then our velocity will be
vn =∆rn
∆t
4. Acceleration is the change in velocity over time. Thus we need to find ∆vn =vn − v(n−1) and then
an =∆vn
∆t
19

5. How does this velocity compare to everyday speeds?
6. What do you think causes the acceleration/deceleration?
7. Assuming that the last velocity measured stays constant (neglecting accelera-tion) as the ejected mass travels throughout the solar system, how long wouldit take for the ejected mass to reach Earth? ( 1 A.U. = 1.5× 10⁸ km)
Time r(image) r(actual) ∆r ∆t v ∆v a
08:05 . . . . . . . . . . . . . . .
08:36 1860 s . . . . . .
09:27 3060 s
10:25 3480 s
20

7.3 LASCO images
21

22
8 Jupiter’s Moons - Determining the mass of Jupiter
Jason Ybarra
8.1 Background
In 1610 Galileo pointed his telescope at Jupiter. He discovered four moons orbitingthe planet Jupiter. His discovery provided strong support for the Copernican modeland was a blow to the Ptolemaic model. About ten years later Kepler publishedhis third law of planetary motion, which related the orbital period of a planet toits semimajor axis. Later on Newton was able to derive Kepler’s laws from his setfundamental laws of motion and gravity. Newton was able to show that the motionof the planets around the Sun was due to gravity. It is the same force of gravity thatalso keeps Jupiter’s moons in orbit around Jupiter. Thus we can use the modifiedform of Kepler’s third law to determine the mass of Jupiter
P 2 (in yrs) =a3 (in A.U.)
Mtotal (in solar units)
8.2 Reticule Calibration
In order to calibrate the reticle we need to observe a star as it moves across the fieldof view of the reticle eyepiece. For best results we should use a star near the celestialequator. Using a stop watch we need to measure the average time for the star tomove across the eyepiece from 0 to 60 divisions.
t60 = s
The Earth rotates approximately 23 hours and 56 minutes on it axis. Convertingthis time into seconds we get 86,160 seconds to rotates through 360 degrees. Thuswe can set up a ratio:
360◦
86160 s=
θ60
t60
θ60 =
If the star we used was not on the celestial equator we need to do a cosine cor-rection. In order to do the cosine correction we need to know the declination of thestar.
Declination of star =
23

thenθ = θ60 cos(declination)
thusθ = cos( ) =
Each reticle division corresponds to an angular separation of θ60
1 division =
8.3 Distance from Earth to Jupiter
Assuming circular orbits we can estimate the distance between Jupiter and the Earthby noting the time Jupiter sets. On the diagram we can draw a line parallel to thehorizon when Jupiter sets. This line will intersect the circle representing the orbit ofJupiter at the current location of Jupiter. Use a ruler to estimate the distance.
time Jupiter sets = PST (during PDT subtract an hour)
Distance from Earth to Jupiter = A.U.
24

25

Data TablesAngular Separation in degrees
Day 1 Day 2 Day 3 Day 4 Day 5 Day 6IoEuropaGanymedeCallisto
Maximum separation and period
Using the previous data table and your sky calender determine the maximumangular separation and period
θmax Period (days) Period (years)IoEuropaGanymedeCallisto
8.4 Estimating the semimajor axis
After determining the maximum angular separation a moon has from Jupiter we canconvert this angle into a physical distance through the use of geometry.
26
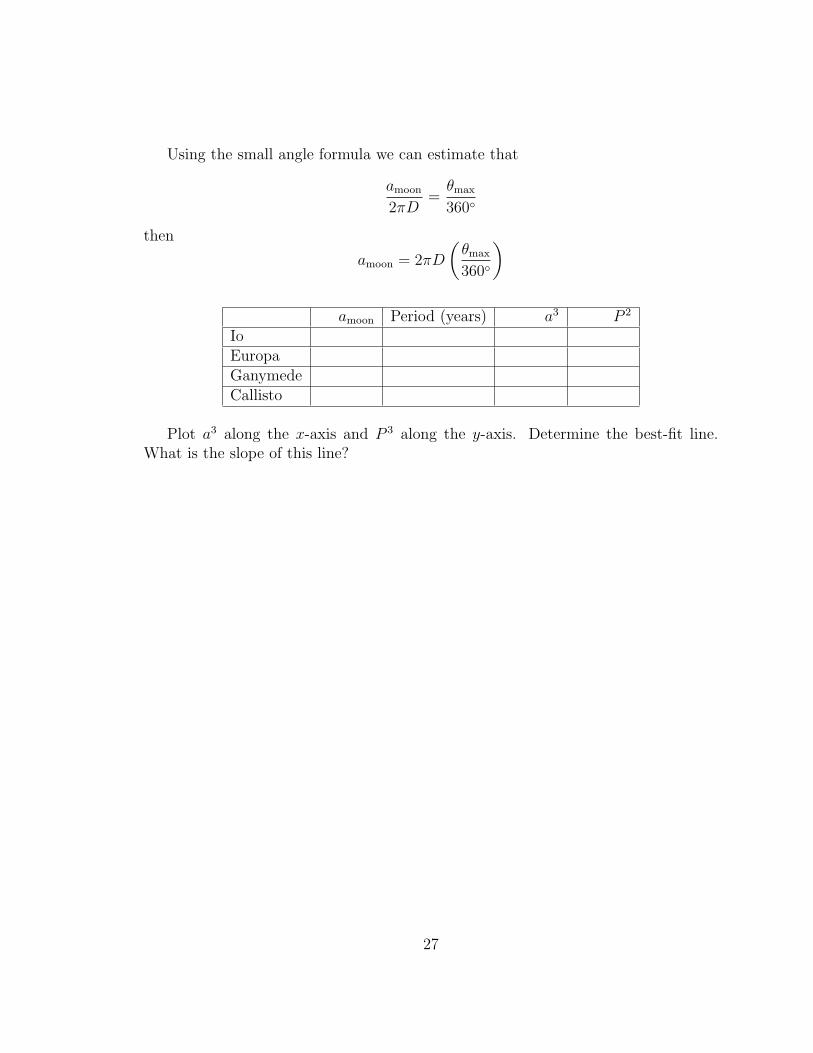
Using the small angle formula we can estimate that
amoon
2πD=
θmax
360◦
then
amoon = 2πD
(θmax
360◦
)
amoon Period (years) a3 P 2
IoEuropaGanymedeCallisto
Plot a3 along the x-axis and P 3 along the y-axis. Determine the best-fit line.What is the slope of this line?
27

28

9 Extrasolar Planets
Jason Ybarra; Based on an activity “Discovery of Extrasolar Planets” by Guy Worthey
9.1 Introduction
A star with a planetary companion wobbles; that is both the planet and the star orbitaround the center of mass of the system. If the motion of the wobble if radial (towardor away from earth), the light from the star is slightly Doppler shifted. Light froman object that moves toward us is blue-shifted, and light from an object that movesaway from us is red-shifted. The motion of the star can then be computed from theshifts.
9.2 Procedure
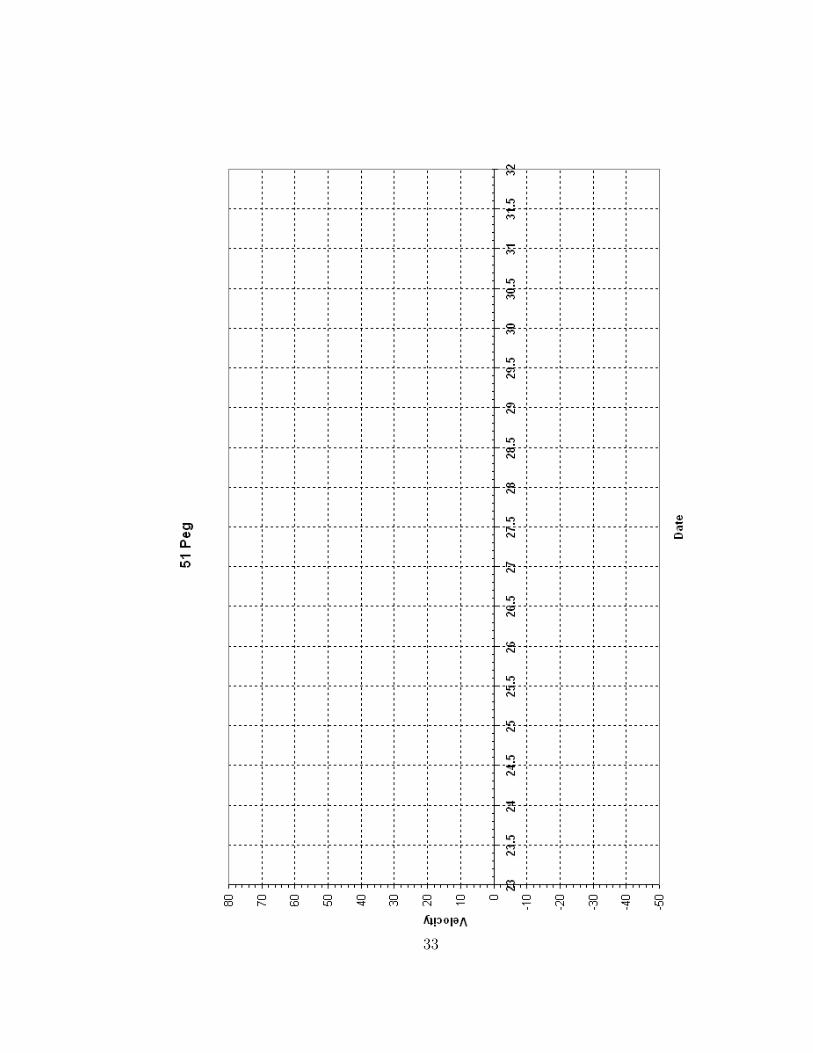
Below is radial velocity data for the star 51 Peg. Graph the Julian Date on the x-axisand the velocity on the y-axis
Date Velocity (m/s) δv (m/s)23.7258 -42.57 7.524.6391 -33.47 2.624.8174 -22.7 3.725.6226 45.34 4.625.7615 56.15 4.726.6176 65.32 6.126.7366 50.86 7.727.6474 -22.66 4.328.6061 -44.12 4.728.7799 -35.32 6.629.6093 25.09 4.329.7468 41.17 4.330.6004 61.33 5.630.8334 50.98 5.3
Data from Marcy et al. 1997 ApJ 481,926
1. From the graph estimate the period (P ). It might be helpful to draw in a sinewave that fits the data points.
P = (days)
29
2. The star 51 Peg has about the same mass as the Sun, thus we can use Kepler’s3rd law, P 2 = a3, where P is in years and a is in A.U., to calculate the orbit ofthe planet.
Convert P to years. P = (years)
Compute a from Kepler’s 3rd law.
a = (A.U.)
3. To compute the radial velocity of the planet we need to convert P into seconds,and a into meters.
1A.U. = 1.5× 10¹¹ m 1 day = 8.64× 10⁴ s
and then use the following formula to calculate the radial velocity of the planet.
vplanet =2πa
P
P = s
a = m
vplanet = m/s
4. The mass and velocity of the star and planet are related by
mplanet
mstar
=vstar
vplanet
To find the radial velocity of the star find the maximum velocity from the chartand subtract the minimum velocity and then divide by 2
vstar = 12(vmax − vmin)
Then solve for the mass of the planet (mass of the star ≈ 2× 1030 kg)
mplanet =vstar
vplanet
(2× 1030 kg)
vstar = m/s
mplanet = kg
30
5. The mass of Jupiter is ≈ 1 × 1027 kg, how does this compare to the planetaround 51 peg?
31

32
33

34

Observation Sheet
Target: Date and Time:
Approx. Coordinates Partners:
R.A. Dec
Atmospheric Conditions:
Observations:
Instructor/TA initials
35
Observation Sheet
Target: Date and Time:
Approx. Coordinates Partners:
R.A. Dec
Atmospheric Conditions:
Observations:
Instructor/TA initials
36