astronomy 113 laboratory kepler’s 3 law and …heinzs/astro113/kepler.pdfastronomy 113 laboratory...
TRANSCRIPT
1 12/04/2006
ASTRONOMY 113
Laboratory
Kepler’s 3rd Law and the Mass of Sgr A*
Introduction – Kepler’s laws
The Copernican revolution, which we studied in the Celestial motions lab, solved the question of retrogrademotions and once and for all put the sun at the center of the solar system, rather than the earth. But it left anumber of questions unanswered: Why are the outer planets revolving around the sun at a slower pace thanthe inner ones? Why do some of the planetary and cometary orbits deviate from the circular orbitspredicted by Copernicus?
The Astronomer Tycho Brahe meticulously catalogued the tracks of planets across the sky and publishedhis findings. Armed with this new, high quality set of data, Kepler set out to solve the outstandingmysteries. The end result of his study was the formulation of three laws, which you will have learned aboutin class already:
1) Planets, comets, and asteroids move on elliptical orbits, with the sun in one of the focalpoints of the ellipses
2) Their orbits sweep over sectors of equal area in equal amounts of time.
3) The square of their revolution period, P2, is proportional to the third power of the semi-major axis, A3, (the long axis) of their orbit
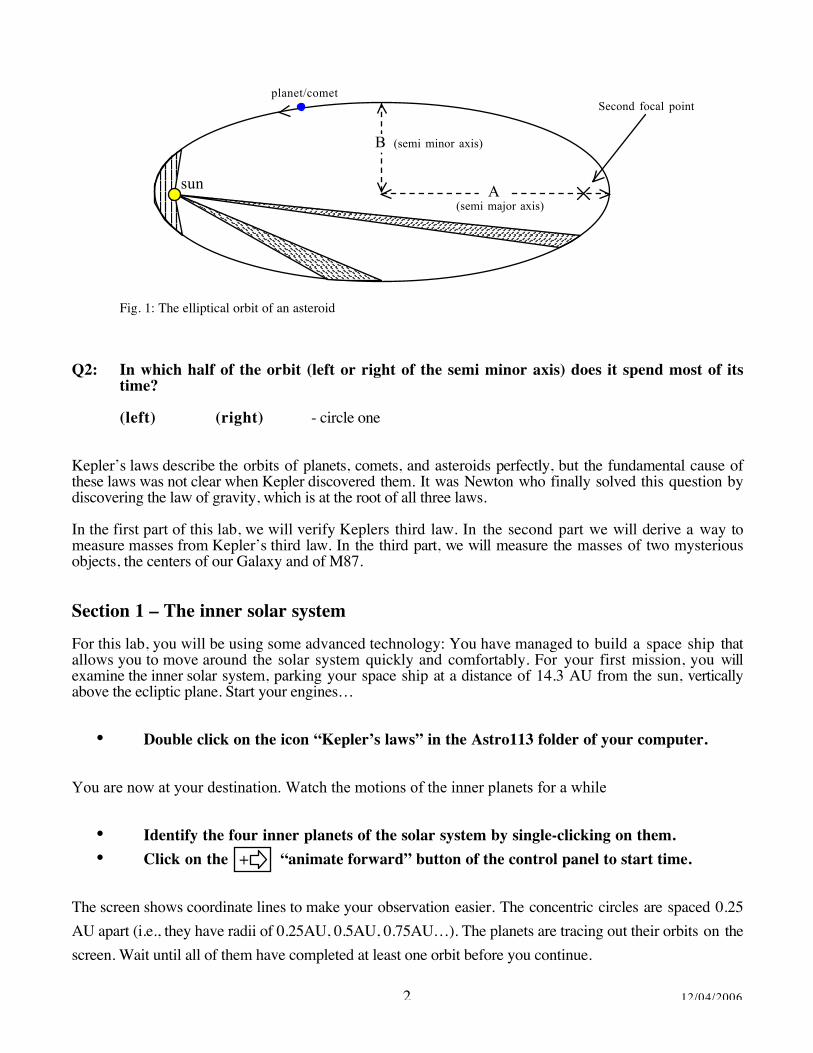
Figure 1 shows an elliptical orbit of an asteroid. The three hatched regions are equal in area, and theasteroid will take the same amount of time to sweep over each one.
Q1: Where in the orbit is the asteroid moving fastest?
2 12/04/2006
Fig. 1: The elliptical orbit of an asteroid
Q2: In which half of the orbit (left or right of the semi minor axis) does it spend most of itstime?
(left) (right) - circle one
Kepler’s laws describe the orbits of planets, comets, and asteroids perfectly, but the fundamental cause ofthese laws was not clear when Kepler discovered them. It was Newton who finally solved this question bydiscovering the law of gravity, which is at the root of all three laws.
In the first part of this lab, we will verify Keplers third law. In the second part we will derive a way tomeasure masses from Kepler’s third law. In the third part, we will measure the masses of two mysteriousobjects, the centers of our Galaxy and of M87.
Section 1 – The inner solar system
For this lab, you will be using some advanced technology: You have managed to build a space ship thatallows you to move around the solar system quickly and comfortably. For your first mission, you willexamine the inner solar system, parking your space ship at a distance of 14.3 AU from the sun, verticallyabove the ecliptic plane. Start your engines…
• Double click on the icon “Kepler’s laws” in the Astro113 folder of your computer.
You are now at your destination. Watch the motions of the inner planets for a while
• Identify the four inner planets of the solar system by single-clicking on them.• Click on the “animate forward” button of the control panel to start time.
The screen shows coordinate lines to make your observation easier. The concentric circles are spaced 0.25AU apart (i.e., they have radii of 0.25AU, 0.5AU, 0.75AU…). The planets are tracing out their orbits on thescreen. Wait until all of them have completed at least one orbit before you continue.
+
A
B
sun(semi major axis)
(semi minor axis)
Second focal pointplanet/comet
3 12/04/2006
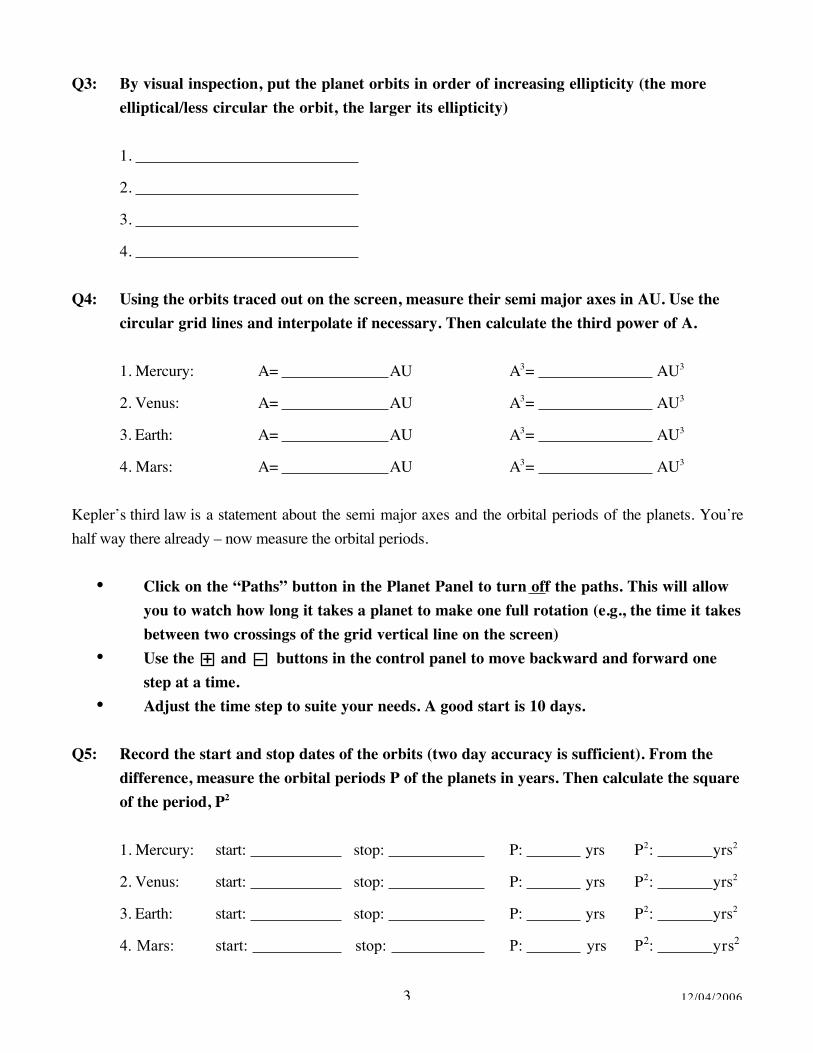
Q3: By visual inspection, put the planet orbits in order of increasing ellipticity (the moreelliptical/less circular the orbit, the larger its ellipticity)
1.
2.
3.
4.
Q4: Using the orbits traced out on the screen, measure their semi major axes in AU. Use thecircular grid lines and interpolate if necessary. Then calculate the third power of A.
1. Mercury: A= AU A3= AU3
2. Venus: A= AU A3= AU3
3. Earth: A= AU A3= AU3
4. Mars: A= AU A3= AU3
Kepler’s third law is a statement about the semi major axes and the orbital periods of the planets. You’rehalf way there already – now measure the orbital periods.
• Click on the “Paths” button in the Planet Panel to turn off the paths. This will allowyou to watch how long it takes a planet to make one full rotation (e.g., the time it takesbetween two crossings of the grid vertical line on the screen)
• Use the + and – buttons in the control panel to move backward and forward onestep at a time.
• Adjust the time step to suite your needs. A good start is 10 days.
Q5: Record the start and stop dates of the orbits (two day accuracy is sufficient). From thedifference, measure the orbital periods P of the planets in years. Then calculate the squareof the period, P2
1. Mercury: start: stop: P: yrs P2: yrs2
2. Venus: start: stop: P: yrs P2: yrs2
3. Earth: start: stop: P: yrs P2: yrs2
4. Mars: start: stop: P: yrs P2: yrs2

4 12/04/2006
Now that you have collected the data on the inner solar system planets, it’s time to plot. Use the graphdirectly below to plot your data points. Then use a ruler to draw a straight line through all the points.
Q6: Does your plot agree with Kepler’s third law?
(yes) (no) - circle one
Section 2 – Using Kepler’s 3rd law as a cosmic scale
You have hopefully confirmed Kepler’s third law: You found that the square of the orbital period isproportional to the third power of the semi major axis
P2∝A3 or, equivalently A3/P2 = M
5 12/04/2006
where M is a constant of proportionality. The question is: what is the physical meaning of M? Finding out
will be your next mission. Fire up the booster rockets – you’re flying back to earth. You will hover at adistance of 0.07AU above earth and observe the moon.
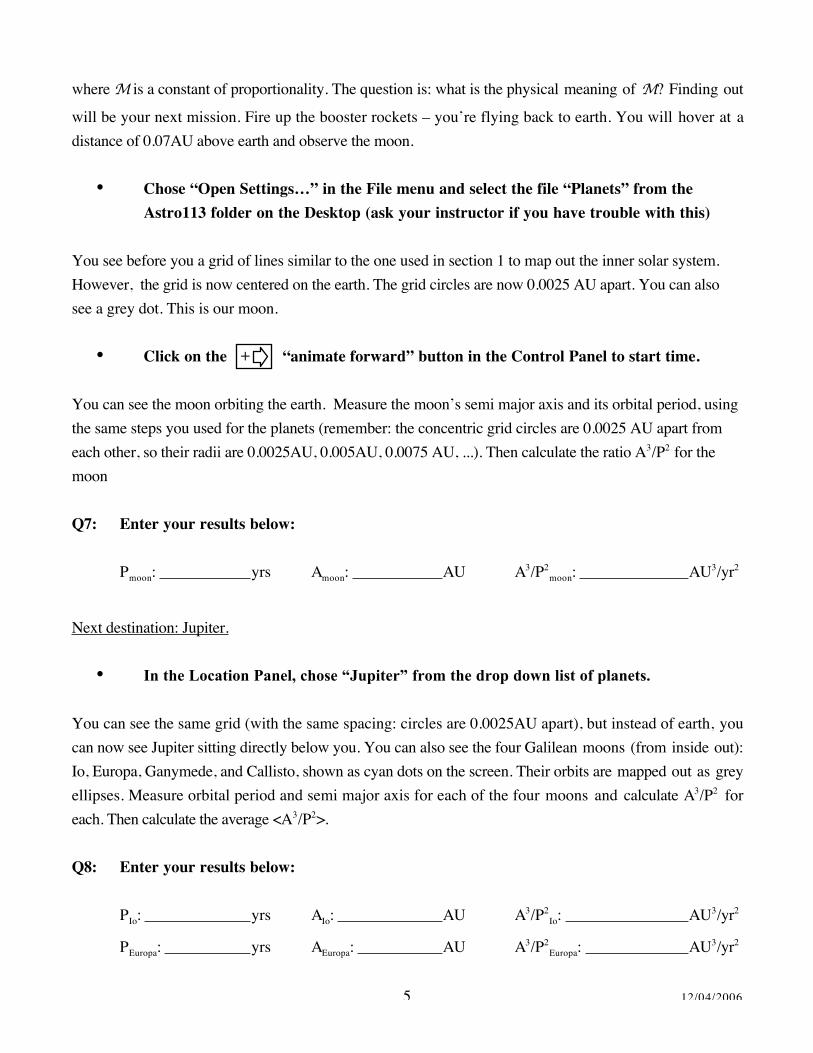
• Chose “Open Settings…” in the File menu and select the file “Planets” from theAstro113 folder on the Desktop (ask your instructor if you have trouble with this)
You see before you a grid of lines similar to the one used in section 1 to map out the inner solar system.However, the grid is now centered on the earth. The grid circles are now 0.0025 AU apart. You can alsosee a grey dot. This is our moon.
• Click on the “animate forward” button in the Control Panel to start time.
You can see the moon orbiting the earth. Measure the moon’s semi major axis and its orbital period, usingthe same steps you used for the planets (remember: the concentric grid circles are 0.0025 AU apart fromeach other, so their radii are 0.0025AU, 0.005AU, 0.0075 AU, ...). Then calculate the ratio A3/P2 for themoon
Q7: Enter your results below:
Pmoon: yrs Amoon: AU A3/P2moon: AU3/yr2
Next destination: Jupiter.
• In the Location Panel, chose “Jupiter” from the drop down list of planets.
You can see the same grid (with the same spacing: circles are 0.0025AU apart), but instead of earth, youcan now see Jupiter sitting directly below you. You can also see the four Galilean moons (from inside out):Io, Europa, Ganymede, and Callisto, shown as cyan dots on the screen. Their orbits are mapped out as greyellipses. Measure orbital period and semi major axis for each of the four moons and calculate A3/P2 foreach. Then calculate the average <A3/P2>.
Q8: Enter your results below:
PIo: yrs AIo: AU A3/P2Io: AU3/yr2
PEuropa: yrs AEuropa: AU A3/P2Europa: AU3/yr2
+
6 12/04/2006
PGan.: yrs AGan.: AU A3/P2Gan.: AU3/yr2
PCall.: yrs ACall.: AU A3/P2Call.: AU3/yr
<A3/P2>: AU3/yr2
Last stop: Saturn.
• In the Location Panel, chose “Saturn” from the drop down list of planets.
Once again, your display shows the same grid (with the same spacing: circles are 0.0025AU apart), withSaturn at the center. Saturn has a lot of moons (35 have been named so far), but we will concentrate on themajor ones only.
Q9: Once again, measure semi major axis and period for the three innermost moons of Saturnand enter the results and the average value of A3/P2 below.
PRhea: yrs ARhea: AU A3/P2Rhea: AU3/yr2
PTitan: yrs ATitan: AU A3/P2Titan: AU3/yr2
PHyperion: yrs AHyperion: AU A3/P2Hyperion: AU3/yr2
<A3/P2>: AU3/yr2
Q10: From your answer to Q5, what is <A3/P2> for the orbits of the four inner planets aroundthe sun? Write your answer below.
A3/P2Mercury: AU3/yr2 A3/P2
Venus: AU3/yr2
A3/P2Earth: AU3/yr2 A3/P2
Mars: AU3/yr2
<A3/P2>: AU3/yr2
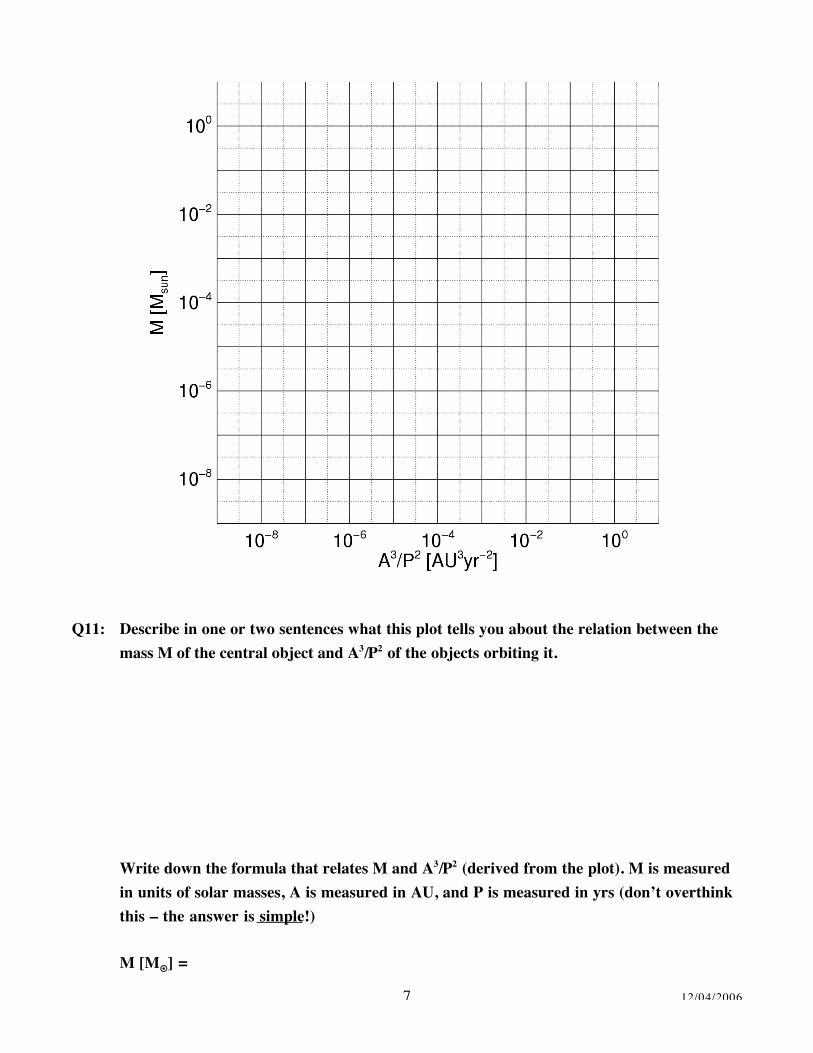
Time to find out what the meaning of the constant of proportionality M is. Plot the four values of <A3/P2>
from Q7-Q10 against the masses of the central object around which you measured their rotation. Here arethe masses you need to know:
Sun: 2x10³ 0 kg = 1 M Earth: 6x10² 4 kg = 3x10⁻⁶ M
Jupiter: 1.9x10² 7 kg = 9.5x10⁻⁴ M Saturn: 5.7x10² 6 kg = 2.8x10⁻⁴ M
Draw a straight line through the points in your plot – this is the relation between A3/P2 and M
7 12/04/2006
Q11: Describe in one or two sentences what this plot tells you about the relation between themass M of the central object and A3/P2 of the objects orbiting it.
Write down the formula that relates M and A3/P2 (derived from the plot). M is measuredin units of solar masses, A is measured in AU, and P is measured in yrs (don’t overthinkthis – the answer is simple!)
M [M] =
8 12/04/2006
Section 3 – Weighing the centers of galaxies
Kepler’s laws have proven to be invaluable tools for astronomers: It is often possible to measure orbitalperiods and semi major axes for an object orbiting another. As you found out in section 2, this allows youto measure the masses of celestial objects. For your last mission, you will travel far into space, visiting thecenters of two galaxies to do just that.
First stop: The center of the Milky Way.
Such along trip requires a different space ship.
• Quit out of Voyager (from the file menu, chose “Quit”).• Double click on the file “Sgr A*” in the Astro113 folder. This will open Quicktime.• Select the “Loop” option from the “View” menu to make the movie repeat
automatically
The movie you see on the screen shows the central region of our galaxy – the inner 50 light-days, or 10,000AU. It was recorded by the VLT (=Very Large Telescope; Genzel et al. 2002, Nature, 419, 694) over aninterval of 9 years (then the observers used their knowledge of Kepler’s laws to extend the movie into thefuture).
The Galactic center region is extremely crowded with stars (the ones you see on the screen are only the fewabsolute brightest ones), but they are only visible in the infra-red band.
Q12: What might block the visible and UV light from the stars in the Galactic center fromreaching us? Think about the open clusters from the “Structure of the Universe” lab.
The actual center of our galaxy is shown as a fuzzy white circle in the center, but this is just for illustrativepurposes: The center of our Galaxy is remarkably dim – nothing to write home about, you might think. Thecenter of our galaxy is called Sagitarius A* (or Sgr A*, for short). Every once in a while, Sgr A* burps,letting out a small flare of radio, infrared, and X-ray emission, but there is really no radiative indication ofany kind that there might be a monster sleeping in the center of our Galaxy. But beware, looks might bedeceiving...
9 12/04/2006
The white dots moving around on the screen are individual stars in the very center of our Galaxy. Do younotice a pattern in their motion?
Q13: Briefly describe the motion of the three stars S2, S14, and S17. Which point are theyorbiting around?
Q14: Measure the orbital periods of S2, S14, and S17, using the time code given in top-rightcorner of each frame as a clock. You can use the left and right arrow keys on the keyboardor the and buttons in the Quicktime window to advance a single frame at a time.Calculate P2 for each star.
PS2= yrs P2S2= yrs2
PS14= yrs P2S2= yrs2
PS17= yrs P2S2= yrs2
You probably already guessed it: The next step is to determine the semi-major axis of each star. Use thegrid shown on the screen. The fine grid lines on the screen are 200 AU apart from each other, the thickones are 1000 AU apart.
Q15: Measure the semi major axes of S2, S14, and S17. Then calculate A3 for each. Finally,calculate the mass of the central object the stars are orbiting around.
AS2= AU A3S2= AU3 MS2= M
AS14= AU A3 S14= AU3 MS14= M
AS17= AU A3 S17= AU3 MS17= M
10 12/04/2006
Q16: Review your answers to the prelab and remind yourself that the measured mass is a lower
limit on the true mass. Pick the measurement from Q15 that is closest to the true mass of
Sgr A* (which will still be a lower limit) and enter it below:
MSgrA*> M
Q17: Speculate on what Sgr A*, the dark, massive object in the very center of our Galaxy,might be.
Final frontier: M87
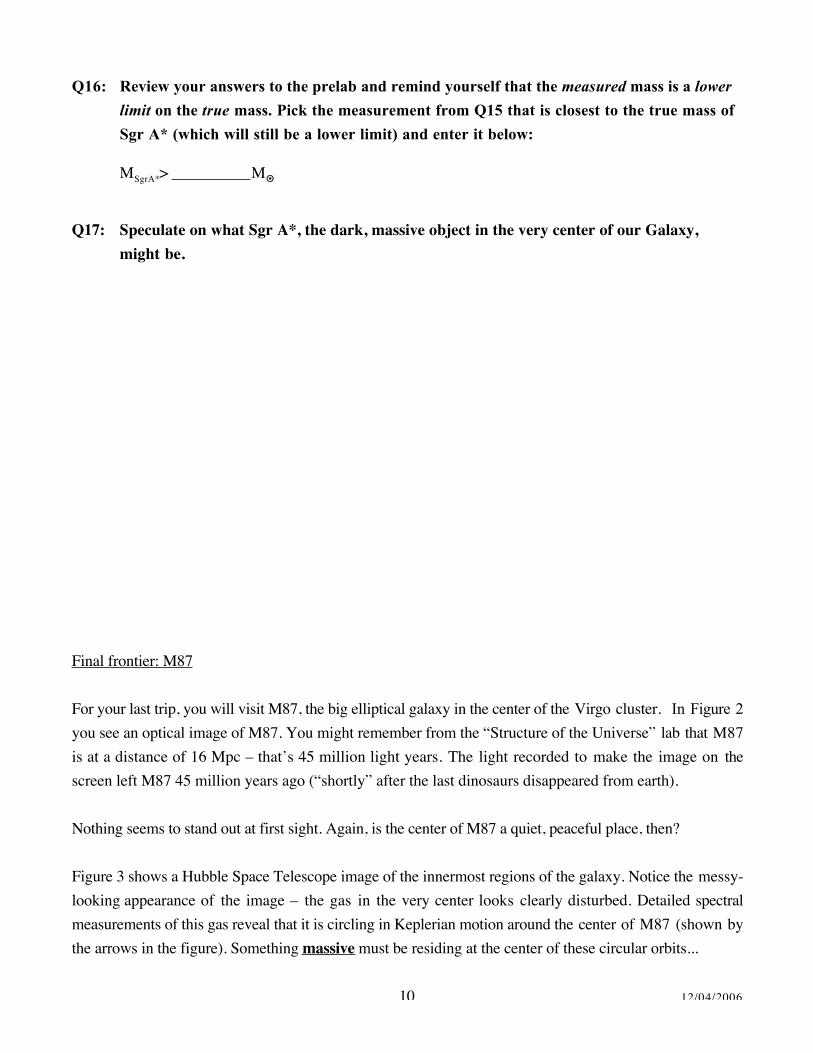
For your last trip, you will visit M87, the big elliptical galaxy in the center of the Virgo cluster. In Figure 2
you see an optical image of M87. You might remember from the “Structure of the Universe” lab that M87is at a distance of 16 Mpc – that’s 45 million light years. The light recorded to make the image on thescreen left M87 45 million years ago (“shortly” after the last dinosaurs disappeared from earth).
Nothing seems to stand out at first sight. Again, is the center of M87 a quiet, peaceful place, then?
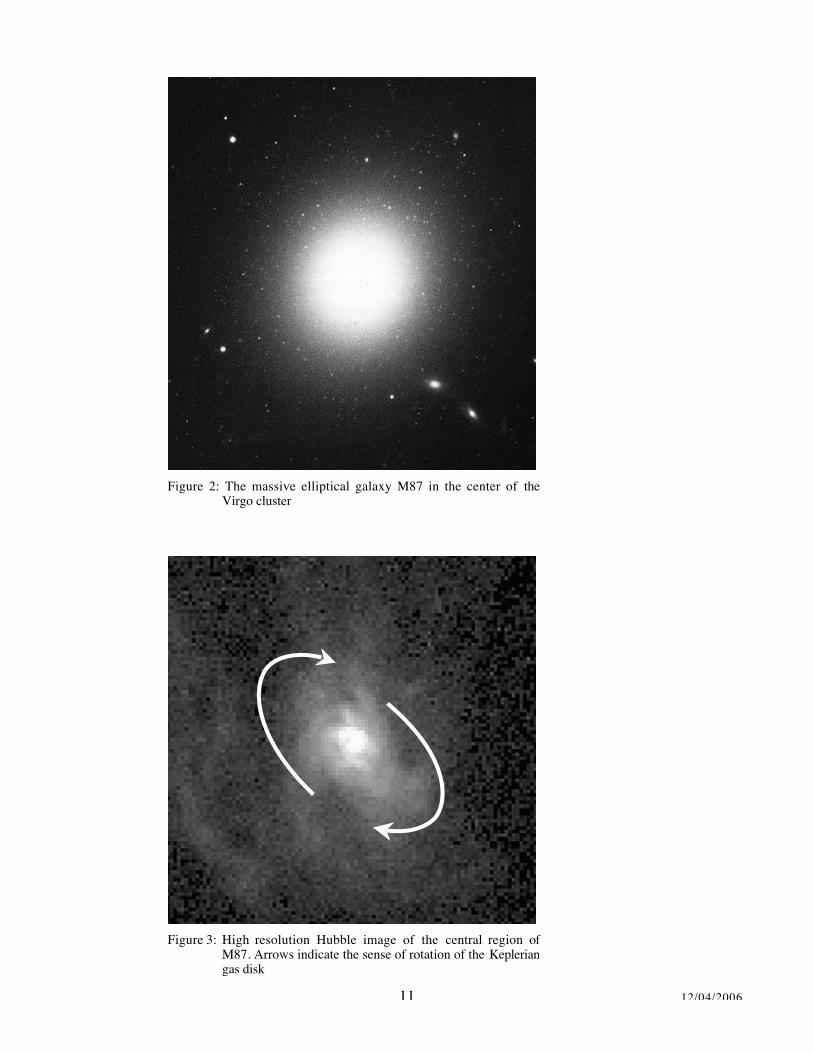
Figure 3 shows a Hubble Space Telescope image of the innermost regions of the galaxy. Notice the messy-looking appearance of the image – the gas in the very center looks clearly disturbed. Detailed spectralmeasurements of this gas reveal that it is circling in Keplerian motion around the center of M87 (shown bythe arrows in the figure). Something massive must be residing at the center of these circular orbits...
11 12/04/2006
Figure 2: The massive elliptical galaxy M87 in the center of theVirgo cluster
Figure 3: High resolution Hubble image of the central region ofM87. Arrows indicate the sense of rotation of the Kepleriangas disk
12 12/04/2006
Q18: Figure out just how massive this object really is. Take the following steps:
(1) The circular orbits have a radius (=semi major axis) of A = 9x101 4 km = 6x10⁶ AU.What is the circumference C of the orbit in km?
C= km
(2) The magnitude of the Doppler shift is z=0.0023. Using the Doppler formula z=vo/c,what is the orbital velocity vo, in km/s, of the gas? Remember: the speed of light isc=3x10⁵ km/s
vo= km/s
(3) What is the orbital period P in yrs? (i.e., how long does it take the gas to travel onefull circumference of the orbit?)
P= yrs
(4) From (1) and (3), what is the mass of the object in the center of M87?
M= M
Q19: Compare this to the mass of Sgr A*. Speculate on what this object might be...
Conclusion:
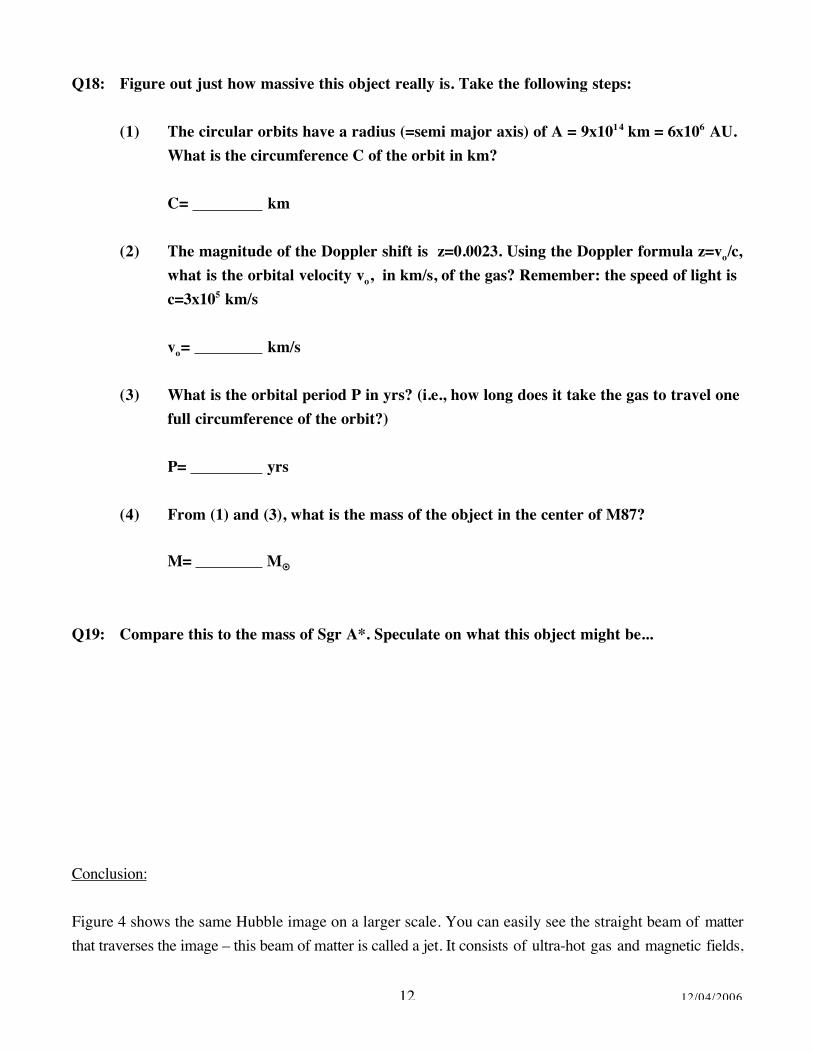
Figure 4 shows the same Hubble image on a larger scale. You can easily see the straight beam of matterthat traverses the image – this beam of matter is called a jet. It consists of ultra-hot gas and magnetic fields,
13 12/04/2006
and it travels at 99% of the speed of light. This jet is more powerful than all the stars in the Milky Waycombined – 30 billion times more powerful than our sun. It can be traced back all the way to the centralobject of Virgo, where it is produced in a volume about as small as Saturn’s orbit around the sun.
This, finally, is the manifestation of the beast that lives within the center of M87. You have probably knownit all along: At the center of virtually every galaxy lives a super-massive black hole. We know this, becausematerial around the black hole follows Keplerian orbits, which sometimes allows us to measure the mass ofthe black hole directly (like in the case of M87 and Sgr A*).
While these black holes lie dormant almost all of the time (like in the center of our galaxy – Sgr A* is theblackest black hole known to date), once awoken, they unleash enormous amounts of energy, outshiningentire galaxies and blasting huge holes into the intergalactic gas (like the black hole in M87). Where doesthis energy come from? It is the gravitational energy released by material in Keplerian rotation around theblack hole itself. This shows you just how powerful Kepler’s laws really are – if only he could have knownthis when he discovered them...
Figure 4: High resolution Hubble image M87. The bright, narrowbeam of magnetic fields and relativistic particles is called ajet. It is 2 kpc (6000 light years) long.
14 12/04/2006
Extra Credit:
The size of a black hole is given by its Schwarzschild radius Rs. This is the radius of the sphereinside from which nothing, not even light, can escape. For a black hole with mass MBH, it iscalculated using the formula
Rs=2*G*MBH/c2
G=6.7x10⁻²⁰ km3/s2 is Newton’s gravitational constant, c=3x10⁵ km/s is the speed of light. Themass of the sun is 2x10³ 0 kg.
(a) Calculate the size of Sgr A* and the black hole at the center of M87:
RSgrA* = km
RM87 = km
(b) The jet in M87 can be traced back to a distance of less than 3000 AU from the blackhole. How many Schwarzschild radii is this? Compare this to the raius inside whichstars get ripped up by the black holes gravitational pull, which is about 500Schwarzschild radii.