astrocytic signaling supports hippocampal–prefrontal theta ... gjclub/glia 65 1944 2017.pdf ·...
TRANSCRIPT

R E S E A R CH AR T I C L E
Astrocytic signaling supports hippocampal–prefrontal thetasynchronization and cognitive function
Vanessa Morais Sardinha1,2 | S�onia Guerra-Gomes1,2 | Ines Caetano1,2 |
Gabriela Tavares1,2 | Manuella Martins1,2 | Joana Santos Reis1,2 |
Joana Sofia Correia1,2 | Andreia Teixeira-Castro1,2 | Luísa Pinto1,2 |
Nuno Sousa1,2 | Jo~ao Filipe Oliveira1,2,3
1Life and Health Sciences Research Institute (ICVS), School of Medicine, University of Minho, Campus Gualtar, Braga 4710-057, Portugal
2ICVS/3B’s-PT Government Associate Laboratory, Braga/Guimar~aes, Portugal
3DIGARC, Polytechnic Institute of C�avado and Ave, Barcelos 4750-810, Portugal
Correspondence
Jo~ao Filipe Pedreira de Oliveira, Life and Health Sciences Research Institute (ICVS), School of Medicine, University of Minho, Campus de Gualtar, 4710-057 Braga,
Portugal. Email: [email protected]
Funding information
Foundation for Science and Technology
(FCT) project (PTDC/SAU-NSC/118194/
2010) to V.M.S., S.G.G., G.T., M.M., J.S.R.,
J.S.C., J.F.O. and fellowships (SFRH/BD/
89714/2012 to V.M.S., SFRH/BPD/97281/
2013 to J.F.O., SFRH/BD/101298/2014 to
S.G.G., IF/00328/2015 to JFO, IF/01079/
2014 to LP); Marie Curie Fellowship FP7-
PEOPLE-2010-IEF 273936 and BIAL
Foundation Grants 207/14 to J.F.O. and
427/14 to LP; Northern Portugal Regional
Operational Programme (NORTE 2020),
under the Portugal 2020 Partnership
Agreement, through the European Regional
Development Fund (FEDER) (NORTE-01-
0145-FEDER-000013); FEDER funds,
through the Competitiveness Factors
Operational Programme (COMPETE), and
National funds, through the FCT (POCI-01-
0145-FEDER-007038)
AbstractAstrocytes interact with neurons at the cellular level through modulation of synaptic formation,
maturation, and function, but the impact of such interaction into behavior remains unclear. Here,
we studied the dominant negative SNARE (dnSNARE) mouse model to dissect the role of
astrocyte-derived signaling in corticolimbic circuits, with implications for cognitive processing. We
found that the blockade of gliotransmitter release in astrocytes triggers a critical desynchronization
of neural theta oscillations between dorsal hippocampus and prefrontal cortex. Moreover, we
found a strong cognitive impairment in tasks depending on this network. Importantly, the supple-
mentation with D-serine completely restores hippocampal–prefrontal theta synchronization and
rescues the spatial memory and long-term memory of dnSNARE mice. We provide here novel
evidence of long distance network modulation by astrocytes, with direct implications to cognitive
function.
K E YWORD S
astrocyte, behavior, local field potential, neuronal morphology, oscillations
1 | INTRODUCTION
Brain networks display a high degree of complexity that supports behav-
ior. This complexity relies on functional, morphological and molecular
features of neurons and glial cells that integrate them. Among the glial
cells, astrocytes maintain with neurons a dialogue that was shown to
underlie the functional modulation of brain networks. In this dialogue,
astrocytes are able to sense and process neuronal information and reply
back to neurons, due to the close apposition at neuronal synapses of
thin processes endowed with neurotransmitter receptors (Araque et al.,
2014; Clarke & Barres, 2013; Khakh & Sofroniew, 2015; Pannasch et al.,
2014), to the development of complex calcium signaling in subcellular
compartments (Haydon & Nedergaard, 2015; Perea, Sur, & Araque,
2014; Rusakov, 2015; Volterra, Liaudet, & Savtchouk, 2014), and to the
controlled release of neuroactive substances (Araque et al., 2014; Perea
et al., 2014; Petrelli & Bezzi, 2016). Particularly, the release of active
molecules by astrocytes, a process named gliotransmission, has been
critically appraised and extensively described (Araque et al., 2014; Pet-
relli & Bezzi, 2016; Verkhratsky, Matteoli, Parpura, Mothet, & Zorec,
2016). Gliotransmitters such as ATP, glutamate or D-serine were shown
Glia. 2017;1–17. wileyonlinelibrary.com/journal/glia VC 2017Wiley Periodicals, Inc. | 1
Received: 2 January 2017 | Revised: 14 July 2017 | Accepted: 31 July 2017
DOI: 10.1002/glia.23205

to modulate the strength of neighboring synapses with functional conse-
quences to the network output. In particular, D-serine, a potent NMDA-
receptor co-agonist, was related to synaptic structure and function (Bail
et al., 2015; Miller, 2004). This effect was described not only for neuron-
derived (Balu & Coyle, 2012; Rosenberg et al., 2013), but also for
astrocyte-derived D-serine. The latter is thought to represent the major
source of D-serine (Kang et al., 2013; Martineau et al., 2013; Martineau,
Galli, Baux, & Mothet, 2008; Oliet & Mothet, 2006; Papouin, Dunphy,
Tolman, Dineley, & Haydon, 2017; Yang et al., 2003), and is critical for
the maintenance of hippocampal synaptic plasticity (Fellin et al., 2009;
Han, Peng, & Dong, 2015; Henneberger, Papouin, Oliet, & Rusakov,
2010; Martineau et al., 2013) and for dendritic maturation of newly-
born neurons in the hippocampus (Sultan et al., 2015).
This neuron–astrocyte dialogue at the synaptic level should in turn
be reflected in network outputs. In fact, a number of strategies have
been employed to tackle the involvement of astrocytes on the computa-
tion of several behavioral dimensions, namely on cognition (Oliveira, Sar-
dinha, Guerra-Gomes, Araque, & Sousa, 2015). However, the putative
involvement of astrocytes in cognitive modulation remains unclear,
mostly due to the current knowledge gap between cellular interactions
and behavior levels. To address this issue, we have designed an
approach to assess the role of astrocyte signaling in corticolimbic circuits
involved in cognitive processing. For that we analyzed the hippocampus-
prefrontal cortex electrophysiological synchrony and related cognitive
computation in dominant negative SNARE (dnSNARE) mouse model of
astrocyte-specific exocytosis impairment (Halassa et al., 2009; Pascual
et al., 2005; Sultan et al., 2015). Within the hippocampus, cognitive func-
tions rely primarily on the dorsal subregion (Fanselow & Dong, 2010).
Despite its indirect connection to the prefrontal cortex (Preston &
Eichenbaum, 2013), oscillations of the dorsal hippocampus highly syn-
chronize with units and ensembles in the prefrontal cortex to support
cognitive tasks, such as spatial learning and memory processing (Gordon,
2011; Jones & Wilson, 2005; O’Neill, Gordon, & Sigurdsson, 2013). Tak-
ing advantage of the specific dnSNARE transgene expression in astro-
cytes of the hippocampus and cortex (Pascual et al., 2005; Sultan et al.,
2015), which causes a decrease of extracellular D-serine levels in those
brain regions (Sultan et al., 2015), we analyzed electrophysiology finger-
prints of the hippocampus–prefrontal cortex network, carried out a bat-
tery of cognitive tests and histological/molecular correlates to confirm
the involvement of astrocytic signaling in cognitive function.
2 | MATERIALS AND METHODS
2.1 | Animals
All experimental procedures were conducted in accordance with the
guidelines for welfare of laboratory animals, as described in the Direc-
tive 2010/63/EU, and were approved by the local ethical committee
(SECVS 075/2015) and national authority for animal experimentation
(DGAV). The generation of dominant-negative SNARE (dnSNARE) mice
of gliotransmission impairment was performed as previously described
(Pascual et al., 2005). The dnSNARE mice and respective wild-type lit-
termates were obtained by crossing two transgenic mouse lines:
GFAP-tTA, in which the expression of tetracycline transactivator (tTA)
is mediated by the astrocyte-specific human glial fibrillary acidic protein
(hGFAP) promoter; tetO.dnSNARE, in which the dominant-negative
domain of vesicular SNARE VAMP2/synaptobrevin II, as well as the
reporter enhanced green fluorescence protein (EGFP) are coexpressed
under the control of the tetO promoter. Developmental expression of
dnSNARE was prevented by breeding the animals in the presence of
doxycycline (Dox, Sigma-Aldrich) in the drinking water (100 mg/mL;
water bottles covered with aluminum foil to avoid light exposure),
which was removed 6 weeks before the beginning of the behavior
experiments. The conditional expression of the dnSNARE transgenes
caused interference with the SNARE complex formation and consecu-
tive blockade of exocytosis specifically in astrocytes (astrocytes derived
from dnSNARE mice displayed a 91% reduction in the number of
fusion events) (Sultan et al., 2015), impairing the vesicular release of
gliotransmitters. Founders of both mice lines were kindly supplied by
Prof. Philip Haydon (Tufts University, USA), and were maintained in
the C57Bl6/J genetic background. All mice had ad libitum access to
food and water in their home cages (max 5 mice per cage) and lights
were maintained on a 12 h light/dark cycle (lights on 8:00 A.M. to 8:00
P.M.). Male mice within ten to 12 weeks-old were used. Their geno-
type was confirmed by PCR: mice negative (wild-type) or positive for
both transgenes (dnSNARE) were tested, while mice expressing single
transgenes (GFAP-tTA or tetO.dnSNARE) were not included. Mice of
both genotypes are visually indistinguishable and were kept in the
housing cages mixed. Each mouse received a numbered tag which
remained constant throughout the experiment and allowed to perform
the complete behavior, electrophysiological, histological, and molecular
analysis in a blind manner.
2.2 | In vivo electrophysiology
Surgical procedures, acquisition, and analysis of local field potential
(LFP) signals from the medial prefrontal cortex (mPFC) and dorsal hip-
pocampus (dHIP) were performed as previously described (Oliveira,
Dias, Jacinto, Cerqueira, & Sousa, 2013).
Mice were anesthetized with sevofluorane (4%, SevoFlo, Abbott,
USA) and the body temperature controlled and maintained at 378C by
a homoeothermic blanket (Stoelting, Ireland). When deeply anesthe-
tized each animal was mounted on the stereotaxic apparatus (KOPF,
USA). To avoid local pain during the surgery, Lidocaine (2%, B. Braun,
Germany) was injected subcutaneously in the area of incision. The eyes
were covered with an ophthalmic cream (Duratears Z, Alcon, USA) to
avoid dehydration. Experimental procedures for electrode implantation
were described previously (Oliveira et al., 2013). Briefly, concentric
platinum/iridium recording electrodes (400 mm shaft diameter; Science
Products, Germany) were placed in the prelimbic area (PL) of the mPFC
(coordinates: 1.94 mm anterior to bregma, 0.4 mm lateral to the mid-
line, 2.5 mm below bregma), and in CA1 of dHIP (coordinates: 1.94 mm
posterior to bregma, 1.2 mm lateral to the midline, 1.5 mm below
bregma), according to the mouse brain atlas (Paxinos & Franklin, 2001).
A stainless-steel screw was placed above the contralateral hemisphere
and used as reference electrode.
2 | SARDINHA ET AL.

Local field potential (LFP) signals from the mPFC and dHIP were
acquired and analyzed as previously described (Oliveira et al., 2013).
These signals were simultaneously amplified, filtered (50003; 0.1–
300 Hz; LP511 Grass Amplifier, Natus, USA), acquired (Micro
1401mkII, CED, UK) and recorded on a personal computer running Sig-
nal Software (CED, UK). After surgery and a resting period of 20 min,
100 s of local field activity were recorded at the sampling rate of
1000 Hz. The power of PFC and dHIP regions, as well as the coher-
ence assessment between both regions, were performed on LFP signals
acquired for each mouse. Each measure was applied on 1 s long seg-
ments and the average of all segments was considered for statistical
analysis. All LFP recordings were thoroughly inspected and those that
presented significant noise corruption were excluded from further anal-
yses. Power and coherence were calculated with custom-written MAT-
LAB-based programs and scripts (MathWorks, USA), using the Chronux
toolbox (http://www.chronux.org) (Mitra & Pesaran, 1999), for all fre-
quencies from 4 to 40 Hz. For power quantification, the squared mag-
nitude of Fourier data was evaluated, across the frequency domain for
each brain region. Coherence analysis was based on multi-taper analy-
sis of the signal magnitude for both regions. For group comparison,
three frequency bands were analyzed based on previously described
functional relevance: theta (4–12 Hz); beta (12–20 Hz); low gamma
(20–40 Hz).
After the electrophysiological protocol, animals were euthanized
with a lethal dose of sodium pentobarbital (150 mg/kg, i.p). A biphasic
stimulus (5 s, 0.7 mA for mPFC, and 0.8 mA for dHIP) was delivered to
both electrodes in order to mark the local of recording. Brains were
carefully removed and the left hemisphere (electrodes location) was
immersed in paraformaldehyde 4% (PFA) in PBS (0.1M, pH 7.4) for tis-
sue fixation. One day after, it was sectioned in 50 lm slices using a
vibratome (Leica Biosystems, Germany) and processed with cresyl vio-
let staining to identify the electrolytic lesion at the recording sites.
Whenever at least one of the electrodes was wrongly positioned in the
targeted region, mice were discarded from the analysis (about 15% of
the recordings). The right hemisphere was macrodissected and cryopre-
served for molecular analysis.
2.3 | Behavior
Mice were tested during the light phase. Prior to experimentation,
mice were handled daily for 5 min, throughout 1 week, and habitua-
tion to testing rooms was performed 1 h before the beginning of
each test.
2.3.1 | Morris water maze
Morris water maze (MWM) was used to assess spatial reference mem-
ory, slightly modified from Lima et al. (2014). The test was conducted
under dim light in a dark circular pool (106 cm diameter) filled with
water at 238C6 18C, with extrinsic visual cues (square, triangle, horizon-
tal stripes, and cross). In order to increase the contrast to detect the
mice, water was made opaque with the addition of nontoxic titanium
dioxide (Sigma-Aldrich; 250 mg/L). A circular escape platform (10 cm
diameter, 22 cm height) was placed in one of the four imaginary
quadrants of the pool submerged 1 cm below the water surface. The
4 days of protocol consisted in a hippocampal-dependent task whose
goal was to assess the ability of mice to learn the position of the hidden
platform kept always in the same position. Each day, mice performed
four consecutive trials (maximum of 60 s, with a 30 s intertrial interval)
being placed in the pool facing the maze wall and oriented to each of
the extrinsic cues in random order. Whenever mice failed to reach the
platform, they were manually guided to the platform for 30 s before
being positioned at a new starting point. Escape latencies, distances
swam and swim pattern were monitored and analyzed using a video
camera and the EthoVision XT 11.5 software (Noldus, The Netherlands).
2.3.2 | Hole board
The hole board (HB) task was performed to assess spatial orientation,
namely reference and working memory (Castilla-Ortega et al., 2010).
Transgenic mice and WT littermates were food restricted for 4 days
before the beginning of the test to achieve a body weight drop to 80–
85% of their free-feeding weights and food deprivation lasted through
the whole behavioral experiment. The behavioral test was performed in
a hole board containing 16 equidistant holes (6 cm apart, 1.5 cm diame-
ter, 2.5 cm depth; MedAssociates, USA). The hole board was placed
inside a maze with Plexiglas walls with a different cue in each wall for
orientation. All mice were submitted to 3 days of habituation (1 daily
session of 10 min) and one food pellet was placed in each of the 16
holes to attract mice to explore holes and eat the pellets. In the following
4 days, only a fixed set of 4 holes was baited with a pellet in a pattern
that remained constant (2 sessions per day with an intersession interval
of 2 h, each session consisting in two trials with an intertrial interval of
45 s). Each trial had a maximum duration of 5 min, finishing whenever
the animal found all four rewards. Mice were manually placed inside the
HB arena at one of four random starting locations. Arenas were cleaned
with 10% ethanol between trials. Tests were evaluated by tracking ani-
mals trail with an infrared detection system and a computer interface.
The following measures were analyzed: RM ratio (number of visits to the
baited set of holes over the number of visits to all holes—provides an
index for the ability of animals to discriminate between baited and
unbaited holes); and WM ratio (number of rewarded visits over the num-
ber of visits to the baited set of holes—reflects the ability of the animals
to avoid re-visits to baited holes during a trial).
2.3.3 | Novel object recognition
The novel object recognition (NOR) task (Leger et al., 2013) was con-
ducted under dim white-light illumination in a lusterless white box
(30 3 30 3 30 cm). Habituation to the empty box was performed in
three consecutive days for 20 min. In the fourth day of the task animals
were submitted to a training phase consisting in the exploration of two
equal objects (glass bottles) for 10 min. In the fifth day, for the novel
object recognition phase, one of the familiar objects was replaced by a
novel (Lego® brick) and mice were placed in the arena and allowed to
explore both for 10 min. This trial assesses the ability to recognize a novel
object 24 h after the first exposition, evaluating long-term recognition
memory. After an interval of 1 h in their home cages, the novel object
was displaced to the opposite side of the box and mice were allowed to
SARDINHA ET AL. | 3

explore this new configuration. This trial allowed the assessment of the
spatial recognition memory of the subjects. Boxes were cleaned between
trials and subjects with 10% ethanol. Behavior was video-recorded and
analyzed using EthoVision XT 11.5 software (Noldus, The Netherlands).
Exploration time of the novel or displaced objects over the total explora-
tion time was used as measure of object preference.
2.3.4 | Two-trial place recognition
The two-trial place recognition (2TPR) task is based on the innate
predisposition of rodents to explore novel environments. The 2TPR
is a test performed in the Y-Maze arena to assess spatial recognition
memory, a form of episodic-like memory in rodents (Costa-Aze,
Quiedeville, Boulouard, & Dauphin, 2012). It does not require learn-
ing of a rule being useful in particular for the study of genetic influ-
ences on the response to spatial novelty. The Y-maze consisted in
an apparatus made of white Plexiglas with three identical arms
(33.2 L 3 7 W 3 15 cm H) which were randomly designated start
(S), familiar (F), and novel (N) arms. Visual cues were placed at the
end of each arm of the maze. In the first trial, mice were placed in
the start arm and allowed to explore only two arms (S and F) for
5 min. Mice were replaced in their home cages for a period of 30 s,
and then they were placed in the start arm of the maze and allowed
to explore the three arms for 2 min for memory retrieval. The maze
was cleaned with 10% ethanol between trials and subjects, and the
test was performed in a dim light room. Mice trail was video-
recorded and analyzed using EthoVision XT 11.5 software (Noldus,
Netherlands). The percentage of time spent in the distal third of the
novel arm was considered a measure of spatial recognition memory.
2.4 | Molecular analysis
2.4.1 | Macrodissection, RNA isolation, cDNA synthesis,
and real-time PCR analysis
In order to assess the transcription levels of the dnSNARE and EGFP
transgenes, relative mRNA levels of both genes were quantified by RT-
PCR. Animals were first anesthetized with a mixture of ketamine
(75 mg/kg, i.p.; Imalgene 1000, Merial, EUA) and medetomidine (1 mg/
kg, i.p.; Dorbene Vet, Pfizer, EUA) and transcardially perfused with
0.9% saline. Brains were carefully removed and macrodissected, and
tissue samples were stored at 2808C until further analysis. To avoid
experimenter-dependent bias, all brains were macrodissected by a sin-
gle investigator.
Total RNA was isolated from macrodissected tissue of the prefron-
tal cortex of dnSNARE mice (n 5 15), using the Direct-zol RNA mini-
Prep kit (Zymo Research, USA), according to manufacturer’s
instructions. Briefly, tissue was mechanically homogenized with a
syringe and 20G needle using the NZYol reagent (NZYTech, Portugal).
Total RNA (500 ng) was reverse-transcribed using qScriptTM cDNA
SuperMix (Quanta Biosciences, USA). The following primers were
designed using PRIMER-BLAST (NCBI, http://www.ncbi.nlm.nih.gov/
tools/primer-blast/) and used for expression quantification: EGFP (F 50-
CCCGACAACCACTACCTGAG-30; R 50-ACTTTGACCATCAGAGGA-
CATT-30); dnSNARE (F 50-TACCAGTAACAGGAGACTGC-30; R 50-
ACTTTGACCATCAGAGGACATT-30). Quantifications were performed
using the Fast Real-Time PCR System (Applied Biosystems, USA) and
53 HOT FIREPol® EvaGreen® qPCR Mix Plus, ROX (Solis Biodyne,
Estonia). Target gene expression levels were normalized against the
housekeeping gene 18S rRNA and the relative expression was calcu-
lated using the DDCt method.
2.4.2 | Western blot analysis
In order to screen the transgenic protein levels in the brain regions ana-
lyzed in the behavior and electrophysiology experiments, relative EGFP
levels were quantified by western-blot. Brain samples containing the
hippocampus were lysed in cold HEPES-buffered sucrose (0.32M
sucrose, 4 mM HEPES, pH 7.4) with 1% Nonidet-P40, 0.5% SDS, and a
mixture of protease inhibitors (cOmplete, EDTA-free, Roche, Switzer-
land). Then, samples were sonicated for 10 s and centrifuged at
10,000 rpm during 25 min at 48C. The supernatant was collected and
protein concentrations were determined using the Bradford protein
assay (Bio-Rad, USA). Total lysates were denatured in 23 Laemmli
buffer (Bio-Rad, USA) by heating for 5 min at 1008C. Each sample was
centrifuged during 10 s before loading. Equal protein amounts (50 mg)
were loaded into SDS-PAGE (10%) gels and then transferred to a nitro-
cellulose membrane (Trans-blot Turbo Kit, Bio-Rad, USA). Membranes
were blocked in 5% dry milk/TBS (1 h) before incubation overnight at
48C with the primary antibodies: mouse anti-a-tubulin (1:500, DSHB,
USA); goat anti-GFP (RRID: AB_305643; 1:2000, Abcam, UK). After
washing with TBS-T, membranes were incubated with secondary anti-
bodies: anti-mouse HRP (RRID: AB_11125547; 1:15,000; Bio-Rad,
USA) and antigoat HRP (1:5000, Bio-Rad, USA), respectively. Detection
of the chemiluminescent signal was performed with the Clarity West-
ern ECL substrate kit (Bio-Rad, USA) using a gel blot imaging system
(Chemidoc, Bio-Rad, USA). Band quantification was assessed using the
Image Lab software (Bio-Rad, USA), and all the samples were normal-
ized according to the loading control (a-tubulin). Given the difficulty of
quantifying dnSNARE protein levels in brain tissue (available antibodies
detect similarly both the truncated and endogenous forms of synapto-
brevin 2), and the fact that the EGFP levels observed are highly corre-
lated with the EGFP mRNA levels, which in turn directly correlate with
the dnSNARE levels, the quantification of GFP by western blot was
used throughout to screen the transgene expression levels in all mice
tested. To confirm the induction of expression of dnSNARE transgenes
after Dox removal from the diet, groups of 2 dnSNARE mice were sac-
rificed at different timepoints (on Dox, 1, 2, 3, 4, and 8 weeks after
Dox removal). Additionally, 2 wild-type littermates were sacrificed for
negative control. Protein extracts were obtained from whole-brain
lysates. To quantify the relative levels of GFP across brain regions and
across animals, the brains of 13 dnSNARE mice were macrodissected
6 weeks after Dox removal, and each brain region was processed inde-
pendently by western blot as described above.
2.4.3 | Immunofluorescence analysis
Brain tissue of the tested animals was stained by immunofluores-
cence to visualize the expression of transgene reporters, to study
the co-expression with astrocytic and neuronal markers, to allow the
4 | SARDINHA ET AL.

3D reconstruction of astrocytes and assessment of astrocytic den-
sities. Mice were deeply anaesthetized with the ketamine and mede-
tomidine mix, and readily perfused transcardially with 4% PFA.
Brains were carefully removed and immersed during 48 h in 4% PFA.
After impregnation with 30% sucrose PBS solution (at 48C, until sink-
ing), brains were frozen by immersion in isopentane, cooled with liquid
nitrogen in Neg-50 medium (ThermoFisher Scientific, USA) and stored
at 2208C. The immunofluorescence procedures were performed in cor-
onal brain sections (20 lm thick) obtained by means of a cryostat (Leica,
Germany). The double staining protocol started with three washes with
PBS followed by a permeabilization with 0.3% v/v Triton X-100 in PBS.
Sections were washed over again and submitted to an antigen retrieval
step, with citrate buffer (10 mM, pH 6.0, Sigma-Aldrich) during 20 min
at 100W microwave potency. Once cooled, slices were rinsed in PBS
and incubated with 10% fetal bovine serum (FBS) in PBS blocking solu-
tion for 30 min at room temperature (RT), followed by the overnight
incubation, at 48C, with combinations of the primary antibody goat pol-
yclonal anti-GFP (RRID: AB_305643; 1:300, Abcam, UK) and one of the
following: rabbit polyclonal anti-GFAP (RRID: AB_10013482; 1:200,
DakoCytomation, Denmark), or rabbit polyclonal anti-S100b (1:200,
DakoCytomation, Denmark) for staining of astrocytes; or mouse poly-
clonal anti-NeuN (RRID: AB_10807945; 1:100, Millipore, Germany) for
staining of mature neurons; all prepared in PBS with 0.3% Triton X-100
and 4% fetal bovine serum (FBS). On the next morning tissue sections
were rinsed in PBS and then incubated with the respective species-
specific secondary antibodies: Alexa Fluor® 488 donkey antigoat, Alexa
Fluor® 594 donkey antirabbit and Alexa Fluor® 594 donkey antimouse
(1:1000, ThermoFisher Scientific, USA) in PBS with 4% FBS, during 2 h
at room temperature. After rinsing the brain slices with PBS, the nucleic
acids were indiscriminately labeled by 10 min incubation with DAPI
(RRID: AB_ 2307445; 1:1000, Invitrogen, USA) in the dark. After a final
series of rinses in PBS, slides were mounted using Immu-mount (Ther-
moFisher Scientific, USA) mounting media and evaluated through con-
focal microscopy imaging (FV1000, Olympus, Japan) and FIJI open
source software (http://fiji.sc/Fiji).
2.5 | 3D-reconstruction of neurons
All procedures employed to assess the morphology of neurons were
previously described (Lima et al., 2014). In order to assess dendritic
morphology of hippocampal neurons a set of animals (n 5 5 WT and
n 5 5 dnSNARE) were perfused with 0.9% saline under deep anesthe-
sia (ketamine and medetomidine mix) and were processed for Golgi–
Cox staining. Briefly, brains were removed and immersed in Golgi–Cox
solution (1:1 solution of 5% potassium dichromate and 5% mercuric
chloride diluted 4:10 with 5% potassium chromate) for 14 days; trans-
ferred to a 30% sucrose solution (minimum 3 days) and sectioned by
means of a vibratome. Coronal sections (200 lm thick) were collected
in 6% sucrose and blotted dry onto gelatin-coated microscope slides
and subsequently alkalinized in 18.7% ammonia, developed in Dektol
(Kodak, USA), fixed in Kodak Rapid Fix, dehydrated and xylene cleared,
mounted, and coverslipped. All incubation steps were performed in a
dark room.
Three-dimensional (3D) reconstruction of Golgi–Cox impregnated
neurons was performed in the CA1 subregion of the dorsal hippocam-
pus following the mouse brain atlas (Paxinos & Franklin 2001). CA1
pyramidal neurons were readily identified by their characteristic trian-
gular soma-shape, apical dendrites extending toward the stratum radia-
tum. Neurons were selected for reconstruction following these criteria:
(i) identification of soma within the pyramidal layer of CA1 (ii) full
impregnation along the entire length of the dendritic tree; (iii) no mor-
phological changes attributable to incomplete dendritic impregnation
of Golgi–Cox staining or truncated branches. To avoid selection bias,
brain slices containing the region of interest were randomly searched
and the first six neurons from each animal were reconstructed from at
least three brain slices (containing both hemispheres). The dendritic
reconstruction was performed by using a motorized microscope con-
trolled by the Neurolucida software (MBF Bioscience, USA) under
1003 magnification. The analyzed dendritic features were: total length,
number of endings and nodes and Sholl analysis (number of dendrite
intersections at radial intervals of 20 mm). Dendritic spine densities
were also assessed in randomly selected 30 mm segments of three
proximal and three distal dendritic branches per neuron, and were cate-
gorized in four types (thin, mushroom, wide, and ramified). The features
of both reconstructed neurons and spines were quantified using Neu-
roExplorer software (MBF Bioscience, USA).
2.6 | D-Serine administrations
In order to rescue the functional impairments displayed by dnSNARE
mice, D-serine was administered to mice of both genotypes during elec-
trophysiology and behavior experiments (Sigma-Aldrich, USA; 1 g/kg of
body weight, 10 mL/kg of body weight in saline, i.p.). This administra-
tion was described to increase the intracerebral levels of D-serine and
rescue functional deficits in different contexts and independent labora-
tories (Guercio et al., 2014; Han et al., 2015; Takata et al., 2011).
Details are provided as Supporting Information.
For the electrophysiological experiments, surgical procedures and
electrode placement were performed as described above. After the sur-
gery and resting period, 15 periods of 100 s of local field activity were
recorded each 5 min. D-Serine was administered i.p. after the third record-
ing, and the effect of D-serine was observed during the next 12 recordings
(60 min). The first three recordings represent the basal activity, while the
12 following recordings represent the longitudinal effect of D-serine
administration. The electrode positions were verified as described above.
For the behavior experiments, either D-serine or saline were
administered to an independent set of mice 20 min before the first trial
on each day in the MWM task, or 20 min before the training session in
the NOR task. Despite the i.p. injection, mice behaved normally and no
signs of distress or potential drug side effects were observed, therefore
no animal was excluded for those reasons.
2.7 | Statistical analysis
Results are presented throughout as mean 6 SEM (standard error
of the mean) and the statistical significance of the comparisons for
SARDINHA ET AL. | 5
each statistical test was set with a confidence interval of at least
95%. All data sets passed the normality tests for Gaussian distribu-
tions (D’Agostino and Pearson for n > 7; Kolmogorov–Smirnov for
n 5 5–6), therefore parametric tests were applied. Two-way analy-
sis of variance repeated measures (ANOVA) and Sidak post hoc
tests were used to analyze the performance in the MWM, HB (fac-
tors: genotype and test day); and Sholl analysis data for neuronal
3D reconstructions (factors: genotype and radial distance from
soma). Two-way ANOVA and Fisher’s LSD test were applied to
analyze the 2TPR, spines distribution and effects of D-serine. One-
way ANOVA was used to compare data between three groups
(WT, dnSNARE, and lGFP). Pearson coefficients were calculated to
assess correlations between: mRNA relative levels of dnSNARE
and EGFP transgenes; between behavior performance and GFP
levels or electrophysiological activity. In the remaining experi-
ments, unpaired two-sided t tests were applied to compare data
between the two groups: WT and dnSNARE. Statistical analysis
was performed using the GraphPad Prism 6 (GraphPad Software,
USA).
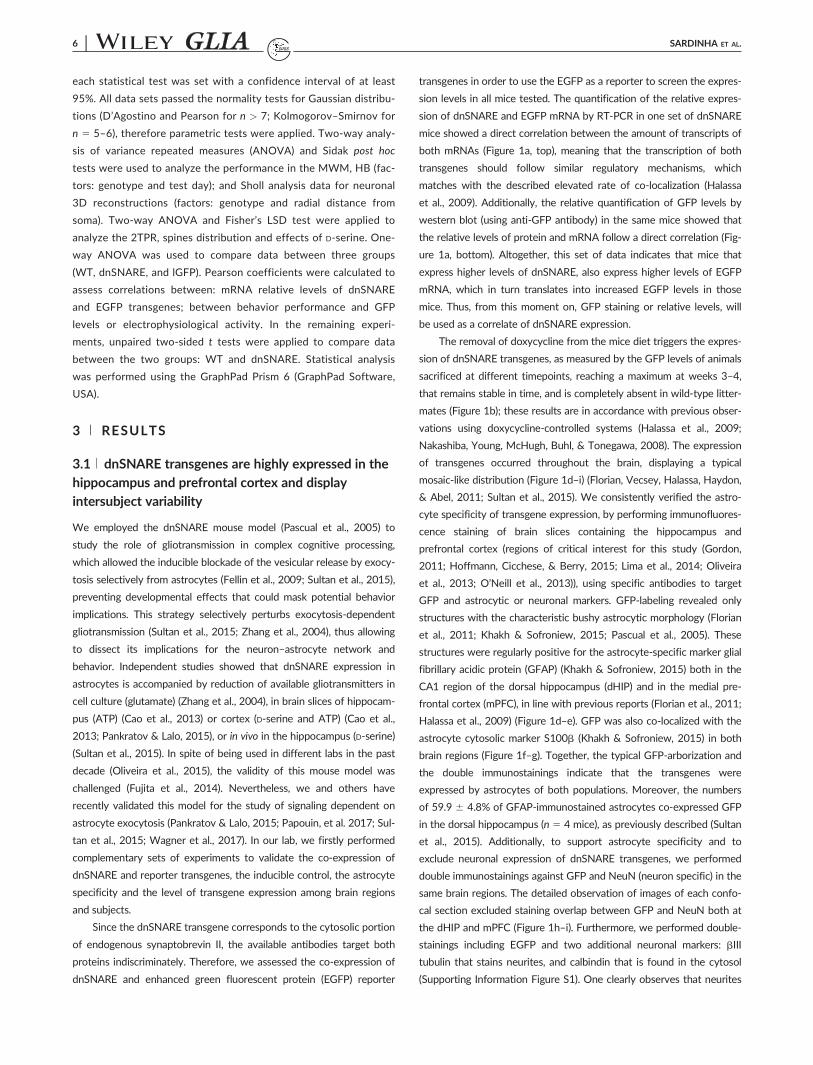
3 | RESULTS
3.1 | dnSNARE transgenes are highly expressed in the
hippocampus and prefrontal cortex and display
intersubject variability
We employed the dnSNARE mouse model (Pascual et al., 2005) to
study the role of gliotransmission in complex cognitive processing,
which allowed the inducible blockade of the vesicular release by exocy-
tosis selectively from astrocytes (Fellin et al., 2009; Sultan et al., 2015),
preventing developmental effects that could mask potential behavior
implications. This strategy selectively perturbs exocytosis-dependent
gliotransmission (Sultan et al., 2015; Zhang et al., 2004), thus allowing
to dissect its implications for the neuron–astrocyte network and
behavior. Independent studies showed that dnSNARE expression in
astrocytes is accompanied by reduction of available gliotransmitters in
cell culture (glutamate) (Zhang et al., 2004), in brain slices of hippocam-
pus (ATP) (Cao et al., 2013) or cortex (D-serine and ATP) (Cao et al.,
2013; Pankratov & Lalo, 2015), or in vivo in the hippocampus (D-serine)
(Sultan et al., 2015). In spite of being used in different labs in the past
decade (Oliveira et al., 2015), the validity of this mouse model was
challenged (Fujita et al., 2014). Nevertheless, we and others have
recently validated this model for the study of signaling dependent on
astrocyte exocytosis (Pankratov & Lalo, 2015; Papouin, et al. 2017; Sul-
tan et al., 2015; Wagner et al., 2017). In our lab, we firstly performed
complementary sets of experiments to validate the co-expression of
dnSNARE and reporter transgenes, the inducible control, the astrocyte
specificity and the level of transgene expression among brain regions
and subjects.
Since the dnSNARE transgene corresponds to the cytosolic portion
of endogenous synaptobrevin II, the available antibodies target both
proteins indiscriminately. Therefore, we assessed the co-expression of
dnSNARE and enhanced green fluorescent protein (EGFP) reporter
transgenes in order to use the EGFP as a reporter to screen the expres-
sion levels in all mice tested. The quantification of the relative expres-
sion of dnSNARE and EGFP mRNA by RT-PCR in one set of dnSNARE
mice showed a direct correlation between the amount of transcripts of
both mRNAs (Figure 1a, top), meaning that the transcription of both
transgenes should follow similar regulatory mechanisms, which
matches with the described elevated rate of co-localization (Halassa
et al., 2009). Additionally, the relative quantification of GFP levels by
western blot (using anti-GFP antibody) in the same mice showed that
the relative levels of protein and mRNA follow a direct correlation (Fig-
ure 1a, bottom). Altogether, this set of data indicates that mice that
express higher levels of dnSNARE, also express higher levels of EGFP
mRNA, which in turn translates into increased EGFP levels in those
mice. Thus, from this moment on, GFP staining or relative levels, will
be used as a correlate of dnSNARE expression.
The removal of doxycycline from the mice diet triggers the expres-
sion of dnSNARE transgenes, as measured by the GFP levels of animals
sacrificed at different timepoints, reaching a maximum at weeks 3–4,
that remains stable in time, and is completely absent in wild-type litter-
mates (Figure 1b); these results are in accordance with previous obser-
vations using doxycycline-controlled systems (Halassa et al., 2009;
Nakashiba, Young, McHugh, Buhl, & Tonegawa, 2008). The expression
of transgenes occurred throughout the brain, displaying a typical
mosaic-like distribution (Figure 1d–i) (Florian, Vecsey, Halassa, Haydon,
& Abel, 2011; Sultan et al., 2015). We consistently verified the astro-
cyte specificity of transgene expression, by performing immunofluores-
cence staining of brain slices containing the hippocampus and
prefrontal cortex (regions of critical interest for this study (Gordon,
2011; Hoffmann, Cicchese, & Berry, 2015; Lima et al., 2014; Oliveira
et al., 2013; O’Neill et al., 2013)), using specific antibodies to target
GFP and astrocytic or neuronal markers. GFP-labeling revealed only
structures with the characteristic bushy astrocytic morphology (Florian
et al., 2011; Khakh & Sofroniew, 2015; Pascual et al., 2005). These
structures were regularly positive for the astrocyte-specific marker glial
fibrillary acidic protein (GFAP) (Khakh & Sofroniew, 2015) both in the
CA1 region of the dorsal hippocampus (dHIP) and in the medial pre-
frontal cortex (mPFC), in line with previous reports (Florian et al., 2011;
Halassa et al., 2009) (Figure 1d–e). GFP was also co-localized with the
astrocyte cytosolic marker S100b (Khakh & Sofroniew, 2015) in both
brain regions (Figure 1f–g). Together, the typical GFP-arborization and
the double immunostainings indicate that the transgenes were
expressed by astrocytes of both populations. Moreover, the numbers
of 59.9 6 4.8% of GFAP-immunostained astrocytes co-expressed GFP
in the dorsal hippocampus (n 5 4 mice), as previously described (Sultan
et al., 2015). Additionally, to support astrocyte specificity and to
exclude neuronal expression of dnSNARE transgenes, we performed
double immunostainings against GFP and NeuN (neuron specific) in the
same brain regions. The detailed observation of images of each confo-
cal section excluded staining overlap between GFP and NeuN both at
the dHIP and mPFC (Figure 1h–i). Furthermore, we performed double-
stainings including EGFP and two additional neuronal markers: bIII
tubulin that stains neurites, and calbindin that is found in the cytosol
(Supporting Information Figure S1). One clearly observes that neurites
6 | SARDINHA ET AL.

that originate in the pyramidal layer and spread across the radiatum
layer are devoid of EGFP staining, which remains restricted to the
bushy-like astrocyte structure. In the detail of a single confocal plane
presented, three neurites clearly cross the astrocyte territory independ-
ently (Supporting Information Figure S1a,b). Regarding the calbindin
double staining, we also failed to find co-localization of staining in the
same cellular structures (Supporting Information Figure S1c,d). Since
EGFP is also found in the cytosol, by using this combination, we defi-
nitely excluded the expression of transgenes in neurons. Absence of
co-staining in microglia, NG2-positive cells and oligondendrocytes, also
ruled out co-expression in these cells (Fellin et al., 2009; Sultan et al.,
2015). It is noteworthy, that our observations were extremely consist-
ent across brain areas, and across experimental sets (n 5 5 mice
screened per group), confirming the specific expression of dnSNARE
transgenes in astrocytes.
In order to characterize the regional distribution of dnSNARE
transgenes, we quantified the relative GFP levels across several brain
regions, macrodissected from dnSNARE mice (n 5 13; Supporting
Information Figure S2). Interestingly, we observed a variable expression
of transgenes across animals, which was maintained between brain
FIGURE 1 GFP reporter is a good readout of dnSNARE transgene expression and intersubject variability. (a) Pearson’s correlationsbetween relative expression levels of EGFP mRNA and dnSNARE mRNA (top), or GFP protein levels (bottom), measured in the same set ofdnSNARE mice (n 5 15); (b) doxycycline (dox) removal from the mice diet triggers transgene expression specifically in dnSNARE mice, asassessed by the quantification of GFP (35 kDa) expression on the hippocampus of dnSNARE mice by western blot analysis at 0, 1, 2, 3, 4,and 8 weeks after dox removal from drinking water. Tubulin (55 kDa) was used as control (n 5 2/timepoint); wild-type (WT) mice wereused as negative controls; data plotted as mean 6 SEM. (c) Quantification of the transgene reporter GFP from the hippocampus ofdnSNARE mice (n 5 13) was performed by western blot analysis (35 kDa), relatively to tubulin (55 kDa) for each set of animals after behav-ioral and electrophysiological assessment (the mean value of GFP expression, black dash, was used as criteria to separate two clusters ofanimals in each set: the high and low “expressors” of the transgenes; (d–e) Confocal micrographs illustrating co-expression of GFP reportertransgenes (green) with GFAP (red) in the CA1 of the dorsal hippocampus (D, dHIP, stratum radiatum) and medial prefrontal cortex (E,mPFC, layers III–V) of dnSNARE mice; (f–g) Confocal micrographs illustrating co-expression of GFP reporter transgenes (green) with S100b(red) in the dorsal CA1 (f, stratum radiatum) and mPFC (G, layers III–V) of dnSNARE mice; (h–i) confocal micrographs illustrating doublestaining of GFP reporter transgenes (green) and NeuN (red) in the dorsal CA1 (h, oriens, pyramidal and radiatum layers), and mPFC (i, layerV) of dnSNARE mice. DAPI staining, blue. Scale bars 5 50 lm [Color figure can be viewed at wileyonlinelibrary.com]
SARDINHA ET AL. | 7

regions, meaning that mice that presented high levels of expression in
the hippocampus also displayed high expression in other brain regions,
while the opposite was also true. The distinct levels of transgene
expression observed among different animals may be due to the regu-
lation of gene expression upstream and/or coupled with transcription.
Epigenetic regulation may vary among different animals determining
chromatin availability (e.g., DNA methylation, histone acetylation),
which may impact directly in transgene expression both at the mRNA
and protein levels. Since the expression of truncated synaptobrevin II
(dnSNARE) rules the level of exocytosis blockade, one shall expect that
only mice displaying high levels of dnSNARE would present an effec-
tive impairment in functions dependent on exocytotic release from
astrocytes. Therefore, we divided mice into two groups, based on the
relative expression of GFP: low and high transgene “expressors” (Figure
1c). Since we were interested in hippocampal-dependent behaviors, we
quantified the relative GFP levels in the hippocampus of every mouse
that carried both tTA and tetO transgenes (double-transgenic). This
quantification was repeated for each animal set, and only those mice
who expressed higher levels of GFP transgenes than the group mean
were included in the dnSNARE group, being compared to their
wild-type (WT) littermates throughout. Since this analysis was
performed after the sacrifice, the experimenters were blind both to the
animal genotype and to its relative level of transgene expression. The
data including the low GFP “expressors” will be plotted as Supporting
Information Figures for the verification of transgene level-dependent
loss of function.
3.2 | Astrocyte signaling is crucial for hippocampal–prefrontal theta synchronization
Knowing that the release of gliotransmitters from astrocytes was previ-
ously shown to modulate synaptic communication in the dHIP and PFC
(Araque et al., 2014; Perea et al., 2014; Petrelli & Bezzi, 2016), one
might expect that this cellular modulation might impact the function of
these circuits. To address this idea, we characterized the electrophysio-
logical fingerprints of this network in vivo, by analyzing local field
potentials (LFPs; oscillations that result from coordinated rhythmic
activity of neuronal populations) recorded simultaneously from the
dHIP and mPFC of a set of dnSNARE mice and wild-type (WT) litter-
mates (Figure 2a and Supporting Information Figure S3). The individual
analysis of the LFP power on the frequency domain gives an estimate
of the amplitude of network activity for a given frequency in the basal
FIGURE 2 Gliotransmission impairment compromises theta coherence in the hippocampal–prefrontal network in dnSNARE mice. (a)Scheme depicting the electrode position for recording of local field potentials (LFP) in the medial prefrontal cortex (mPFC, orange) and CA1
region of dorsal hippocampus (dHIP, blue; top); representative LFP traces recorded from the mPFC and dHIP of WT and dnSNARE mice(bottom; scale bars: 100 mV, 1 s); (b–c) LFP power analysis between WT and dnSNARE; left, power spectra for dHIP (b) and mPFC (c); right,power analysis by frequency bands (theta: 4–12 Hz; beta: 12–20 Hz; low gamma: 20–40 Hz); (d) Overlap of representative theta filteredLFP traces of mPFC and dHIP, recorded from WT and dnSNARE mice (scale bars: 50 mV, 500 ms); (e) analysis of synchrony between dHIPand mPFC with dHIP–mPFC coherence spectra (left) and measured by frequency bands (right). WT mice are represented in black anddnSNARE mice in red lines and bars. Data plotted as mean 6 SEM. Two-way ANOVA, Fisher’s LSD tests, *p < .05 (n 5 8–9 per group)[Color figure can be viewed at wileyonlinelibrary.com]
8 | SARDINHA ET AL.

condition. The LFP power measured in WT and dnSNARE mice was
similar both in the dHIP and mPFC at theta, beta and low gamma fre-
quencies (Figure 2b,c). Moreover, the total power recorded was similar
between genotypes (Supporting Information Figure S4a). The analysis
of the distribution of power across frequency bands revealed that theta
oscillations represent most the activity recorded in the dHIP and
mPFC, however dnSNARE mice display similar levels of relative power
for the different frequency bands (Supporting Information Figure S4b).
These results, indicate equivalent energy of the neuronal oscillations at
the given frequencies within each region, which is in line with previous
observations of electroencephalogram data (Fellin et al., 2009). The
analysis by specific frequency bands, defined by their functional rele-
vance (Gordon, 2011; Oliveira et al., 2013), confirmed the power simi-
larities between both genotypes. Next, we addressed the coherence
between the LFPs recorded from the dHIP and mPFC, as a measure of
phase and amplitude synchronization between these regions. Interest-
ingly, dnSNARE mice displayed decreased levels of dHIP–mPFC coher-
ence in the lower frequencies, visible by the superposition of theta-
filtered LFP traces (Figure 2d), which were significantly different form
their WT counterparts for the theta frequency band (Figure 2e). The
level of decrease of dHIP–mPFC theta coherence found in dnSNARE
mice is in line with previous reports from us and others linking this syn-
chrony measure to comparable cognitive deficits (Benchenane et al.,
2010; Oliveira et al., 2013; Sigurdsson, Stark, Karayiorgou, Gogos, &
Gordon, 2010). Next, we took advantage of the variable transgene
expression levels observed between subjects to verify whether the
neuronal activity was modulated by the level of transgene expression.
Indeed, double-transgenic mice that display low levels of expression
display similar electrophysiological activity to controls, being signifi-
cantly different from strongly expressing-dnSNARE mice (Supporting
Information Figure S5a,b). It is noteworthy that the levels of expression
in double-transgenic mice strongly correlate with dHIP–mPFC theta,
but not beta nor low gamma coherence (Supporting Information
Figure S5c–e). Together, these results suggest that astrocyte signaling
is required for maintenance of a basal theta synchronization between
hippocampus and prefrontal cortex, which might be important for cog-
nitive performance.
3.3 | dnSNARE mice display impaired cognitive
function
Based on the available evidence linking dHIP–mPFC correct dialogue
and cognitive processing (Anderson, Rajagovindan, Ghacibeh, Meador,
& Ding, 2009; Benchenane et al., 2010; Hoffmann et al., 2015; Jones &
Wilson, 2005; Oliveira et al., 2013; O’Neill et al., 2013; Siapas, Lube-
nov, & Wilson, 2005; Zhan, 2015), we hypothesized that the observed
loss of dHIP–mPFC synchronization might underlie a cognitive loss in
mice lacking astrocyte signaling. To address this idea, independent sets
of mice were submitted to tasks that assess spatial learning and long-
term memory consolidation (highly dependent on the interaction
between the dHIP and mPFC), using different motivations (e.g., explor-
atory drive, or hunger) and different environments (e.g., water-free are-
nas) (Figure 3).
The Morris water maze (MWM) task was performed to assess ref-
erence memory (RM) (Figure 3a–c) (Lima et al., 2014). In this task, WT
animals learnt to follow the external cues to reach the platform as con-
firmed by the decreasing latencies and distances swam during the trials,
while dnSNARE mice needed to swim longer to reach the same plat-
form, especially in the last days of the task (Figure 3a). In accordance,
dnSNARE mice failed more often to reach the platform within the 60 s
of each trial, and whenever they reached it, they employed rather ran-
dom searching and scanning strategies (Graziano, Petrosini, & Barto-
letti, 2003) indicating a poor spatial orientation (Figure 3b,c). To
confirm these results, RM was additionally tested in the hole board
(HB) task (Castilla-Ortega et al., 2010), which is performed in a different
environment, using food deprivation as motivation to learn the location
of hidden food pellets with the help of spatial cues. In this task, WT
mice learnt to perform the task, as indicated by the increasing RM ratio
measured along the days (Figure 3d). Also in this case, dnSNARE mice
with impaired gliotransmission faced difficulties to discriminate
between baited and unbaited holes, supporting an impairment in RM.
Curiously, the calculation of working memory ratios (more dependent
on the function of the prefrontal cortex) (Castilla-Ortega et al., 2010;
Lima et al., 2014) also pointed out an impairment of the function in the
dnSNARE mice, namely in the first test days. Furthermore, the novel
object recognition (NOR) test was used to assess long-term memory
and spatial recognition memory driven by novelty exploration (Leger
et al., 2013), processes critically dependent on hippocampal and corti-
cal networks. In this test, WT mice dedicated higher percentages of
time exploring the novel object, which was not the case of the
dnSNARE mice (Figure 3e). Regarding the time spent exploring the
object displaced after a short period (1 h), although WT mice spent
more time in the displaced object than dnSNARE mice, this difference
was not statistically significant. These observations support a specific
impairment of long-term recognition memory that matches with the
hippocampal deficits observed in the previous tasks. Finally, we exam-
ined the spatial recognition memory of WT and dnSNARE mice using
the two-trial place recognition task, in which animals were expected to
preferentially explore a novel arm marked by spatial cues, after a short
delay. This configuration allowed the assessment of both dHIP and
mPFC functions (Costa-Aze et al., 2012). The analysis of percentage of
time spent in the distal quadrants showed that, as expected, WT mice
explore significantly more the novel arm, which was not the case of
their dnSNARE littermates (Figure 3f), which reveals deficits on place
recognition memory in the latter. Together, these results indicate a
striking cognitive deficit, namely on functions that rely on the dHIP and
its interaction with the mPFC. Double-transgenic mice that display low
levels of expression perform in the different tasks similarly to controls,
being significantly different from strongly expressing-dnSNARE mice in
the four tasks (Supporting Information Figure S6a–d, left panels). It is
noteworthy that the levels of expression in double-transgenic mice
strongly correlate with a worse performance in the tests that rely on
the dHIP–mPFC link (Supporting Information Figure S6a–d right pan-
els), supporting the use of dnSNARE mice for in vivo testing. This
means that, the higher the expression of truncated synaptobrevin II by
astrocytes in vivo, the stronger the cognitive impairment.
SARDINHA ET AL. | 9

Until now, our results suggest a link between hippocampal–pre-
frontal synchronization impairment and poor performance in cogni-
tive tasks that rely on those areas. To confirm this idea, we measured
dHIP–mPFC synchrony in mice that performed the MWM task, and
we correlated the levels of dHIP–mPFC synchronization with behav-
ior measures. Data show that the lower levels of theta coherence
directly correlate with the poor performance after the third day of
the RM task (longer latencies and distances swam), with the use of
directed strategies and with the success to reach the platform (Figure
4a–c). Moreover, this effect was quite specific, since the dHIP–mPFC
coherence in the beta band only seems to be significantly correlated
with the distance swam in day 1 or the success to reach the platform
(Figure 4d–f), and low gamma coherence fails to correlate with any
of the parameters measured (Figure 4g–i). We and others showed
previously that the HIP-PFC theta coherence is crucial for reference
memory processing (Benchenane et al., 2010; Jones & Wilson, 2005;
Oliveira et al., 2013; Siapas et al., 2005). Now, we specify that by
releasing signaling molecules, astrocytes are required to support hip-
pocampal–prefrontal synchronization that underlies cognitive
performance.
3.4 | Neuronal structures in the dorsal hippocampus
and prefrontal cortex of dnSNARE mice are intact
The results observed hitherto prompted us to seek for structural altera-
tions in neuronal networks that, together with the lack of astrocytic
signaling, could justify the loss of theta synchronization and cognitive
function observed. Therefore, we characterized dendritic morphology
and spine distribution of hippocampal neurons (Lima et al., 2014) since
these features may condition the operation of hippocampal networks.
Tridimensional reconstruction of pyramidal neurons in the dorsal CA1
(dCA1) subregion showed that WT neurons are very similar to
dnSNARE neurons (Figure 5a) for all parameters analyzed (total dendri-
tic length, number of nodes and endings and complexity given by the
number of intersections at increasing radial distances from the soma;
Figure 5b). Furthermore, the proximal and distal spine densities, as well
as its distribution according to maturity criteria remained constant in
mice of both genotypes (Figure 5c). Additional analysis of the dentate
gyrus (DG) subregion of the dorsal hippocampus (Supporting Informa-
tion Figure S7a–c) and the prelimbic region of the prefrontal cortex
(Supporting Information Figure S7d–f) showed that neuronal
FIGURE 3 Gliotransmission impairment compromises spatial learning and reference memory in dnSNARE mice. (a–c) Morris Water Maze test(n 5 14–15 per group); (a) reference memory task scheme (RM, top) and learning curves (bottom, two-way ANOVA repeated measures, Sidakpost hoc tests) showing escape latencies and distances swam; (b) representative swim tracks used to reach the hidden platform (top), of randomsearch/scanning (yellow) and directed search strategies (green); stacked area charts (bottom) displaying the percentage of failures (gray) and strat-egies used to reach platform over the 16 trials of RM for wild-type (WT, left) and dnSNARE mice (right); (c) percentage of failures (top) and cue-based/directed strategies to reach the platform in RM (bottom, t tests); (d) hole board task scheme (top; baited holes, gray; unbaited holes,white); RM and working memory (WM) ratios for WT and dnSNARE mice (bottom; n 5 9–14 per group, two-way ANOVA repeated measures,Sidak post hoc tests); RM ratio: number of visits to the baited holes/total number of visits; WM ratio: number of rewarded visits/number of visitsto the baited holes; (e) novel object recognition task schemes (top) for assessment of long-term (left) and spatial (right) recognition memories; per-centages of exploration time of novel (bottom left) and displaced objects (bottom right; n 5 7–9 per group, t test); (f) Two-trial place recognitiontask scheme (top); percentage of time spent in the distal third of start, familiar or novel arms in the retrieval trial (bottom; n 5 9–12 per group,two-way ANOVA, Fisher’s LSD tests). WT mice represented in black and dnSNARE mice in red lines and bars. Data plotted as mean 6 SEM*p < .05, **p < .01, ***p < .001 [Color figure can be viewed at wileyonlinelibrary.com]
10 | SARDINHA ET AL.

morphologies are also intact in dnSNARE mice. It is noteworthy that
our analysis covers the complete structure of the neurons, regard-
less of their maturity and location within the territory of transgene-
expressing astrocytes. Previously, Sultan and colleagues elegantly
described changes in the morphological properties of the subset of
adult-born granule neurons in the DG of dnSNARE mice, which does
not collide with our data. Notably, they also showed that the exist-
ing large population of granule cells is intact. Although we cannot
exclude that the sub-set of novel cells in the DG might account for
the performance of the behavior tasks, the outputs of the hippocam-
pus are produced by the majority of intact neuronal populations.
Moreover, our LFP recordings are obtained by electrodes implanted
in the pyramidal/radiatum layers of the CA1, where no neurogenesis
occurs. Therefore, these results support the general integrity of the
neuronal structures notwithstanding the lack of surrounding
gliotransmitters.
3.5 | D-serine administration rescues the
hippocampal–prefrontal theta coherence and the
cognitive deficits in dnSNARE mice
We next sought for the molecular mechanism of the alterations so far
reported. Recent literature showed that the release of gliotransmitters
is significantly decreased in the dnSNARE mice (Cao et al., 2013; Pan-
kratov & Lalo, 2015; Sultan et al., 2015). Amongst the different trans-
mitters, the NMDA-receptor co-agonist D-serine arises as a good
candidate, since astrocytes derived from dnSNARE mice release signifi-
cantly less D-serine (Sultan et al., 2015), and D-serine is involved in syn-
aptic modulation in the hippocampus and cortex (Fossat et al., 2012;
Henneberger et al., 2010; Takata et al., 2011; Yang et al., 2003). To
test whether D-serine was implicated in the dnSNARE loss of dHIP–
mPFC theta synchrony, and consequent cognitive deficits, we repeated
these experiments including two sets of WT and dnSNARE mice
FIGURE 4 Theta dHIP–mPFC coherence correlates with the consolidation of reference memory. Pearson’s correlation plots betweenbehavior parameters analyzed for the reference memory MWM task (escape latency, distance swam, directed strategies, and failures toreach the platform) and levels of dHIP–mPFC coherence measured in the same mice (one dot per each WT and dnSNARE mouse) (a–c)theta; (d–f) beta and (g–i) low gamma frequency bands, and the respective p values of each Pearson correlation. Performance of day 1 inyellow, day 2 in orange, day 3 in red, day 4 in black. The percentage of use of directed strategies is plotted in black and percentage offailures to reach platform is plotted in gray [Color figure can be viewed at wileyonlinelibrary.com]
SARDINHA ET AL. | 11

supplemented with either saline or D-serine intraperitoneally (an
approach described to increase the intracerebral levels of D-serine
(Guercio et al., 2014; Han et al., 2015; Takata et al., 2011)).
First, we performed the simultaneous recording of LFPs from
the dHIP and mPFC of WT and dnSNARE mice, and measured the
levels of coherence between both regions longitudinally, after the
administration of D-serine (Figure 6a). D-serine administration trig-
gered a sustained increase of dHIP–mPFC theta coherence after
20–30 min to levels similar to those recorded from of WT mice in
the same conditions, and significantly larger than at baseline (Figure
6a–c). Regarding beta coherence, no differences were observed
between genotypes. Low gamma coherence decreased in WT mice
during the protocol, however dnSNARE mice displayed levels of
coherence similar to WT before and after D-serine administration. In
sum, D-serine administration restored specifically the theta coher-
ence (Figure 6d–e). Spectral power increases in the three frequency
bands analyzed after the administration of D-serine regardless of the
mouse genotype (Supporting Information Figure S8). Despite these
results, the specific rescue of dHIP–mPFC coherence in the theta
frequency band only in the dnSNARE mice (while WT mice display
stable levels of coherence after D-serine administration; Figure 6),
confirms the strength of spectral coherence as a robust readout
of inter-regional synchrony, independently of the amplitude of
neuronal oscillations recorded.
Next, the question was if the rescue of the dHIP–mPFC theta syn-
chronization by D-serine supplementation would also revert the cogni-
tive impairments observed in dnSNARE mice. Indeed, D-serine
administration rescued this phenotype in the MWM test in dnSNARE
mice (Figure 7a), without affecting the performance of WT mice. This is
supported by the shorter latencies and distances swam, the low per-
centage of failures and use of directed strategies to reach the hidden
platform of D-serine-treated dnSNARE mice (Figure 7b,c). In accord-
ance, D-serine administration restored long-term recognition memory
in NOR test for the dnSNARE mice to levels of WT (Figure 7d,e). It is
noteworthy that both low and high transgene “expressors” preformed
at levels of WT mice in the two tasks, as confirmed by the lack of cor-
relation between GFP levels in the hippocampi of these mice and their
respective behavior performance (Supporting Information Figure S9).
This suggests that exogenous D-serine fulfilled the network signaling
needs, despite the variable extracellular levels due to the different lev-
els of exocytosis blockade.
Together, these results show that astrocyte-derived signaling is
required for hippocampal–prefrontal theta coherence, which in turn
seems to support spatial learning and reference memory. Additionally,
they suggest that D-serine might be the gliotransmitter involved in the
astrocyte–neuron signaling.
4 | DISCUSSION
The use of complementary electrophysiological and behavior analysis
of the dnSNARE mice to assess the involvement of astrocyte-derived
gliotransmitters on cognition, suggests that the D-serine mediated sig-
naling is critical for the synchronization of theta oscillations between
the hippocampus and the prefrontal cortex, which underlies perform-
ance in spatial learning and memory tasks.
Astrocyte signaling appears to be important for the modulation of
the cortical oscillations (Deng, Terunuma, Fellin, Moss, & Haydon,
2011; Fellin et al., 2009; Lee et al., 2014; Poskanzer & Yuste, 2016).
However, the modulation of neuronal oscillations that allow the
entrainment of deep brain areas required for cognitive computation
remains elusive. The involvement of D-serine mediated astrocytic
FIGURE 5 Structural characterization of neurons in the dorsal hippocampus CA1 of the WT and dnSNARE mice. (a) Representative 3Dreconstructions of dorsal CA1 pyramidal neurons of WT (top) and dnSNARE mice (bottom); scale bars 5 100 mm; (b) characterization of the3D structure of apical dendrites by analysis of total dendritic length, number of nodes and endings (t test), and Sholl intersections (n 5 27–34 neurons; 5 mice per group; two-way ANOVA repeated measures, Sidak post hoc tests); (c) density of spines (top) and distribution ofspine types (bottom) at proximal and distal portions of the apical dendrites (n 5 19–25 neurons; 5 mice per group; t test and two-wayANOVA, Fisher’s LSD tests). Data plotted as mean 6 SEM [Color figure can be viewed at wileyonlinelibrary.com]
12 | SARDINHA ET AL.

signaling in theta HIP-PFC synchronization is supported by several
pieces of correlational evidence. Theta desynchronization was observed
in dnSNARE mice that display blocked exocytosis specifically in astro-
cytes. The expression of dnSNARE transgenes that interfere with the
SNARE-complex (Bohmbach, Schwarz, Schoch, & Henneberger, n.d.;
Schubert, Bouvier, and Volterra, 2011) is restricted to astrocytes, as
confirmed by: the bushy morphology of all GFP-labeled structures; the
double immunostainings of the GFP reporter and cellular markers per-
formed repeatedly by us and others (Fellin et al., 2009; Sultan et al.,
2015); and the similarity between electrophysiological power (4–40 Hz)
measured in the dHIP and mPFC of WT and dnSNARE mice discarding
a neuronal compromise. Moreover, this expression of dnSNARE trans-
genes drastically reduced the number of fusion events and release of D-
serine in astrocytes derived from dnSNARE mice (Sultan et al., 2015),
leading to decreased levels of extracellular D-serine in the hippocampus
and cortex of dnSNARE mice (Pankratov & Lalo, 2015; Sultan et al.,
2015). Finally, it is now well documented that astrocytic D-serine is criti-
cal for the function of individual synapses of the hippocampus and
cortex, namely by supporting synaptic plasticity (Fossat et al., 2012;
Henneberger et al., 2010; Takata et al., 2011; Yang et al., 2003).
The role of astrocytes in the modulation of neuronal ensembles is
still poorly understood. The activity produced by synchronized cell
ensembles generates oscillations that may vary in a wide range of fre-
quencies. Neural oscillations are critical for information processing, and
provide the nervous system with a mechanism that allow dynamic cou-
pling within and between brain regions (Buzs�aki, 2004). Theta oscilla-
tions play a pivotal role in the function of the hippocampus and in its
association to cortical regions. They are a result of a concerted work of
both rhythm generators and oscillators in different locations (Buzs�aki,
2002). Cholinergic and GABAergic, as well as the recently described
glutamatergic (Huh, Goutagny, & Williams, 2010) afferents originating
from the medial septum-diagonal band of Broca, provide the main
extrinsic rhythm inputs to support theta oscillations, by modulation of
interneurons, and CA1 and CA3 pyramidal neurons. Input originating
from CA3 and entorhinal cortex add up to the establishment of the
CA1 theta rhythm (Buzs�aki, 2002). In spite of being classically accepted
FIGURE 6 D-serine supplementation restores dorsal hippocampus-prefrontal theta synchronization in dnSNARE mice. (a) Representativeheatmaps of dorsal hippocampus-prefrontal (dHIP–mPFC) spectral coherence for WT (top) and dnSNARE mice (bottom) over time; dashedline indicates the moment of D-serine administration; each spectrogram represents the dHIP–mPFC coherence calculated in intervals of5 min for 4–40 Hz (theta, 4–12 Hz; beta, 12–20 Hz; low gamma, 20–40 Hz); color range: 0, dark blue; 1, red; (b) Representative theta fil-tered LFP traces of mPFC (orange) and dHIP (blue), recorded from dnSNARE mice at baseline or after D-serine administration (scale bars:50 mV, 500 ms); (c–e) evolution of dHIP–mPFC coherence for theta (c), beta (d), and low gamma (e) frequencies in WT and dnSNARE miceover time (left; dashed line: administration of D-serine); values of dHIP–mPFC coherence at baseline (average of three recordings beforeinjection) and after D-serine administration (average of three recordings, 30 min after injection) (right). WT mice are represented in blackand dnSNARE mice in red lines and bars. Data plotted as mean 6 SEM. Two-way ANOVA, Fisher’s LSD tests, *p < .05 from WT; #p < .05from baseline (n 5 6–7 per group) [Color figure can be viewed at wileyonlinelibrary.com]
SARDINHA ET AL. | 13

as oscillators, CA1 pyramidal neurons are also included in an intrinsic
loop circuit, which is able to self-generate theta rhythm (Goutagny,
Jackson, & Williams, 2009). In these septal–entorhinal–hippocampal
circuits, glutamatergic modulation via NMDA receptors appears to
mediate theta oscillations, at least partially. Glutamatergic neurons play
a role in hippocampal theta generation through local modulation of
septal neurons (Robinson et al., 2016). Moreover, the pharmacological
inhibition of NMDA receptors significantly impairs hippocampal theta
oscillations in vivo (Lazarewicz et al., 2009), while the paired activation
of NMDA and GABA receptors are able to generate theta oscillations
in vitro (Kazmierska & Konopacki, 2013). More importantly, the genetic
deletion of NMDA receptors in parvalbumin-positive interneurons
interfered with theta oscillations, decreasing theta-gamma phase lock-
ing, with impact in spatial memory (Korotkova, Fuchs, Ponomarenko,
von Engelhardt, & Monyer, 2010). Finally, a transgenic mouse line lack-
ing the NR1 NMDAR subunit fails to reshape hippocampal theta
rhythms after the switch between place and sequence representations
in a spatial navigation task (Cabral et al., 2014). These studies denote
the importance of NMDA-mediated theta oscillations for behavior per-
formance. Due to their ubiquitous distribution and close apposition of
processes endowed with machinery to send and interpret physiological
signals resulting in modulation of hippocampal NMDA receptors (for
review, Araque et al., 2014; Henneberger et al., 2010), astrocytes are in
a good position to modulate theta oscillations. Despite the lack of liter-
ature in this sub-field, recent suggest that the physiological activation
of astrocytes leads to the release of signals that may add up to hippo-
campal theta. The deletion of GABA B receptors specifically in astro-
cytes leads to a decrease in hippocampal theta oscillations (Perea et al.,
2016). Moreover, septohippocampal cholinergic input to hilar astro-
cytes leads to hilar interneuron activation and consecutive dentate
gyrus inhibition (Pabst et al., 2016), while cholinergic input to CA1
astrocytes leads to release of D-serine and modulation of CA1 pyrami-
dal neuron activation (Papouin et al., 2017).
While the literature provides substantial amount of information on
the generation of hippocampal theta oscillations, the same is not true
for the understanding of synchronization of theta between the hippo-
campus and other brain regions, such as the cortex (Lisman & Jensen,
2013). In our study, dnSNARE mice exhibit lower levels of dHIP–mPFC
theta synchronization, whereas the two regions produce similar
amounts of theta oscillations of WT controls. Since coherence meas-
ures the synchrony of both phase and amplitude of the signals, one
might speculate that astrocyte modulation of NMDA receptors might
have a role on the phase component of the theta produced, which
could be synchronized by supplementing D-serine. Further experiments
are needed to specifically address this issue. Together, these correla-
tional evidences support the hypothesis that D-serine released by
astrocytes modulates specifically basal theta synchronization, that may
entrain unit or ensemble firing in anatomically connected cortical areas
(Anderson et al., 2009; Benchenane et al., 2010; Hoffmann et al., 2015;
Jones & Wilson, 2005; O’Neill et al., 2013; Siapas et al., 2005; Yang
FIGURE 7 D-serine supplementation rescues the cognitive deficits observed in dnSNARE mice. (a–c) Reference memory rescue in theMWM (n 5 6–9 per group); (a) Representative heatmaps of cumulative trajectories at day 4 of WT (black pool) and dnSNARE mice (redpool) under saline (top) and D-serine administration (bottom); (b) escape latencies (top) and distances swam (bottom) to reach the hiddenplatform after administration of saline (line) or D-serine (dashed line; two-way ANOVA repeated measures, Sidak post hoc tests); (c) failuresto reach the platform (top) and the percentage of directed strategies used to find the platform (bottom), after administration of saline orD-serine (two-way ANOVA, Fisher’s LSD tests); (d–e) Long-term memory rescue in NOR (n 5 6–8 per group); (d) representative heatmapsof cumulative exploration of a familiar (square) and novel (circle) objects in the long-term memory task, for WT (black arenas) and dnSNAREmice (red arenas), after saline (top) or D-serine administration (bottom); (e) percentages of exploration time of novel object by WT anddnSNARE, after saline or D-serine administration (two-way ANOVA, Fisher’s LSD tests). WT mice are represented in black and dnSNAREmice in red lines and bars. Data plotted as mean 6 SEM. *p < .05, **p < .01, ***p < .001 [Color figure can be viewed at wileyonlinelibrary.com]
14 | SARDINHA ET AL.
et al., 2003). Nevertheless, due to the lack of literature and causal
observations that support this hypothesis, further work is needed to
address these open questions: (1) Does astrocyte signaling modulate
simultaneously several ensembles of the septal–entorhinal–hippocam-
pal circuit, i.e., is there a spatial modulation of the theta generation or
its phase? (2) Since the administration of D-serine reaches virtually both
hippocampus and prefrontal cortex indiscriminately, does HIP–PFC
synchrony require simultaneous modulation in the two regions? or
Does this modulation occurs in the hippocampus and from there it
entrains the prefrontal cortex? (3) Since this basal HIP–PFC theta syn-
chrony is continuously present in WT mice, does this astrocytic modu-
lation result from a tonic release of signals that maintain it over time?
How tight is the relationship between surrounding activity and exocy-
totic release of signals (Vardjan, Parpura, & Zorec, 2016)?
The cognitive deficits observed in dnSNARE mice are likely a con-
sequence of the loss of HIP–PFC synchrony, as D-serine supplementa-
tion also restored behavioral function in dnSNARE mice. However, and
despite the specificity of basal desynchronization for theta frequency
range in this link, we should not exclude the possibility that the hippo-
campus may be desynchronized with other brain regions, which could
help to explain the cognitive deficits observed. Nevertheless, the basal
hippocampus–prefrontal desynchronization shall be responsible for a
large extent of this effect. The dorsal hippocampus is connected to pre-
frontal cortex indirectly. The loop closes by a multi-synaptic circuit,
being the prefrontal cortex connected to the hippocampus also indi-
rectly (Preston & Eichenbaum, 2013). Within this circuit, the dorsal hip-
pocampus performs primarily cognitive functions, while the ventral
relates to emotional behavior (Fanselow & Dong, 2010). Moreover,
synchrony between oscillations of hippocampal dorsal or ventral subre-
gions, and PFC has been related respectively to cognitive (O’Neill et al.,
2013) and emotional behavior (Adhikari, Topiwala, & Gordon, 2010;
Kafetzopoulos et al., 2017; Mateus-Pinheiro et al., 2016; Oliveira et al.,
2013). Specifically, and despite the indirect connections, O’Neill and
colleagues demonstrated that dHIP theta oscillations are synchronized
with theta oscillations in the mPFC, and that theta synchrony is critical
for a spatial memory task. Interestingly, both single units and ensembles
in the prefrontal cortex appear to entrain with the theta rhythm from
the dorsal hippocampus. On the one hand, this type of memory task
was previously shown to be dependent on the synchronization of theta
oscillations between the hippocampus and prefrontal cortex (Benche-
nane et al., 2010; Jones & Wilson, 2005; Siapas et al., 2005). Our data
shows now that the poor consolidation of reference memory directly
correlates with lower levels of basal theta coherence presented by a
given dnSNARE mouse, which is in accordance with previous reports
showing that the pathological decrease of theta coherence triggered
this cognitive deficit (Gordon, 2011; Oliveira et al., 2013). On the other
hand, the higher expression of dnSNARE transgenes in the hippocam-
pus strongly correlates with a worse cognitive performance in double-
transgenic mice, suggesting that those impairments are due to the lack
of astrocyte-derived exocytosis. It is noteworthy, that this variability of
genetic modulation may explain negative results in studies in which
mice displaying variable levels of transgene expression or genomic
recombination were analyzed as a single group (Oliveira et al., 2015).
In conclusion, our results provide the first evidence of a mecha-
nism by which D-serine mediated astrocytic signaling is required for
entrainment of distant corticolimbic circuits, being mandatory for cog-
nitive performance.
ACKNOWLEDGMENT
The authors are grateful to Prof. Philip Haydon for sharing the mice
lines and for the valuable comments on this manuscript. We also
acknowledge the technical support of Goreti Pinto, and the help of
Ana Lima, Ana Filipa Oliveira and Anabela Fernandes on colony
implementation and management. The authors acknowledge funding
from national funds through Foundation for Science and Technology
(FCT) project (PTDC/SAU-NSC/118194/2010) to V.M.S., S.G.G., G.
T., M.M., J.S.R., J.S.C., J.F.O. and fellowships (SFRH/BD/89714/
2012 to V.M.S., SFRH/BPD/97281/2013 to J.F.O., SFRH/BD/
101298/2014 to S.G.G., IF/00328/2015 to JFO, IF/01079/2014 to
LP); Marie Curie Fellowship FP7-PEOPLE-2010-IEF 273936 and
BIAL Foundation Grants 207/14 to J.F.O. and 427/14 to LP; North-
ern Portugal Regional Operational Programme (NORTE 2020), under
the Portugal 2020 Partnership Agreement, through the European
Regional Development Fund (FEDER)(NORTE-01-0145-FEDER-
000013); FEDER funds, through the Competitiveness Factors Opera-
tional Programme (COMPETE), and National funds, through the FCT
(POCI-01-0145-FEDER-007038).
CONFLICTS OF INTEREST
The authors declare no competing financial interests.
ORCID
Jo~ao Filipe Oliveira http://orcid.org/0000-0002-1005-2328
REFERENCES
Adhikari, A., Topiwala, M. A., & Gordon, J. A. (2010). Synchronized activ-
ity between the ventral hippocampus and the medial prefrontal cor-
tex during anxiety. Neuron, 65, 257–269.
Anderson, K. L., Rajagovindan, R., Ghacibeh, G. A., Meador, K. J., & Ding,
M. (2009). Theta oscillations mediate interaction between prefrontal
cortex and medial temporal lobe in human memory. Cerebral Cortex,
20, 1604–1612.
Araque, A., Carmignoto, G., Haydon, P. G., Oliet, S. H. R., Robitaille, R., &
Volterra, A. (2014). Gliotransmitters travel in time and space. Neuron,
81, 728–739.
Bail, M. L., Martineau, M., Sacchi, S., Yatsenko, N., Radzishevsky, I., Conrod,
S., . . . Mothet, J.-P. (2015). Identity of the NMDA receptor coagonist is
synapse specific and developmentally regulated in the hippocampus.
Proceedings of the National Academy of Sciences, 112, E204–E213.
Balu, D. T., & Coyle, J. T. (2012). Neuronal d-serine regulates dendritic
architecture in the somatosensory cortex. Neuroscience Letters, 517,
77–81.
Benchenane, K., Peyrache, A., Khamassi, M., Tierney, P. L., Gioanni, Y.,
Battaglia, F. P., & Wiener, S. I. (2010). Coherent theta oscillations and
reorganization of spike timing in the hippocampal–prefrontal network
upon learning. Neuron, 66, 921–936.
SARDINHA ET AL. | 15

Bohmbach, K., Schwarz, M. K., Schoch, S., & Henneberger, C. (2017).
The structural and functional evidence for vesicular release from
astrocytes in situ. Brain Research Bulletin. doi:10.1016/j.
brainresbull.2017.01.015
Buzs�aki, G. (2002). Theta oscillations in the hippocampus. Neuron, 33,
325–340.
Buzs�aki, G. (2004). Large-scale recording of neuronal ensembles. Nature
Neurosciences, 7, 446–451.
Cabral, H. O., Vinck, M., Fouquet, C., Pennartz, C. M. A., Rondi-Reig, L.,
& Battaglia, F. P. (2014). Oscillatory dynamics and place field maps
reflect hippocampal ensemble processing of sequence and place
memory under NMDA receptor control. Neuron, 81, 402–415.
Cao, X., Li, L.-P., Wang, Q., Wu, Q., Hu, H.-H., Zhang, M., . . . Gao, T.-M.
(2013). Astrocyte-derived ATP modulates depressive-like behaviors.
Nature Medicine, 19, 773–777.
Castilla-Ortega, E., S�anchez-L�opez, J., Hoyo-Becerra, C., Matas-Rico, E.,
Zambrana-Infantes, E., Chun, J., . . . Santin, L. J. (2010). Exploratory,
anxiety and spatial memory impairments are dissociated in mice lack-
ing the LPA1 receptor. Neurobiology of Learning & Memory, 94, 73–82.
Clarke, L. E., & Barres, B. A. (2013). Emerging roles of astrocytes in neu-
ral circuit development. Nature Reviews: Neuroscience, 14, 311–321.
Costa-Aze, V. D. S., Quiedeville, A., Boulouard, M., & Dauphin, F. (2012).
5-HT6 receptor blockade differentially affects scopolamine-induced
deficits of working memory, recognition memory and aversive learn-
ing in mice. Psychopharmacology, 222, 99–115.
Deng, Q., Terunuma, M., Fellin, T., Moss, S. J., & Haydon, P. G. (2011).
Astrocytic activation of A1 receptors regulates the surface expression
of NMDA receptors through a Src kinase dependent pathway. Glia,
59, 1084–1093.
Fanselow, M. S., & Dong, H.-W. (2010). Are the dorsal and ventral hip-
pocampus functionally distinct structures? Neuron, 65, 7–19.
Fellin, T., Halassa, M. M., Terunuma, M., Succol, F., Takano, H., Frank,
M., . . . Haydon, P. G. (2009). Endogenous nonneuronal modulators of
synaptic transmission control cortical slow oscillations in vivo. Pro-
ceedings of the National Academy of Sciences of the United States of
America, 106, 15037–15042.
Florian, C., Vecsey, C. G., Halassa, M. M., Haydon, P. G., & Abel, T.
(2011). Astrocyte-derived adenosine and A1 receptor activity contrib-
ute to sleep loss-induced deficits in hippocampal synaptic plasticity
and memory in mice. The Journal of Neuroscience, 31, 6956–6962.
Fossat, P., Turpin, F. R., Sacchi, S., Dulong, J., Shi, T., Rivet, J.-M., . . .
Mothet, J.-P. (2012). Glial d-serine gates NMDA receptors at excita-
tory synapses in prefrontal cortex. Cerebral Cortex, 22, 595–606.
Fujita, T., Chen, M. J., Li, B., Smith, N. A., Peng, W., Sun, W., . . . Neder-
gaard, M. (2014). Neuronal transgene expression in dominant-
negative SNARE mice. Journal of Neuroscience, 34, 16594–16604.
Gordon, J. A. (2011). Oscillations and hippocampal–prefrontal synchrony.Current Opinion in Neurobiology, 21, 486–491.
Goutagny, R., Jackson, J., & Williams, S. (2009). Self-generated theta
oscillations in the hippocampus. Nature Neuroscience, 12, 1491–1493.
Graziano, A., Petrosini, L., & Bartoletti, A. (2003). Automatic recognition
of explorative strategies in the Morris water maze. Journal of Neuro-
science Methods, 130, 33–44.
Guercio, G. D., Bevictori, L., Vargas-Lopes, C., Madeira, C., Oliveira, A.,
Carvalho, V. F., . . . Panizzutti, R. (2014). d-Serine prevents cognitive
deficits induced by acute stress. Neuropharmacology, 86, 1–8.
Halassa, M. M., Florian, C., Fellin, T., Munoz, J. R., Lee, S.-Y., Abel, T., . . .
Frank, M. G. (2009). Astrocytic modulation of sleep homeostasis and
cognitive consequences of sleep loss. Neuron, 61, 213–219.
Han, H., Peng, Y., & Dong, Z. (2015). d-Serine rescues the deficits of hippo-
campal long-term potentiation and learning and memory induced by
sodium fluoroacetate. Pharmacology Biochemistry & Behavior, 133, 51–56.
Haydon, P. G., & Nedergaard, M. (2015). How do astrocytes participate
in neural plasticity? Cold Spring Harbor Perspectives in Biology, 7,
a020438.
Henneberger, C., Papouin, T., Oliet, S. H. R., & Rusakov, D. A. (2010).
Long-term potentiation depends on release of d-serine from astro-
cytes. Nature, 463, 232–236.
Hoffmann, L. C., Cicchese, J. J., & Berry, S. D. (2015). Harnessing the
power of theta: Natural manipulations of cognitive performance dur-
ing hippocampal theta-contingent eyeblink conditioning. Frontiers in
Systems Neuroscience, 9. doi:10.3389/fnsys.2015.00050
Huh, C. Y. L., Goutagny, R., & Williams, S. (2010). Glutamatergic neurons
of the mouse medial septum and diagonal band of Broca synaptically
drive hippocampal pyramidal cells: Relevance for hippocampal theta
rhythm. Journal of Neuroscience, 30, 15951–15961.
Jones, M. W., & Wilson, M. A. (2005). Theta rhythms coordinate hippo-
campal–prefrontal interactions in a spatial memory task. PLoS Biology,
3, e402.
Kafetzopoulos, V., Kokras, N., Sotiropoulos, I., Oliveira, J. F., Leite-
Almeida, H., Vasalou, A., . . . Dalla, C. (2017). The nucleus reuniens: A
key node in the neurocircuitry of stress and depression. Molecular
Psychiatry. https://doi.org/10.1038/mp.2017.55
Kang, N., Peng, H., Yu, Y., Stanton, P. K., Guilarte, T. R., & Kang, J.
(2013). Astrocytes release d-serine by a large vesicle. Neuroscience,
240, 243–257.
Kazmierska, P., & Konopacki, J. (2013). Development of NMDA-induced
theta rhythm in hippocampal formation slices. Brain Research Bulletin,
98, 93–101.
Khakh, B. S., & Sofroniew, M. V. (2015). Diversity of astrocyte functions
and phenotypes in neural circuits. Nature Neuroscience, 18, 942–952.
Korotkova, T., Fuchs, E. C., Ponomarenko, A., von Engelhardt, J., & Mon-
yer, H. (2010). NMDa receptor ablation on parvalbumin-positive
interneurons impairs hippocampal synchrony, spatial representations,
and working memory. Neuron, 68, 557–569.
Lazarewicz, M. T., Ehrlichman, R. S., Maxwell, C. R., Gandal, M. J., Finkel,
L. H., & Siegel, S. J. (2009). Ketamine modulates theta and gamma
oscillations. Journal of Cognitive Neuroscience, 22, 1452–1464.
Lee, H. S., Ghetti, A., Pinto-Duarte, A., Wang, X., Dziewczapolski, G.,
Galimi, F., . . . Heinemann, S. F. (2014). Astrocytes contribute to
gamma oscillations and recognition memory. Proceedings of the
National Academy of Sciences, 111, E3343–E3352.
Leger, M., Quiedeville, A., Bouet, V., Haelewyn, B., Boulouard, M., Schu-
mann-Bard, P., & Freret, T. (2013). Object recognition test in mice.
Nature Protocols, 8, 2531–2537.
Lima, A., Sardinha, V. M., Oliveira, A. F., Reis, M., Mota, C., Silva, M. A., . . .
Oliveira, J. F. (2014). Astrocyte pathology in the prefrontal cortex impairs
the cognitive function of rats. Molecular Psychiatry, 19, 834–841.
Lisman, J. E., & Jensen, O. (2013). The theta-gamma neural code. Neuron,
77, 1002–1016.
Martineau, M., Galli, T., Baux, G., & Mothet, J.-P. (2008). Confocal imag-
ing and tracking of the exocytotic routes for d-serine-mediated glio-
transmission. Glia, 56, 1271–1284.
Martineau, M., Shi, T., Puyal, J., Knolhoff, A. M., Dulong, J., Gasnier, B.,
. . . Mothet, J.-P. (2013). Storage and uptake of d-serine into astro-
cytic synaptic-like vesicles specify gliotransmission. The Journal of
Neuroscience, 33, 3413–3423.
Mateus-Pinheiro, A., Alves, N. D., Patrício, P., Machado-Santos, A. R.,
Loureiro-Campos, E., Silva, J. M., . . . Pinto, L. (2016). AP2g controls
16 | SARDINHA ET AL.

adult hippocampal neurogenesis and modulates cognitive, but not
anxiety or depressive-like behavior. Molecular Psychiatry. https://doi.
org/10.1038/mp.2016.169
Miller, R. F. (2004). d-serine as a glial modulator of nerve cells. Glia, 47,
275–283.
Mitra, P. P., & Pesaran, B. (1999). Analysis of dynamic brain imaging
data. Biophysical Journal, 76, 691–708.
Nakashiba, T., Young, J. Z., McHugh, T. J., Buhl, D. L., & Tonegawa, S.
(2008). Transgenic inhibition of synaptic transmission reveals role of
CA3 output in hippocampal learning. Science (New York, NY), 319,
1260–1264.
Oliet, S. H. R., & Mothet, J.-P. (2006). Molecular determinants of d-
serine-mediated gliotransmission: From release to function. Glia, 54,
726–737.
Oliveira, J. F., Dias, N. S., Jacinto, L. R., Cerqueira, J. J., & Sousa, N.
(2013). Chronic stress disrupts neural coherence between cortico-
limbic structures. Frontiers in Neural Circuits, 7, 10.
Oliveira, J. F., Sardinha, V. M., Guerra-Gomes, S., Araque, A., & Sousa, N.
(2015). Do stars govern our actions? Astrocyte involvement in rodent
behavior. Trends in Neurosciences, 38, 535–549.
O’Neill, P.-K., Gordon, J. A., & Sigurdsson, T. (2013). Theta oscillations in
the medial prefrontal cortex are modulated by spatial working mem-
ory and synchronize with the hippocampus through its ventral subre-
gion. Journal of Neuroscience, 33, 14211–14224.
Pabst, M., Braganza, O., Dannenberg, H., Hu, W., Pothmann, L., Rosen,
J., . . . Beck, H. (2016). Astrocyte intermediaries of septal cholinergic
modulation in the hippocampus. Neuron, 90, 853–865.
Pankratov, Y., & Lalo, U. (2015). Role for astroglial a1-adrenoreceptors
in gliotransmission and control of synaptic plasticity in the neocortex.
Frontiers in Cellular Neuroscience, 9. https://doi.org/10.3389/fncel.
2015.00230
Pannasch, U., Freche, D., Dall�erac, G., Gh�ezali, G., Escartin, C., Ezan, P.,
. . . Rouach, N. (2014). Connexin 30 sets synaptic strength by control-
ling astroglial synapse invasion. Nature Neuroscience, 17, 549–558.
Papouin, T., Dunphy, J. M., Tolman, M., Dineley, K. T., & Haydon, P. G.
(2017). Septal cholinergic neuromodulation tunes the astrocyte-
dependent gating of hippocampal NMDA receptors to wakefulness.
Neuron, 94, 840–854.e7.
Papouin, T., Henneberger, C., Rusakov, D. A., & Oliet, S. H. R. (2017).
Astroglial versus neuronal d-serine: Fact checking. Trends in Neuro-
sciences. https://doi.org/10.1016/j.tins.2017.05.007[]
Pascual, O., Casper, K. B., Kubera, C., Zhang, J., Revilla-Sanchez, R., Sul,
J.-Y., . . . Haydon, P. G. (2005). Astrocytic purinergic signaling coordi-
nates synaptic networks. Science (New York, NY), 310, 113–116.
Paxinos, G., & Franklin, K. B. J. (2001). The mouse brain in stereotaxic
coordinates (2nd ed.). San Diego: Academic Press.
Perea, G., G�omez, R., Mederos, S., Covelo, A., Ballesteros, J. J., Schlosser,
L., . . . Araque, A. (2016). Activity-dependent switch of GABAergic
inhibition into glutamatergic excitation in astrocyte–neuron networks.
ELife, 5, e20362.
Perea, G., Sur, M., & Araque, A. (2014). Neuron–glia networks: Integral
gear of brain function. Frontiers in Cellular Neuroscience, 8, 378.
Petrelli, F., & Bezzi, P. (2016). Novel insights into gliotransmitters. Cur-
rent Opinion in Pharmacology, 26, 138–145.
Poskanzer, K. E., & Yuste, R. (2016). Astrocytes regulate cortical state
switching in vivo. Proceedings of the National Academy of Sciences,
113, E2675–E2684.
Preston, A. R., & Eichenbaum, H. (2013). Interplay of hippocampus and
prefrontal cortex in memory. Current Biology, 23, R764–R773.
Robinson, J., Manseau, F., Ducharme, G., Amilhon, B., Vigneault, E., Mes-
tikawy, S. E., & Williams, S. (2016). Optogenetic activation of septal
glutamatergic neurons drive hippocampal theta rhythms. Journal of
Neuroscience, 36, 3016–3023.
Rosenberg, D., Artoul, S., Segal, A. C., Kolodney, G., Radzishevsky, I.,
Dikopoltsev, E., . . . Wolosker, H. (2013). Neuronal d-serine and gly-
cine release via the Asc-1 transporter regulates NMDA receptor-
dependent synaptic activity. Journal of Neuroscience, 33, 3533–3544.
Rusakov, D. A. (2015). Disentangling calcium-driven astrocyte physiology.
Nature Reviews Neuroscience, 16, 226–233.
Schubert, V., Bouvier, D., & Volterra, A. (2011). SNARE protein expres-
sion in synaptic terminals and astrocytes in the adult hippocampus: A
comparative analysis. Glia, 59, 1472–1488.
Siapas, A. G., Lubenov, E. V., & Wilson, M. A. (2005). Prefrontal phase
locking to hippocampal theta oscillations. Neuron, 46, 141–151.
Sigurdsson, T., Stark, K. L., Karayiorgou, M., Gogos, J. A., & Gordon, J. A.
(2010). Impaired hippocampal–prefrontal synchrony in a genetic
mouse model of schizophrenia. Nature, 464, 763–767.
Sultan, S., Li, L., Moss, J., Petrelli, F., Cass�e, F., Gebara, E., . . . Toni, N.
(2015). Synaptic integration of adult-born hippocampal neurons is
locally controlled by astrocytes. Neuron, 88, 957–972.
Takata, N., Mishima, T., Hisatsune, C., Nagai, T., Ebisui, E., Mikoshiba, K.,
& Hirase, H. (2011). Astrocyte calcium signaling transforms choliner-
gic modulation to cortical plasticity in vivo. The Journal of Neuro-
science, 31, 18155–18165.
Vardjan, N., Parpura, V., & Zorec, R. (2016). Loose excitation–secretioncoupling in astrocytes. Glia, 64, 655–667.
Verkhratsky, A., Matteoli, M., Parpura, V., Mothet, J.-P., & Zorec, R. (2016).
Astrocytes as secretory cells of the central nervous system: Idiosyncra-
sies of vesicular secretion. The EMBO Journal. 35, 239–257.
Volterra, A., Liaudet, N., & Savtchouk, I. (2014). Astrocyte Ca21 signalling:
An unexpected complexity. Nature Reviews Neuroscience, 15, 327–335.
Wagner, L., Pannicke, T., Rupprecht, V., Frommherz, I., Volz, C., Illes, P.,
. . . Grosche, A. (2017). Suppression of SNARE-dependent exocytosis
in retinal glial cells and its effect on ischemia-induced neurodegener-
ation. Glia, 65, 1059–1071.
Yang, Y., Ge, W., Chen, Y., Zhang, Z., Shen, W., Wu, C., . . . Duan, S.
(2003). Contribution of astrocytes to hippocampal long-term poten-
tiation through release of d-serine. Proceedings of the National Acad-
emy of Sciences, 100, 15194–15199.
Zhan, Y. (2015). Theta frequency prefrontal–hippocampal driving rela-
tionship during free exploration in mice. Neuroscience, 300, 554–565.
Zhang, Q., Pangr�sič, T., Kreft, M., Kr�zan, M., Li, N., Sul, J.-Y., . . . Haydon,
P. G. (2004). Fusion-related release of glutamate from astrocytes.
Journal of Biological Chemistry, 279, 12724–12733.
SUPPORTING INFORMATION
Additional Supporting Information may be found online in the sup-
porting information tab for this article.
How to cite this article: Sardinha VM, Guerra-Gomes S, Cae-
tano I, et al. Astrocytic signaling supports hippocampal–prefron-
tal theta synchronization and cognitive function. Glia.
2017;00:1–17. https://doi.org/10.1002/glia.23205
SARDINHA ET AL. | 17