assr ss ac - eastspring.com · and as at 30 june 2019. past performance of the fund is not...
TRANSCRIPT

aClient Services : 03-2778 1000
Annual Report
FOR THE FINANCIAL YEAR ENDED 30 JUNE 2019
ANNUAL REPORT
EASTSPRING INVESTMENTSDYNAMIC FUND
Eastspring Investments Berhad (531241-U)
Level 22, Menara Prudential, Persiaran TRX Barat55188 Tun Razak Exchange, Kuala LumpurT: (603) 2778 3888 F: (603) 2789 7220eastspring.com/my
Client ServicesT: (603) 2778 1000 F: (603) 2789 [email protected]
Dear Valued Investor,
Greetings from Eastspring Investments Berhad!
First and foremost, we would like to take this opportunity to thank you for choosing to invest with Eastspring Investments Berhad.
We are pleased to enclose a copy of the Annual/Interim/Quarterly Fund Reports of Eastspring Investments Berhad’s fund(s) for the reporting period ended 30 June 2019.
You may also download these reports from our website at www.eastspring.com/my
Should you require any assistance, please do not hesitate to contact our Client Services at 03-2778 1000.
Yours sincerely,
Raymond Tang Chee Kin Non-Independent, Executive Director and Chief Executive Officer

Fund Information 1
Key Performance Data 3
Manager’s Report 6
Market Review 10
Rebates and Soft Commissions 14
Statement by the Manager 16
Trustee’s Report to the Unit Holders of
Eastspring Investments Dynamic Fund 17
Independent Auditors’ Report to the Unit Holders of
Eastspring Investments Dynamic Fund 18
Statement of Comprehensive Income 22
Statement of Financial Position 23
Statement of Changes in Equity 24
Statement of Cash Flows 25
Summary of Significant Accounting Policies 26
Notes to the Financial Statements 37
Corporate Directory 77
TABLE OF CONTENTS

FUND INFORMATION
Name of Fund Eastspring Investments Dynamic Fund (the “Fund“)
Fund Category/ Type
Mixed asset/growth
Fund Objective The Fund seeks to provide investors with capital appreciation by actively investing in equity and equity-related securities. For defensive consideration, the Fund may invest in debentures and money market instruments.
Note: The Fund’s focus is on growth.
ANY MATERIAL CHANGES TO THE FUND’S OBJECTIVE WOULD REQUIRE UNIT HOLDERS’ APPROVAL.
Performance Benchmark
(a) If 100% of the Fund’s NAV invested in equities and equity-related securities:FTSE Bursa Malaysia 100 Index (“FBM100”)
(b) If 100% of the Fund’s NAV invested in debentures and liquid assets:Maybank 12-month fixed deposit rate
(c) If invested in a mix of equities and equity-related securities, debentures and liquid assets:50% FBM100 + 50% Maybank 12-month fixed deposit rate
The composite benchmark index is a reflection of the Fund’s average asset allocation over the long-term of 50% of the Fund’s NAV in equities and equity-related securities, and 50% of the Fund’s NAV in debentures and liquid assets.
Source: FBM100 (www.bursamalaysia.com) Maybank 12-month fixed deposit rate (www.maybank2u.com.my)
The performance of the Fund against the benchmark is published in the Manager’s monthly factsheet and is available from the Manager’s website at www.eastspring.com/my
Note: The risk profile of the Fund is different from the risk profile of the performance benchmark.
1Client Services : 03-2778 1000
Annual Report

FUND INFORMATION (CONTINUED)
Fund Income Distribution Policy
At least once a year, subject to the availability of income.
Breakdown of Unit Holdings by Size
As at 30 June 2019, the size of Eastspring Investments Dynamic Fund stood at 62.283 million units.
Fund Size
Breakdown of Unit Holdings
Unit Holdings
No. of Unit
Holders %
No. of Units* (‘000) %
5,000 units and below 748 26.75 1,910 3.07
5,001 to 10,000 units 669 23.93 4,693 7.54
10,001 to 50,000 units 1,172 41.92 25,318 40.65
50,001 to 500,000 units 201 7.19 18,822 30.21
500,001 units and above 6 0.21 11,539 18.53
Total 2,796 100.00 62,282 100.00
* excludes units held by the Manager.
Un
its
(Mill
ion
)
Jul2018
Aug2018
Sep2018
Oct2018
Nov2018
Dec2018
Jan2019
May2019
Jun2019
Feb2019
Mar2019
Apr2019
100
80
60
40
20
0
Client Services : 03-2778 10002
Eastspring Investments Dynamic Fund

Category 30.6.2019 30.6.2018 30.6.2017
(%) (%) (%)
Quoted securities
Construction - 2.23 4.70 Consumer - 0.67 1.47 Consumer Products & Services/Consumer Product 17.65 - - Energy 1.40 - - Financial Services/Finance 24.43 21.42 2.53 Health Care 7.85 7.18 18.44 Industrial Products & Services/Industrial Product 2.46 0.45 3.00 Infrastructure Project Company - 2.17 - Manufacturing - 0.44 1.47 Plantation 3.26 - - Property 0.52 1.57 12.52 REITS 2.60 1.03 1.56 Technology 2.95 10.95 18.62 Telecommunications & Media/ Telecommunication 5.70 - -Trading/Services - 24.87 22.87 Transportation & Logistics 1.08 - -Utilities 6.85 - -
76.75 72.98 87.18Unquoted fixed income securities 9.60 10.02 1.88 Cash and other assets 13.65 17.00 10.94 Total 100.00 100.00 100.00
KEY PERFORMANCE DATAFOR THE FINANCIAL YEAR ENDED
3Client Services : 03-2778 1000
Annual Report

Category 30.6.2019 30.6.2018 30.6.2017
Net Asset Value (NAV) (RM'000) 55,084 71,225 54,007 Units In Circulation (Units '000) 62,283 78,256 53,943 Net Asset Value Per Unit (RM) 0.8844 0.9102 1.0012 Highest Net Asset Value Per Unit (RM)# 0.8868 0.9102 1.0050 Lowest Net Asset Value Per Unit (RM)# 0.8783 0.8989 1.0004 Total Return (%) - Capital Growth (2.83) (9.09) 9.64 - Income Distribution 4.58 4.85 4.85 Total Return (%) 1.61 (4.68) 14.95 Gross Distribution Per Unit (RM) 0.0402 0.0439 0.0485 Net Distribution Per Unit (RM) 0.0402 0.0409 0.0454 Management Expense Ratio (MER) (%)* 1.38 1.45 1.44 Portfolio Turnover Ratio (PTR) (times)^ 0.57 0.81 0.38
KEY PERFORMANCE DATA (CONTINUED)
# Figure shown as ex-distribution.
* There were no significant changes to the MER during the period under review.
^ There were no significant changes to the PTR during the period under review.
Client Services : 03-2778 10004
Eastspring Investments Dynamic Fund
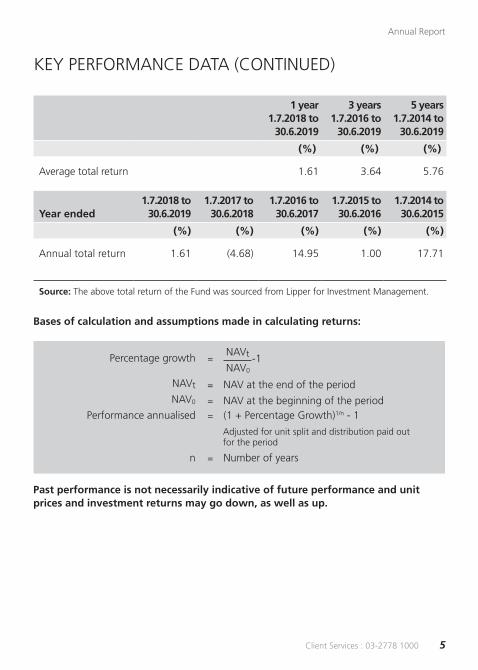
KEY PERFORMANCE DATA (CONTINUED)
1 year1.7.2018 to
30.6.2019
3 years1.7.2016 to
30.6.2019
5 years1.7.2014 to
30.6.2019
(%) (%) (%)
Average total return 1.61 3.64 5.76
Year ended1.7.2018 to
30.6.20191.7.2017 to
30.6.20181.7.2016 to
30.6.20171.7.2015 to
30.6.20161.7.2014 to
30.6.2015
(%) (%) (%) (%) (%)
Annual total return 1.61 (4.68) 14.95 1.00 17.71
Source: The above total return of the Fund was sourced from Lipper for Investment Management.
Bases of calculation and assumptions made in calculating returns:
Percentage growth =
NAVt = NAV at the end of the period
NAV0 = NAV at the beginning of the period Performance annualised = (1 + Percentage Growth)1/n - 1
Adjusted for unit split and distribution paid out for the period
n = Number of years
Past performance is not necessarily indicative of future performance and unit prices and investment returns may go down, as well as up.
NAVt -1NAV0
5Client Services : 03-2778 1000
Annual Report

MANAGER’S REPORT
Fund Performance Over the 5-year period, the Fund recorded a return of 32.36%, outperforming the benchmark return of 4.23% by 28.13%.
During the period under review, the Fund registered a return of 1.61%, outperforming the benchmark return of 1.20% by 0.41%.
The Fund outperformance was attributed to sector exposure and stock selection. Holdings in REITs, telco, consumer discretionary and industrials were positive contributors to performance.
The Fund has met its investment objective to provide investors with capital appreciation by having investments principally composed of equities and fixed income instruments.
The performance is calculated on NAV-to-NAV basis with gross income or dividend reinvested.
Eastspring Investments Dynamic Fund Benchmark
Eastspring Investments Dynamic Fund- 5 Years Return Vs Benchmark
5 ye
ars
% C
han
ge
-10%
0%
10%
20%
30%
40%
50%
60%
-10%
0%
10%
20%
30%
40%
50%
60%
Jun2014
Oct2014
Jan2015
Apr2015
Jul2015
Oct2015
Jan2016
May2016
Aug2016
Nov2016
Feb2017
May2017
Aug2017
Nov2017
Mar2018
Jun2018
Sep2018
Dec2018
Mar2019
Jun2019
Client Services : 03-2778 10006
Eastspring Investments Dynamic Fund

Fund Performance(continued)
Benchmark:a) If 100% of the Fund’s NAV invested in equities and equity-
related securities:FTSE Bursa Malaysia 100 Index (“FBM100”)
b) If 100% of the Fund’s NAV invested in debentures and liquid assets:
Maybank 12-month fixed deposit rate
c) If invested in a mix of equities and equity-related securities, debentures and liquid assets:
50% FBM100 + 50% Maybank 12-month fixed deposit rate
Source: Lipper for Investment Management,www.bursamalaysia.com and www.maybank2u.com.my as at30 June 2019.
Past performance of the Fund is not necessarily indicativeof its future performance.
Analysis of Fund Performance
For the financial year ended 30 June 2019:
Income Return
Capital Return*
Total Return
Total Return of Benchmark
(%) (%) (%) (%)
4.58 (2.83) 1.61 1.20
* Capital return components (NAV per unit to NAV per unit).
MANAGER’S REPORT (CONTINUED)
7Client Services : 03-2778 1000
Annual Report

Distribution/ Unit Split
Investment Strategy During the Period Under Review
Equity StrategyThe Fund remained invested in stocks that possess long term growth prospect, attractive valuation and strong in fundamental. We were positive and invested in selective export-related stocks that stand to benefit from Malaysia cost-competitive and supply chain i.e. gloves, OSAT and EMS. The Fund also invested in cyclical blue-chip that suffered from de-rating due to concern on policy risks and industry headwinds. In the meantime, attractively price dividend stocks (REITs, utilities) with sustainable business model and positive industry outlook continue to provide stability and defensiveness for the Fund.
Bond StrategyThe Fund participated in selected quality bond issuances for yield pick-up and traded on market volatility, subject to liquidity constraints.
MANAGER’S REPORT (CONTINUED)
Ex-date 19-Jun-19
Distribution Per Unit (RM)
Gross 0.0402
Net 0.0402
Impact on NAV arising from distribution for the financial year ended 30 June 2019.
Ex-Date 19-Jun-19
(RM per Unit)
Net Asset Value before distribution 0.9185
Less: distribution (0.0402)
Net Asset Value after distribution 0.8783
No unit split were declared for the financial year ended 30 June 2019.
Client Services : 03-2778 10008
Eastspring Investments Dynamic Fund

Asset Allocation
Asset Allocation30-Jun
201930-Jun
2018 Changes
(%) (%) (%)
Quoted securities 76.75 72.98 3.77 Unquoted fixed income securities 9.60 10.02 (0.42)Cash and other assets 13.65 17.00 (3.35)
Asset Allocation as at 30 June 2019
There were no significant changes in asset allocation of the Fund for the period under review.
State of Affairs ofthe Fund
There have been neither significant change to the state of affairs of the Fund nor any circumstances that materially affect any interests of the unit holders during the period under review.
Quotedsecurities 76.75%
Unquoted fixedincome securities
9.60%
MANAGER’S REPORT (CONTINUED)
Cash and otherassets
13.65%
9Client Services : 03-2778 1000
Annual Report

MARKET REVIEW
Equity
3Q2018 has been a good quarter for the Malaysian equity market with most indices registering positive gains, recovering in tandem with emerging markets and investors looking to bottom fish. Asia Pacific equity markets reported weaker gains as the Korean and Chinese markets were impacted by fears in relation to the US-China trade tensions, slower growth in China and yuan depreciation. Investor sentiment was weighed down by the escalation of trade tensions, and emerging markets were also rattled by fears of twin deficits and potential contagion effects from sharp currency depreciation as experienced by countries such as Turkey and Argentina. Towards the end of the 3Q2018, equity markets in Malaysia and regionally took a breather, although foreigners investors finally turned slight net buyer for the month of September, after four months of outflows. Brent crude oil prices rose to above USD80/bbl as concerns for a tighter market re-emerged after OPEC and Russia show no signs to increase production. The ringgit depreciated 0.7% qoq versus the USD, which is relatively mild when compared to other emerging market currencies. However this resilience may be partly attributable to Malaysia’s commodity exports such as crude oil and palm oil.
4Q2018 was a period of correction. The Malaysian equity market corrected in tandem with global markets as the US market took a nosedive early in the 4Q2018 as US technology stocks declined sharply with the US-China trade war heating up. Domestically, the Government of Malaysia hosted a conference titled “ Malaysia – A New Dawn” which was well attended by investors but may have unduly spooked investors with their “people-first”, anti-monopoly, and “sacrifice” rhetoric. This was followed by the tabling of the Malaysian Budget 2019 which focused on measures to improve disposable income for the B40 group, revised the fiscal deficit to 3.7% in 2018 and 3.4% in 2019, and amidst concerns expressed by rating agencies of Malaysia’s increasing reliance on oil revenues. Brent crude oil dropped sharply in the second half of the 4Q2018, declining by 38% quarter-on-quarter (q-o-q) to close the period at USD45.41/bbl. The oil price weakness spurred OPEC to agree to production cuts until April 2019, but the news had minimal impact on oil prices. External events towards the end of the quarter added to the volatility, such as the arrest of Huawei’s CFO in Canada, just after the US and China announced a temporary trade war truce on 30 November 2018.
For the 1Q2019, the FBM KLCI bucked the regional up-trend and was one of the worst performing indices in emerging market. The regional uplift in sentiment was due to the dramatic shift in US Federal Reserve policy to a more dovish stance and improving rhetoric from the US-China trade talks. In addition, China’s fresh stimulus measures helped sustain the positive sentiment. On the local front, investors were disappointed with Malaysian corporates as reported results were once again disappointing. 2018 was the fourth year of
Client Services : 03-2778 100010
Eastspring Investments Dynamic Fund

sub-par earnings growth. Towards the end of the 1Q2019, big cap stocks corrected post the Invest Malaysia event held on 19-20 March, amidst the risk to earnings for banks due to a possible rate cut, slower corporate earnings growth prospects and policy uncertainty.
The start of 2Q2019 saw regional markets rally on the back of positive US-China trade talks prospects and improved global outlook. However, this quickly turned sour by the month of May following the abrupt end of negotiations to the US-China trade deal with the US raising tariffs on imports from China to 25% on USD200bn of goods effective 10th May 2019. This was followed by steps to stifle China’s technology sector with what was effectively a ban on American firms from supplying parts to Chinese telecommunications giant Huawei Technologies. China retaliated with higher tariffs of up to 25% on US60bn of US goods effective 1 June 2019, with the Chinese leadership hinting at further retaliatory measures against the US. Regional markets rebounded in the month of June, with news of US and China restarting their trade talks post the G20 meeting held in Japan at the end of the month. Contrary to regional markets, the Malaysian equity market struggled to perform early 2Q2019, dampened by news of the potential exclusion of Malaysia from the FTSE Russel’s World Government Bond Index (“WBGI”) after their review come September, weaker Malaysian Ringgit, cut in the OPR of 25bps, and corporate results reporting that was not very inspiring.
The FBM KLCI closed the year under review at 1,672.13 points, down 1.15%. The broader FBM Emas (“FBMEmas”) Index closed the period under review down by 1.5%. The MSCI Asia Pacific ex-Japan Index declined by 2.09% in USD terms.1
Bond
Bank Negara Malaysia (“BNM”) cut the Overnight Policy Rate (“OPR”) by 25bps to 3.00% from 3.25% on 7 May 2019 after holding the policy rate unchanged since 25 January 2018. BNM commented that the adjustment in the OPR was intended to preserve the degree of monetary accommodativeness due to the downside risks in the global and Malaysian economy. Prior to the Monetary Policy Meeting (“MPC”) in May, BNM has continuously caution on the uncertainties in the global environment with trade tensions continuing to be a key source of downside risk. Bank Negara commented that any materialization of downside risk from unresolved trade tension could weigh on domestic growth. Going forward, BNM will continue to monitor the impact of the recent rate cut and will continue to be data-dependent before making any changes in its monetary policies.
MARKET REVIEW (CONTINUED)
1 Source: Bloomberg: World indices
11Client Services : 03-2778 1000
Annual Report

In May 2019, Bank Negara announced several initiatives to deepen and broaden onshore foreign exchange and bond market liquidity. These new measures are expected to improve Malaysia’s market accessibility to the world and may help address the liquidity concerns which was highlighted by FTSE Russell recently. The new initiatives include (1) enhancements to repo market liquidity and flexibility, (2) physical delivery for MGS futures, (3) measures to enhance FX market accessibility and liquidity, (4) increased flexibility for dynamic hedging programme, (5) FX transaction & documentation process and, (6) Ringgit liquidity beyond local trading hours.
On the economic front, Malaysia’s economy continued to grow in the first quarter of 2019 as the Malaysian economy registered marginally lower growth of +4.5% year-on-year (y-o-y), slightly lower than +4.7% y-o-y registered in 4Q2018 but higher compared with +4.4% y-o-y in the 3Q2018. During the first quarter of 2019, Services (1Q2019: +6.4% y-o-y, 4Q2018: +6.9%), Manufacturing (1Q2019: +4.2% y-o-y, 4Q2018: +4.7%) and Agriculture (1Q2019: +5.6% y-o-y, 4Q2018: -0.1%) sectors anchored the Malaysia’s economy. On the expenditure side, Exports declined to +0.1% y-o-y in 1Q2019 from +3.1% y-o-y in 4Q2018 while Gross Fixed Capital Formation recorded negative growth of -3.5% y-o-y in 1Q2019 from +0.6% y-o-y in 4Q2018. Going forward, Malaysia’s economic growth is expected to be broadly sustained, supported mainly by domestic demand while gradual recovery in commodity production will also help to provide support to growth. According to Bank Negara’s Annual Report 2018, Bank Negara expects the economy to grow between 4.3% to 4.8% in 2019, while World Bank expects Malaysia’s economy to grow around 4.6% in 2019.
During the period under review, headline inflation moderated lower to +0.2% y-o-y in May 2019 from +0.8% y-o-y in June 2018. The moderation in inflation was mainly led by a slowdown transportation costs (May 2019: -2.5% y-o-y, June 2018: +5.5% y-o-y). The decrease in transportation costs was due to lower global fuel prices coupled with the change to weekly pricing fuel subsidy model. On the other hand, core inflation moderated higher to +0.4% y-o-y in May 2019 from +0.1% y-o-y in June 2018 on the back of higher Food & Non-Alcoholic Beverages (May 2019: +1.5% y-o-y, June 2018: +1.0% y-o-y). Going forward, BNM expects inflation to be in a range of between 0.7%-1.7% in 2019 on the back of its expectation of lower global oil prices as well as recent implementation on the cap on prices of RON95 and diesel until the middle of 2019.
In the Budget 2019, the Government proposed an expansionary budget to help address short-term issues and to lay the foundation for longer term growth and fiscal agenda. The Government expects higher fiscal deficit of RM53.3billion or 3.7% of GDP for 2018 (vs. the original target of 2.8% of GDP) and 3.4% of GDP for 2019. This came on the back of slower revenue expansion and upward revision in operating and development
MARKET REVIEW (CONTINUED)
Client Services : 03-2778 100012
Eastspring Investments Dynamic Fund

MARKET REVIEW (CONTINUED)
expenditures. As a result, rating agencies (Moody’s and Fitch) have voiced concerns over the level of Malaysia’s national debts. While Moody’s highlighted that wider deficits and a heightened reliance on volatile oil-related revenues will weaken the fiscal profile in the near term, Fitch, on the other hand, said that failure to stick to a more conservative fiscal consolidation path raises some concerns about policy credibility. Nevertheless, the Government appears committed on its plan for a long-term fiscal consolidation while improving transparency. As such, this “one-off” pressure should subside after 2019 as the government plans to reduce fiscal deficit further to 2.8% of GDP by 2021.
In 2018, the US Federal Reserve (“Fed”) followed through on their interest rate hike projections as the Fed increased its benchmark rate four times. The Fed increased its key interest rate by 25bps each time in its Federal Open Market Committee (“FOMC”) meetings in March, June, September and December 2018 to end in the range of 2.25-2.50%. Subsequently in 2019, the Fed maintained the Fed Fund Rate in the first half of the year citing that it will be patient as it determines the future adjustments for the federal funds rate. However, the recent FOMC statement in June showed that the Fed made several changes to its policy statement – removing the word ‘patient’ in favor of language promising to ‘act as appropriate’ and ‘to sustain current economic expansion’. The Fed further said that it still sees a sustained expansion of economic activity, strong labor market conditions, and inflation near the committee’s 2% target, but added that uncertainties about this outlook have increased.
Trade tensions between the US and China have been intensifying over the past several months as both countries have imposed new trade tariffs. US President Donald Trump followed through on months of threats to impose sweeping tariffs on China for its alleged unfair trade practices. As a result, US slapped tariffs on about USD250billion worth of Chinese goods while China retaliated with new tariffs of about USD110billion worth of US goods. Furthermore, relations between the United States and China have deteriorated sharply since both nations failed to sign an anticipated trade deal in early May 2019. As a result, the United States announced that it would increase tariffs from 10% to 25% on USD200billion of Chinese goods while China is said to be considering limiting rare earth exports to United Sates. Global investors remain wary of the instability as this trade dispute continue to weigh on global growth and may trigger huge financial repercussions.
13Client Services : 03-2778 1000
Annual Report

MARKET REVIEW (CONTINUED)
For the period under review, the 3-, 5-, 10- and 15-year Malaysian Government Securities (“MGS”) yields decreased by 33bps, 43bps, 57bps and 72bps to close at 3.29%, 3.42%, 3.63% and 3.91% respectively2. MGS yields moved lower throughout the period on the back of (1) global uncertainties from trade tension which could outweigh growth, (2) dovish Fed stance with no interest rate hikes for 2019 compared to two hikes in 2019 as earlier projected, (3) Bank Negara cut the Overnight Policy Rate by 25bps in May and (4) strong buying interest from local and foreign investors. Meanwhile, corporate bond yields generally moved in tandem with sovereign bond yields, albeit at a lag. Activities in the corporate bond market were supported by ample liquidity and a stable credit environment.
On the supply front, total corporate bond issuances in 2018 stood around RM88billion of which approximately 26% was conventional and 74% was Islamic. New Corporate bond issuances continued to remain healthy in 1H2019 with total new issuances stood around RM41billion. Major primary issuances during the first half of 2019 were mainly government guaranteed bonds and corporates bonds. Notable issuances include RM6.8billion from Danainfra National Berhad (GG), RM4.6billion from Pengurusan Air SPV Berhad (GG & AAA), RM3.7billion from Malayan Banking Berhad (AA1), RM3.5billion from Danum Capital Berhad (AAA), RM3.0billion Lembaga Pembiayaan Perumahan Sektor Awam (GG), RM3.0bilion from PTPTN and RM2.0billion from CIMB Group Holdings (AA1).
REBATES AND SOFT COMMISSIONSDuring the period under review, the Manager and its delegates (if any) received goods and services which directly assist the investment management of the Fund, including research and advisory services, market analyses, data and quotation services, and computer hardware and software used for and/or in support of the investment process of fund managers.
The Manager and its delegates (if any) have not received any rebates or shared any commissions from any brokers during the same period under review.
2 Source: Source: Bloomberg
Client Services : 03-2778 100014
Eastspring Investments Dynamic Fund

EASTSPRING INVESTMENTS DYNAMIC FUNDFINANCIAL STATEMENTSFOR THE FINANCIAL YEAR ENDED 30 JUNE 2019
15Client Services : 03-2778 1000
Annual Report
STATEMENT BY THE MANAGER
We, Tang Chee Kin and Iskander Bin Ismail Mohamed Ali, being two of the Directors of Eastspring Investments Berhad, do hereby state that, in the opinion of the Manager, the accompanying financial statements set out on pages 22 to 76 are drawn up in accordance with the provisions of the Deed and give a true and fair view of the financial position of the Fund as at 30 June 2019 and of its financial performance, changes in equity and cash flows for the financial year ended on that date in accordance with the Malaysian Financial Reporting Standards and International Financial Reporting Standards.
For and on behalf of the Manager,EASTSPRING INVESTMENTS BERHAD
TANG CHEE KINExecutive Director/Chief Executive Officer
ISKANDER BIN ISMAIL MOHAMED ALI Independent, Non-Executive Director
Kuala LumpurDate: 15 August 2019
Client Services : 03-2778 100016
Eastspring Investments Dynamic Fund

TRUSTEE’S REPORT TO THE UNIT HOLDERS OF EASTSPRING INVESTMENTS DYNAMIC FUND
We have acted as Trustee for Eastspring Investments Dynamic Fund (the “Fund”) for financial year ended 30 June 2019. To the best of our knowledge, for the financial year under review, Eastspring Investments Berhad (the “Manager”) has operated and managed the Fund in accordance with the following:-
a. limitations imposed on the investment powers of the Manager under the Deed(s), the Securities Commission’s Guidelines on Unit Trust Funds, the Capital Markets and Services Act 2007 and other applicable laws;
b. valuation and pricing for the Fund are carried out in accordance with the Deed(s) of the Fund and any regulatory requirements; and
c. creation and cancellation of units for the Fund are carried out in accordance with the Deed(s) of the Fund and any regulatory requirements.
We are of the view that the distribution made during this financial year ended 30 June 2019 by the Manager is not inconsistent with the objectives of the Fund.
For Deutsche Trustees Malaysia Berhad
Ng Hon Leong Richard Lim Hock Seng
Head, Trustee Operations Chief Executive Officer
Kuala Lumpur Date: 15 August 2019
17Client Services : 03-2778 1000
Annual Report

INDEPENDENT AUDITORS’ REPORT TO THE UNIT HOLDERS OF EASTSPRING INVESTMENTS DYNAMIC FUND
REPORT ON THE AUDIT OF THE FINANCIAL STATEMENTS
Our opinion
In our opinion, the financial statements of Eastspring Investments Dynamic Fund (“the Fund”) give a true and fair view of the financial position of the Fund as at 30 June 2019, and of its financial performance and its cash flows for the financial year then ended in accordance with Malaysian Financial Reporting Standards and International Financial Reporting Standards.
What we have audited
We have audited the financial statements of the Fund, which comprise the statement of financial position as at 30 June 2019, and the statement of comprehensive income, statement of changes in equity and statement of cash flows for the financial year then ended, and notes to the financial statements, including a summary of significant accounting policies, as set out on pages 22 to 76.
Basis for opinion
We conducted our audit in accordance with approved standards on auditing in Malaysia and International Standards on Auditing. Our responsibilities under those standards are further described in the “Auditors’ responsibilities for the audit of the financial statements” section of our report.
We believe that the audit evidence we have obtained is sufficient and appropriate to provide a basis for our opinion.
Independence and other ethical responsibilities
We are independent of the Fund in accordance with the By-Laws (on Professional Ethics, Conduct and Practice) of the Malaysian Institute of Accountants (“By-Laws”) and the International Ethics Standards Board for Accountants’ Code of Ethics for Professional Accountants (“IESBA Code”), and we have fulfilled our other ethical responsibilities in accordance with the By-Laws and the IESBA Code.
Client Services : 03-2778 100018
Eastspring Investments Dynamic Fund

Information other than the financial statements and auditors’ report thereon
The Manager of the Fund is responsible for the other information. The other information comprises Manager’s Report, but does not include the financial statements of the Fund and our auditors’ report thereon.
Our opinion on the financial statements of the Fund does not cover the other information and we do not express any form of assurance conclusion thereon.
In connection with our audit of the financial statements of the Fund, our responsibility is to read the other information and, in doing so, consider whether the other information is materially inconsistent with the financial statements of the Fund or our knowledge obtained in the audit or otherwise appears to be materially misstated.
If, based on the work we have performed, we conclude that there is a material misstatement of this other information, we are required to report that fact. We have nothing to report in this regard.
Responsibilities of the Manager for the financial statements
The Manager of the Fund is responsible for the preparation of the financial statements of the Fund that give a true and fair view in accordance with Malaysian Financial Reporting Standards and International Financial Reporting Standards. The Manager is also responsible for such internal control as the Manager determine is necessary to enable the preparation of financial statements of the Fund that are free from material misstatement, whether due to fraud or error.
In preparing the financial statements of the Fund, the Manager is responsible for assessing the Fund’s ability to continue as a going concern, disclosing, as applicable, matters related to going concern and using the going concern basis of accounting unless the Manager either intend to liquidate the Fund or have no realistic alternative but to do so.
19Client Services : 03-2778 1000
Annual Report

Auditors’ responsibilities for the audit of the financial statements
Our objectives are to obtain reasonable assurance about whether the financial statements of the Fund as a whole are free from material misstatement, whether due to fraud or error, and to issue an auditors’ report that includes our opinion. Reasonable assurance is a high level of assurance, but is not a guarantee that an audit conducted in accordance with approved standards on auditing in Malaysia and International Standards on Auditing will always detect a material misstatement when it exists. Misstatements can arise from fraud or error and are considered material if, individually or in the aggregate, they could reasonably be expected to influence the economic decisions of users taken on the basis of these financial statements.
As part of an audit in accordance with approved standards on auditing in Malaysia and International Standards on Auditing, we exercise professional judgement and maintain professional scepticism throughout the audit. We also:
a. Identify and assess the risks of material misstatement of the financial statements of the Fund, whether due to fraud or error, design and perform audit procedures responsive to those risks, and obtain audit evidence that is sufficient and appropriate to provide a basis for our opinion. The risk of not detecting a material misstatement resulting from fraud is higher than for one resulting from error, as fraud may involve collusion, forgery, intentional omissions, misrepresentations, or the override of internal control.
b. Obtain an understanding of internal control relevant to the audit in order to design audit procedures that are appropriate in the circumstances, but not for the purpose of expressing an opinion on the effectiveness of the Fund’s internal control.
c. Evaluate the appropriateness of accounting policies used and the reasonableness of accounting estimates and related disclosures made by the Manager.
d. Conclude on the appropriateness of the Manager’s use of the going concern basis of accounting and, based on the audit evidence obtained, whether a material uncertainty exists related to events or conditions that may cast significant doubt on the Fund’s ability to continue as a going concern. If we conclude that a material uncertainty exists, we are required to draw attention in our auditors’ report to the related disclosures in the financial statements of the Fund or, if such disclosures are inadequate, to modify our opinion. Our conclusions are based on the audit evidence obtained up to the date of our auditors’ report. However, future events or conditions may cause the Fund to cease to continue as a going concern.
Client Services : 03-2778 100020
Eastspring Investments Dynamic Fund

e. Evaluate the overall presentation, structure and content of the financial statements of the Fund, including the disclosures, and whether the financial statements represent the underlying transactions and events in a manner that achieves fair presentation.
We communicate with the Manager regarding, among other matters, the planned scope and timing of the audit and significant audit findings, including any significant deficiencies in internal control that we identify during our audit.
OTHER MATTERS
This report is made solely to the unit holders of the Fund and for no other purpose. We do not assume responsibility to any other person for the content of this report.
PRICEWATERHOUSECOOPERS PLT LLP0014401-LCA & AF 1146 Chartered Accountants
Kuala LumpurDate: 15 August 2019
21Client Services : 03-2778 1000
Annual Report

STATEMENT OF COMPREHENSIVE INCOME FOR THE FINANCIAL YEAR ENDED 30 JUNE 2019
Note 2019 2018
RM RM
INVESTMENT INCOME/(LOSS)Gross dividend income 1,709,177 1,402,996Interest income from deposits with licensed financial institutions 283,093 267,884Interest income from unquoted fixed income securities 308,330 136,625Net gain/(loss) on financial assets at fair value through profit or loss 7 318,662 (4,527,619)
2,619,262 (2,720,114)
EXPENSESManagement fee 3 (769,236) (856,412)Trustee fee 4 (43,077) (47,959)Audit fee (7,300) (7,300)Tax agent fee (3,400) (3,400)GST charges - (51,164)Other expenses (26,575) (29,953)Transaction costs (180,516) (342,081)
(1,030,104) (1,338,269)
PROFIT/(LOSS) BEFORE TAXATION 1,589,158 (4,058,383)
TAXATION 5 (5,140) (6,185)
PROFIT/(LOSS) AFTER TAXATION AND TOTAL COMPREHENSIVE INCOME/(LOSS) 1,584,018 (4,064,568)
Profit/(loss) after taxation is made up of the following: Realised amount 8,487,579 (678,427) Unrealised amount (6,903,561) (3,386,141)
1,584,018 (4,064,568)
The accompanying summary of significant accounting policies and notes to the financial statements form an integral part of these financial statements.
Client Services : 03-2778 100022
Eastspring Investments Dynamic Fund
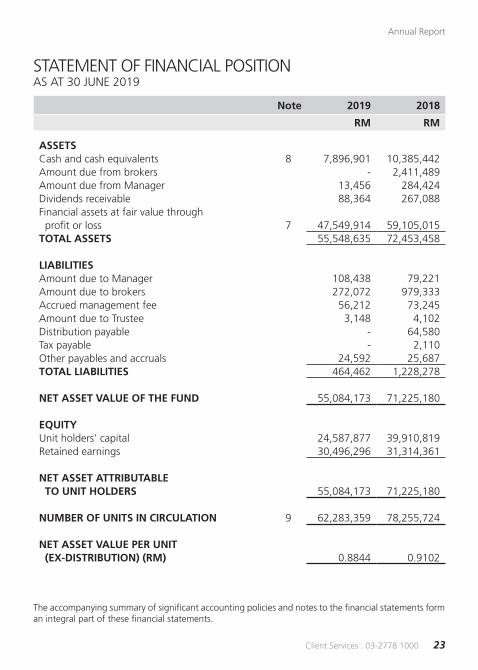
STATEMENT OF FINANCIAL POSITION AS AT 30 JUNE 2019
Note 2019 2018
RM RM
ASSETSCash and cash equivalents 8 7,896,901 10,385,442Amount due from brokers - 2,411,489Amount due from Manager 13,456 284,424Dividends receivable 88,364 267,088Financial assets at fair value through profit or loss 7 47,549,914 59,105,015TOTAL ASSETS 55,548,635 72,453,458
LIABILITIES Amount due to Manager 108,438 79,221Amount due to brokers 272,072 979,333Accrued management fee 56,212 73,245Amount due to Trustee 3,148 4,102Distribution payable - 64,580Tax payable - 2,110Other payables and accruals 24,592 25,687TOTAL LIABILITIES 464,462 1,228,278
NET ASSET VALUE OF THE FUND 55,084,173 71,225,180
EQUITYUnit holders’ capital 24,587,877 39,910,819Retained earnings 30,496,296 31,314,361
NET ASSET ATTRIBUTABLE TO UNIT HOLDERS 55,084,173 71,225,180
NUMBER OF UNITS IN CIRCULATION 9 62,283,359 78,255,724
NET ASSET VALUE PER UNIT (EX-DISTRIBUTION) (RM) 0.8844 0.9102
The accompanying summary of significant accounting policies and notes to the financial statements form an integral part of these financial statements.
23Client Services : 03-2778 1000
Annual Report

STATEMENT OF CHANGES IN EQUITY FOR THE FINANCIAL YEAR ENDED 30 JUNE 2019
Note
Unit holders’
capitalRetained earnings Total
RM RM RM
Balance as at 1 July 2018 39,910,819 31,314,361 71,225,180
Movement in unit holders’ contribution:Creation of units from applications 5,172,422 - 5,172,422Creation of units from distribution 2,337,546 - 2,337,546Cancellation of units (22,832,910) - (22,832,910)Distribution (Gross: 4.02 sen/Net: 4.02 sen) 6 - (2,402,083) (2,402,083)Total comprehensive income for the financial year - 1,584,018 1,584,018Balance as at 30 June 2019 24,587,877 30,496,296 55,084,173
Balance as at 1 July 2017 15,567,511 38,439,144 54,006,655
Movement in unit holders’ contribution:Creation of units from applications 32,232,088 - 32,232,088Creation of units from distribution 2,995,634 - 2,995,634Cancellation of units (10,884,414) - (10,884,414)Distribution (Gross: 4.39 sen/Net: 4.09 sen) 6 - (3,060,215) (3,060,215)Total comprehensive loss for the financial year - (4,064,568) (4,064,568)Balance as at 30 June 2018 39,910,819 31,314,361 71,225,180
The accompanying summary of significant accounting policies and notes to the financial statements form an integral part of these financial statements.
Client Services : 03-2778 100024
Eastspring Investments Dynamic Fund

STATEMENT OF CASH FLOWS FOR THE FINANCIAL YEAR ENDED 30 JUNE 2019
Note 2019 2018
RM RM
CASH FLOWS FROM OPERATING ACTIVITIESProceeds from sale of investments 45,570,080 45,452,617Purchase of investments (32,226,180) (62,676,022)Dividends received 1,882,761 1,203,848Interest received from deposits with licensed financial institutions 283,093 267,884Interest received from unquoted fixed income securities 361,905 56,883Management fee paid (786,269) (838,773)Trustee fee paid (44,031) (46,971)Payment for other fees and expenses (40,480) (92,045)Net cash generated from/(used in) operating activities 15,000,879 (16,672,579)
CASH FLOWS FROM FINANCING ACTIVITIESCash proceeds from units created 5,443,390 32,097,774Payments for cancellation of units (22,803,693) (10,805,193)Distribution paid (129,117) (69,586)Net cash (used in)/generated from financing activities (17,489,420) 21,222,995
NET (DECREASE)/INCREASE IN CASH AND CASH EQUIVALENTS (2,488,541) 4,550,416
CASH AND CASH EQUIVALENTS AT THE BEGINNING OF THE FINANCIAL YEAR 10,385,442 5,835,026
CASH AND CASH EQUIVALENTS AT THE END OF THE FINANCIAL YEAR 8 7,896,901 10,385,442
The accompanying summary of significant accounting policies and notes to the financial statements form an integral part of these financial statements.
25Client Services : 03-2778 1000
Annual Report

The following accounting policies have been used in dealing with items which are considered material in relation to the financial statements.
A. BASIS OF PREPARATION OF THE FINANCIAL STATEMENTS
The financial statements have been prepared under the historical cost convention in accordance with the Malaysian Financial Reporting Standards (“MFRS”) and International Financial Reporting Standards (“IFRS”), as modified by financial assets at fair value through profit or loss.
The preparation of financial statements in conformity with the MFRS and IFRS requires the use of certain critical accounting estimates and assumptions that affect the reported amounts of assets and liabilities and disclosure of contingent assets and liabilities at the date of the financial statements, and the reported amounts of revenues and expenses during the reported financial year. It also requires the Manager to exercise their judgment in the process of applying the Fund’s accounting policies. Although these estimates and judgment are based on the Manager’s best knowledge of current events and actions, actual results may differ.
The areas involving a higher degree of judgment or complexity, or areas where assumptions and estimates are significant to the financial statements are disclosed in Note M to the financial statements.
a. Standards, amendments to published standards and interpretations that are effective:
The Fund has applied the following amendments for the first time for the financial year beginning on 1 July 2018:
• MFRS 9 ‘Financial Instruments’ became effective for annual periods beginning on or after 1 July 2018. It addresses the classification, measurement and derecognition of financial assets and liabilities and replaces the multiple classification and measurement models in MFRS 139.
Classification and measurement of debt assets is driven by the entity’s business model for managing the financial assets and the contractual cash flow characteristics of the financial assets. A debt instrument is measured at amortised cost if the objective of the business model is to hold the financial asset for the collection of the contractual cash flows and the contractual cash flows under the instrument solely represent payments of principal and
SUMMARY OF SIGNIFICANT ACCOUNTING POLICIESFOR THE FINANCIAL YEAR ENDED 30 JUNE 2019
Client Services : 03-2778 100026
Eastspring Investments Dynamic Fund
interest (“SPPI”). A debt instrument is measured at fair value through other comprehensive income if the objective of the business model is to hold the financial asset both to collect contractual cash flows from SPPI and to sell. All other debt instruments must be recognised at fair value through profit or loss. An entity may however, at initial recognition, irrevocably designate a financial asset as measured at fair value through profit or loss if doing so eliminates or significantly reduces a measurement or recognition inconsistency. Derivative and equity instruments are measured at fair value through profit or loss unless, for equity instruments not held for trading, an irrevocable option is taken to measure at fair value through other comprehensive income. MFRS 9 also introduces a new expected credit loss (“ECL”) impairment model.
MFRS 9 has been applied retrospectively by the Fund and did not result in a change to the classification or measurement of financial instruments as outlined in Note E.
The Fund’s investment portfolio continues to be classified as fair value through profit or loss and other financial assets which are held for collection continue to be measured at amortised cost. There was no material impact on adoption from the application of the new impairment model.
There are no other standards, amendments to standards or interpretations that are effective for annual periods beginning on 1 July 2018 that have a material effect on the financial statements of the Fund.
b. New standards, amendments and interpretations effective after 1 July 2019 and have not been early adopted.
• Amendments to MFRS 112 ‘Income Taxes’ (effective from 1 January 2019) clarify that there income tax consequences of dividends on financial instruments classified as equity is recognised (either in profit or loss, other comprehensive income or equity) depends on where the past transactions that generated distributable profits were recognised.
Accordingly, the tax consequences are recognised in profit or loss when an entity determines payments on such instruments are distribution of profits (that is, dividends). Tax on dividend should not be recognised in equity merely on the basis that it is related to a distribution to owners.
The Fund will apply this standard when effective. This standard is not expected to have a significant impact on the Fund’s financial statements.
27Client Services : 03-2778 1000
Annual Report

B. INCOME RECOGNITION
Interest income from short-term deposits with licensed financial institutions is recognised on an accrual basis using the effective interest rate method.
Up till 30 June 2018, when a loans and receivables is impaired, the Fund reduces the carrying amount to its recoverable amount, being the estimated future cash flow discounted at the original effective interest rate of the instrument, and continue unwinding the discount as interest income. Interest income on impaired loans and receivables are recognised using the original effective interest rate.
From 1 July 2018, interest income is calculated by applying the effective interest rate to the gross carrying amount of a financial asset except for financial assets that subsequently become credit-impaired. For credit-impaired financial assets the effective interest rate is applied to the net carrying amount of the financial asset (after deduction of the loss allowance).
Interest income from unquoted fixed income securities including amortisation of premium and accretion of discount are recognised using the effective interest rate method.
Dividend income is recognised on the ex-dividend date, when the right to receive the dividend has been established.
Realised gain or loss on disposal of quoted securities is accounted for as the difference between the net disposal proceeds and the carrying amount of investments, determined on a weighted average cost basis.
Realised gain or loss on disposal of unquoted fixed income securities is accounted for as the difference between the net disposal proceeds and the carrying amount of the investments, determined on cost adjusted for accretion of discount or amortisation of premium.
C. TAXATION
Current tax expense is determined according to the Malaysian tax laws at the current rate based upon the taxable income earned during the financial year.
Client Services : 03-2778 100028
Eastspring Investments Dynamic Fund

D. PRESENTATION AND FUNCTIONAL CURRENCY
Items included in the financial statements of the Fund are measured using the currency of the primary economic environment in which the Fund operates (the “functional currency”). The financial statements are presented in Ringgit Malaysia (“RM”), which is the Fund’s presentation and functional currency.
E. FINANCIAL ASSETS AND FINANCIAL LIABILITIES
i. Classification
Up till 30 June 2018, the Fund designates its investment in quoted securities and unquoted fixed income securities as financial assets at fair value through profit or loss at inception.
Financial assets are designated at fair value through profit or loss when they are managed and their performance evaluated on a fair value basis.
Loans and receivables are non-derivative financial assets with fixed or determinable payments that are not quoted in an active market.
The Fund’s loans and receivables comprise amount due from brokers, amount due from Manager, cash and cash equivalents and dividends receivable.
Financial liabilities are classified according to the substance of the contractual arrangements entered into and the definitions of a financial liability.
The Fund classifies amount due to Manager, amount due to brokers, accrued management fee, amount due to Trustee, distribution payable and other payables and accruals as other financial liabilities.
From 1 July 2018, the Fund classify its financial assets in the following measurement categories:
• those to be measured subsequently at fair value (either through other comprehensive income (“OCI”) or through profit or loss), and
• those to be measured at amortised cost
29Client Services : 03-2778 1000
Annual Report

The Fund classifies its investments based on both the Fund’s business model for managing those financial assets and the contractual cash flow characteristics of the financial assets. The portfolio of financial assets is managed and performance is evaluated on a fair value basis. The Fund is primarily focused on fair value information and uses that information to assess the assets’ performance and to make decisions. The Fund has not taken the option to irrevocably designate any equity securities as fair value through other comprehensive income. Consequently, all investments are measured at fair value through profit or loss.
The Fund classifies amount due from Manager, dividends receivable and cash and cash equivalents as financial assets at amortised cost as these financial assets are held to collect contractual cash flows consisting of the amount outstanding.
The Fund classifies amount due to Manager, amount due to brokers, accrued management fee, amount due to Trustee and other payables and accruals as financial liabilities measured at amortised cost.
ii. Recognition and measurement
Regular purchases and sales of financial assets are recognised on the trade date, the date on which the Fund commits to purchase or sell the asset. Investments are initially recognised at fair value. Transaction costs are expensed in the statement of comprehensive income.
Financial assets are derecognised when the rights to receive cash flows from the investments have expired or have been transferred and the Fund has transferred substantially all risks and rewards of ownership.
Financial liabilities, within the scope of MFRS 139, up to 30 June 2018 and MFRS 9 from 1 July 2018, are recognised in the statement of financial position when, and only when, the Fund becomes a party to the contractual provisions of the financial instrument.
Financial liabilities are derecognised when it is extinguished; i.e when the obligation specified in the contract is discharged or cancelled or expired.
Client Services : 03-2778 100030
Eastspring Investments Dynamic Fund

Unrealised gains or losses arising from changes in the fair value of the ‘financial assets at fair value through profit or loss’ are presented in the statement of comprehensive income within ‘net gain/(loss) on financial assets at fair value through profit or loss ’ in the financial year in which they arise. Any unrealised gains however are not distributable.
Dividend income from financial assets at fair value through profit or loss is recognised in the statement of comprehensive income as part of gross dividend income when the Fund’s right to receive payments is established.
Quoted securities in Malaysia are valued at the last done market price quoted on the Bursa Malaysia Securities Berhad (“Bursa Securities”) at the date of the statement of financial position.
Unquoted fixed income securities are revalued on a daily basis based on fair value prices quoted by a bond pricing agency (“BPA”) registered with the Securities Commission as per the Securities Commission’s (“SC”) Guidelines on Unit Trust Funds. Refer to Note L to the financial statements for further explanation.
If a valuation based on the market price does not represent the fair value of the securities, for example during abnormal market conditions or when no market price is available, including in the event of a suspension in the quotation of the securities for a period exceeding 14 days, or such shorter period as agreed by the Trustee, then the securities are valued as determined in good faith by the Manager, based on the methods or basis approved by the Trustee after appropriate technical consultation.
Deposits with licensed financial institutions are stated at cost plus accrued interest calculated on the effective interest method over the period from the date of placement to the date of maturity of the respective deposits.
Loans and receivables and other financial liabilities are subsequently carried at amortised cost using the effective interest method.
31Client Services : 03-2778 1000
Annual Report

iii. Impairment
Up till 30 June 2018, for assets carried at amortised cost, the Fund assesses at the end of the reporting year whether there is objective evidence that a financial asset or group of financial assets is impaired. A financial asset is or a group of financial assets are impaired and impairment losses are incurred only if there is objective evidence of impairment as a result of one or more events that occurred after the initial recognition of the asset (a ‘loss event’) and that loss event (or events) has an impact on the estimated future cash flows of the financial asset or group of financial assets that can be reliably estimated.
The amount of the loss is measured as the difference between the asset’s carrying amount and the present value of estimated future cash flows (excluding future credit losses that have not been incurred) discounted at the financial asset’s original effective interest rate. The asset’s carrying amount is reduced and the amount of the loss is recognised in statement of comprehensive income. If ‘loans and receivables’ have a variable interest rate, the discount rate for measuring any impairment loss is the current effective interest rate determined under the contract.
As a practical expedient, the Fund may measure impairment on the basis of an instrument’s fair value using an observable market price.
If, in a subsequent year, the amount of the impairment loss decreases and the decrease can be related objectively to an event occurring after the impairment was recognised (such as an improvement in the debtor’s credit rating), the reversal of the previously recognised impairment loss is recognised in statement of comprehensive income.
When an asset is uncollectible, it is written off against the related allowance account. Such assets are written off after all the necessary procedures have been completed and the amount of the loss has been determined.
From 1 July 2018 onwards, the Fund measures credit risk and expected credit losses using probability of default, exposure at default and loss given default. Management considers both historical analysis and forward looking information in determining any expected credit loss. Management consider the probability of default to be close to zero as these instruments have a low risk of default and the counterparties have a strong capacity to meet their contractual obligations in the near term. As a result, no loss allowance has been recognised based on 12 months expected credit losses as any such impairment would be wholly insignificant to the Fund.
Client Services : 03-2778 100032
Eastspring Investments Dynamic Fund

Significant increase in credit risk
A significant increase in credit risk is defined by management as any contractual payment which is more than 30 days past due.
Definition of default and credit-impaired financial assets
Any contractual payment which is more than 90 days past due is considered credit impaired.
Write-off
The Fund writes off financial assets, in whole or in part, when it has exhausted all practical recovery efforts and has concluded there is no reasonable expectation of recovery. The assessment of no reasonable expectation of recovery is based on unavailability of debtor’s sources of income or assets to generate sufficient future cash flows to repay the amount. The Fund may write-off financial assets that are still subject to enforcement activity. Subsequent recoveries of amounts previously written off will result in impairment gains. There are no write-offs/recoveries during the financial year.
F. CASH AND CASH EQUIVALENTS
For the purpose of the statement of cash flows, cash and cash equivalents comprise bank balance and deposits with licensed financial institutions that are readily convertible to known amounts of cash and which are subject to an insignificant risk of changes in value.
G. TRANSACTION COSTS
Transaction costs are costs incurred to acquire financial assets or liabilities at fair value through profit or loss. They include the bid-ask spread, fees and commissions paid to agents, advisors, brokers and dealers. Transaction costs, when incurred, are immediately recognised in the statement of comprehensive income as expenses.
33Client Services : 03-2778 1000
Annual Report

H. DISTRIBUTION
A distribution to the Fund’s unit holders is accounted for as a deduction from realised reserves. A proposed distribution is recognised as a liability in the financial year in which it is approved by the Trustee.
I. UNIT HOLDERS’ CAPITAL
The unit holders’ contributions to the Fund meet the criteria to be classified as equity instruments under MFRS 132 “Financial Instruments: Presentation”. Those criteria include:
• the units entitle the holder to a proportionate share of the Fund’s net assets value;
• the units are the most subordinated class and class features are identical;• there is no contractual obligations to deliver cash or another financial asset other
than the obligation on the Fund to repurchase; and • the total expected cash flows from the units over its life are based substantially
on the profit or loss of the Fund.
The outstanding units are carried at the redemption amount that is payable at each financial year if unit holder exercises the right to put the unit back to the Fund.
Units are created and cancelled at prices based on the Fund’s net asset value per unit at the time of creation or cancellation. The Fund’s net asset value per unit is calculated by dividing the net assets attributable to unit holders with the total number of outstanding units.
J. AMOUNTS DUE FROM/(TO) BROKERS
Amounts due from and to brokers represent receivables for securities sold and payables for securities purchased that have been contracted for but not yet settled or delivered on the statement of financial position date respectively. The due from brokers balance is held for collection.
Client Services : 03-2778 100034
Eastspring Investments Dynamic Fund

These amounts are recognised initially at fair value and subsequently measured at amortised cost. At each reporting date, the Fund shall measure the loss allowance on amounts due from broker at an amount equal to the lifetime expected credit losses if the credit risk has increased significantly since initial recognition. If, at the reporting date, the credit risk has not increased significantly since initial recognition, the Fund shall measure the loss allowance at an amount equal to 12-months expected credit losses. Significant financial difficulties of the broker, probability that the broker will enter bankruptcy or financial reorganisation, and default in payments are all considered indicators that a loss allowance may be required.
If the credit risk increases to the point that it is considered to be credit impaired, interest income will be calculated based on the gross carrying amount adjusted for the loss allowance. A significant increase in credit risk is defined by management as any contractual payment which is more than 30 days past due.
Any contractual payment which is more than 90 days past due is considered credit impaired.
K. SEGMENTAL INFORMATION
Operating segments are reported in a manner consistent with the internal reporting used by chief operating decision-maker. The chief operating decision-maker, who is responsible for allocating resources and assessing performance of the operating segments, has been identified as the Investment Committee of the Fund’s Manager that undertakes strategic decisions for the Fund.
L. FAIR VALUE OF FINANCIAL INSTRUMENTS
Financial instruments comprise financial assets and financial liabilities. Fair value is defined as the price that would be received to sell an asset or paid to transfer a liability in an orderly transaction between market participants at the measurement date (i.e. an exit price). The information presented herein represents the estimates of fair values as at the date of the statement of financial position.
35Client Services : 03-2778 1000
Annual Report

M. CRITICAL ACCOUNTING ESTIMATES AND JUDGMENTS IN APPLYING ACCOUNTING POLICIES
The Fund makes estimates and assumptions concerning the future. The resulting accounting estimates will, by definition, rarely equal the related actual results. To enhance the information contents on the estimates, certain key variables that are anticipated to have material impact to the Fund’s results and financial position are tested for sensitivity to changes in the underlying parameters.
Estimates and judgments are continually evaluated by the Manager and the Trustee and are based on historical experience and other factors, including expectations of future events that are believed to be reasonable under the circumstances.
a. Estimate of fair value of unquoted fixed income securities
The Fund uses significant judgment in determining whether an investment is impaired. The Fund evaluates, among other factors, the duration and extent to which the fair value of the investment is less than cost, and the financial health and near-term business outlook for the investee, including factors such as industry and sector performance, macroeconomic factors and speculation.
In undertaking any of the Fund’s investment, the Manager will ensure that all assets of the Fund under management will be valued appropriately, that is at fair value.
Unquoted fixed income securities are valued using fair value prices quoted by a bond pricing agency (“BPA”). Where the Manager is of the view that the price quoted by BPA for a specific bond differs from the market price by more than 20 basis points, the Manager may use the market price, provided that the Manager records its basis for using a non-BPA price, obtains necessary internal approvals to use the non-BPA price, and keeps an audit trail of all decisions and basis for adopting the use of non-BPA price.
Client Services : 03-2778 100036
Eastspring Investments Dynamic Fund

1. INFORMATION ON THE FUND
Eastspring Investments Dynamic Fund (the “Fund”) was constituted pursuant to the execution of a Deed dated 5 November 2003, Master Supplemental Deed dated 12 July 2007 and Second Supplemental Master Deed dated 30 November 2009 between HSBC (Malaysia) Trustee Berhad (“HSBC Trustee”) and Eastspring Investments Berhad (the “Manager”). The Fund replaced HSBC Trustee with Deutsche Trustees Malaysia Berhad (the “Trustee”) effective 1 October 2010. A Supplemental Master Deed was entered into between Eastspring Investments Berhad (the “Manager”) and Deutsche Trustees Malaysia Berhad (the “Trustee”) on 30 July 2010 to effect the change of trustee from HSBC Trustee to the Trustee, followed by Second Supplemental Master Deed dated 28 January 2011, Third Supplemental Master Deed dated 9 March 2011, Fourth Supplemental Master Deed dated 20 January 2012, Fifth Supplemental Master Deed dated 26 March 2014, Sixth Supplemental Master Deed dated 2 January 2015, Seventh Supplemental Master Deed dated 11 July 2016, Eighth Supplemental Master Deed dated 25 January 2017, Ninth Supplemental Master Deed dated 11 December 2017 and Tenth Supplemental Master Deed dated 4 June 2018 (collectively referred to as the “Deed”).
The Fund was launched on 6 November 2003 and will continue its operations until terminated by the Trustee or the Manager as provided under Part 12 of the Deed.
The main objective of the Fund is to seek to provide investors with capital appreciation by actively investing in equity and equity-related securities. For defensive considerations, the Fund may invest in debentures and money market instruments.
The Fund seeks to achieve its objective by adopting a flexible asset allocation strategy between the different asset classes of equities and equity-related securities, debentures and liquid assets, depending on the investment market outlook. All investments will be subjected to the Securities Commission’s (“SC”) Guidelines on Unit Trust Funds, the Deed and the objective of the Fund.
The Manager is a company incorporated in Malaysia and is related to Prudential Plc., a public listed company in the United Kingdom. The principal activity of the Manager is the establishment and management of unit trust funds and asset management.
NOTES TO THE FINANCIAL STATEMENTSFOR THE FINANCIAL YEAR ENDED 30 JUNE 2019
37Client Services : 03-2778 1000
Annual Report

2. FINANCIAL RISK MANAGEMENT OBJECTIVES AND POLICIES
The Fund is exposed to a variety of risks which include market risk (inclusive of price risk and interest rate risk), stock/issuer risk, liquidity risk, non-compliance risk, fund management risk, capital risk and credit/default risk.
Financial risk management is carried out through internal control processes adopted by the Manager and adherence to the investment restrictions as stipulated in the Deed.
Financial instruments of the Fund are as follows:
Note
Financial assets at
amortised cost
Financial assets at fair
value through profit or loss Total
RM RM RM
2019
Quoted securities 7 - 42,268,935 42,268,935Unquoted fixed income securities 7 - 5,280,979 5,280,979Amount due from Manager 13,456 - 13,456Dividends receivable 88,364 - 88,364Cash and cash equivalents 8 7,896,901 - 7,896,901
7,998,721 47,549,914 55,548,635
Client Services : 03-2778 100038
Eastspring Investments Dynamic Fund

NoteLoans and
receivables
Financial assets at fair
value through profit or loss Total
RM RM RM
2018
Quoted securities 7 - 51,976,378 51,976,378Unquoted fixed income securities 7 - 7,128,637 7,128,637Amount due from brokers 2,411,489 - 2,411,489Amount due from Manager 284,424 - 284,424Dividends receivable 267,088 - 267,088Cash and cash equivalents 8 10,385,442 - 10,385,442
13,348,443 59,105,015 72,453,458
All liabilities are financial liabilities which are carried at amortised cost.
39Client Services : 03-2778 1000
Annual Report

Market risk
i. Price risk
This risk refers to changes and developments in regulations, politics and the economy of the country. The very nature of a Unit Trust Fund, however, helps mitigate this risk because a fund would generally hold a well-diversified portfolio of securities from different market sectors that the collapse of any one security or any one market sector would not impact too greatly on the value of the Fund.
The table below shows assets of the Fund as at 30 June which are exposed to price risk:
2019 2018
RM RM
Financial assets at fair value through profit or loss: Quoted securities 42,268,935 51,976,378 Unquoted fixed income securities* 5,280,979 7,128,637
47,549,914 59,105,015
* Includes interest receivables of RM60,099 (2018: RM97,627).
Client Services : 03-2778 100040
Eastspring Investments Dynamic Fund

The following table summarises the sensitivity of the Fund’s net asset value and profit/(loss) after tax to movements in prices of quoted securities and unquoted fixed income securities at the end of the reporting year. The analysis is based on the assumptions that the market price of the quoted securities and unquoted fixed income securities increased by 5% and decreased by 5% with all other variables held constant. This represents management’s best estimate of a reasonable possible shift in the quoted securities and unquoted fixed income securities, having regard to the historical volatility of the prices.
% Change in price Market
value
Impact on profit/(loss) after tax/net
asset value
RM RM
2019
+5% 49,864,306 2,374,491-5% 45,115,324 (2,374,491)
2018
+5% 61,957,757 2,950,369-5% 56,057,019 (2,950,369)
ii. Interest rate risk
In general, when interest rates rise, unquoted fixed income securities prices will tend to fall and vice versa. Therefore, the NAV of the Fund may also tend to fall when interest rates rise or are expected to rise. However, investors should be aware that should the Fund holds an unquoted fixed income securities till maturity, such price fluctuations would dissipate as it approaches maturity, and thus the growth of the NAV shall not be affected at maturity. In order to mitigate interest rates exposure of the Fund, the Manager will manage the duration of the portfolio via shorter or longer tenured assets depending on the view of the future interest rate trend of the Manager, which is based on its continuous fundamental research and analysis.
41Client Services : 03-2778 1000
Annual Report

Investors should note that the movement in prices of unquoted fixed income securities and money market instruments are benchmarked against interest rates. As such, the investments are exposed to the movement of the interest rates.
This risk is crucial since unquoted fixed income securities portfolio management depends on forecasting interest rate movements. Prices of unquoted fixed income securities move inversely to interest rate movements, therefore as interest rates rise, the prices of unquoted fixed income securities decrease and vice versa. Furthermore, unquoted fixed income securities with longer maturity and lower yield coupon rates are more susceptible to interest rate movements.
Such investments may be subject to unanticipated rise in interest rates which may impair the ability of the issuers to make payments of interest income and principal, especially if the issuers are highly leveraged. An increase in interest rates may therefore increase the potential for default by an issuer.
The table below summarises the sensitivity of the Fund’s profit/(loss) after tax and NAV to movements in prices of unquoted fixed income securities held by the Fund as a result of movement in interest rate. The analysis is based on the assumptions that the interest rate changed by 1% (2018: 1%) with all other variables held constant. This represents management’s best estimate of a reasonable possible shift in the interest rate, having regard to the historical volatility of the interest rate.
2019 2018
% Change ininterest rate of unquoted fixed income securities
Impact onprofit after tax/net asset value
Impact onloss after tax/
net asset value
RM RM
+1% (2018: +1%) (16,061) (8,550)- 1% (2018: - 1%) 16,145 8,578
The Fund’s investments in deposits with licensed financial institutions are short term in nature. Therefore, exposure to interest rate fluctuations is minimal.
Client Services : 03-2778 100042
Eastspring Investments Dynamic Fund

Stock/Issuer risk
This risk refers to the individual risk of the respective companies issuing the securities. Specific risk includes but is not limited to changes in consumer tastes and demand, legal suits, competitive operating environments, changing industry conditions and management omissions and errors. However, this risk is minimised through investing in a wide range of companies in different sectors and thus function independently from one another.
Liquidity risk
Liquidity risk is the risk that the Fund will encounter difficulty in meeting its financial obligations. Generally, all investments are subject to a certain degree of liquidity risk depending on the nature of the investment instruments, market, sector and other factors. For the purpose of the Fund, the Fund Manager will attempt to balance the entire portfolio by investing in a mix of assets with satisfactory trading volume and those that occasionally could encounter poor liquidity. This is expected to reduce the risks for the entire portfolio without limiting the Fund’s growth potentials.
The Fund maintains sufficient level of liquid assets, after consultation with the Trustee, to meet anticipated payments and cancellations of units by unit holders. Liquid assets comprise bank balance, deposits with licensed financial institutions and other instruments which are capable of being converted into cash within 7 days.
43Client Services : 03-2778 1000
Annual Report

The table below summarises the Fund’s financial liabilities into relevant maturity groupings based on the remaining period as at the statement of financial position date to the contractual maturity date. The amounts in the table are the contractual undiscounted cash flows.
Less than1 month
Between1 monthto 1 year Total
RM RM RM
2019
Amount due to Manager 108,438 - 108,438Amount due to brokers 272,072 - 272,072Accrued management fee 56,212 - 56,212Amount due to Trustee 3,148 - 3,148Other payables and accruals - 24,592 24,592Contractual cash outflows 439,870 24,592 464,462
2018
Amount due to Manager 79,221 - 79,221Amount due to brokers 979,333 - 979,333Accrued management fee 73,245 - 73,245Amount due to Trustee 4,102 - 4,102Distribution payable 64,580 - 64,580Other payables and accruals - 25,687 25,687Contractual cash outflows 1,200,481 25,687 1,226,168
Client Services : 03-2778 100044
Eastspring Investments Dynamic Fund
Non-compliance risk
Non-compliance risk arises when the Manager and others associated with the Fund are not compliant to the rules set out in the Fund’s constitution or the law that governs the Fund or applicable internal control procedures, or act fraudulently or dishonestly.
The non-compliance may expose the Fund to higher risks which may result in a fall in the value of the Fund which in turn may affect its investment goals. However, the risk can be mitigated by the internal controls and compliance monitoring undertaken by the Manager.
Fund management risk
There is the risk that the management company may not adhere to the investment mandate of the respective Fund. With close monitoring by the investment committee, back office system being incorporated with limits and controls, and regular reporting to the senior management team, the management company is able to manage such risk. The Trustee have an oversight function over management of the Fund by the management company to safeguard the interests of unit holders.
Capital risk
The capital of the Fund is represented by equity consisting of unit holders’ capital of RM24,587,877 (2018: RM39,910,819) and retained earnings of RM30,496,296 (2018: RM31,314,361). The amount of equity can change significantly on a daily basis as the Fund is subject to daily subscriptions and redemptions at the discretion of unit holders. The Fund’s objective when managing capital is to safeguard the Fund’s ability to continue as a going concern in order to provide returns for unit holders and benefits for other stakeholders and to maintain a strong capital base to support the development of the investment activities of the Fund.
45Client Services : 03-2778 1000
Annual Report

Credit/Default risk
Credit risk refers to the ability of an issuer or a counter party to make timely payments of interest, principals and proceeds from realisation of investments. In the case of the Fund, both the Manager and the External Fund Manager regularly review the ratings assigned to the Issuer so that the necessary steps can be taken if the ratings fall below those prescribed by the Securities Commission.
The credit risk arising from placements of deposits in licensed financial institutions is managed by ensuring that the Fund will only place deposits in reputable licensed financial institutions. For amount due from brokers, the settlement terms are governed by the relevant rules and regulations as prescribed by Bursa Securities. The settlement terms of the proceeds from the creation of units receivable from the Manager are governed by the SC Guidelines on Unit Trust Funds.
The credit/default risk is minimal as all transactions in quoted securities are settled/paid upon delivery using approved brokers.
The Fund seeks to mitigate credit/default risk by investing in high quality fixed income securities.
Client Services : 03-2778 100046
Eastspring Investments Dynamic Fund

Th
e fo
llow
ing
tabl
e se
ts o
ut t
he c
redi
t ris
k co
ncen
trat
ions
and
cou
nter
part
ies
of t
he F
und.
Fin
anci
al a
sset
s at
fa
ir v
alu
e th
rou
gh
p
rofi
t o
r lo
ss
Cas
h
and
cas
h
equ
ival
ents
Am
ou
nt
du
e fr
om
b
roke
rsD
ivid
end
s re
ceiv
able
Am
ou
nt
du
e fr
om
M
anag
erTo
tal
RM
RM
RM
RM
RM
RM
2019
Con
sum
er P
rodu
cts
&
Ser
vice
s-
NR
--
-56
,270
-56
,270
Fina
ncia
l Ser
vice
s-
AA
A-
7,69
1,95
9 -
--
7,69
1,95
9-
AA
1-
204,
942
--
-20
4,94
2-
NR
--
-18
,900
-18
,900
Tech
nolo
gy-
NR
--
-13
,194
-13
,194
Unq
uote
d fix
ed
inc
ome
secu
ritie
s-
AA
A1,
025,
141
--
--
1,02
5,14
1-
AA
-IS1,
087,
946
--
--
1,08
7,94
6-
A1
1,03
3,04
4-
--
-1,
033,
044
- N
R2,
134,
848
--
--
2,13
4,84
8O
ther
- N
R-
--
-13
,456
13,4
565,
280,
979
7,89
6,90
1-
88,3
6413
,456
13,2
79,7
00
47Client Services : 03-2778 1000
Annual Report
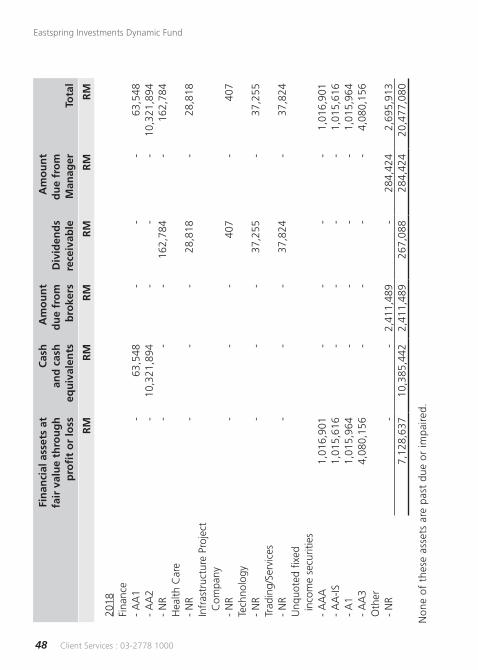
Fin
anci
al a
sset
s at
fair
val
ue
thro
ug
hp
rofi
t o
r lo
ss
Cas
han
d c
ash
equ
ival
ents
Am
ou
nt
du
e fr
om
bro
kers
Div
iden
ds
rece
ivab
le
Am
ou
nt
du
e fr
om
Man
ager
Tota
l
RM
RM
RM
RM
RM
RM
2018
Fi
nanc
e-
AA
1-
63,5
48-
--
63,5
48-
AA
2 -
10,3
21,8
94-
--
10,3
21,8
94-
NR
--
-16
2,78
4-
162,
784
Hea
lth C
are
- N
R-
--
28,8
18-
28,8
18In
fras
truc
ture
Pro
ject
Com
pany
- N
R-
--
407
-40
7Te
chno
logy
- N
R-
--
37,2
55-
37,2
55Tr
adin
g/Se
rvic
es-
NR
--
-37
,824
-37
,824
Unq
uote
d fix
ed
inc
ome
secu
ritie
s-
AA
A1,
016,
901
--
--
1,01
6,90
1-
AA
-IS1,
015,
616
--
--
1,01
5,61
6-
A1
1,01
5,96
4-
--
-1,
015,
964
- A
A3
4,08
0,15
6-
--
-4,
080,
156
Oth
er-
NR
--
2,41
1,48
9-
284,
424
2,69
5,91
37,
128,
637
10,3
85,4
422,
411,
489
267,
088
284,
424
20,4
77,0
80
N
on
e o
f th
ese
asse
ts a
re p
ast
du
e o
r im
pai
red
.
Client Services : 03-2778 100048
Eastspring Investments Dynamic Fund

Fair value estimation
Fair value is defined as the price that would be received to sell an asset or paid to transfer a liability in an orderly transaction between market participants at the measurement date (i.e. an exit price).
The fair value of financial assets traded in active market (such as trading securities) are based on quoted market prices at the close of trading on the year end date. The Fund utilises the last traded market price for financial assets where the last traded price falls within the bid-ask spread. In circumstances where the last traded price is not within the bid-ask spread, the Manager will determine the point within the bid-ask spread that is representative of the fair value.
An active market is a market in which transactions for the asset take place with sufficient frequency and volume to provide pricing information on an ongoing basis.
The fair value of financial assets that are not traded in an active market is determined by using valuation techniques.
Fair value hierarchy
i. The table below analyses financial instruments carried at fair value by valuation method. The different levels have been defined as follows:
• Level 1: Quoted prices (unadjusted) in active market for identical assets or liabilities.
• Level 2: Inputs other than quoted prices included within Level 1 that are observable for the asset or liability, either directly (that is, as prices) or indirectly (that is, derived from prices).
• Level 3: Inputs for the asset and liability that are not based on observable market data (that is, unobservable inputs).
The level in the fair value hierarchy within which the fair value measurement is categorised in its entirety is determined on the basis of the lowest level input that is significant to the fair value measurement in its entirety. For this purpose, the significance of an input is assessed against the fair value measurement in its entirety. If a fair value measurement uses observable inputs that require significant adjustment based on unobservable inputs, that measurement is a Level 3 measurement.
49Client Services : 03-2778 1000
Annual Report

Assessing the significance of a particular input to the fair value measurement in its entirety requires judgment, considering factors specific to the asset or liability.
The determination of what constitutes ‘observable’ requires significant judgment by the Fund. The Fund considers observable data to be that market data that is readily available, regularly distributed or updated, reliable and verifiable, not proprietary, and provided by independent sources that are actively involved in the relevant market.
The following table analyses within the fair value hierarchy the Fund’s financial assets (by class) measured at fair value:
Level 1 Level 2 Level 3 Total
RM RM RM RM
2019
Financial assets at fair value through profit or loss: Quoted securities 42,268,935 - - 42,268,935 Unquoted fixed income securities - 5,280,979 - 5,280,979
42,268,935 5,280,979 - 47,549,914
2018Financial assets at fair value through profit or loss: Quoted securities 51,976,378 - - 51,976,378 Unquoted fixed income securities - 7,128,637 - 7,128,637
51,976,378 7,128,637 - 59,105,015 Investments whose values are based on quoted market prices in active markets,
and are therefore classified within Level 1, includes active quoted securities. The Fund does not adjust the quoted prices for these instruments. The Fund’s policies on valuation of these financial assets are stated in Note E to the financial statements.
Client Services : 03-2778 100050
Eastspring Investments Dynamic Fund

Financial instruments that trade in markets that are considered to be active but are valued based on quoted market prices, dealer quotations or alternative pricing sources supported by observable inputs are classified within Level 2. These include unquoted fixed income securities. As Level 2 instruments include positions that are not traded in active markets and/or are subject to transfer restrictions, valuations may be adjusted to reflect illiquidity and/or non-transferability, which are generally based on available market information. The Fund’s policies on valuation of these financial assets are stated in Note E to the financial statements.
iii. The carrying value of amount due from Manager, dividends receivable, cash and cash equivalents and all liabilities are a reasonable approximation of their fair values due to their short term nature.
3. MANAGEMENT FEE
In accordance with the Deed, the Manager is entitled to a management fee at a rate not exceeding 3.00% per annum of the net asset value of the Fund accrued and calculated on daily basis.
For the financial year ended 30 June 2019, the management fee is recognised at a rate of 1.25% (2018: 1.25%) per annum of the net asset value of the Fund, calculated on daily basis.
There will be no further liability to the Manager in respect of the management fee other than the amounts recognised above.
4. TRUSTEE FEE
In accordance with the Deed, the Trustee is entitled to an annual fee at a rate not exceeding 0.20% per annum of the net asset value of the Fund, subject to a minimum fee of RM18,000 per annum.
For the financial year ended 30 June 2019, the Trustee fee is recognised at a rate of 0.07% (2018: 0.07%) per annum of the net asset value of the Fund, inclusive of local custodian fee, calculated on daily basis.
There will be no further liability to the Trustee in respect of the trustee fee other than the amounts recognised above.
51Client Services : 03-2778 1000
Annual Report

5. TAXATION
2019 2018
RM RM
Tax charged for the financial year: Current taxation – local 7,250 6,185 Overprovision of taxation in prior years (2,110) -
5,140 6,185
The numerical reconciliation between profit/(loss) before taxation multiplied by the Malaysian statutory tax rate and tax expense of the Fund is as follows:
2019 2018
RM RM
Profit/(loss) before taxation 1,589,158 (4,058,383)
Tax at Malaysian statutory rate of 24% (2018:24%) 381,398 (974,012)
Tax effects of: (Investment income exempt from tax)/ investment loss not deductible for tax purposes (611,223) 667,672 Expenses not deductible for tax purposes 60,856 113,893 Restriction on tax deductible expenses for Unit Trust Funds 186,369 207,291 Income subject to different tax rate (10,150) (8,659) Overprovision of taxation in previous years (2,110) -
Taxation 5,140 6,185
Client Services : 03-2778 100052
Eastspring Investments Dynamic Fund

6. DISTRIBUTION
2019 2018
RM RM
Distribution to unit holders is from the following sources:
Dividend income 1,270,470 1,778,652Interest income 633,798 773,725Net amortisation of premiums on fixed
income securities (9,139) (10,341)Net realised gain on sale of investments 2,058,422 -Prior financial year’s realised income - 1,947,533Dividend Equalisation (555,554) -Gross realised income 3,397,997 4,489,569Less: Expenses (995,914) (1,208,810)Less: Prior financial year’s taxation - (220,544)
2,402,083 3,060,215
Gross distribution per unit (RM) 0.0402 0.0439
Net distribution per unit (RM) 0.0402 0.0409
Ex-date 19 June 2019 25 June 2018
Gross distribution per unit is derived from gross realised income less expenses divided by the number of units in circulation, while net distribution per unit is derived from gross realised income less expenses and taxation divided by the number of units in circulation.
There are unrealised loss of RM6,903,561 during the financial year (2018: unrealised loss of RM3,386,141).
53Client Services : 03-2778 1000
Annual Report

7. FINANCIAL ASSETS AT FAIR VALUE THROUGH PROFIT OR LOSS
2019 2018
RM RM
Designated at fair value through profit or loss: Quoted securities (Note 7(i)) 42,268,935 51,976,378 Unquoted fixed income securities (Note 7(ii)) 5,280,979 7,128,637
47,549,914 59,105,015
Net gain/(loss) on financial assets at fair value through profit or loss: Realised gain/(loss) on disposals 7,222,223 (1,141,478) Change in unrealised fair value loss (6,903,561) (3,386,141)
318,662 (4,527,619)
i. Quoted securities
Name of counter QuantityAggregate
cost
Fair value as at
30.6.2019
Percentage of net asset
value of the Fund
Units RM RM %
Consumer Products & Services
Bermaz Auto Berhad 72,000 165,571 191,520 0.35 DRB-HICOM Berhad 256,000 545,713 563,200 1.02 Genting Berhad 362,000 2,820,938 2,450,740 4.45 Genting Malaysia Berhad 691,000 2,935,173 2,238,840 4.06 Leong Hup International
Berhad 20,500 22,550 20,910 0.04 Padini Holdings Berhad 66,000 286,942 238,920 0.43 Panasonic Manufacturing
Malaysia Berhad 12,800 485,465 504,320 0.92 Petronas Dagangan
Berhad 50,000 1,314,298
1,270,000 2.31 PPB Group Berhad 58,000 983,618 1,084,600 1.97 Sime Darby Berhad 513,000 1,226,429 1,159,380 2.10
2,101,300 10,786,697 9,722,430 17.65
Client Services : 03-2778 100054
Eastspring Investments Dynamic Fund

i. Quoted securities (continued)
Name of counter QuantityAggregate
cost
Fair value as at
30.6.2019
Percentage of net asset
value of the Fund
Units RM RM %
EnergyDialog Group Berhad 187,000 415,437 609,620 1.11Serba Dinamik Holdings
Berhad 40,000 165,248 161,200 0.29227,000 580,685 770,820 1.40
Financial ServicesAMMB Holdings Berhad 126,000 551,202 532,980 0.97 Bursa Malaysia Berhad 190,700 1,451,953 1,334,900 2.42 CIMB Group Holdings
Berhad 559,027 3,601,941 3,007,565 5.46 Hong Leong Bank Berhad 28,000 527,629 532,000 0.97 Hong Leong Financial
Group Berhad 32,400 585,011 600,696 1.09 Malayan Banking Berhad 426,258 4,304,943 3,785,171 6.87 Public Bank Berhad 136,000 3,320,673 3,128,000 5.68 RHB Bank Berhad 95,700 527,120 534,963 0.97
1,594,085 14,870,472 13,456,275 24.43
Health CareHartalega Holdings
Berhad 200,000 1,291,070 1,048,000 1.90 Kossan Rubber Industries
Berhad 414,000 1,439,934 1,651,860 3.00 Supermax Corporation
Berhad 325,000 510,120 542,750 0.99 Top Glove Corporation
Berhad 220,000 1,218,903 1,080,200 1.96 1,159,000 4,460,027 4,322,810 7.85
55Client Services : 03-2778 1000
Annual Report

i. Quoted securities (continued)
Name of counter QuantityAggregate
cost
Fair value as at
30.6.2019
Percentage of net asset
value of the Fund
Units RM RM %
Industrial Products & Services
ATA IMS Berhad 63,400 107,146 100,172 0.18 HSS Engineers Berhad 155,000 174,561 179,800 0.33 Petronas Chemicals
Group Berhad 128,000 1,185,139 1,075,200 1.95 346,400 1,466,846 1,355,172 2.46
PlantationKuala Lumpur Kepong
Berhad 22,000 546,792 540,320 0.98Sime Darby Plantation
Berhad 255,000 1,214,770 1,254,600 2.28277,000 1,761,562 1,794,920 3.26
PropertyMalaysian Resources
Corporation Berhad 283,000 270,303 268,850 0.49Sentoria Group Berhad 317,560 79,390 19,054 0.03
600,560 349,693 287,904 0.52
REITSIGB Real Estate
Investment Trust 346,000 587,854 660,860 1.20KIP Real Estate
Investment Trust 916,600 918,543 769,944 1.401,262,600 1,506,397 1,430,804 2.60
Client Services : 03-2778 100056
Eastspring Investments Dynamic Fund

i. Quoted securities (continued)
Name of counter QuantityAggregate
cost
Fair value as at
30.6.2019
Percentage of net asset
value of the Fund
Units RM RM %
TechnologyGlobetronics Technology
Berhad 469,200 1,103,033 783,564 1.42 Inari Amertron Berhad 381,000 301,855 609,600 1.11 Malaysian Pacific
Industries Berhad 24,900 220,614 229,578 0.42 875,100 1,625,502 1,622,742 2.95
Telecommunications & Media
Astro Malaysia Holdings Berhad 190,000 283,442 275,500 0.50
Axiata Group Berhad 185,000 812,507 921,300 1.67 Digi.Com Berhad 148,000 658,621 747,400 1.36 Maxis Berhad 110,000 626,549 612,700 1.11 Telekom Malaysia Berhad 40,000 108,544 160,000 0.29 TIME dotCom Berhad 47,400 382,823 425,178 0.77
720,400 2,872,486 3,142,078 5.70
Transportation & LogisticsMalaysia Airport Holdings
Berhad 34,000 285,037 290,020 0.53MMC Corporation
Berhad 266,000 281,508 303,240 0.55300,000 566,545 593,260 1.08
57Client Services : 03-2778 1000
Annual Report

i. Quoted securities (continued)
Name of counter QuantityAggregate
cost
Fair value as at
30.6.2019
Percentage of net asset
value of the Fund
Units RM RM %
UtilitiesGas Malaysia Berhad 95,000 271,217 269,800 0.49 Petronas Gas Berhad 31,000 545,600 538,160 0.98 Tenaga Nasional Berhad 214,000 3,112,141 2,961,760 5.38
340,000 3,928,958 3,769,720 6.85
TOTAL QUOTED SECURITIES 9,803,445 44,775,870 42,268,935 76.75
ACCUMULATED UNREALISED LOSS ON
FINANCIAL ASSETS AT FAIR VALUE
THROUGH PROFIT OR LOSS (2,506,935)
FAIR VALUE OF FINANCIAL ASSETS
AT FAIR VALUE THROUGH PROFIT 42,268,935
OR LOSS
Client Services : 03-2778 100058
Eastspring Investments Dynamic Fund

i. Quoted securities
Name of counter QuantityAggregate
cost
Fair value as at
30.6.2018
Percentage of net asset
value of the Fund
Units RM RM %
ConstructionGabungan AQRS Berhad 991,900 1,655,922 1,190,279 1.67Malaysian Resources
Corporation Berhad 70,001 - 14,700 0.02WCT Holdings Berhad 472,800 585,752 382,968 0.54
1,534,701 2,241,674 1,587,947 2.23
ConsumerPanasonic Manufacturing
Malaysia Berhad 12,800 485,465 477,952 0.67
FinanceBursa Malaysia Berhad 190,700 1,451,953 1,401,645 1.97CIMB Group Holdings
Berhad 743,750 4,821,145 4,053,438 5.69Hong Leong Bank Berhad 41,000 734,105 746,200 1.05Hong Leong Financial
Group Berhad 29,600 532,800 532,800 0.75Malayan Banking Berhad 412,700 4,192,724 3,714,300 5.21Public Bank Berhad 140,000 3,404,502 3,270,400 4.59RHB Bank Berhad 50,000 271,000 273,000 0.38Syarikat Takaful Malaysia
Berhad 322,300 1,314,829 1,269,862 1.781,930,050 16,723,058 15,261,645 21.42
59Client Services : 03-2778 1000
Annual Report

i. Quoted securities (continued)
Name of counter QuantityAggregate
cost
Fair valueas at
30.6.2018
Percentage of net
asset valueof the Fund
Units RM RM %
Health CareIHH Healthcare Berhad 219,400 1,048,917 1,338,340 1.88Kossan Rubber Industries
Berhad 270,600 1,827,920 2,283,864 3.21Top Glove Corporation
Berhad 122,600 578,158 1,488,364 2.09612,600 3,454,995 5,110,568 7.18
Industrial ProductCahya Mata Sarawak
Berhad 135,800 572,749 319,130 0.45
Infrastructure Project Company
Digi.Com Berhad 373,100 1,660,348 1,548,365 2.17
ManufacturingPecca Group Berhad 357,500 569,369 311,025 0.44
PropertyS P Setia Berhad 336,682 1,030,028 1,043,714 1.47Sentoria Group Berhad 417,560 104,390 73,073 0.10
754,242 1,134,418 1,116,787 1.57
REITSKIP Real Estate
Investment Trust 916,600 918,543 733,280 1.03
Client Services : 03-2778 100060
Eastspring Investments Dynamic Fund

i. Quoted securities (continued)
Name of counter QuantityAggregate
cost
Fair valueas at
30.6.2018
Percentage of net
asset valueof the Fund
Units RM RM %
TechnologyInari Amertron Berhad 1,563,433 1,238,661 3,533,359 4.96Pentamaster Corporation
Berhad 178,000 341,104 436,100 0.61Unisem (M) Berhad 670,900 1,375,984 1,549,779 2.18Vitrox Corporation
Berhad 408,000 589,328 2,276,640 3.202,820,333 3,545,077 7,795,878 10.95
Trading/ServicesAirasia Group Berhad 265,200 903,660 792,948 1.11Dialog Group Berhad 1,461,800 3,247,517 4,516,962 6.34Genting Berhad 170,000 1,471,017 1,429,700 2.01Genting Malaysia Berhad 346,800 1,732,180 1,692,384 2.38MY E.G. Services Berhad 908,800 933,420 876,992 1.23Serba Dinamik Holdings
Berhad 742,000 1,817,422 2,411,500 3.39Sime Darby Berhad 384,700 942,887 942,515 1.32Tenaga Nasional Berhad 345,000 5,017,237 5,050,800 7.09
4,624,300 16,065,340 17,713,801 24.87
61Client Services : 03-2778 1000
Annual ReportAnnual Report

i. Quoted securities (continued)
Name of counter QuantityAggregate
cost
Fair valueas at
30.6.2018
Percentage of net
asset valueof the Fund
Units RM RM %
TOTAL QUOTED SECURITIES 14,072,026 47,371,036 51,976,378 72.98
ACCUMULATED UNREALISED GAIN ON
FINANCIAL ASSETS AT FAIR VALUE
THROUGH PROFIT OR LOSS 4,605,342
FAIR VALUE OF FINANCIAL ASSETS
AT FAIR VALUE THROUGH PROFIT
OR LOSS 51,976,378
Client Services : 03-2778 100062
Eastspring Investments Dynamic Fund

ii. Unquoted fixed income securities
Name of counterNominal
valueAggregate
cost
Fair value as at
30.6.2019
Percentage of net asset
value of the Fund
RM RM RM %
5.03% Affin Bank Berhad 20.9.2022 (A1) 1,000,000 1,014,194 1,033,044 1.884.53% Danainfra Nasional Berhad 1.4.2037 (NR) 2,000,000 2,022,588 2,134,848 3.885.10% Gulf Investment Corporation G.S.C. 16.3.2021 (AAA) 1,000,000 1,016,269 1,025,141 1.865.09% Southern Power Generation Sdn Berhad 30.4.2029 (AA-IS) 1,000,000 1,008,646 1,087,946 1.98
TOTAL UNQUOTED FIXED INCOME
SECURITIES 5,000,000 5,061,697 5,280,979 9.60
ACCUMULATED UNREALISED GAIN ON
FINANCIAL ASSETS AT FAIR VALUE
THROUGH PROFIT OR LOSS 219,282
FAIR VALUE OF FINANCIAL
ASSETS AT FAIR VALUE THROUGH
PROFIT OR LOSS 5,280,979
63Client Services : 03-2778 1000
Annual Report

ii. Unquoted fixed income securities
Name of counterNominal
valueAggregate
cost
Fair value as at
30.6.2018
Percentage of net asset
value of the Fund
RM RM RM %
5.03% Affin Bank Berhad 20.9.2022 (A1) 1,000,000 1,014,194 1,015,964 1.435.25% Bumitama Agri Ltd 18.3.2019 (AA3) 4,000,000 4,077,771 4,080,156 5.735.10% Gulf Investment Corporation G.S.C. 16.3.2021 (AAA) 1,000,000 1,017,460 1,016,901 1.435.09% Southern Power Generation Sdn Berhad 30.4.2029 (AA-IS) 1,000,000 1,008,646 1,015,616 1.43
TOTAL UNQUOTED FIXED INCOME
SECURITIES 7,000,000 7,118,071 7,128,637 10.02
ACCUMULATED UNREALISED GAIN ON
FINANCIAL ASSETS AT FAIR VALUE
THROUGH PROFIT OR LOSS 10,566
FAIR VALUE OF FINANCIAL
ASSETS AT FAIR VALUE THROUGH
PROFIT OR LOSS 7,128,637
Client Services : 03-2778 100064
Eastspring Investments Dynamic Fund

The effective weighted average interest rate of unquoted fixed income securities per annum as at the date of the statement of financial position are as follows:
2019 2018
% %
Unquoted fixed income securities 4.12 4.93
8. CASH AND CASH EQUIVALENTS
2019 2018
RM RM
Bank balance with a licensed bank 204,942 63,548Deposit with a licensed financial institution 7,691,959 10,321,894
7,896,901 10,385,442
The effective weighted average interest rate of short-term deposit with a licensed financial institution per annum as at the date of statement of financial position are as follows:
2019 2018
% %
Deposit with a licensed financial institution 3.10 3.35
The deposits have an average maturity of 1 day (2018: 2 days).
65Client Services : 03-2778 1000
Annual Report

9. UNITS IN CIRCULATION
2019 2018
No. of units No. of units
At the beginning of the financial year 78,255,724 53,943,237Creation of units during the financial year: Arising from applications 5,570,502 31,711,859 Arising from distribution 2,661,444 3,307,170Cancellation of units during the financial year (24,204,311) (10,706,542)At the end of the financial year 62,283,359 78,255,724
Client Services : 03-2778 100066
Eastspring Investments Dynamic Fund

10. TRANSACTIONS WITH BROKERS/DEALERS Details of transactions with the top 10 brokers and dealers are as follows:
Name of brokers/dealers
Valueof trades
Percentage of total trades
Brokerage fees
Percentage of total
brokerage fees
RM % RM %
2019
Maybank Investment Bank Berhad 14,054,410 20.16 29,616 21.70
CIMB Investment Bank Berhad 8,576,643 12.31 17,567 12.87
Affin Hwang Investment Bank Berhad 7,000,794 10.04 14,183 10.39
KAF Seagroatt & Campbell Securities Sdn Bhd 6,731,137 9.66 13,592 9.96
UOB Kay Hian Securities (M) Sdn Bhd 5,365,896 7.70 10,915 8.00
CLSA Securities Malaysia Sdn Bhd 4,910,399 7.05 9,943 7.29
RHB Investment Bank Berhad 4,074,824 5.85 4,207 3.08
AmInvestment Bank Berhad 3,091,725 4.44 6,570 4.81
Credit Suisse Securities (Malaysia) Sdn Bhd 2,812,412 4.04 5,697 4.18
Citigroup Global Markets (M) Sdn Bhd 2,621,629 3.76 5,329 3.91
Others 10,459,281 14.99 18,833 13.81
69,699,150 100.00 136,452 100.00
67Client Services : 03-2778 1000
Annual Report

Name of brokers/dealers
Valueof trades
Percentage of total trades
Brokerage fees
Percentage of total
brokerage fees
RM % RM %
2018
Affin Hwang Investment Bank Berhad 12,141,798 10.96 30,217 10.79
RHB Investment Bank Berhad 12,071,459 10.89 31,681 11.31
Maybank Investment Bank Berhad 11,324,276 10.22 40,290 14.38
Credit Suisse Securities (Malaysia) Sdn Bhd 10,549,346 9.52 27,581 9.85
Inter-Pacific Securities Sdn Bhd 7,845,030 7.08 20,287 7.24
Nomura Securities Malaysia Sdn Bhd 7,833,749 7.07 20,492 7.32
CIMB Investment Bank Berhad 7,521,777 6.79 17,778 6.35
UOB Kay Hian Securities (M) Sdn Bhd 7,063,999 6.37 18,618 6.65
Hong Leong Investment Bank Berhad 5,375,573 4.85 13,457 4.80
Kenanga Investment Bank Berhad 5,039,129 4.55 13,174 4.70
Others 24,067,042 21.70 46,557 16.61
110,833,178 100.00 280,132 100.00
All brokers and dealers highlighted above are not related to the Manager.
Client Services : 03-2778 100068
Eastspring Investments Dynamic Fund

11. UNITS HELD BY THE MANAGER
The related party of and its relationship with the Fund are as follows:
Related party Relationship
Eastspring Investments Berhad The Manager
2019 2018
No. of units RM No. of units RM
Eastspring Investments Berhad 1,451 1,283 3,421 3,114
The above units were transacted at the prevailing market price.
The units are held legally by the Manager and are within the prescribed limit allowed by SC’s Guidelines on Unit Trust Funds. Other than the above, there were no units held by the Directors or parties related to the Manager.
69Client Services : 03-2778 1000
Annual Report

12. MANAGEMENT EXPENSE RATIO (“MER”)
2019 2018
% %
MER 1.38 1.45
MER is derived from the following calculation:
MER = (A + B + C + D + E)X 100
F
A = Management fee
B = Trustee fee
C = Audit fee
D = Tax agent fee
E = Other expenses (excluding transaction cost)
F = Average net asset value of the Fund calculated on a daily basis
The average net asset value of the Fund for the financial year calculated on a daily basis is RM61,536,660 (2018: RM68,510,363).
13. PORTFOLIO TURNOVER RATIO (“PTR”)
2019 2018
PTR (times) 0.57 0.81
PTR is derived from the following calculation:
(Total acquisitions for the financial year + total disposals for the financial year) ÷ 2Average net asset value of the Fund for the financial year calculated on a daily basis
where: total acquisitions for the financial year = RM31,439,482 (2018: RM63,462,805)
total disposals for the financial year = RM38,259,668 (2018: RM48,013,636)
Client Services : 03-2778 100070
Eastspring Investments Dynamic Fund

14. SEGMENTAL INFORMATION
The internal reporting provided to the chief operating decision-maker for the Fund’s assets, liabilities and performance is prepared on a consistent basis with the measurement and recognition principles of MFRS and IFRS. The chief operating decision-maker is responsible for the performance of the Fund and considers the business to have a single operating segment located in Malaysia. Asset allocation decisions are based on a single, integrated investment strategy and the Fund’s performance is evaluated on an overall basis.
The reportable operating segments derives its income by seeking investments to achieve targeted returns consummate with an acceptable level of risk within each portfolio. These returns consist of interest income, dividends income and gains on the appreciation in the value of investments.
The Fund has a diversified unit holder population. As at 30 June 2019, there were nil unit holder (2018: 1 unit holder) who held more than 10% of the Fund’s NAV. The unit holder holding as of 30 June 2018 was 24.19%.
There were no changes in the reportable operating segment during the financial year.
71Client Services : 03-2778 1000
Annual Report

15. MFRS 9 FINANCIAL INSTRUMENTS
As disclosed in Note A, the Fund has adopted MFRS 9, which resulted in changes to the accounting policies and adjustments to the financial position. The main changes are as follows.
a. Classification and measurement of financial assets
Up to 30 June 2018, financial assets were classified in the following categories: financial assets at fair value through profit or loss (“FVTPL”) and loans and receivables. Note E sets out the details of accounting policies for classification and measurement of financial instruments under MFRS 139.
From 1 July 2018, the Fund has applied the following MFRS 9’s classification approach to all types of financial assets:
• Investments in equity instruments: These instruments are always measured at fair value with changes in fair value presented in profit or loss unless the Fund has made an irrevocable choice to present changes in fair value in other comprehensive income (“OCI”) for investments that are not held for trading.
• Investments in debt instruments: There are 3 subsequent measurement categories: amortised cost, fair value with changes either recognised through other comprehensive income (“FVOCI”) or through profit or loss (“FVTPL”).
b. Impairment
From 1 July 2018 onwards, the Fund measures credit risk and expected credit losses using probability of default, exposure at default and loss given default. Management considers both historical analysis and forward looking information in determining any expected credit loss. Management consider the probability of default to be close to zero as these instruments have a low risk of default and the counterparties have a strong capacity to meet their contractual obligations in the near term. As a result, no loss allowance has been recognised based on 12 months expected credit losses as any such impairment would be wholly insignificant to the Fund.
Client Services : 03-2778 100072
Eastspring Investments Dynamic Fund

Significant increase in credit risk
A significant increase in credit risk is defined by management as any contractual payment which is more than 30 days past due.
Definition of default and credit-impaired financial assets
Any contractual payment which is more than 90 days past due is considered credit impaired.
As disclosed above, the adoption of MFRS 9 in 2018 resulted in reclassification and change in measurement of certain financial assets and financial liabilities.
73Client Services : 03-2778 1000
Annual Report

The
mea
sure
men
t ca
tego
ry a
nd t
he c
arry
ing
amou
nt o
f fin
anci
al a
sset
s an
d fin
anci
al li
abili
ties
in a
ccor
danc
e w
ith M
FRS
139
and
MFR
S 9
at 1
Jul
y 20
18 a
re c
ompa
red
as f
ollo
ws:
Mea
sure
men
t ca
teg
ory
C
arry
ing
am
ou
nt
Ori
gin
al(M
FRS1
39)
New
(MFR
S 9)
O
rig
inal
(MFR
S139
)R
ecla
ssif
icat
ion
sR
emea
sure
men
ts
N
ew(M
FRS
9)
RM
RM
RM
RM
Ass
ets
Cas
h an
d ca
sh
equi
vale
nts
Loan
s an
d re
ceiv
able
sA
mor
tised
co
st10
,385
,442
--
10,3
85,4
42
Inve
stm
ent
in
unqu
oted
fix
ed in
com
e se
curit
ies
FVTP
LFV
TPL
7,12
8,63
7-
-7,
128,
637
Inve
stm
ent
in e
quity
se
curit
ies
FVTP
LFV
TPL
51,9
76,3
78-
-51
,976
,378
Am
ount
due
fr
om b
roke
rsLo
ans
and
rece
ivab
les
Am
ortis
ed
cost
2,41
1,48
9-
-2,
411,
489
Am
ount
due
fr
om M
anag
erLo
ans
and
rece
ivab
les
Am
ortis
ed
cost
284,
424
--
284,
424
Div
iden
ds
rece
ivab
leLo
ans
and
rece
ivab
les
Am
ortis
ed
cost
267,
088
--
267,
088
Client Services : 03-2778 100074
Eastspring Investments Dynamic Fund

Mea
sure
men
t ca
teg
ory
C
arry
ing
am
ou
nt
Ori
gin
al(M
FRS1
39)
New
(MFR
S 9)
O
rig
inal
(MFR
S139
)R
ecla
ssif
icat
ion
sR
emea
sure
men
ts
N
ew(M
FRS
9)
RM
RM
RM
RM
Liab
iliti
es
Am
ount
due
to
Man
ager
Am
ortis
ed
cost
Am
ortis
ed
cost
79,2
21-
-79
,221
Am
ount
due
to
brok
ers
Am
ortis
ed
cost
Am
ortis
ed
cost
979,
333
--
979,
333
Acc
rued
m
anag
emen
t fe
eA
mor
tised
co
stA
mor
tised
co
st73
,245
--
73,2
45
Am
ount
due
to
Trus
tee
Am
ortis
ed
cost
Am
ortis
ed
cost
4,10
2-
-4,
102
Dis
trib
utio
n pa
yabl
eA
mor
tised
co
stA
mor
tised
co
st64
,580
--
64,5
80
Tax
paya
ble
Am
ortis
ed
cost
Am
ortis
ed
cost
2,11
0-
-2,
110
Oth
er p
ayab
les
and
accr
uals
Am
ortis
ed
cost
Am
ortis
ed
cost
25,6
87-
-25
,687
75Client Services : 03-2778 1000
Annual Report

16. CHANGE IN COMPARATIVES
There has been a change in comparatives due to a recognition on the transaction cost of the quoted securities.
The effects of the changes in comparatives are set out below:
As previously stated
Effects of changes in
comparatives As restated
RM RM RM
Impact on the Statement of Comprehensive Income for the financial year ended 30 June 2018 (Extract):
Profit after taxation is made up of the following: Realised amount (932,035) 253,608 (678,427) Unrealised amount (3,132,533) (253,608) (3,386,141)
(4,064,568) (4,064,568)
17. APPROVAL OF FINANCIAL STATEMENTS
The financial statements have been approved for issue by the Manager on 15 August 2019.
Client Services : 03-2778 100076
Eastspring Investments Dynamic Fund

THE MANAGERNAME
EASTSPRING INVESTMENTS BERHAD
COMPANY NO.
531241-U
REGISTERED OFFICE
Level 25, Menara Hong Leong
No. 6, Jalan Damanlela
Bukit Damansara
50490 Kuala Lumpur
BUSINESS OFFICE
Level 22, Menara Prudential
Persiaran TRX Barat
55188 Tun Razak Exchange
Kuala Lumpur
TELEPHONE NO.
603-2778 3888
FAX NO.
603-2789 7220
WEBSITE
www.eastspring.com/my
TRUSTEENAME
DEUTSCHE TRUSTEES MALAYSIA BERHAD
COMPANY NO.
763590-H
REGISTERED OFFICE & BUSINESS OFFICE
Level 20, Menara IMC
No. 8, Jalan Sultan Ismail
50250 Kuala Lumpur
TELEPHONE NO.
603-2053 7522
FAX NO.
603-2053 7526
SALE & PURCHASE OF UNITSEastspring Investments BerhadLevel 22, Menara Prudential
Persiaran TRX Barat
55188 Tun Razak Exchange
Kuala Lumpur
TELEPHONE NO.
603-2778 1000
FAX NO.
603-2789 7225
77Client Services : 03-2778 1000
Annual Report
CORPORATE DIRECTORY
BRANCHESPetaling JayaEastspring Investments Berhad
A-17-P1 & M
Block A, Jaya One
72A, Jalan Universiti
46200 Petaling Jaya, Selangor
TELEPHONE NO.
603-7948 1288
Kota KinabaluEastspring Investments Berhad
Suite E3, 9th Floor
CPS Tower, Centre Point Sabah
No. 1, Jalan Centre Point
88000 Kota Kinabalu, Sabah
TELEPHONE NO.
6088-238 613
ENQUIRIESCLIENT SERVICES
603-2778 1000
Client Services : 03-2778 100078
Eastspring Investments Dynamic Fund
CORPORATE DIRECTORY (CONTINUED)

79Client Services : 03-2778 1000
Annual Report
Eastspring Investments Berhad (531241-U)
Level 22, Menara Prudential, Persiaran TRX Barat55188 Tun Razak Exchange, Kuala LumpurT: (603) 2778 3888 F: (603) 2789 7220eastspring.com/my
Client ServicesT: (603) 2778 [email protected]