association of serum phospholipid monounsaturated fatty acid … · 2019-06-28 · association of...
TRANSCRIPT

Association of serum phospholipid
monounsaturated fatty acid compositions and
delta-9-desaturase activity with the early
alteration of fasting glycemic status
Jae Seon Cho
The Graduate School
Yonsei University
Department of Science for Aging

Association of serum phospholipid
monounsaturated fatty acid compositions and
delta-9-desaturase activity with the early
alteration of fasting glycemic status
A Dissertation
Submitted to the Department of Science for Aging
and the Graduate School of Yonsei University
in partial fulfillment of the
requirements for the degree of
Doctor of Philosophy
Jae Seon Cho
December 2013

감사의 글
먼저 오랫동안 직장생활을 하며 미뤄왔던 만학의 꿈을 이루게 해 주신 이
종호 지도 교수님께 깊은 감사를 드립니다. 여러모로 부족한 제 논문을 심사
해 주신 이수복 교수님, 이승민 교수님, 채지숙 교수님께도 진심으로 감사를
드립니다. 버거워 포기하고픈 맘이 들 때마다 격려해 주시고, 바쁜 일과에도
상경하셔서 자세히 연구과정을 지도해 주신 김오연 교수님..정말 고맙고 감사
드립니다. 석사시절 바른 신앙인의 자세를 보여 주시고, 문단에 등단하며 부끄
러운 글을 발표할 때마다 용기를 북돋워 주셨던 은사님이신 임숙자 교수님.
19년이란 오랜 공백기간을 과감히 벗어 버리고, 도전할 수 있는 용기를 주시
고, 기도로 지원해 주시는 은사님이 계셔서 마음 한 구석 든든했음을 이 자리
를 빌어 고백하며 깊은 감사를 드립니다.
올해 병원 오픈으로 과중한 업무에도 학업을 이어갈 수 있도록 배려해 주
신 G샘병원과 영양팀 선생님들께도 진심으로 감사를 드립니다.
함께 공부하며 희로애락을 같이 한 김희준 선생님, 바쁜 구역장을 위해
물심양면으로 도움을 주시고, 기도해 주신 친정언니처럼 자상한 새중앙교회
구역집사님들께도 따뜻한 감사의 마음을 전합니다.
학창시절부터 틈틈이 습작해 놓았던 詩에 아름다운 곡을 입혀 주시고, 활
발한 연주활동으로 작품을 빛내 주셔서 지루할 수 있는 학업중에도 신선한 활
력소로 기운을 북돋아 주시고, 끊임없는 도전정신과 창작의 지혜를 일깨워 주
신 이안삼 작곡가님과 Lee 중창단 여러분께도 깊은 감사의 마음을 전합니다.
그리고, 오늘이 있기까지 항상 곁에서 응원해 주시고 아낌없는 사랑을 베풀
어 주신 부모님과 형제들, 사랑하는 남편과 세 자녀, 민규, 현진, 은빈, 친지분
들께 고마운 마음과 함께 작은 결실의 기쁨을 나누고 싶습니다.

끝으로 부족한 저를 강하고 의로운 손으로 잡아 인도해 주신 하나님께 모
든 영광을 돌리며 제 마음을 담은 짧은 詩 한편으로 성원해 주신 모든 분들께
감사의 고백을 대신하고자 합니다.
= 반딧불이 =
내 몸속에는
반짝이는 가시가 있다.
둥굴게 마모되어
흐느낄 적마다
어둠속에 도드라지는 불빛
내게 주어진 삶이 소중하기에
내게 남겨진 이 아픔도 소중하다.
바람부는 날이면
깊게 박힌 가시가
울먹울먹 가슴을 찔러 와도
나는 둥굴게 깎여
곱게 빛을 틔울 것이다.
모래바람 휘날리는
도심의 한복판에 서서
윙윙대는 마천루처럼....
내 몸속에서
조용조용 숨 쉬다가
길잃은 어느 날 밤,
"따라 오라" 살을 태워 손짓하는
어릴적 할미같은 등대가 될 것이다.
2013년 12월
조 재 선

- i -
CONTENTS
List of Figures ..................................................................................................... iii
List of Tables ...................................................................................................... iv
ABSTRACT ........................................................................................................... v
Abbreviation ........................................................................................................ vii
1. INTRODUCTION ............................................................................................. 1
2. SUBJECTS AND METHODS ......................................................................... 6
2.1. Study subjects .......................................................................................................... 6
2.2. Anthropometric parameters and blood collection .................................................... 7
2.3. Serum lipid profile and free fatty acids ................................................................... 7
2.4. Glucose, insulin, and HOMA-IR ............................................................................. 8
2.5. Serum high sensitivity C-reactive protein ............................................................... 8
2.6. Plasma adiponectin and oxidized LDL .................................................................... 8
2.7. Urinary 8-epi-prostaglandin-F2alpha ...................................................................... 9
2.8. Fatty acid composition in serum phospholipids ...................................................... 9
2.9. The assessment of dietary intake/physical activity level ....................................... 10
2.10. Statistical analysis ................................................................................................ 10

- ii -
3. RESULTS ........................................................................................................ 11
3.1. General and biochemical characteristics of study population................................ 11
3.2. Lipid profiles, glycemic index, inflammation and oxidative stress markers
between IFG and NFG subjects ............................................................................ 14
3.3. Serum phospholipid FAs composition between IFG and NFG subjects ............... 16
3.4. Serum phospholipid FA composition and cardiometabolic risk parameters
according to fasting glucose levels and metabolic syndrome status ..................... 18
3.5. Relationship of serum phospholipid FA compositions with glycemic
and other cardiometabolic risk parameters ........................................................... 21
4. DISCUSSION .................................................................................................. 24
5. REFERENCES ................................................................................................ 30
6. ABSTRACT (KOREAN) ................................................................................ 39
- iii -
List of Figure
Figure 1. Nuclear mechanism for polyunsaturated fatty acid (PUFA)
regulation of the gene expression.......................................................... 3
Figure 2. Association of serum phospholipid fatty acid proportion and
cardiometabolic risk parameters with fasting glucose level
according to metabolic syndrome ....................................................... 20

- iv -
List of Tables
Table 1. Definition of MetS (NCEP-ATPIII) ....................................................... 1
Table 2. General characteristics of subjects ....................................................... 13
Table 3. Lipid profiles, glycemic index, inflammation and oxidative stress
markers .................................................................................................. 15
Table 4. Proportion of phospholipid fatty acids ................................................. 17
Table 5. Correlation coefficients between serum phospholipid fatty acid
proportions and glycemic and other cardiometabolic risk parameters
............................................................................................................... 23

- v -
ABSTRACT
Association of serum phospholipid monounsaturated fatty
acid compositions and delta-9-desaturase activity with the
early alteration of fasting glycemic status
Jae Seon Cho
Department of Interdisciplinary Course
of Science for Aging
The Graduate School
Yonsei University
Objective: Alterations in blood or dietary fatty acid (FA) compositions were associated
with insulin resistance (IR) and the related metabolic disorder. However, few studies
reported the association of serum phospholipid FA compositions with the early alteration
of fasting glycemic status.
Methods: Serum phospholipid FAs, desaturase activities, fasting glycemic and cardiome
-tabolic parameters were measured in healthy subjects (n=1022, 30-69yrs). Study subjects
were divided into normal fasting glucose (NFG) and impaired fasting glucose (IFG).

- vi -
Results: Among serum phospholipid FA compositions, total monounsaturated FAs
(MUFAs), oleic acid (OA;C18:1w9), dihomo-Ɣ-linolenic acid (DGLA;C20:3w6), delta-
9-desaturase (D9D;C18:1w9/C18:0) activity and C20:3w6/C18:2w6 were significantly
higher in IFG subjects than NFG controls. When study subjects were subdivided into 4
groups according to fasting glucose levels and metabolic syndrome (MetS) status,
palmitoleic acid (C16:1w7) was highest in IFG-MetS and lowest in NFG-nonMetS. OA
and D9D were higher in IFG-MetS than the other 3 groups.
DGLA and C20:3w-6/C18:2w-6 were higher in MetS than nonMetS regardless of
fasting glucose levels. Hs-CRPs and 8-epi-PFG2a were higher in IFG than NFG regardless
of MetS status. Ox-LDLs were higher in IFG-MetS than the other groups. Total MUFAs,
OA and D9D positively correlated with HOMA-IR, fasting glucose, triglyceride(TG), hs-
CRP and 8-epi-PFG2a. Palmitoleic acid positively correlated with TG and hs-CRP.
Conclusion: Among serum phospholipid FAs, total MUFAs , OA and palmitoleic aicd,
and D9D were associated with the early alteration of fasting glycemic status, which may
be suggested as sensitive and useful markers for the early prediction of the risk of type 2
diabetes and cardiometabolic diseases.
--------------------------------------------------------------------------------------------------
Key words: monounsaturated fatty acid; oleic acid; delta-9-desaturase; fasting glycemic
status; cardiometabolic risk

- vii -
Abbreviation
AA Arachidonic acid
ALNA α-Linolenic acid
BMI Body mass index
DGLA Dihomo-γ-linolenic acid
DHA Docosahexaenoic acid
DPA Docosapentaenoic acid
DTA Docosatetraenoci acid
D5D delta-5-Desaturase (C20:4 ω-6/C20:3 ω-6)
D6D delta-6-Desaturase (C18:3 ω-6/C18:2 ω-6)
D9D delta-9-Desaturase (C18:1ω-9/ C18:0)
EDA Eicosadienoic acid
EPA Eicosapentaenoic acid
ETE Eicosatrienoic acid
GLA γ-linolenic acid
HOMA-IR Homeostasis model assessment of insulin resistance
hs-CRP High sensitivity C-reactive protein
IFG Impaired fasting glucose Odds ratio
LA Linoleic acid
MUFA Monounsaturated fatty acid
NFG Normal fasting glucose
PGF Prostaglandin-F
PUFA Polyunsaturated fatty acids
SFA Saturated fatty acid

1
1. INTRODUCTION
Obesity is a key factor in the development of the metabolic syndrome(MetS),
which is associated with increased cardiometabolic risk. MetS is a disease with
hypertension, diabetes, obesity, dyslipidemia and insulin resistance [1-2]. These
associations of MetS are required that it is treated with complex concepts.
The definition of MetS is so variable that it has established a unified working
diagnostic tool for the MetS. The International Diabetes Federation (IDF) has
produced recommendations for criteria that should be included when studying the
research purposes.[3] In this study, we are used guideline of National Cholesterol
Education Program-Third Adult Treatment Panel(NCEP-ATPIII).(Table 1)
Table 1. Definition of MetS (NCEP-ATPIII)
Disorder Diagnosis guideline
FBS ≥100mg/dl
HP (systolic/diastolic) >130/85 mmHg
Dyslipidemia
Triglyceride ≥150mg/dl
HDL-cholesterol Men < 40mg/dl
Women < 50mg/dl
Obesity Waist circumference Men > 90cm
Women > 80cm
2
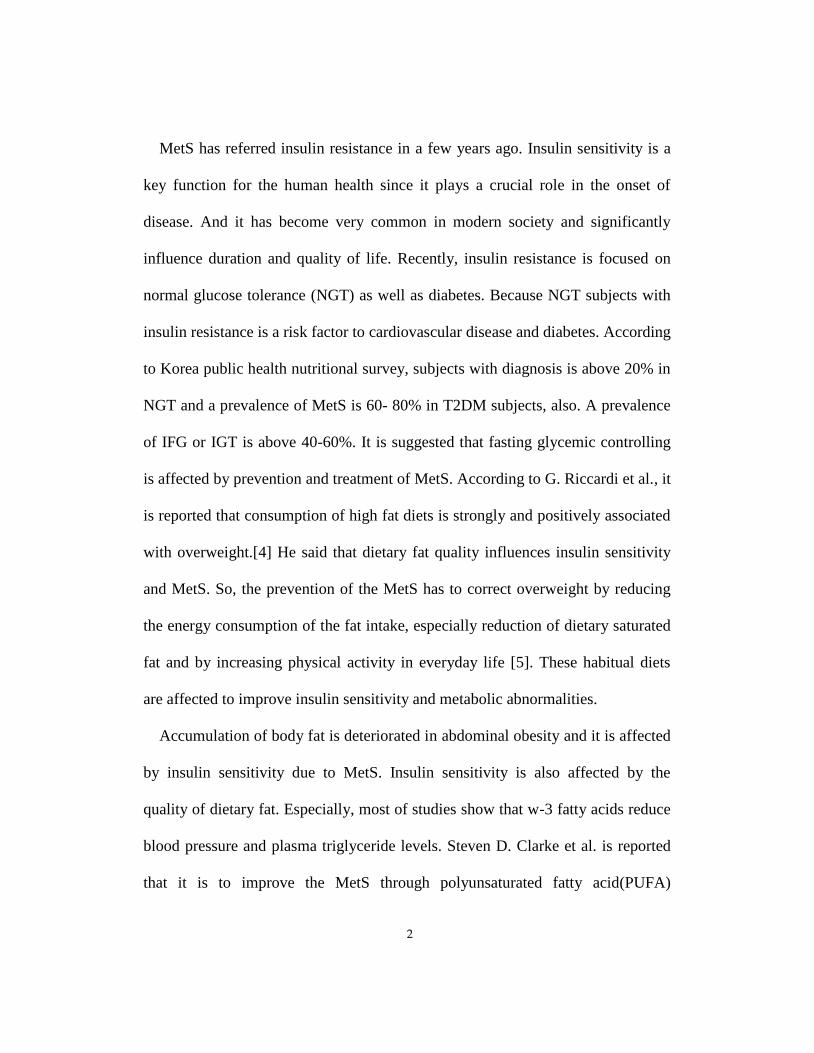
MetS has referred insulin resistance in a few years ago. Insulin sensitivity is a
key function for the human health since it plays a crucial role in the onset of
disease. And it has become very common in modern society and significantly
influence duration and quality of life. Recently, insulin resistance is focused on
normal glucose tolerance (NGT) as well as diabetes. Because NGT subjects with
insulin resistance is a risk factor to cardiovascular disease and diabetes. According
to Korea public health nutritional survey, subjects with diagnosis is above 20% in
NGT and a prevalence of MetS is 60- 80% in T2DM subjects, also. A prevalence
of IFG or IGT is above 40-60%. It is suggested that fasting glycemic controlling
is affected by prevention and treatment of MetS. According to G. Riccardi et al., it
is reported that consumption of high fat diets is strongly and positively associated
with overweight.[4] He said that dietary fat quality influences insulin sensitivity
and MetS. So, the prevention of the MetS has to correct overweight by reducing
the energy consumption of the fat intake, especially reduction of dietary saturated
fat and by increasing physical activity in everyday life [5]. These habitual diets
are affected to improve insulin sensitivity and metabolic abnormalities.
Accumulation of body fat is deteriorated in abdominal obesity and it is affected
by insulin sensitivity due to MetS. Insulin sensitivity is also affected by the
quality of dietary fat. Especially, most of studies show that w-3 fatty acids reduce
blood pressure and plasma triglyceride levels. Steven D. Clarke et al. is reported
that it is to improve the MetS through polyunsaturated fatty acid(PUFA)

3
regulation of gene transcription(Fig1.).[6] PUFA suppresses lipid synthesis by
inhibiting the nuclear abundance and DNA-binding affinity of transcription
factors, which is responsible for imparting insulin and carbohydrate control to
lipogenic and glycolytic genes. But, the nature of the affected transcription factors
remains to be unequivocally established.
+ -
PUFA may protect against the adverse symptoms of the metabolic syndrome
PPAR SREBP1
Sp1 NF-Y
Lipogenic genes
PPRE
FA-oxidation gene
Triglyceride
synthesis Fatty acid
synthesis
Mitochondria
Β-oxidation Peroxisome
Β-oxidation
VLDL-TG
Figure 1. Nuclear mechanism for polyunsaturated fatty acid (PUFA) regulation of
gene expression. FA, fatty acid; NF-Y, nuclear factor Y; PPAR, peroxisome
proliferator-activated receptor; PPRE,peroxisome proliferator-activated receptor
response element; Sp1, stimulatory protein1; SREBP-1, sterol regulatory element
binding protein-1; TG, triglycerides. (adopted from reference 6. Fig. 1 )

4
and reduce the risk of heart disease. Because PUFA suppresses lipogenic gene
expression by reducing the nuclear abundance and gene expression action of
PUFA should be considered among criteria used in defining the dietary ratio of -
6 to -3, which is needed for optimum health benefit. Above all, MetS is affected
by body fat profile. Therefore, we examined what the proportion of fatty acid of
serum cholesteryl esters is and estimated that the activity of elongases and
desaturases were associated with glucose tolerancs status and insulin resistance,
taking dietary factors.
Dietary fat intakes or serum fatty acid (FA) compositions were related with
the features of MetS or cardiovascular disease (CVD) [7-10]. FA compositions of
cholesteryl esters or phospholipids in serum or plasma were known to reflect
dietary FA composition during one or two months [11, 12] as well as endogenous
conversion of ingested FAs by desaturation, elongation or both [13, 14]. High
concentrations of palmitic acid (PA, 16:0), dihomo-γ-linoleic acid (DGLA,
C20:3ω-6), and low concentrations of linoleic acid (LA, 18:2-6) in serum
phospholipids were observed in people with insulin resistance (IR) and MetS [14,
15]. In addition the activities of desaturating enzymes such as D9-desaturase
(D9D) and D6D increased, and then D5D decreased in obese or MetS individuals
[13, 14]. Recent studies have particularly focused on the association of
monounsaturated fatty acids (MUFAs) and D9D with the onset of type 2 diabetes,
and cardiometabolic diseases [16-19]. D9Ds is the rate-limiting enzyme, that is
5
responsible for converting PA and stearic acid (SA, 18:0) to palmitoleic acid
(16:1) and oleic acid (18:1) respectively [13, 14]. Previously, it was expected that
a D9D would have protected cells against lipotoxicity due to over accumulation of
saturated fat, but the MUFA products by D9D were found as preferred substrates
for the synthesis of triglycerides, cholesterol ester and phospholipids are major
components of all cellular lipids [16-18]. Therefore, higher conversion by D9Ds is
thought to strongly link to obesity, IR and finally favorable to type 2 diabetes and
CVD [13,14,19]. According to Van Woudenbergh et al. [20], serum cholesteryl
FA proportions and desaturase activity were associated with glucose tolerance
status and IR. Ortinau et al. also reported that inhibition of stearoyl-CoA
desaturase-1 (SCD1, D9D) improved glucose and insulin tolerance and attenuated
hepatic inflammation in obese ob/ob mice, but not in lean control mice [21]. On
the other hand, systematic review and meta-analysis data reported that high-
MUFA diet (>12% of total energy contents) at least 6 months effectively reduced
glycosylated hemoglobin among adults with abnormal glucose metabolism (i.e.
type 2 diabetes, impaired glucose tolerance, IR, overweight and obesity) [22], and
specifically reduced fasting glucose levels in type 2 diabetic patients [23]. As
mentioned above, the association of individual FAs in bloods or in diets with
metabolic status are not yet clearly identified, and still controversial.
Furthermore, there were few studies reporting on the association of serum
phospholipid FA composition with the alteration of fasting glycemic status in

6
healthy people without having metabolic disorder. Therefore, we investigated the
relationship of serum phospholipid FA compositions with fasting glycemic status
and other cardiometabolic risk parameters in healthy people with both MetS and
nonMetS.
2. Subjects & Methods
2.1 Study subjects
Study subjects were recruited from the Health Service Center in the course of a
routine checkup visit or by a newspaper announcement for health examinations.
Exclusion criteria were orthopedic limitations, weight loss/gain over the previous
6 months, or any diagnosis of vascular disease, diabetes, cancer (clinically or by
anamnesis), renal disease, liver disease, thyroid disease, and acute or chronic
inflammatory diseases. None of the participants were taking any medications
(antihypertensive, antidyslipidemic, antithrombotic, and antidiabetic drugs).
Metabolic syndrome (MetS) was defined using a combination and modification of
the NCEP-ATPIII guideline, Asian-Pacific guideline and American Diabetes
Association guideline [24-26]. This definition requires at least three of the
following components: waist circumference>90 cm (men);triglyceride
-cholesterol)<40 mg/dl

7
informed consent was obtained from all participants, and the study protocol was
approved by the Institutional Review Board of Yonsei University.
2.2 Anthropometric parameters and blood collection
Height, body weight and waist circumference were measured. Body mass index
(BMI) was calculated as body weight (kg)/height (m2). Blood pressure (BP) was
obtained from the left arm of seated individuals with an automatic BP monitor
(TM-2654, A&D, Tokyo, Japan) after 20 min of rest. Study participants were
interviewed regarding their smoking and drinking behavior. After an overnight
fast, venous blood specimens were collected in EDTA-treated and plain tubes. The
tubes were immediately placed on ice until they arrived at the analytical
laboratory (1-3 h). Then, the blood specimens were separated into plasma or
serum, and stored at -70C until analysis.
2.3 Serum lipid profile and free fatty acids
Serum total cholesterol, triglyceride and free FAs were measured using
commercially available kits on a Hitachi 7150 Autoanalyzer (Hitachi Ltd., Tokyo,
Japan). After precipitation of serum chylomicron, LDL, and VLDL with dextran
sulfatemagnesium, HDL-cholesterol left in the supernatant was measured by an

8
enzymatic method. LDL-cholesterol was calculated indirectly using the
Friedewald formula for individuals with serum triglyceride <400 mg/dL (4.52
mol/L).
2.4 Glucose, insulin, and HOMA-IR
Fasting glucose was measured by a glucose oxidase method (Glucose
Analyzer Beckman Instruments, Irvine, CA, USA). Insulin was measured by
radioimmuno-assays with commercial kits (Immuno Nucleo Corporation,
Stillwater, MN, USA). IR was calculated with the homeostasis model assessment
(HOMA) using the following equation: IR={fasting insulin (mIU/ml)-fasting
glucose (mmol/L)}/22.5.
2.5 The FADS gene and CAD
Serum high sensitivity C-reactive protein (hs-CRP) were measured with an
ADVIA 1650 (Bayer, Tarrytown, NY) using a commercially available, high-
sensitivity CRP-Latex(II) X2 kit (Seiken Laboratories Ltd., Tokyo, Japan) that
allows detection of CRP in the range of 0.001–31 mg/dL. The intra-assay and
inter-assay coefficients of variance were 1.87% and 1.89%, respectively.
2.6 Plasma adiponectin and oxidized LDL

9
Adiponectin was measured using an enzyme immunoassay (Human
Adiponectin ELISA kit, B-Bridge International Inc., CA, USA &
Mercodia,Uppsala, Sweden, respectively). Oxidized LDL (ox-LDL) was
measured using an enzyme immunoassay (Mercodia, Uppsala, Sweden). The
assays were read using a Victor2 (Perkin Elmer Life Sciences, Turku, Finland).
2.7 Urinary 8-epi-prostaglandin-F2alpha
Urine was collected in polyethylene tubes containing 1% butylated
hydroxytoluene after 12 h of fasting. The tubes were immediately covered with
aluminum foil and stored at −70 °C until analysis. 8-epi-PGF2α was measured
using an enzyme immunoassay (Bioxytech urinary 8-Epi-PGF2α™ Assay Kit,
OXIS International Inc., Portland) and the resulting color reaction was read at 650
nm using a Wallac Victor2 multilabel counter. Urinary creatinine was determined
by the alkaline picrated (Jaffe) reaction. Urinary 8-epi-PGF2α concentrations were
expressed as pg/mg of creatinine.
2.8 Fatty acid composition in serum phospholipids
Serum phospholipid FA composition was measured with gas chromatography
(Hewlett Packard HP 7890A; Agilent Technologies, Santa Clara, CA, USA). The
detailed methods are described previously [21,22]. Briefly, total lipids were

10
extracted with chloroform/methanol (2:1,v/v) and phospholipids were methylated
after separation using thin-layer chromatography. Individual FAs were calculated
as a relative percentage with the elevated FAs set at 100% using Chemstation
software. The inter-assay coefficients of variance were 4.15%.
2.9 The assessment of dietary intake/physical activity level
Information on each participant’s usual diet was obtained using both a 24-h
recall and a semi-quantitative food frequency questionnaire (SQFFQ), of which
the validity had been previously tested [23]. We used the former to carry out
analyses and the latter to check if the collected data was representative of the
usual dietary pattern. All participants were given written and verbal instructions
by a registered dietitian on completion of a 3-day (2 week days and 1 weekend)
dietary record. Dietary energy values and nutrient content from the 3-day food
records were calculated using the Computer Aided Nutritional Analysis Program
(CAN-pro 2.0, Korean Nutrition Society, Seoul, Korea). Total energy expenditure
(TEE) (kcal/day) was calculated from activity patterns (basal metabolic rate, 24 h-
physical activity, and specific dynamic action of food).
2.10 Statistical analysis
Statistical analyses were performed with Win SPSS ver21 (Statistical Package
for the Social Science, SPSS Inc., Chicago, IL, USA). Differences in continuous

11
variables among subgroups were tested with independent t-test or one-way
ANOVA followed by the Bonferroni correction, and non-continuous variables
were tested with chi-square test. A general linear model was also applied to the
comparison among subgroups with adjustment for confounders. Correlation
analysis was used for the association of serum phospholipid FA composition and
glycemic and other cardiometabolic markers. The skewed variables were log-
transformed for statistical analysis. For descriptive purposes, mean values were
presented using untransformed values. Results were expressed as Mean ± SE or
percentages. A two-tailed value of P<0.05 was considered statistically significant.
3. RESULTS
3.1. General and biochemical characteristics of study population
Table 2 shows general characteristics of study subjects. All study participants
were 1022 and 195 of them, which were found to have IFG (19.1%). IFG subjects
were older and heavier, more consumed cigarettes and alcohols, and had higher
systolic and diastolic BP than those of NFG ones. IFG group showed higher
proportions of MetS and female than NFG group. Total energy expenditure (TEE)
and total caloric intake (TCI) were significantly higher in IFG subjects than NFG
controls. In addition, energy intakes (%) derived from carbohydrate were slightly

12
lower in IFG subjects than NFG subjects, but protein (%) and fat (%) intakes, and
PUFA/SFA intake were not significantly different between the two groups (Table
2).

13
Table 2. General characteristics of study subjects
Mean ± S.E. or %, *Tested after log transformed; tested by independent t-test (student t-test);
: %
of TCI; NFG: normal fasting glucose; IFG: impaired fasting
glucose; BP: blood pressure; TEE: total energy expenditure, TCI: total caloric intake, PUFA:
polyunsaturated fatty acid, SFA: saturated fatty acid
NFG (n=827) IFG (n=195) P-value
Age (year) 46.8 ± 0.27 48.0 ± 0.50 0.045
Metabolic syndrome (%) 9.7 46.2 <0.001
Female (%) 51.5 35.4 <0.001
Current smokers (%) 21.4 30.3 0.008
Current drinkers (%) 64.4 72.8 0.026
Body mass index (kg/m²) 23.4 ± 0.10 24.9 ± 0.22 <0.001
Systolic BP (mmHg) 118.0 ± 0.50 124.4 ± 1.03 <0.001
Diastolic BP (mmHg) 73.6 ± 0.40 77.2 ± 0.78 <0.001
Total energy expenditure and dietary intake
TEE (kcal) 2,086.6 ± 11.19 2,156.4 ± 26.6 0.009
TCI (kcal) 2,161.5 ± 11.78 2,276.2 ± 25.8 <0.001
Carbohydrate (%) 61.8 ± 0.05 61.6 ± 0.12 0.035
Protein (%) 16.9 ± 0.05 16.9 ± 0.10 0.490
Fat (%) 21.5 ± 0.05 21.4 ± 0.14 0.774
PUFA / SFA (g) 1.43 ± 0.020 1.44 ± 0.045 0.855

14
3.2. Lipid profiles, glycemic index, inflammation and oxidative
stress markers between IFG and NFG subjects
IFG subjects had higher fasting concentrations of glucose, insulin, HOMA-IR,
triglyceride (TG), total cholesterol, LDL-cholesterol, and lower concentrations of
HDL-cholesterol than those of NFG controls (Table 3). Regarding inflammation
and oxidative stress markers, IFG group showed lower concentrations of plasma
adiponectin and higher levels of hs-CRP and ox-LDL. On the other hand, urinary
8-epi-
the two groups (Table 3).

15
Table 3. Lipid profiles, glycemic index, inflammation and oxidative stress
markers
Mean ± S.E. *Tested after log transformed; tested by independent t-test (student t-test); HOMA-IR:
homeostasis model assessment of insulin resistance; hs-CRP: high sensitivity C-reactive protein;
PGF: prostaglandin-F
NFG (n=827) IFG (n=195) P
Triglyceride, TG (mg/dL)* 113.8 ± 2.38 137.1 ± 5.04 <0.001
Total cholesterol (mg/dL) 191.6 ± 1.13 198.2 ± 2.65 0.022
HDL-cholesterol (mg/dL) * 55.6 ± 0.53 52.8 ± 0.99 0.020
LDL-cholesterol (mg/dL) 113.3 ± 1.09 119.0 ± 2.46 0.025
Glucose (mg/dL) * 87.7 ± 0.26 106.4 ± 0.41 <0.001
Insulin (µIU/mL) * 8.20 ± 0.15 10.25 ± 0.54 <0.001
HOMA-IR* 1.78 ± 0.03 2.71 ± 0.15 <0.001
Free fatty acid (µEq/L) * 515.3 ± 8.60 551.5 ± 17.1 0.065
Adiponectin (μg/ml) * 6.57 ± 0.14 4.81 ± 0.16 <0.001
hs-CRP (mg/L) * 0.82 ± 0.04 1.18 ± 0.12 0.001
Oxidized LDL (U/L) * 62.0 ± 1.03 68.5 ± 2.13 0.002
8-epi-PGF2 (pg/mg creatinine) 1454.2 ± 1.03 1514.8 ± 52.3 0.393

16
3.3. Serum phospholipid FAs composition between IFG and NFG
subjects
Proportion of total MUFAs, oleic acid (OA, C18:1ω-9), dihomo-γ-linoleic
acid (DGLA, C20:3ω-6), delta-9-desaturase (D9D, C18:1ω-9/ C18:0) and
DGLA/linoleic acid (LA) (C20:3 ω-6/C18:2 ω-6) were significantly higher in IFG
subjects than those in NFG controls
higher and LA was lower in IFG subjects than those in NFG controls, but it did
not reach a statistical significance. The other FAs were not significantly different
between the two groups.

17
Table 4. Proportions of serum phospholipid fatty acids
Mean ± S.E. *Tested after log transformed; tested by independent t-test (student t-test); AA: Arachidonic acid,
ALNA: α-Linolenic acid, DGLA: Dihomo-γ-linolenic acid, DHA: Docosahexaenoic acid, DPA:
Docosapentaenoic acid, DTA: Docosatetraenoci acid, D5D: delta-5-Desatuase (C20:4 ω-6/C20:3 ω-6), D6D:
delta-6-Desatuase (C18:3 ω-6/C18:2 ω-6), D9D: delta-9-Desatuase (C18:1ω-9/ C18:0), EDA: Eicosadienoic
acid, EPA: Eicosapentaenoic acid, ETE: Eicosatrienoic acid, GLA: γ-linolenic acid, LA: Linoleic acid,
MUFA: monounsaturated fatty acid PUFA: polyunsaturated fatty acid, SFA: saturated fatty acid; C22:5ω-6
(Docosapentaenoic acid, DPA) = osbond acid, C22:5ω-3 (Docosapentaenoic acid, DPA) = clupanodonic acid
NFG (n=827) IFG (n=195) P
Total SFA 54.694 ± 0.223 54.388 ± 0.494 0.555
C12:0, Lauric acid* 0.370 ± 0.008 0.367 ± 0.016 0.784
C14:0, Myristic acid* 0.613 ± 0.010 0.678 ± 0.086 0.998
C16:0, Palmitic acid 32.419 ± 0.181 32.129 ± 0.426 0.496
C18:0, Stearic acid* 18.916 ± 0.121 18.910 ± 0.253 0.960
Total MUFA* 11.119 ± 0.082 11.525 ± 0.183 0.045
C16:1, Palmitoleic acid* 0.698 ± 0.029 0.749 ± 0.059 0.087
C18:1ω-9, Oleic acid 6.689 ± 0.058 7.066 ± 0.132 0.006
C18:1ω-7, Vaccenic acid 1.669 ± 0.016 1.702 ± 0.031 0.352
Total PUFA 24.974 ± 0.220 24.720 ± 0.440 0.612
C18:2ω-6 (LA) 12.702 ± 0.110 12.235 ± 0.228 0.064
C18:3ω-6 (GLA) * 0.222 ± 0.008 0.221 ± 0.018 0.574
C20:2ω-6 (EDA) * 0.960 ± 0.065 0.898 ± 0.139 0.674
C20:3ω-6 (DGLA) * 1.413 ± 0.020 1.504 ± 0.043 0.046
C20:4ω-6 (AA) 4.494 ± 0.064 4.639 ± 0.132 0.324
22:4, ω-6 (DTA) * 0.227 ± 0.007 0.249 ± 0.024 0.955
C22:5ω-6 (DPA) * 0.191 ± 0.006 0.195 ± 0.016 0.682
C18:3ω-3 (ALNA) * 0.153 ± 0.006 0.143 ± 0.008 0.526
C20:3ω-3 (ETE) * 0.092 ± 0.005 0.112 ± 0.013 0.425
C20:5ω-3 (EPA) * 1.135 ± 0.025 1.189 ± 0.050 0.183
C22:5ω-3 (DPA) * 0.531 ± 0.012 0.539 ± 0.025 0.859
C22:6ω-3 (DHA) * 2.829 ± 0.053 2.770 ± 0.101 0.861
Total ω-6 FA 20.233 ± 0.167 19.927 ± 0.344 0.424
Total ω-3 FA* 4.742 ± 0.077 4.792 ± 0.154 0.639
ω-6 FA/ω-3 FA 4.943 ± 0.066 4.799 ± 0.133 0.338
D9D (C18:1ω-9/ C18:0) 0.365 ± 0.004 0.385 ± 0.008 0.021
D6D (C18:3 ω-6/C18:2 ω-6) 0.018 ± 0.001 0.018 ± 0.001 0.914
D5D (C20:4 ω-6/C20:3 ω-6) 3.623 ± 0.142 3.535 ± 0.201 0.777
C20:3 ω-6/C18:2 ω-6 0.113 ± 0.001 0.123 ± 0.003 0.001

18
3.4. Serum phospholipid FA composition and cardiometabolic risk
parameters according to fasting glucose levels and metabolic
syndrome status
Study subjects were subdivided into 4 groups: NFG-nonMetS (n=747), NFG-
MetS (n=105), IFG-nonMetS (n=80), IFG-MetS (n=90). Figure 2 presented serum
phospholipid FA composition and cardiometabolic risk parameters according to
fasting glucose levels and MetS status. All the values were adjusted for age,
gender, cigarette smoking, alcohol consumption, total energy expenditure (kcal/d)
and total calorie intake (kcal/d), PUFA/SFA intake.
Proportions of total MUFAs in IFG-MetS group were significantly higher than
those in NFG groups (both nonMetS and MetS), but not different from IFG-
nonMetS group. Palmitoleic acid was highest in IFG-MetS group and lowest in
NFG-nonMetS group. OA (C18:1-9) was higher in IFG-MetS group compared
with both NFG- and IFG-nonMetS groups, but not different from IFG-nonMetS
group. D9D in IFG-MetS group was higher than the other 3 groups (Figure 2). In
addition, DGLA (C20:3-6) and C20:3-6/C18:2-6 were higher in MetS
subjects than nonMetS subjects regardless of fasting glucose levels. On the other
hand, LA was also lower in MetS than in nonMetS regardless of fasting glucose
levels, but it did not reach a statistical significance. Other FA compositions were
not different between NFG and IFG subjects (data not shown).

19
Regarding cardiometabolic risk parameters, hs-CRP concentrations were
higher in IFG subjects than those in NFG ones regardless of MetS status, but the
levels in NFG-nonMetS were lowest among the 4 groups (Figure 2). 8-Epi-PFG2
levels were significantly higher in IFG subjects than those in NFG subjects
regardless of MetS status. Oxidized LDL levels in IFG-MetS group were higher
than the other 3 subgroups (Figure 2). In addition, HOMA-IR was the highest in
IFG-MetS group and the lowest in NFG-nonMetS group, but plasma adiponectin
was the lowest in IFG-MetS group and the highest in NFG-nonMetS group (data
not shown

20
Figure 2. Association of serum phospholipid fatty acid proportion and cardiometabolic risk parameters with fasting glucose level
according to metabolic syndrome. Adjusted Mean ± S.E, *Tested after log transformed; P*: adjusted p-value; tested by
general linear model (GLM) followed by Boferroni correction with adjustment (age, gender, cigarette smoking, alcohol
consumption, total energy expenditure(kcal/d) and total calorie intake (kcal/d), PUFA/SFA intake); Sharing the same
alphabet indicates no significant difference. SFA: saturated fatty acid, MUFA: monounsaturated fatty acid, PUFA:
polyunsaturated fatty acid
20

21
3.5. Relationship of serum phospholipid FA compositions with
glycemic and other cardiometabolic risk parameters
Pearson and partial correlation analyses were performed for the relationship
between serum phospholipid fatty acid composition, and glycemic and
cardiometabolic risk parameters(Table5). Total MUFA and OA (C18:19), and
D9D positively correlated with fasting glucose (r=0.100, p<0.01; r=0.114,
p<0.001; r=0.094, p<0.01, respectively), insulin (r=0.104, p=0.001; r=0.119,
p<0.001; r=0.135, p<0.01, respectively), HOMA-IR (r=0.120, p<0.01; r=0.137,
p<0.001; r=0.147, p<0.001, respectively), TG (r=0.145, p<0.001; r=0.254,
p<0.001; r=0.180, p<0.001, respectively), hs-CRP (r=0.237, p<0.001; r=0.194,
p<0.001; r=0.162, p<0.001, respectively), and 8-epi-PFG2 (r=0.104, p<0.001;
r=0.129, p<0.001; r=0.119, p<0.001, respectively),. Palmitoleic acid (C16:17)
also positively correlated with TG (r=0.154, p<0.001) and hs-CRP (r=0.160,
p<0.001). In addition, DGLA (C20:36) positively correlated with insulin
(r=0.161, p<0.001), HOMA-IR (r=0.162, p<0.001), TG (r=0.245, p<0.001), hs-
CRP (r=0.164, p<0.001) and oxidized LDL (r=0.195, p<0.001).
C20:36/C18:26 were also positively correlated with TG (r=0.296, p<0.001),
hs-CRP (r=0.167, p<0.001) and oxidized LDL (r=0.200, p<0.001). Additionally,
the correlations were adjusted for confounding several factors (age, gender,

22
cigarette smoking, alcohol consumption, TEE, TCI, PUFA/SFA intake, TG, HDL-
cholesterol) in order to examine the relationship between serum phospholipid FAs
and glycemic status. HOMA-IR positively correlated with total MUFA (r=0.117,
p<0.001), OA (r=0.145, p<0.001), D9D (r=0.150, p<0.001) and DGLA (r=0.124,
p<0.001), and fasting glucose also positively correlated with total MUFA (r=0.100,
p<0.01) and OA (r=0.092, p<0.01). These significances still maintained after
further adjustment for systolic and diastolic BP.

23
Table 5. Correlation coefficients between serum phospholipid fatty acid proportions and glycemic and other
cardiometabolic risk parameters
Tested by Pearson correlation analysis; +p<0.1, *P<0.05, **p<0.01, ***p<0.0001, DGLA: Dihomo-γ-linolenic acid, D9D: delta-9-
Desatuase (C18:1ω-9/ C18:0), HOMA-IR: homeostasis model assessment of insulin resistance; LA: linoleic acid, PGF:
prostaglandin
Glucose
HOMA-IR
TG
hs-CRP
Oxidized LDL
8-epi-PGF2
Total MUFA* 0.100
*
*
0.120**
0.145***
0.237***
0.046 0.104***
C16:1*, palmitoleic acid 0.043 0.038 0.154***
0.160***
-0.030 0.029
C18:19, oleic acid 0.114
*
**
0.137***
0.254***
0.194***
0.067+ 0.129
***
D9D 0.094
*
*
0.147***
0.180***
0.162***
0.067+ 0.119
***
C20:36 (DGLA) 0.055+ 0.162
*** 0.245
*** 0.164
*** 0.195
*** 0.027
C18:26(LA) -0.001 0.140***
-0.033 0.010 0.034 0.084*
C20:3 ω-6/C18:2 ω-6 0.059+ 0.078
* 0.296
*** 0.167
*** 0.200
*** -0.027
23

24
4. DISSCUSSION
4.1. General characteristics of study subjects
The aim of this present study was to investigate if serum phospholipid FA
compositions are associated with fasting glycemic status in healthy people. Our
cross-sectional study shows interesting results that serum phospholipid FAs,
particularly total MUFAs, OA and palmitoleic acid, and the estimated activity of
D9D, a desaturase enzyme which converts PA and SA to palmitoleic acid and OA,
respectively were significantly associated with the early alteration of fasting
glycemic status. In fact, as mentioned above, the association between the
proportion of individual FAs within lipid profiles and type 2 diabetes or the
related markers have been investigated in many cross-sectional and longitudinal
studies. However, our results for the first time demonstrated that specific MUFAs
in serum phospholipids and D9D activity may reflect the early alteration of the
fasting glycemic status in healthy condition without MetS nor other metabolic
disorder. It may suggest the possibility of these MUFAs and D9D as sensitive and
useful markers for the early prediction of the risk of type 2 diabetes and
cardiometabolic diseases.

25
Several observational and intervention studies reported that people with IR or
MetS showed higher proportions of PA and lower proportions of LA in serum
phospholipids, and higher activities of D9D and D6D and lower activity of D5D
compared with normal people [13-15]. D9D was particularly of an interest
because of its strong link to obesity and IR, thereby being favorable to type 2
diabetes and CVD [13,14,16-19]. Van Woudenbergh et al. compared serum
cholesteryl FA proportions and desaturase activities among normo-glycemic,
impaired glycemic and type 2 diabetic people, and showed that some of FAs (i.e.
SA, DGLA, AA) and desaturase activities (D9D and D5D) were associated with
glucose tolerance status and IR [20]. It was also reported that inhibition of D9D
improved glucose and insulin tolerance in obese ob/ob mice [21]. On the other
hand, systematic review and meta-analysis data reported that relatively long-term
consumption of high-MUFA diet reduced hemoglobin A1c % in adults with
abnormal glucose metabolism [22] and fasting glucose particularly in type 2
diabetic patients [23]. According to Ryan et al [30], diets rich in OA can reduce
IR in type 2 diabetic adult male, but Mayer-Davis et al [31] demonstrated a
positive association between dietary OA and IR, and Lovejoy et al. and
Hekmatdoost et al., reported no evidence for the relationship between OAs and IR
related markers [32, 33]. These discrepancies among the studies may be due to the
different study settings, such as study design (i.e. cross-sectional vs. intervention),

26
intervention period, study subjects (i.e. humans, vs. animals), health status of
subjects, ethnicity, gender, environmental backgrounds like dietary habits etc. For
example, Ralston et al. demonstrated that the relationship between FAs and IR
markers are ethnic- and gender- specific [34]; the associations between plasma FA
and markers of IR were found in Caucasian and East Asian populations, but not in
South Asian individuals, and these associations appeared to be more robust in
men. In addition as mentioned above, many of previous studies were performed
mainly in subjects at the risk of cardiometablic diseases including obesity, IR or
type 2 diabetes rather than in healthy people. Therefore, understanding and
controlling these factors may be important for investigating the contribution of
plasma FAs to the development of IR and type-2 diabetes.
Many studies have investigated the association of monounsaturated fatty acids
(MUFAs) and D9D with IR, and tried to decipher the mechanisms of their
involvement in the development of type 2 diebetes and cardiometabolic diseases
[16-19]. As mentioned above, D9Ds converts the saturate FAs, PA and SA to the
MUFAs, palmitoleic acid and OA, respectively [13, 14], and its critical role is
the involvement in FA metabolism and storage which are correlated with the
development of obesity-induced IR [35-38]. Monounsaturated products by D9D
were the major components and the preferred substrates for the synthesis of
cellular and circulating lipids (i.e. triglycerides, cholesterol ester and

27
phospholipids)[16-18]. D9D has been also reported to be involved in varied
effects on glucose uptake, glucose transporter and/or insulin signaling [39, 40].
Hyun et al. demonstrated that GLUT1 expression and glucose uptake were
increased by the white adipose tissue which is specificially deleted D9D in mice
and the pharmacological inhibition of D9D in 3T3-L1 adipocytes [39]. He
suggested that the D9D inhibition may influence regional glucose transporter
expression and glucose metabolism [39, 40]. Thus, the inhibitions of D9D activity
and its expression might bring improvements in IR, glucose clearance, and
hypercholesterolemia, as well as a reduction in adiposity [35, 36, 38, 41], and
have been thought as mechanistic targets for potential pharmaceutical therapies
for type 2 diabetes [42]. Therefore, the increase D9D activity and the higher
conversion by D9D may be thought to strongly link to obesity, IR and finally
favorable to type 2 diabetes and CVD [13, 14, 19].
In our study, total MUFAs and OA in serum phospholipids and D9D
positively correlated with fasting glucose level and HOMA-IR, whose
significance still maintained after adjusted for confounding factors including
MetS parameters. When study subjects were subdivided into 4 groups according
to fasting glucose level and MetS status, proportion of palmitoleic acid in serum
phospholipids was the highest in IFG-MetS and the lowest in NFG-nonMetS, and
interestingly, the compositions in IFG subjects were significantly higher than
those in NFG controls among nonMetS people. On the other hand, total MUFAs,

28
OA and D9D were not dramatically different between NFG and IFG subjects in
nonMetS group, even though their values were generally higher in IFG subjects
particularly in IFG-MetS group. Our results may be partly in accordance with the
previous reports [20]. Several cohort and cross-sectional studies reported the
positive association of palmitoleic acid among total MUFAs and individual
MUFAs in blood choesteryl or phospholipids, and D9D activity with type 2
diabetes [20]. Normally, palmitoleic acid is not present in the diet, therefore its
proportion was known to mainly reflect the conversion of ingested PA by D9D
[43]. On the other hand, OA is present abundantly in the diet particularly rich in
olive oils, therefore the proportion of OA within the human body may be
relatively less affected by possible changes in fat metabolism associated with
development of type 2 diabetes.
In our study subjects, several FAs, particularly total MUFAs and OA,
palmitoleic acids and D9D, which significantly correlated with glycemic
parameters and lipid profiles, also showed positive correlation with oxidative
stress and inflammation parameters. We assumed that the relationship between
these FAs and oxidative stress/inflammation markers observed in our healthy
subjects may be the sequential outcomes derived from relationship between those
FAs and the alteration of fasting glycemic status rather than the direct effect of
those FAs on oxidative stress and inflammatory response [21].
29
A limitation of the current study is that this cross-sectional study was not
designed for assessing the time sequential associations because the exposure and
outcomes are collected at one point in time. Further confirmation through the time
sequential observation and intervention studies are needed to identify the critical
role of MUFAs on the alteration of glycemic status and its possibility for the early
prediction of the risk of type 2 diabetes. In summary, despite the study limitations,
this cross-sectional study shows that serum phospholipid FAs particularly total
MUFAs, OA and palmitoleic acid, and the estimated D9D activity were
significantly associated with the early alteration of fasting glycemic status in
healthy people. It may suggest the possibility of these MUFAs and D9D as
sensitive and useful markers for the early prediction of the risk of type 2 diabetes
and cardiometabolic diseases.

30
5. REFERENCES
[1] Gokhan S, Hotamisligil, Liza, Makowski. The role of fatty acid binding
proteins in metabolic syndrome and atherosclerosis, Current Opinion in
Lipidology, 2005:16:543-548.
[2] Phillips CM, Tierney AC, Perez-Martinez P et al, Obesity and Body Fat
Classification in the Metabolic Syndrome:Impact on Cardiometabolic Risk
Metabotype, Obesity(Silver Spring) 2013 Jan 21 (1) 154-161.
[3] Alberti KG, Zimmet P, Shaw J, Metabolic syndrome-a new world – wide
definition. A Consensus Statement from the international Diabetes Federation.,
A journal of The British Diabetic Association [Diabetic Med], 2006:23(5),469-
480.
[4] G. Riccardi, R. Giacco, A.A. Rivellese, Dietary fat, insulin sensitivity and the
metabolic syndrome, Clinical nutrition, 2004: 23, 447-456.
[5] Marc T. Hamilton, Deborah G. Hamilton, and Theodore W. Zderic, Role of
Low Expenditure and Sitting in Obesity, Metabolic Syndrome, Type 2 Diabetes,
and Cardiovascular Disease, Diabetes, Vol. 56, 2007(11), 2655-2667.

31
[6] Steven D. Clarke, Polyunsaturated Fatty Acid Regulation of Gene
Transcription : A Molecular Mechanism to Improve the Metabolic Syndrome., J.
Nutr.,2001, 131:1129-1132.
[7] Kim OY, Lim HH, Lee MJ, Kim JY, Lee JH. Association of fatty acid
composition in serum phospholipids with metabolic syndrome and arterial
stiffness. Nutr Metab Cardiovas Dis. 2013;23:366-374.
[8] Warensjo E, Ohrvall M, Vessby B. Fatty acid composition and estimated
desaturase activities are associated with obesity and lifestyle variables in men
and women. Nutr Metab Cardiovasc Dis 2006;16(2):128-36.
[9] Warensjo E, Sundstro m J, Vessby B, Cederholm T, Rise rus U. Markers of
dietary fat quality and fatty acid desaturation as predictors of total and
cardiovascular mortality: apopulation-based prospective study. Am J Clin Nutr
2008; 88(1):203-9.
[10] Hooper L, Thompson RL, Harrison RA, Summerbell CD, Ness AR, Moore
HJ, Worthington HV, Durrington PN, Higgins JP, Capps NE, Riemersma RA,
Ebrahim SB, Davey Smith G 2006 Risks and benefits of omega 3 fats for
mortality, cardiovascular disease, and cancer: systematic review. BMJ
332:752-60.

32
[11] Dougherty RM, Galli C, Ferro-Luzzi A, Iacono JM. Lipid and phospholipid
fatty acid composition of plasma, red blood cells, and platelets and how they
are affected by dietary lipids: a study of normal subjects from Italy, Finland,
and the USA. Am J Clin Nutr 1987;45:443-55.
[12] Ma J, Folsom AR, Shahar E, Eckfeldt JH. Plasma fatty acid composition as
an indicator of habitual dietary fat intake in middle-aged adults. The Atheros-
clerosis Risk in Communities (ARIC) Study Investigators. Am J Clin Nutr
1995;62:564-71.
[13] Vessby B. Dietary fat and insulin action in humans. Br J Nutr. 2000;83(Suppl.
1):S91e6.
[14] Vessby B. Dietary fat, fatty acid composition in plasma and the metabolic
syndrome. Curr Opin Lipidol 2003;14:15-9.
[15] Leeson CP, Mann A, Kattenhorn M, Deanfield JE, Lucas A, Muller DP.
Relationship between circulating n-3 fatty acid concentrations and endothelial
function in early adulthood. Eur Heart J 2002;23:216-22.
[16]. Ntambi JM, Miyazaki M Regulation of stearoyl-CoA desaturases and role in
33
metabolism. Prog Lipid Res 2004;43:91-104.
[17] Listenberger LL, Schaffer JE Mechanisms of lipoapoptosis: implications for
human heart disease. Trends in Cardiovascular Medicine 2002;12:134-138.
[18]. Coll T, Eyre E, Rodriguez-Calvo R, Palomer X, Sanchez RM, Merlos M,
Laguna JC, Vazquez-Carrera M. Oleate reverses palmitate-induced insulin
resistance and inflammation in skeletal muscle cells. J Biol Chem
2008;283:11107-11116.
[19] Yao-Borengasser A, Rassouli N, Varma V, Bodles AM, Rasouli N, Unal R,
Phanavanh B, Ranganathan G, McGehee RE, Kern PA. Stearoyl-Coenzyme A
Desaturase 1 Gene Expression Increases after Pioglitazone Treatment and Is
Associated with Peroxisomal Proliferator-Activated Receptor-Responsiveness.
J Clin Endocrinol Metab 2008;93: 4431–4439.
[20] Van Woudenbergh GJ, Kuijsten A, Van der Kallen CJ, Van Greevenbroek
MM, Stehouwer CD, Blaak EE, Feskens EJM. Comparison of fatty acid
proportions in serum cholesteryl esters among people with different glucose
tolerance status: The CoDAM study. Nutr Metab Cardiovas Dis. 2012; 22:133-
140.

34
[21] Ortinau LC, Pickering RT, Nickelson KJ, Stromsdorfer KL, Naik CY,
Haynes RA, Bauman DE, Rector RS, Fritsche KL, Perfield JW II. Sterculic oil,
a natural SCD1 inhibitor, improves glucose tolerance in obese ob/ob Mice.
ISRN Endocrinology. 2012;20:947323.
[22] Schwingshackl L, Strasser B. Hoffmann G. Effect of monounsaturated fatty
acids on glycaemic control in patietns with abnormal glucose metabolism: a
systematic review and meta-analysis. Ann Nutr Metab. 2011;58:290-296.
[23] Schwingshackl L, Strasser B. High-MUFA diets reduce fasting glucose in
patients with type 2 diabetes. Ann Nutr Metab. 2012;60(1):33-4.
[24] National Cholesterol Education Program (NCEP) Expert Panel on Detection,
Evaluation, and Treatment of High Blood Cholesterol in Adults (Adult
Treatment Panel III). Third report of the national cholesterol education
program (NCEP) expert panel on detection, evaluation, and treatment of high
blood cholesterol in Adults (Adult Treatment Panel III) final report. Circulation
2002;106:3143-421.
[25] World Health Organization. The Asian Pacific perspective: redefining
obesity and its treatment. Health Communications Australia Pty Ltd.; February

35
2000.
[26] American Diabetes Association. Standards of medical care in diabetes-2010.
Diabetes Care 2010;33:s11-61.
[27] Folch J, Lees M, Sloane Stanley GH. A simple method for the isolation and
purification of total lipids from animal tissues. J Biol Chem 1957;226:497–509.
[28] Lepage G, Roy CC. Direct transesterification of all classes of lipids in a one-
step reaction. J Lipid Res 1986;27:114–20.
[29] Shim JS, Oh KW, Suh I, Kim MY, Shon CY, Lee EJ. A study on validity of
a 299 semiquantitative food frequency questionnaire of Korean adults. Kor J
Community Nutr 2002;7:484-94.
[30] Ryan M, McInerney D, Owens D, Collins P, Johnson A, Tomkin GH.
Diabetes and the Mediterranean diet: a beneficial effect of oleic acid on insulin
sensitivity, adipocyte glucose transport and endothelium-depen Diabetes and
the Mediterranean diet dent vasoreactivity. QJM 2000; 93:85–91.
[31] Mayer-Davis EJ, Monaco JH, Hoen HM, Carmichael S, Vitolins MZ, Rewers

36
MJ,Haffner SM, Ayad MF, Bergman RN, Karter AJ. Dietary fat and insulin
sensitivity in a triethnic population: the role of obesity. the insulin resistance
atherosclerosis study (IRAS). Am J Clin Nutr 1997;65:79–87.
[32] Lovejoy JC, Smith SR, Champagne CM, Most MM, Lefevre M, DeLany JP,
Denkins YM, Rood JC, Veldhuis J, Bray GA. Effects of diets enriched in
saturated (palmitic), monounsaturated (oleic), or trans (elaidic) fatty acids on
insulin sensitivity and substrate oxidation in healthy adults. Diabetes Care
2002;25:1283–1288.
[33] Hekmatdoost A, Mirmiran P, Hosseini-Esfahani F, Azizi F. Dietary fatty acid
composition and metabolic syndrome in Tehranian adults. Nutrition
2011;27:1002–1007.
[34] Ralston JC, Zulyniak MA, Nielsen DE, Clarke S, Badawi A, El-Sohemy A,
Ma DW, Mutch DM. Ethnic- and sex-specific associations between plasma
fatty acids and markers of insulin resistance in healthy young adults. Nutr
Metab. 2013;17;10:42.
[35] Ntambi, JM, Miyazaki M, Stoehr J. P. Loss of stearoyl- CoA desaturase-1
function protects mice against adiposity, Proc Natl Acad Sci USA. 2002;99:
37
11482–11486.
[36] Guti errez-Ju arez R, Pocai A, Mulas C. Critical role of stearoyl-CoA
desaturase—1 (SCD1) in the onset of diet-induced hepatic insulin resistance. J
Clinl Invest. 2006;116: 1686–1695.
[37] Dobrzyn P, Dobrzyn A, Miyazaki M. Stearoyl-CoA desaturase 1 deficiency
increases fatty acid oxidation by activating AMP-activated protein kinase in
liver. Proc Natl Acad Sci USA 2004;101:6409–6414.
[38] Miyazaki M, Dobrzyn A, Sampath H. Reduced adiposity and liver steatosis
by stearoyl-CoA desaturase deficiency are independent of peroxisome
proliferator-activated receptor-α. J Biol Chem. 2004;279: 35017– 35024.
[39] Hyun CK, Kim ED, Flowers MT. Adipose specific deletion of stearoyl-CoA
desaturase 1 up-regulates the glucose transporter GLUT1 in adipose tissue.
Biochem Biophys Res Commun. 2012;399:480–486.
[40] Miyazaki M, Flowers MT, Sampath H. Hepatic stearoyl-CoA desaturase-1
deficiency protects mice from carbohydrate-induced adiposity and hepatic
steatosis, Cell Metab. 2007; 6; 484–496.

38
[41] Miyazaki M, Sampath H, Liu X. Stearoyl-CoA desaturase-1 deficiency
attenuates obesity and insulin resistance in leptin-resistant obese mice.
Biochem Biophys Res Commun. 2009;380: 818–822.
[42] Carpino PA, Goodwin B. Diabetes area participation analysis: a review of
companies and targets described in the 2008–2010 patent literature. Expert
Opin Ther Pat. 2010;20:1627-1651.
[43] Phinney SD. Fatty acids, inflammation, and the metabolic syndrome. Am J
Clin Nutr 2005;82:1151e2.

39
국 문 초 록
혈청 인지질 단일불포화 지방산 조성 및 delta-9-desaturase 활
성과 공복혈당 초기 변화간의 상관성
연구 배경 및 목적 : 혈중 또는 식사내 지방산 조성의 변화는 인슐린저항성
또는 이와 관련한 대사 이상과 상관성이 높다고 보고되었다. 그러나, 대부분
의 연구는 혈청 인지질 지방산조성과 공복혈당의 초기 변화에 대한 연관성에
대해서 보고하고 있지 않다. 따라서 본 연구에서는 질환이 없는 성인에서 혈
청 인지질 지방산 조성과 이와 관련한 효소의 활성이 초기 혈당변화와 상관성
이 있는지 살펴보고자 하였다.
연구 방법 : 질환이 없는 성인 1022명(30-69세)을 대상으로 혈청 인지질
지방산조성, 효소의 활성, 공복 혈당관련 지표, 심혈관계위험 지표 등을 측정
하였다. 연구 참여대상자는 공복혈당 수준에 따라 정상공복혈당 (normal
fasting glucose, NFG)와 공복혈당장애 (impaired fasting glucose, IFG)로
나누어 비교 관찰하였다.
결 과: 혈청 인지질 지방산 조성 중 총 단일불포화지방산(monounsatura
-ted fatty aicd, MUFAs), 올레산 (oleic acid, OA, C18:1,ω9), 다이-호

40
모-감마리놀레산 (dihomo-γ-linoleic acid, DGLA, C20:3,ω6), 델타-9-불
포화효소 (deltal-9-desaturase, D9D) 활성과 DGLA/리놀레산 (Linoleic
acid, LA, C18:2ω6) 비율은 NFG 집단보다 IFG 집단에서 유의적으로 높았다.
또한 연구대상자를 공복 혈당 수준과 대사증후군(Metabolic syndrome,
MetS) 여부에 따라 네집단(NFG-nonMetS, IFG-nonMetS, NFG-MetS,
IFG-MetS)으로 나누어 비교하였다. 혈청 인지질 지방산 중 팔미톨레산
(Palmitoleic acid, C16:1ω7) 조성은 IFG-MetS집단에서 가장 낮았고,
NFG-nonMetS에서 가장 높았다. OA와 D9D의 조성은 IFG-MetS집단에서
세집단보다 유의적으로 높은 것으로 나타났다. DGLA와 DGLA/LA 비율은 공
복혈당 농도와 관계없이 MetS에서 nonMetS보다 높게 나타났다. 심혈관질환
위험을 나타내는 지표인 hs-CRP와 8-epi-PFG2는 대사성 증후군 상태와
관계없이 NFG보다 IFG에서 더 높았다. Ox-LDLs는 IFG-MetS에서 더 높
았고, 총 MUFAs, OA, D9D는 인슐린저항성지표 (HOMA-IR), 공복당, 중성
지방(TG), hs-CRP, 8-epi-PFG2와도 양의 상관관계를 보였고, 팔미톨레산
도 중성지방과 hs-CRP와 양의 상관관계를 보였다.
결론: 결론적으로, 혈중 인지질 중에서 총 MUFAs, OA, 팔미톨레산, D9D는
공복당 초기변화와 연관이 있고, 제 2형 당뇨병과 심장 대사질환의 위험요인
에 대해 초기 예측에 유용한 표지자임을 암시했다.
--------------------------------------------
핵심단어 : 단일불포화지방산, 올레산, 델타-9-불포화효소, 공복혈당, 심혈관대사 위험.