association mapping: design issues and data analysis...
TRANSCRIPT
Jan. 4, 2005 PSB '05
Association Mapping: Design issues and data analysis approaches
Leif SchauserThomas MailundJesper N. Madsen
Jotun HeinMikkel H. Schierup
Bioinformatics ApS, Univ. Oxford and Univ. of Aarhus

Jan. 4, 2005 PSB '05
The concept of mapping in case-control studies
Chromosome
= Marker
= Disease gene
Mapping function
Pr (Disease gene location | data)
Assess genotype / haplotypefrequency in diseased andhealthy individuals
Jan. 4, 2005 PSB '05
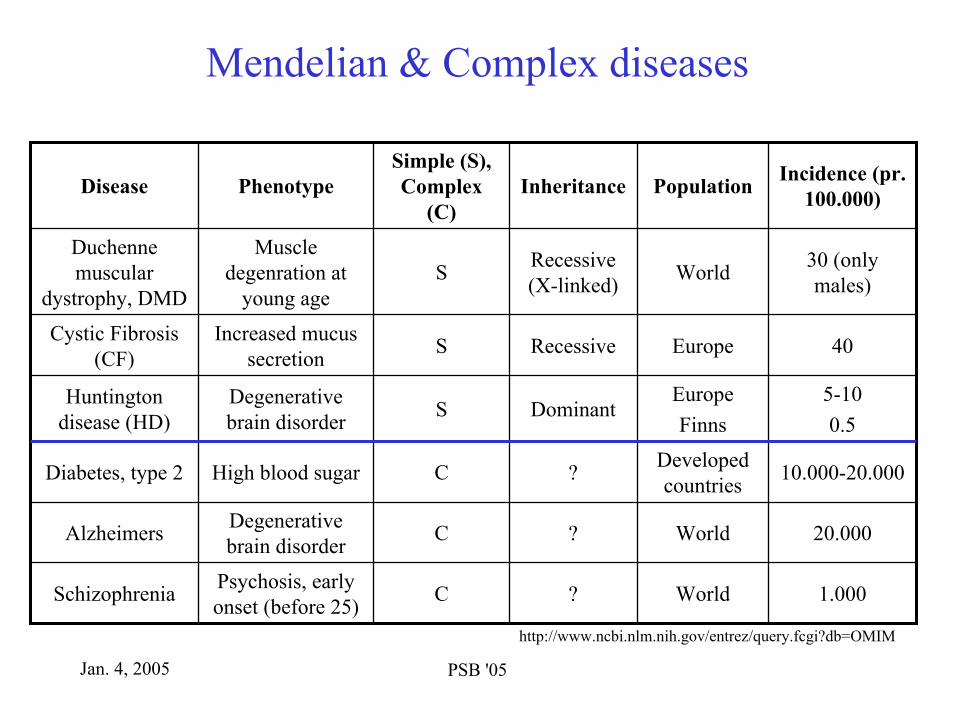
Mendelian & Complex diseases
?
?
?
Dominant
Recessive
Recessive (X-linked)
Inheritance
20.000WorldCDegenerative brain disorderAlzheimers
40EuropeSIncreased mucus secretion
Cystic Fibrosis (CF)
5-100.5
EuropeFinns
SDegenerative brain disorder
Huntington disease (HD)
Incidence (pr. 100.000)Population
Simple (S), Complex
(C)PhenotypeDisease
30 (only males)WorldS
Muscle degenration at
young age
Duchennemuscular
dystrophy, DMD
10.000-20.000Developed countriesCHigh blood sugarDiabetes, type 2
1.000WorldCPsychosis, early onset (before 25)Schizophrenia
http://www.ncbi.nlm.nih.gov/entrez/query.fcgi?db=OMIM

Jan. 4, 2005 PSB '05Frank (2004) 5, 764:772
Molecular mechanisms of complex diseases
Jan. 4, 2005 PSB '05
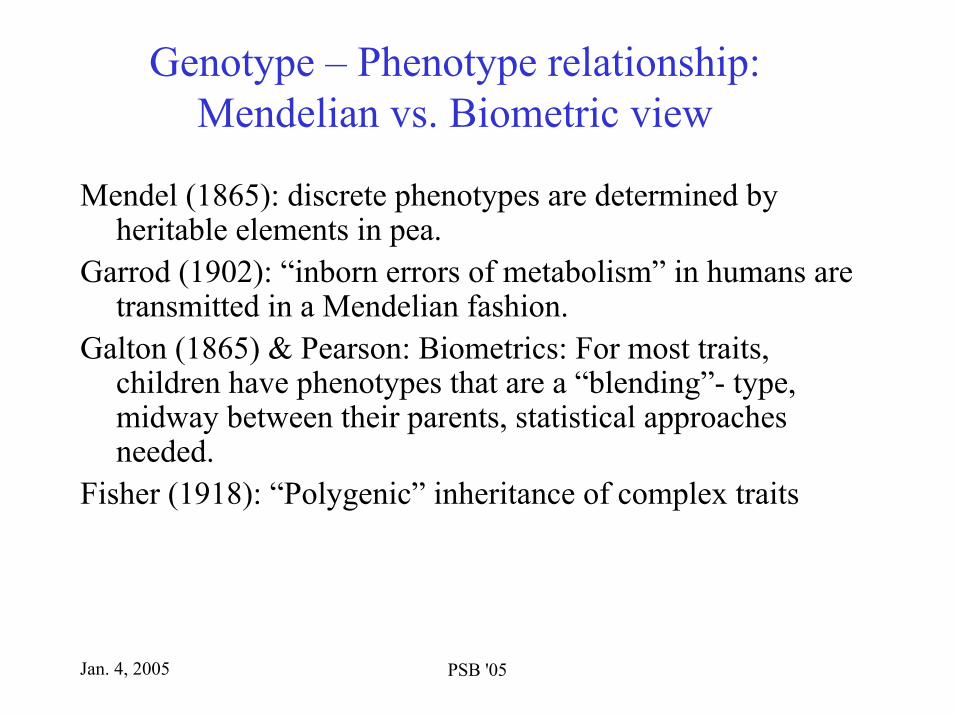
Genotype – Phenotype relationship: Mendelian vs. Biometric view
Mendel (1865): discrete phenotypes are determined by heritable elements in pea.
Garrod (1902): “inborn errors of metabolism” in humans are transmitted in a Mendelian fashion.
Galton (1865) & Pearson: Biometrics: For most traits, children have phenotypes that are a “blending”- type, midway between their parents, statistical approaches needed.
Fisher (1918): “Polygenic” inheritance of complex traits
Jan. 4, 2005 PSB '05
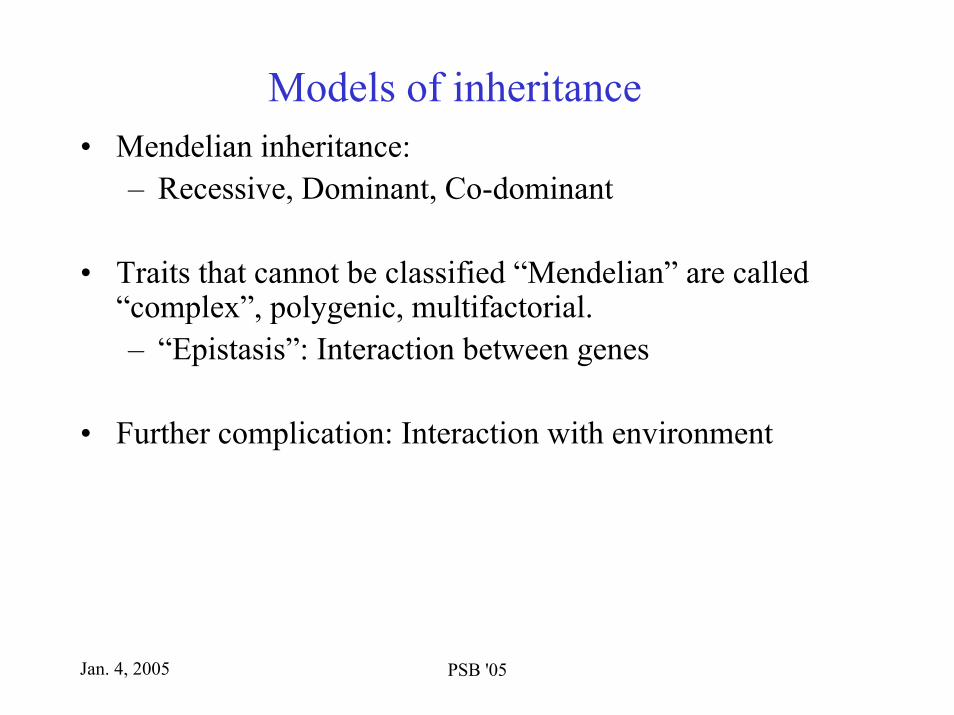
Models of inheritance• Mendelian inheritance:
– Recessive, Dominant, Co-dominant
• Traits that cannot be classified “Mendelian” are called “complex”, polygenic, multifactorial.– “Epistasis”: Interaction between genes
• Further complication: Interaction with environment

Jan. 4, 2005 PSB '05
Genotype –> Phenotype: Penetrance• = P(disease | alleles)• Genotypic absolute risk• Alleles causing Mendelian diseases are highly penetrant• P(cystic fibrosis | two CFTR ∆F508 alleles) high (1)
• P(complex disease | risk allele) low (0.02)
Jan. 4, 2005 PSB '05
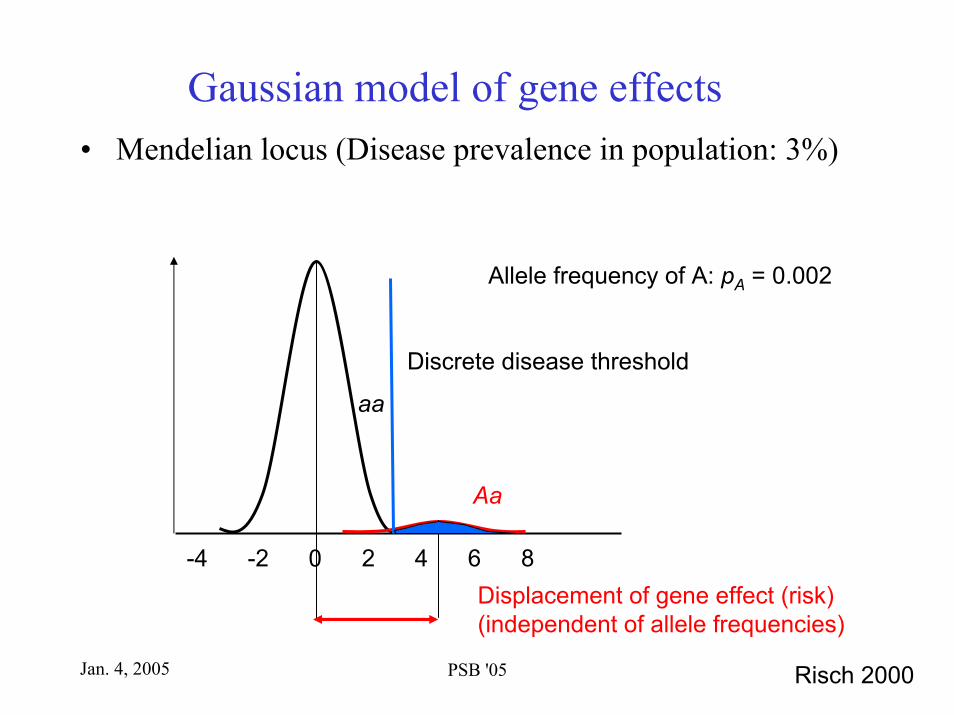
Gaussian model of gene effects• Mendelian locus (Disease prevalence in population: 3%)
Allele frequency of A: pA = 0.002
aa
Aa
Discrete disease threshold
-4 -2 2 4 6 80Displacement of gene effect (risk)(independent of allele frequencies)
Risch 2000

Jan. 4, 2005 PSB '05
Gaussian model of gene effects• Non-mendelian locus
aa
AA
Aa
Allele frequency of A: pA = 0.4
-4 -2 2 4 6 80
Additive liability

Jan. 4, 2005 PSB '05
Gaussian model of gene effects• Non-mendelian two-locus epistasis
-2 0 2 4 6
aabb
AaBbAAbbaaBB
AabbaaBb
pA = 0.1pB = 0.1
Other genotypesvery rare
-4 8

Jan. 4, 2005 PSB '05
Relative Risks
• Sibling Relative risk (SRR): P(disease|sibling=disease)/P(disease)– Schizophrenia Relative risk
• SRR (monozygotic twin=disease) = 50• SRR (dizygotic twin=disease) = 14• SRR (sibling=disease) = 10
• Genotypic relative risk (GRR): P(disease|mutant allele)/P(disease)– Type 2 Diabetes PPAR-γ Pro12Ala
• GRR (Ala) = 0.8
Jan. 4, 2005 PSB '05
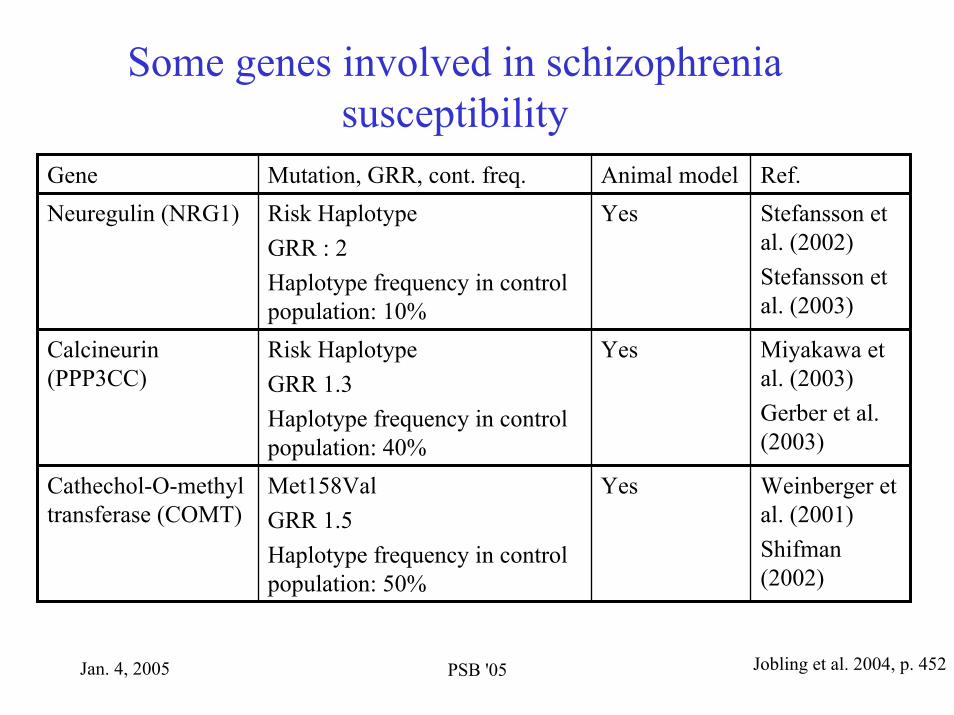
Some genes involved in schizophrenia susceptibility
Ref.Animal modelMutation, GRR, cont. freq.GeneStefansson et al. (2002)Stefansson et al. (2003)
YesRisk HaplotypeGRR : 2Haplotype frequency in control population: 10%
Neuregulin (NRG1)
Miyakawa et al. (2003)Gerber et al. (2003)
YesRisk HaplotypeGRR 1.3Haplotype frequency in control population: 40%
Calcineurin(PPP3CC)
Weinberger et al. (2001)Shifman(2002)
YesMet158ValGRR 1.5Haplotype frequency in control population: 50%
Cathechol-O-methyl transferase (COMT)
Jobling et al. 2004, p. 452

Jan. 4, 2005 PSB '05
Odds Ratio
• How much more likely is the disease state when exposed to risk factor than without exposure to risk factor?
ControlsCases
dc
baRisk factor present a + b
Risk factor absent c + d
a + c b + d
Odds[1] = #Cases / #Controls for group with risk factor presentOdds[2] = #Cases / #Controls for group with risk factor absent
Jan. 4, 2005 PSB '05
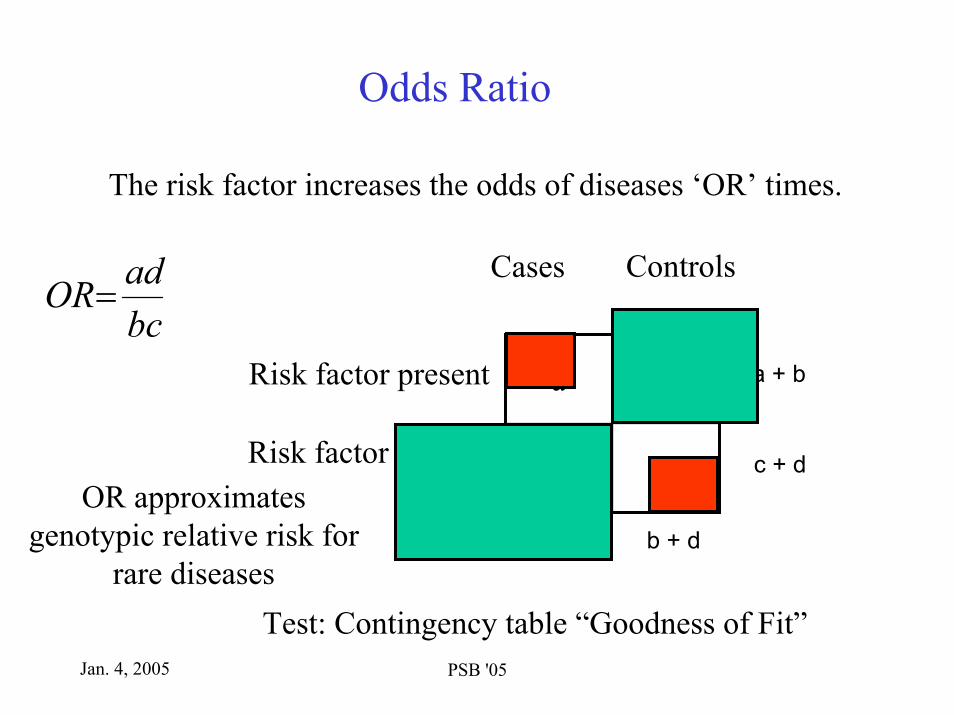
Odds Ratio
The risk factor increases the odds of diseases ‘OR’ times.
Risk factor absent dc
ba a + b
c + d
b + da + c
bcadOR=
Test: Contingency table “Goodness of Fit”
OR approximates genotypic relative risk for
rare diseases
Risk factor present
ControlsCases

Jan. 4, 2005 PSB '05
Example of risk measures: Colorectal cancer –APC associations
Allele FAP mutations APC I1307K
Associated genotype Heterozygous HeterozygousGenotype prevalence 1/8000 1/15Absolute risk ~1.0 0.05Relative risk > 30 2Attributable fraction 0.004 0.06
Bodmer (1999) Familial adenomatous polyposis (FAP) and its gene, APC. Cytogenetics and Cell Genetics 86: 99 – 104.Woodage et al. (1998) The APC I1307K allele and cancer risk in a community-based study of Ashkenazi Jews. Nature
Genetics 20: 62-65.
Attributable fraction: Fraction of cases that would not have occurred had the risk factor been absent
Jan. 4, 2005 PSB '05
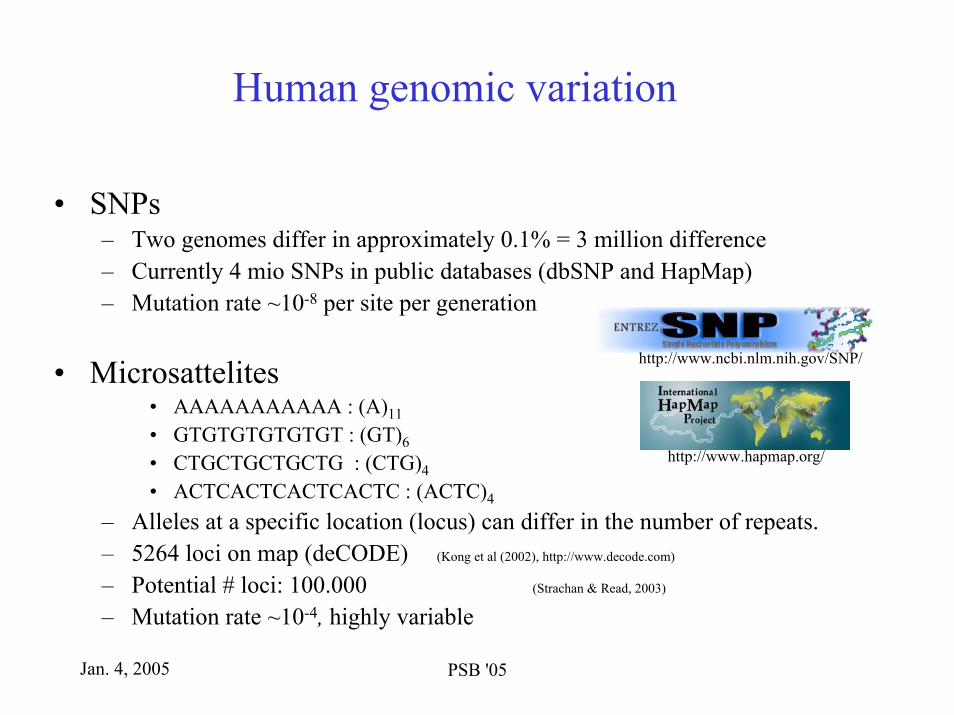
Human genomic variation
• SNPs– Two genomes differ in approximately 0.1% = 3 million difference– Currently 4 mio SNPs in public databases (dbSNP and HapMap)– Mutation rate ~10-8 per site per generation
• Microsattelites• AAAAAAAAAAA : (A)11• GTGTGTGTGTGT : (GT)6• CTGCTGCTGCTG : (CTG)4• ACTCACTCACTCACTC : (ACTC)4
– Alleles at a specific location (locus) can differ in the number of repeats. – 5264 loci on map (deCODE) (Kong et al (2002), http://www.decode.com)
– Potential # loci: 100.000 (Strachan & Read, 2003)
– Mutation rate ~10-4, highly variable
http://www.ncbi.nlm.nih.gov/SNP/
http://www.hapmap.org/
Jan. 4, 2005 PSB '05
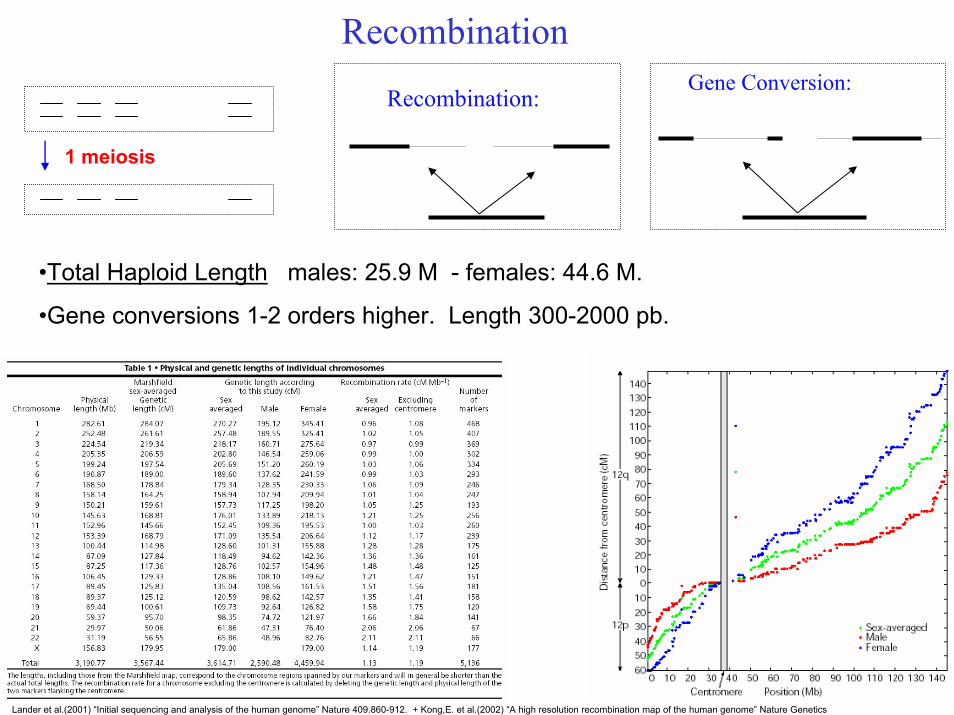
RecombinationGene Conversion:
Recombination:
1 meiosis
•Total Haploid Length males: 25.9 M - females: 44.6 M.
•Gene conversions 1-2 orders higher. Length 300-2000 pb.
Lander et al.(2001) “Initial sequencing and analysis of the human genome” Nature 409.860-912. + Kong,E. et al.(2002) “A high resolution recombination map of the human genome” Nature Genetics

Jan. 4, 2005 PSB '05
Population structure• Many populations are structured (partitioned)
– Geographic (Valleys)– Social (Castes)– Religious (Jews, Amish)– Ethnic, cultural (Afro American, Cajun)
=> Population genetic assumption of random mating does not hold

Jan. 4, 2005 PSB '05
HapMapAim: Genotype SNPs, identify blocks and develop 500.000 “tag SNPs”.• 270 people from:
– Yoruba people in Ibadan, Nigeria (30 both-parent-and-adult-child trios),
– Japanese in Tokyo (45 unrelated individuals), – Han Chinese in Beijing (45 unrelated individuals),– CEPH (30 trios, Utah residents with ancestry from northern and western
Europe).• Define haplotypes of frequency > 5 %.
The International HapMap Consortium (2003), www.hapmap.org
432,523 412,608412,669 956,730Genotyped SNPs
YRIJPTHCBCEUPopulations
Jan. 4, 2005 PSB '05
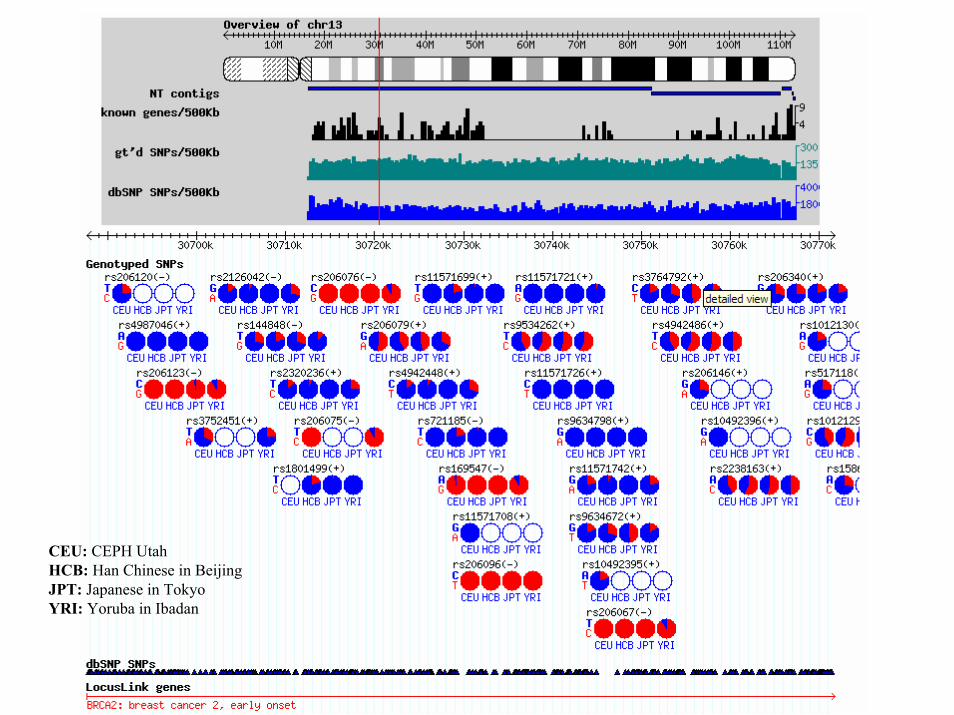
CEU: CEPH UtahHCB: Han Chinese in Beijing JPT: Japanese in Tokyo YRI: Yoruba in Ibadan
Jan. 4, 2005 PSB '05
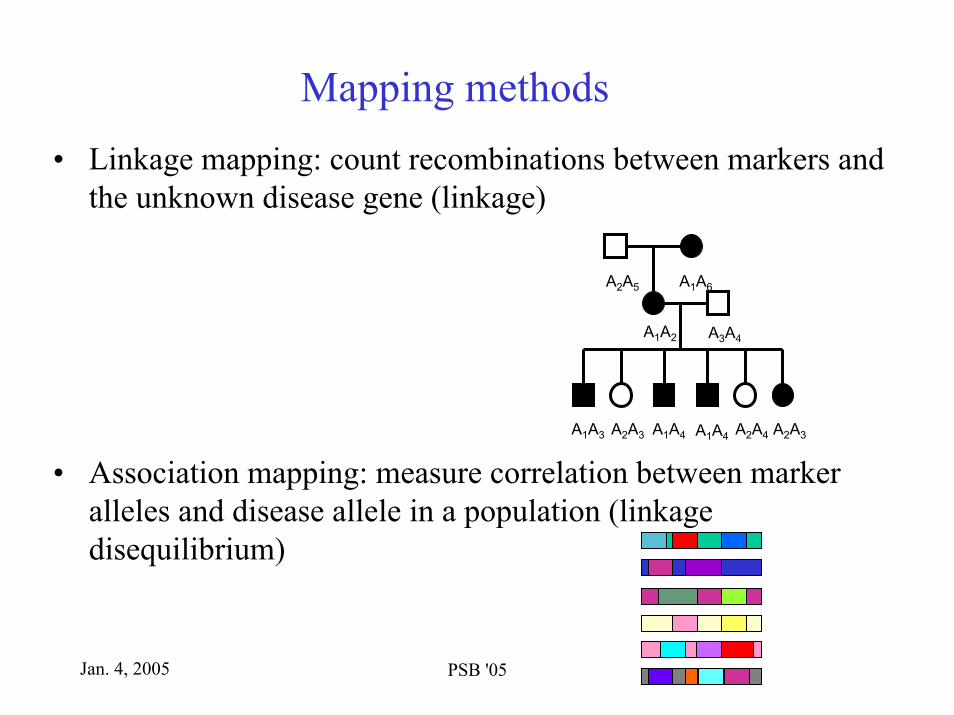
Mapping methods• Linkage mapping: count recombinations between markers and
the unknown disease gene (linkage)
• Association mapping: measure correlation between marker alleles and disease allele in a population (linkage disequilibrium)
A2A5 A1A6
A1A2 A3A4
A1A3 A2A3 A1A4 A1A4 A2A4 A2A3
Jan. 4, 2005 PSB '05
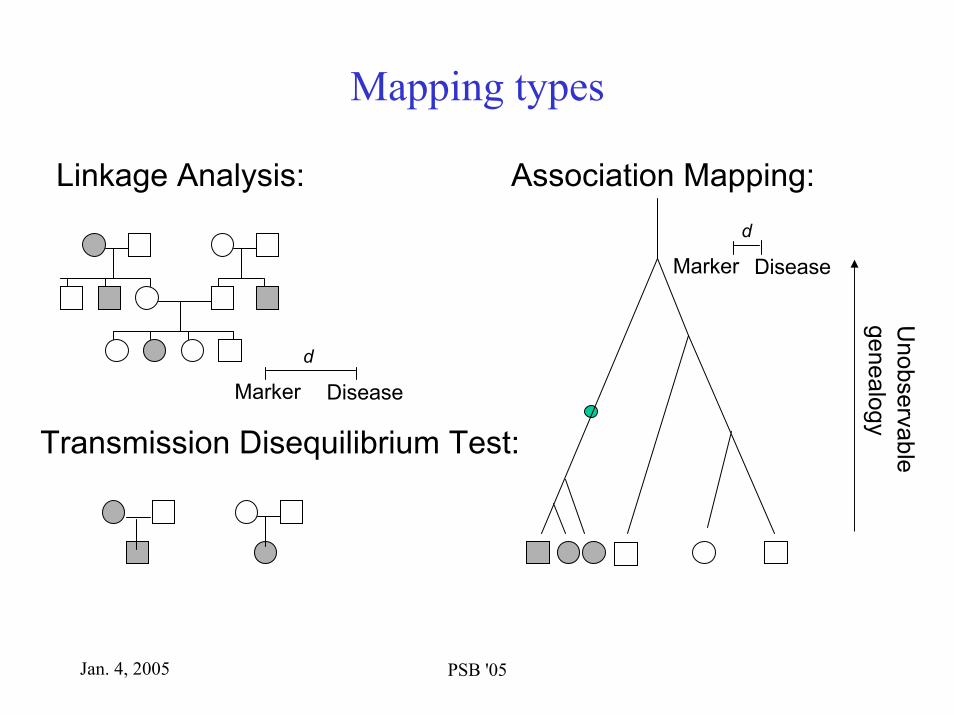
Mapping types
Linkage Analysis:
Transmission Disequilibrium Test:
Marker Disease
d
Marker Disease
d
Association Mapping:
Unobservable
genealogy
Jan. 4, 2005 PSB '05
Association
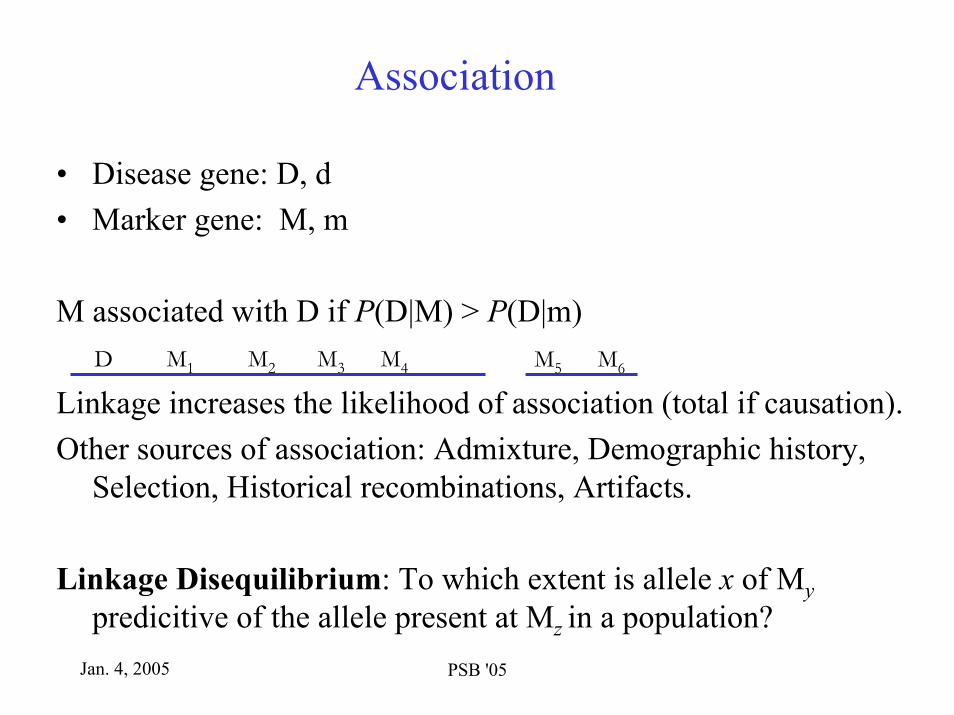
• Disease gene: D, d• Marker gene: M, m
M associated with D if P(D|M) > P(D|m)
Linkage increases the likelihood of association (total if causation).Other sources of association: Admixture, Demographic history,
Selection, Historical recombinations, Artifacts.
Linkage Disequilibrium: To which extent is allele x of Mypredicitive of the allele present at Mz in a population?
D M1 M2 M3 M4 M5 M6

Jan. 4, 2005 PSB '05
Unknown genealogy at mutation position
Incomplete penetranceNon-genetic or different gene

Jan. 4, 2005 PSB '05
Linkage disequilibrium mappingHaplotype frequencyMarker BMarker A
1
1
1
2
2 2
2 1
30%
15%
5%
50%Ancient population
Mutation arises
Marker ACase population:
Marker BMutation
1
1
1
2
2 2
70%
20%
2%
8%Marker BMarker A
1
1
1
2
2 2
30%
15%
5%
50%
Present population
Control population:
2 1 2 1
Jan. 4, 2005 PSB '05
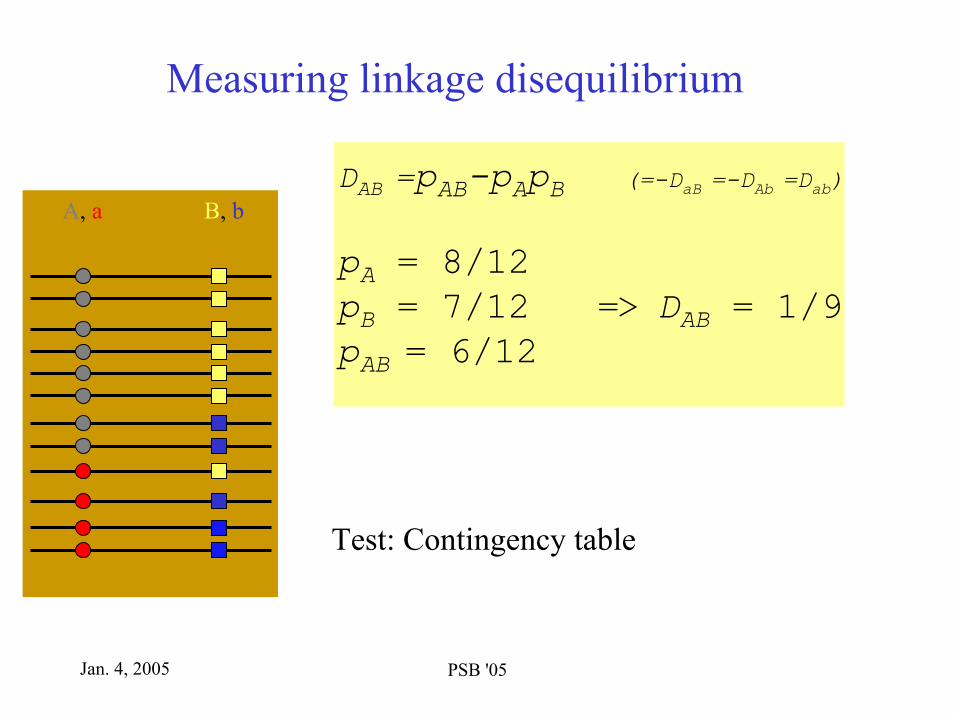
Measuring linkage disequilibrium
DAB =pAB-pApB (=-DaB =-DAb =Dab)
pA = 8/12pB = 7/12 => DAB = 1/9pAB = 6/12
A, a B, b
Test: Contingency table
Jan. 4, 2005 PSB '05
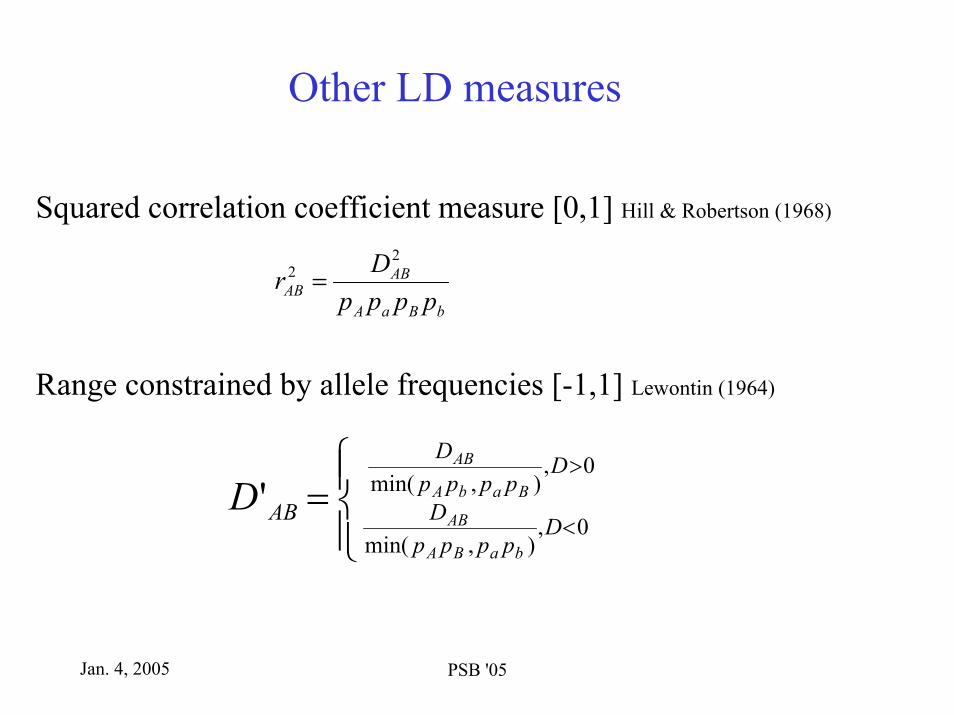
Other LD measures
Squared correlation coefficient measure [0,1] Hill & Robertson (1968)
bBaA
ABAB pppp
Dr2
2 =
Range constrained by allele frequencies [-1,1] Lewontin (1964)
=>
<
0,),min(
0,),min(
'D
ppppD
Dpppp
DABBabA
AB
baBA
ABD

Jan. 4, 2005 PSB '05
CEU: CEPH UtahHCB: Han Chinese in Beijing JPT: Japanese in Tokyo YRI: Yoruba in Ibadan
Jan. 4, 2005 PSB '05
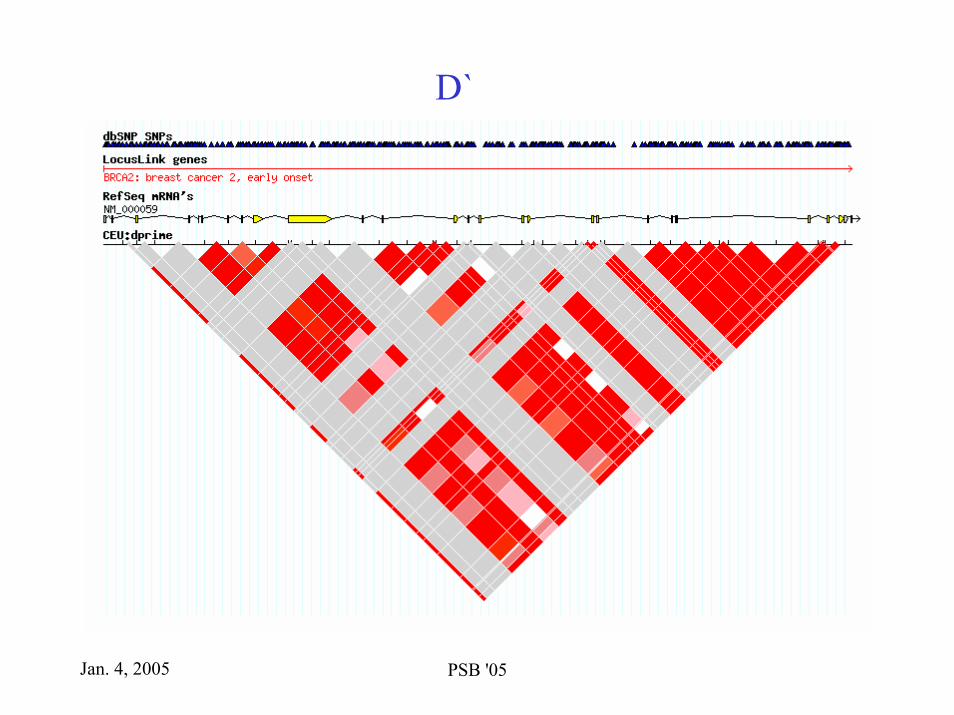
D`

Jan. 4, 2005 PSB '05
r2

Jan. 4, 2005 PSB '05
LD mapping of BRCA2
Iceland: Prevalence of disease: 10%Known BRCA2 mutation in Iceland: BRCA2_999del5 Population frequncy: 0.4%. Frequency among cases: 8%.
Iceland Genomics Corporation genotyped1132 Cases, 54 with known mutation - 758 Controlsat 15 microsattelite markers, spanning a region of 10 cM
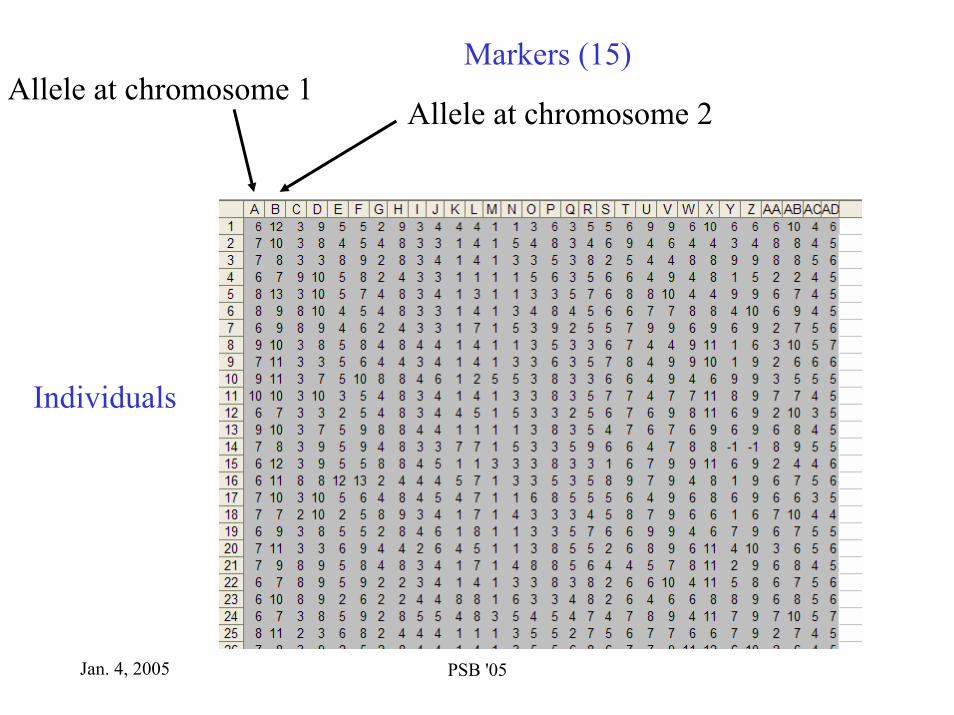
Jan. 4, 2005 PSB '05
Markers (15)Allele at chromosome 1
Allele at chromosome 2
Individuals
Jan. 4, 2005 PSB '05
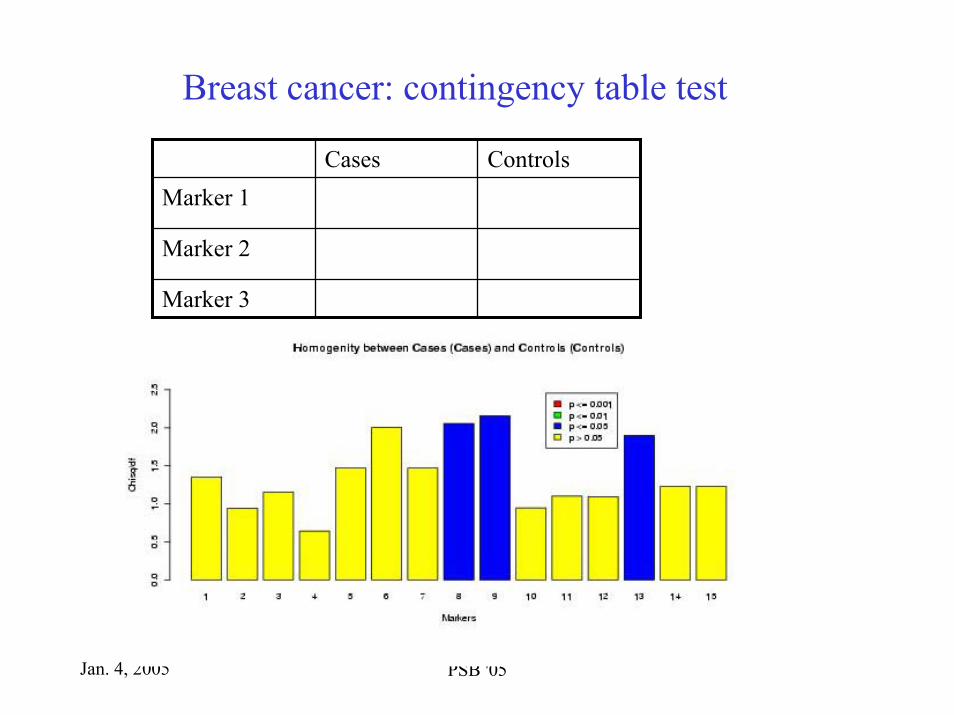
Breast cancer: contingency table test
ControlsCasesMarker 1
Marker 3
Marker 2
Jan. 4, 2005 PSB '05
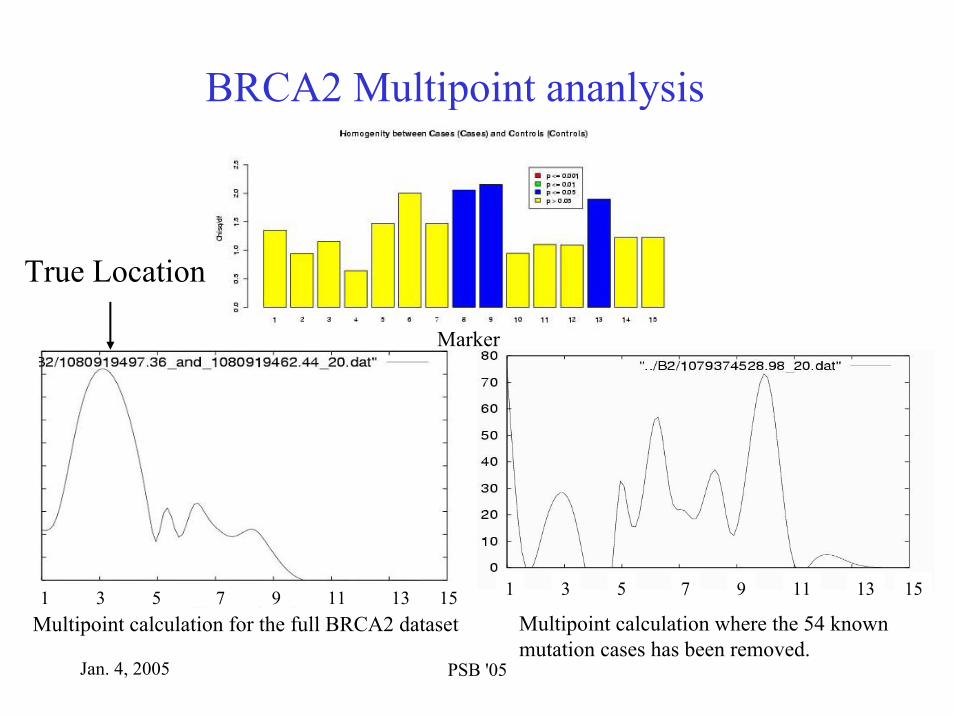
BRCA2 Multipoint ananlysis
1 3 5 7 9 11 13 15 1 3 5 7 9 11 13 15
True Location
Multipoint calculation for the full BRCA2 dataset
Marker
Multipoint calculation where the 54 known mutation cases has been removed.
Jan. 4, 2005 PSB '05
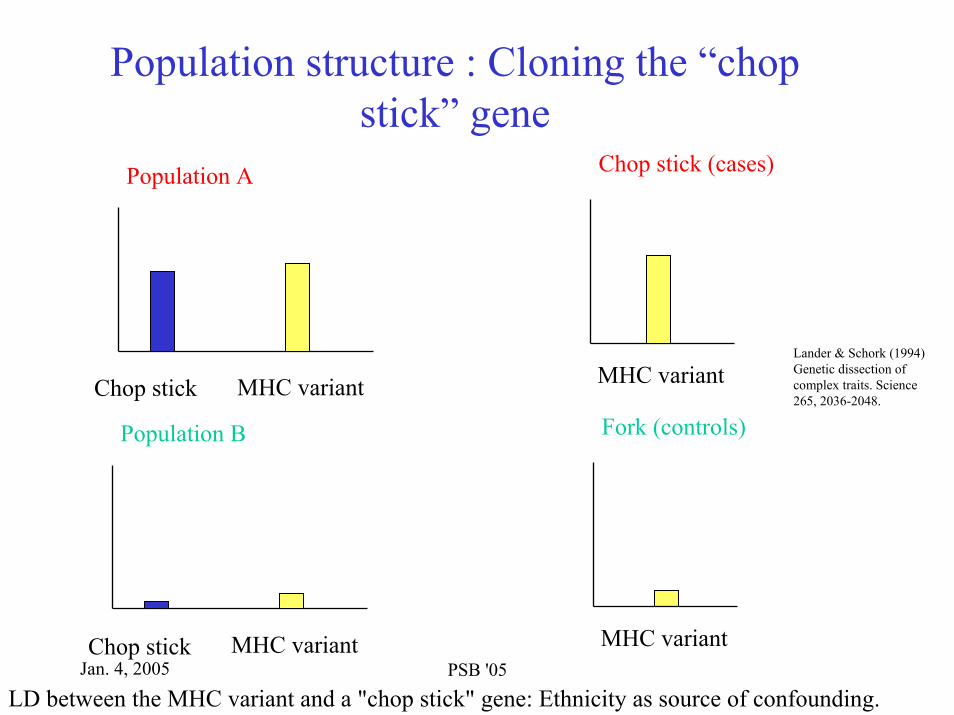
Population structure : Cloning the “chop stick” gene
Lander & Schork (1994)Genetic dissection of complex traits. Science 265, 2036-2048.
Chop stick (cases)
MHC variant
Fork (controls)
MHC variant
Population A
Chop stick MHC variant
Population B
Chop stick MHC variant
LD between the MHC variant and a "chop stick" gene: Ethnicity as source of confounding.

Jan. 4, 2005 PSB '05
Dealing with population admixture• Structured association (Pritchard et al., 2000)
– Discover structure from set of unlinked markers, i.e. assign probabilities of ancestry from k populations to each individual, and then control for it.
• Genomic control (Devlin and Roeder, 1999)– Inflate the distribution of the test statistic by λ.– λ estimated from data
How common is structure?Marchini J et al. 2004, Freedman ML et al. 2004
Jan. 4, 2005 PSB '05
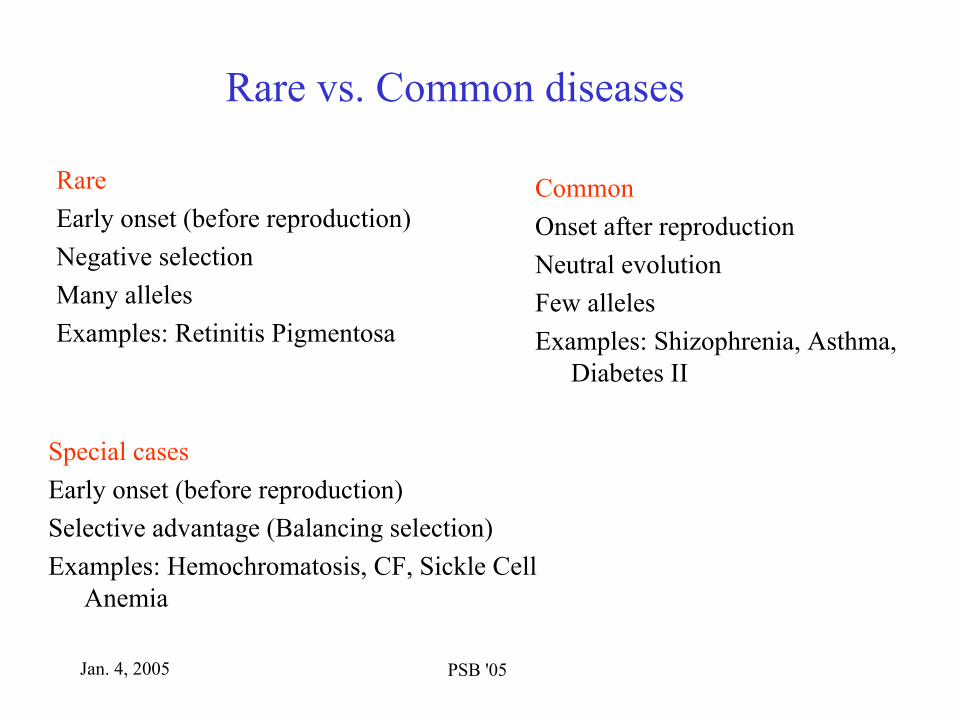
Rare vs. Common diseases
Rare Early onset (before reproduction)Negative selectionMany allelesExamples: Retinitis Pigmentosa
CommonOnset after reproductionNeutral evolutionFew allelesExamples: Shizophrenia, Asthma,
Diabetes II
Special casesEarly onset (before reproduction)Selective advantage (Balancing selection)Examples: Hemochromatosis, CF, Sickle Cell
Anemia

Jan. 4, 2005 PSB '05
The common disease / common variant hypothesis
Rare variant Common variant
Presence
Reich & Lander 2001
f0 = 1/8 f0 = 1/2Past
Exponential growth
Jan. 4, 2005 PSB '05
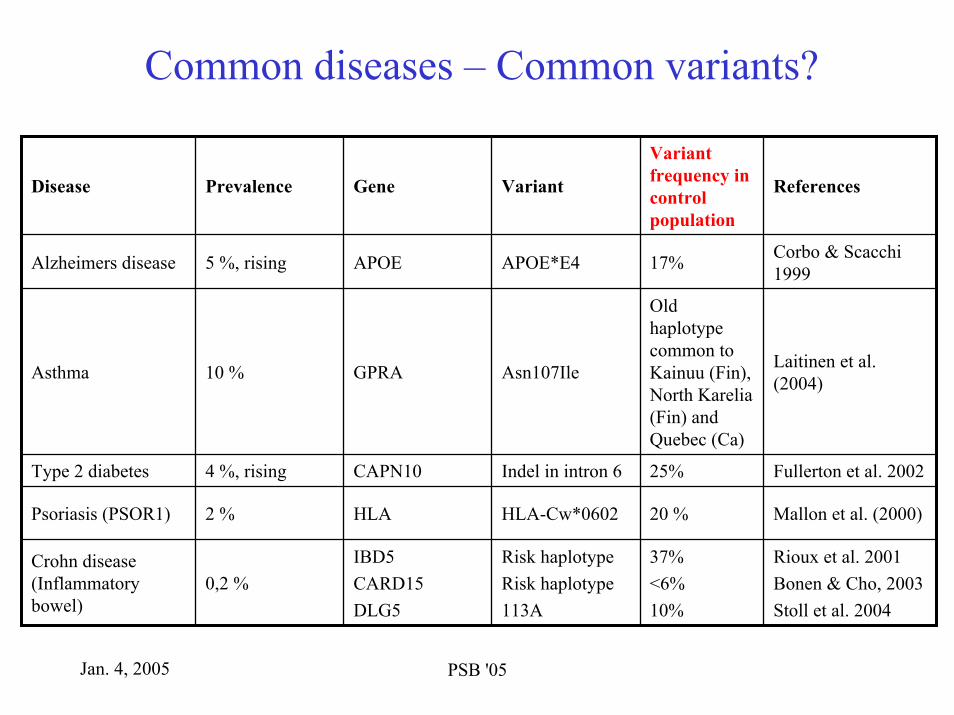
Common diseases – Common variants?
0,2 %
2 %
4 %, rising
10 %
5 %, rising
Prevalence
Fullerton et al. 200225%Indel in intron 6CAPN10Type 2 diabetes
Mallon et al. (2000)20 %HLA-Cw*0602HLAPsoriasis (PSOR1)
Rioux et al. 2001Bonen & Cho, 2003Stoll et al. 2004
37%<6%10%
Risk haplotypeRisk haplotype113A
IBD5CARD15 DLG5
Crohn disease (Inflammatory bowel)
Old haplotypecommon to Kainuu (Fin), North Karelia(Fin) and Quebec (Ca)
17%
Variant frequency in control population
ReferencesVariantGeneDisease
Laitinen et al. (2004)Asn107IleGPRAAsthma
Corbo & Scacchi1999APOE*E4APOEAlzheimers disease

Jan. 4, 2005 PSB '05
Parameters of population choice• Considerations:
– Size– Extent of LD – Demographic history
• Bottlenecks• Number of founders• Inbreeding• Isolation
– Admixture
• Balance between:– Power– Mapping resolution– Heterogeneity
– Allelic – Locus– Disease
Jan. 4, 2005 PSB '05
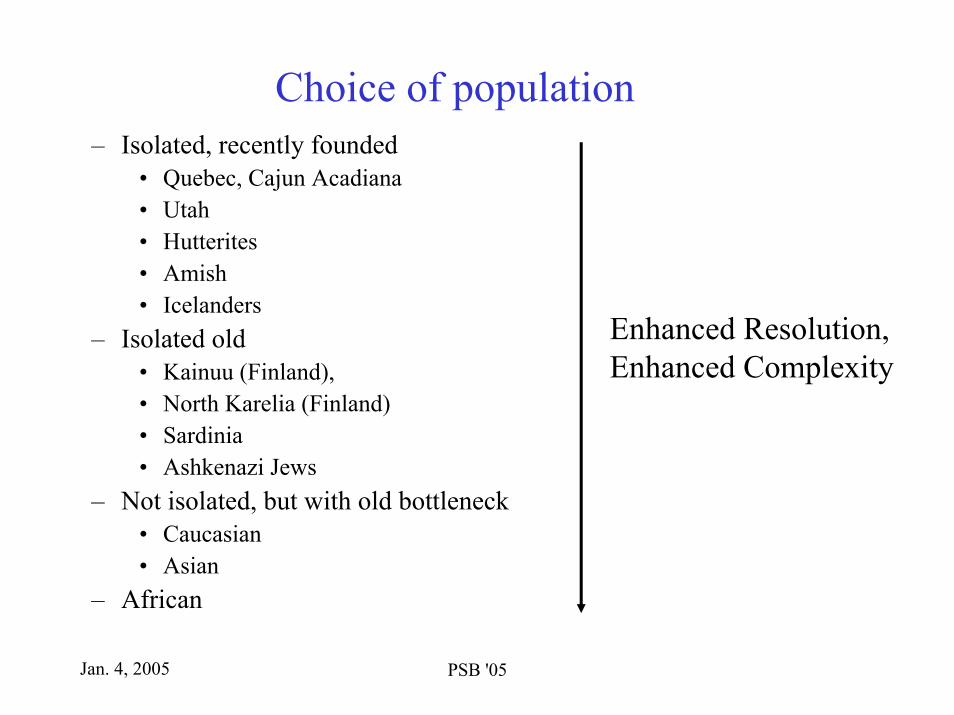
Choice of population– Isolated, recently founded
• Quebec, Cajun Acadiana• Utah• Hutterites• Amish• Icelanders
– Isolated old• Kainuu (Finland), • North Karelia (Finland)• Sardinia• Ashkenazi Jews
– Not isolated, but with old bottleneck• Caucasian• Asian
– African
Enhanced Resolution,Enhanced Complexity
Jan. 4, 2005 PSB '05
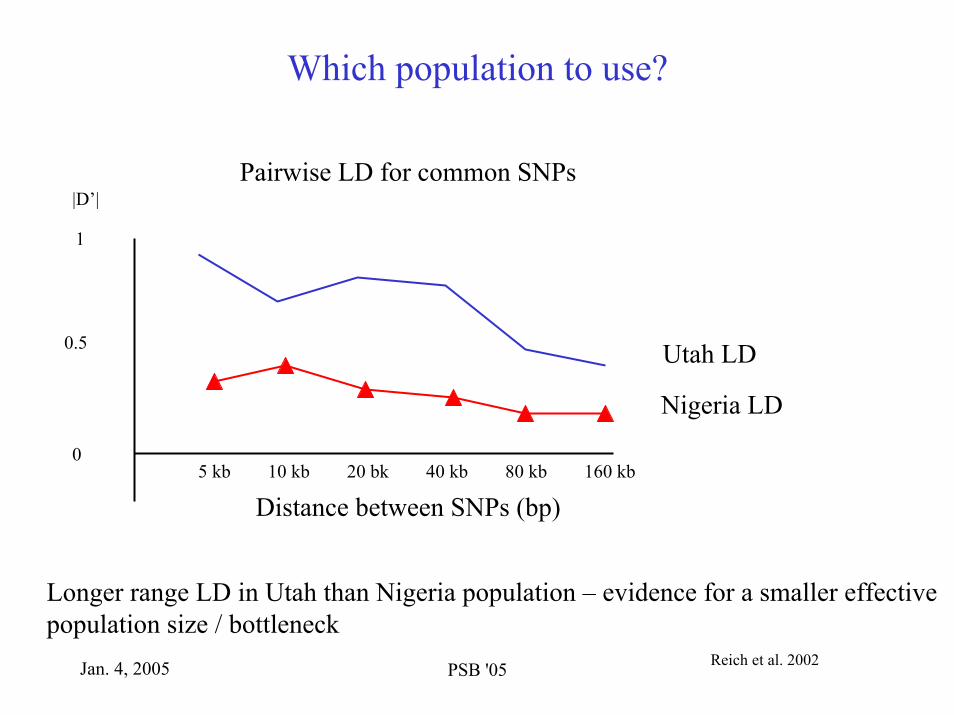
Which population to use?
Pairwise LD for common SNPs|D’|
1
0.5 Utah LD
Nigeria LD
05 kb 10 kb 20 bk 40 kb 80 kb 160 kb
Distance between SNPs (bp)
Longer range LD in Utah than Nigeria population – evidence for a smaller effective population size / bottleneck
Reich et al. 2002
Jan. 4, 2005 PSB '05
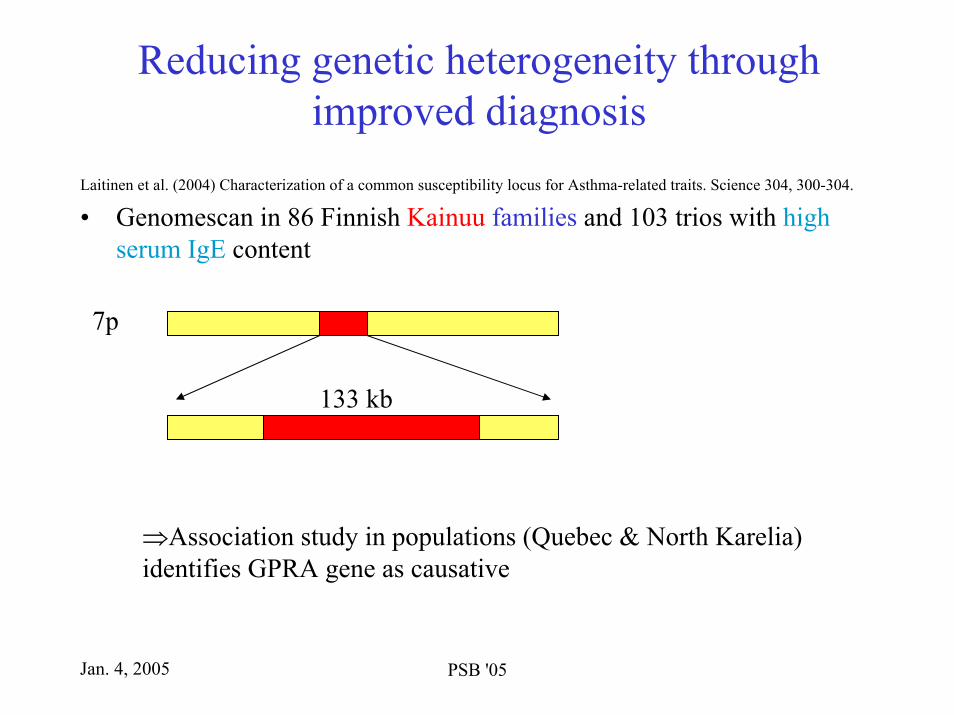
Reducing genetic heterogeneity through improved diagnosis
Laitinen et al. (2004) Characterization of a common susceptibility locus for Asthma-related traits. Science 304, 300-304.
• Genomescan in 86 Finnish Kainuu families and 103 trios with high serum IgE content
7p
133 kb
⇒Association study in populations (Quebec & North Karelia)identifies GPRA gene as causative

Jan. 4, 2005 PSB '05
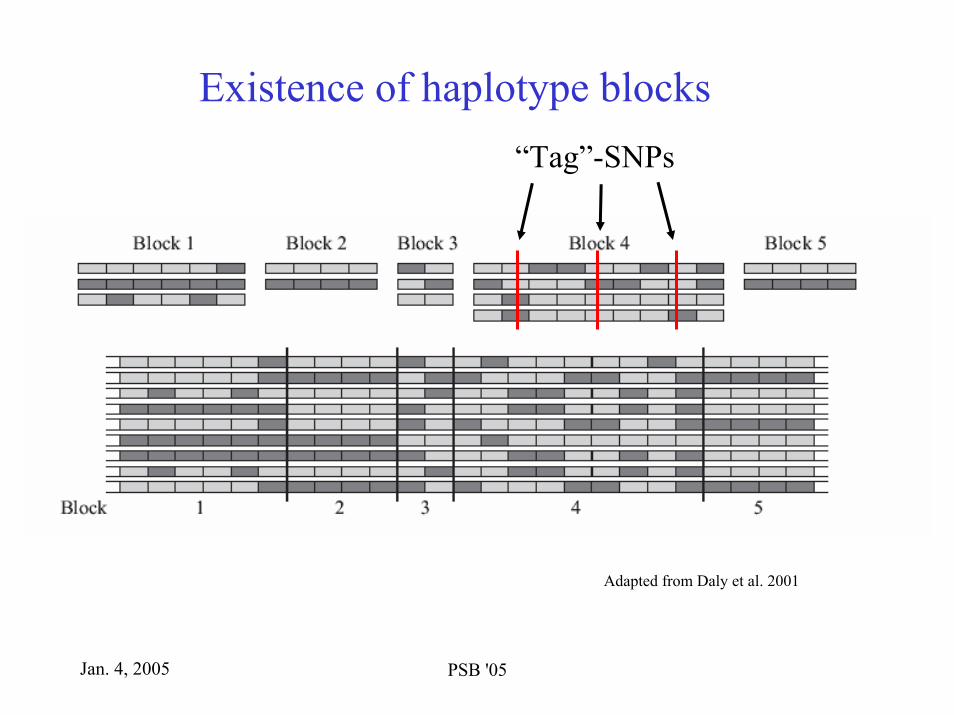
LD of human chromosomesThe human genome contains stretches characterized by strong LD
What causes this haplotypeblock structure?
Reich, D. E. et al. (2002), Human genome sequence variation and the influence of gene history, mutation and recombination, Nat Genet32(1), 135-142.
Gabriel, S.B. et al. (2002) The structure of haplotype blocks in the human genome. Science 296: 2225-2229.
Patil, N. et al. (2001) Blocks of limited haplotype diversity revealed by high-resolution scanning of human chromosome 21. Science 294: 1719-1723.
Daly, M.J. et al. (2001) High-resolution haplotype structure in the human genome Nature Genetics 29: 229-232.
Jan. 4, 2005 PSB '05
Existence of haplotype blocks“Tag”-SNPs
Adapted from Daly et al. 2001

Jan. 4, 2005 PSB '05
Variation in recombination rate
Chr. 2 Data from Kong et al. 2002
869 individuals from 146 families at 5136 microsattelite markers providing information on 1257 meioses.

Jan. 4, 2005 PSB '05
Variation in recombination rate IIChr. 20 from McVean et al. 2004
Fine-scale structure of recombination rate in a 10 Mb region of chr 20
Recombination rates vary three orders of magnitude.
Low in genic regions (coldspots)
High in areas surrounding the genes (hotspots).

Jan. 4, 2005 PSB '05
The History of Genetic Mapping I1865 Mendels discovery of the laws of segregation.
1868 The Variation of Animals and Plants Under Domestication by Darwin
1871 Miescher’s discovery of “nuclein”.
1870s Francis Galton introduces quantitaive characters and twin studies
1888 Heinrich Wilhelm Gottfried Waldeyer names the chromosome.
1889 Altman introduces term nucleic acid.
1900 Rediscovery of Mendel’s laws by H. de Vries, C. Correns, and E. Tschermak
1900 Bateson coins terms - genetics, zygote, homo/hetero-zygote, allelemorph (abbr. allele) and epistasis.
1901 Hugo de Vries introduces the term mutation
1903 Johansen introduces concepts of phenotype, genotype, and selection
1908 Hardy and Weinberg states probabilities of diploid allele frequencies as function of haploid frequencies.
1909 Johansen introduces concept of gene
1911 Linkage Discovered in Drosophila by Müller
1913 Sturtevant writes first article on mapping J.Experimental Zoology 14.43-59
1918 RA. Fisher introduces combines of quantitative trait genes and continuous variation.
1919 T. H. Morgan equates the identity between chromosomes and linkage groups in Drosophila melanogaster .
1919 The first mapping function (recom fraction--> expected recom events onchrom.) proposed. Haldane J of genetics 8.299-309
1926 Vogt introduces the concept penetrance
1935 Haldane calculates the spontaneous mutation frequency of a human gene
Jan. 4, 2005 PSB '05
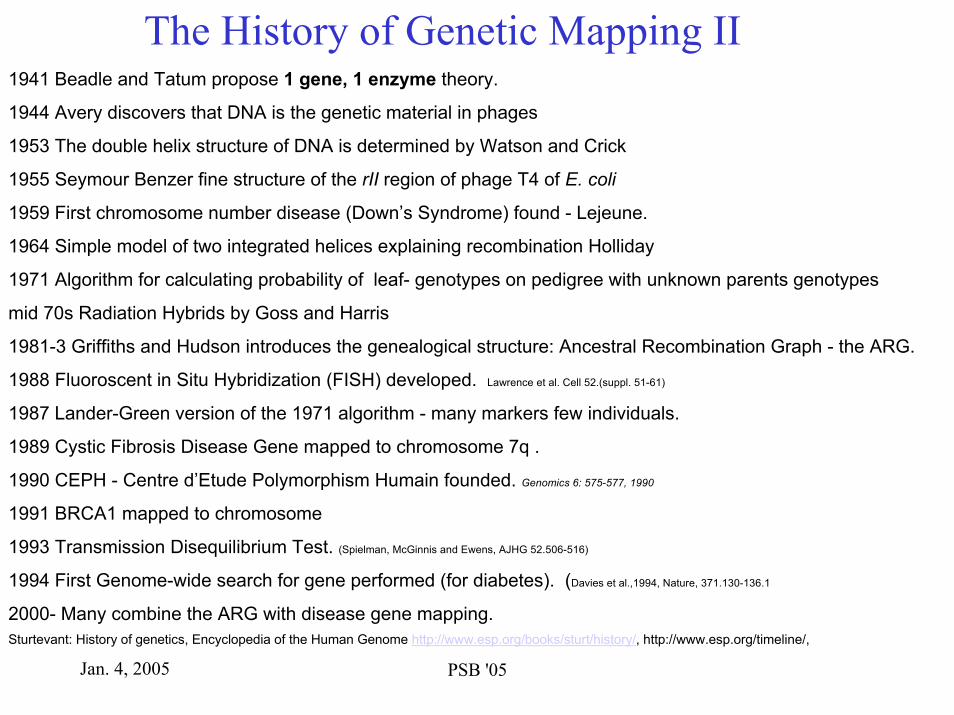
The History of Genetic Mapping II1941 Beadle and Tatum propose 1 gene, 1 enzyme theory.
1944 Avery discovers that DNA is the genetic material in phages
1953 The double helix structure of DNA is determined by Watson and Crick
1955 Seymour Benzer fine structure of the rII region of phage T4 of E. coli
1959 First chromosome number disease (Down’s Syndrome) found - Lejeune.
1964 Simple model of two integrated helices explaining recombination Holliday
1971 Algorithm for calculating probability of leaf- genotypes on pedigree with unknown parents genotypes
mid 70s Radiation Hybrids by Goss and Harris
1981-3 Griffiths and Hudson introduces the genealogical structure: Ancestral Recombination Graph - the ARG.
1988 Fluoroscent in Situ Hybridization (FISH) developed. Lawrence et al. Cell 52.(suppl. 51-61)
1987 Lander-Green version of the 1971 algorithm - many markers few individuals.
1989 Cystic Fibrosis Disease Gene mapped to chromosome 7q .
1990 CEPH - Centre d’Etude Polymorphism Humain founded. Genomics 6: 575-577, 1990
1991 BRCA1 mapped to chromosome
1993 Transmission Disequilibrium Test. (Spielman, McGinnis and Ewens, AJHG 52.506-516)
1994 First Genome-wide search for gene performed (for diabetes). (Davies et al.,1994, Nature, 371.130-136.1
2000- Many combine the ARG with disease gene mapping. Sturtevant: History of genetics, Encyclopedia of the Human Genome http://www.esp.org/books/sturt/history/, http://www.esp.org/timeline/,
Jan. 4, 2005 PSB '05
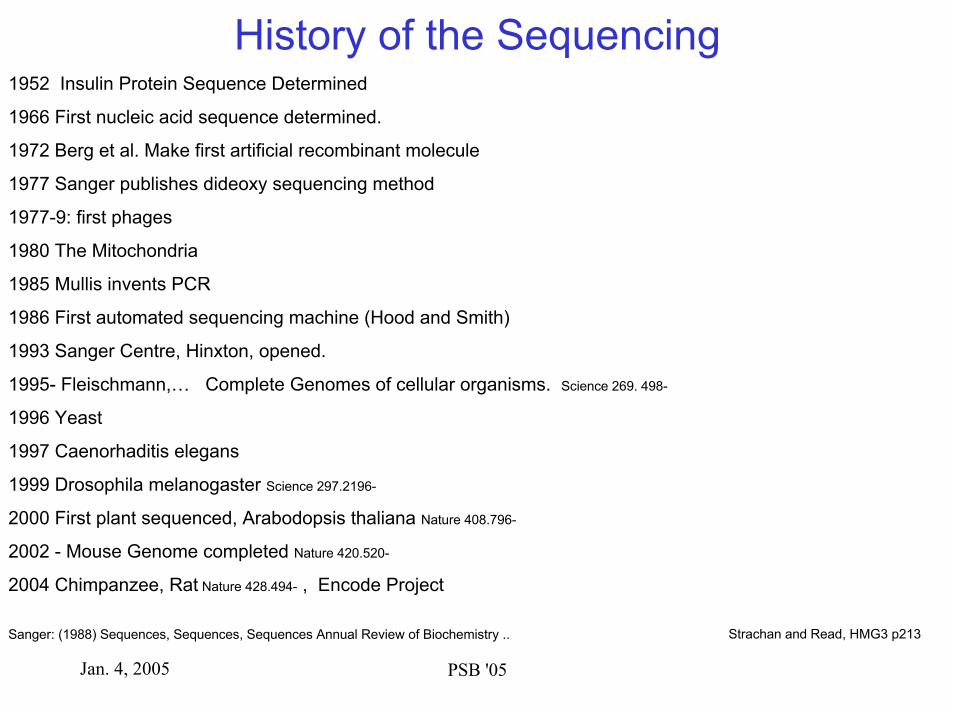
History of the Sequencing1952 Insulin Protein Sequence Determined
1966 First nucleic acid sequence determined.
1972 Berg et al. Make first artificial recombinant molecule
1977 Sanger publishes dideoxy sequencing method
1977-9: first phages
1980 The Mitochondria
1985 Mullis invents PCR
1986 First automated sequencing machine (Hood and Smith)
1993 Sanger Centre, Hinxton, opened.
1995- Fleischmann,… Complete Genomes of cellular organisms. Science 269. 498-
1996 Yeast
1997 Caenorhaditis elegans
1999 Drosophila melanogaster Science 297.2196-
2000 First plant sequenced, Arabodopsis thaliana Nature 408.796-
2002 - Mouse Genome completed Nature 420.520-
2004 Chimpanzee, Rat Nature 428.494- , Encode Project
Strachan and Read, HMG3 p213Sanger: (1988) Sequences, Sequences, Sequences Annual Review of Biochemistry ..
Jan. 4, 2005 PSB '05
History of the Human Genome Project1956 Physical map. 24 types and total set of 46 chromosomes Tijo & Levan, Hereditas 42.1-6
1980 Botstein proposes human genetic map using RFLPs
1987 US DOE publishes report discussing HGP
1988 HUGO is established
1990 Official start of HGP with 3 billion $ and a 15 year horizon.
1991 Genome Database GB is established
1992 Genethon publishes map based on microsatelites.
1995 Lander et al. detailed map based on sequence tagged sites.
1997 Myers and Weber proposed shotgun approach to genome sequencing. Genome Research 7.401-
1998 Comprehensive map based on gene markers.
1999 Sanger Centre publishes chromosome 22
2001 Draft Genome published: Celera Science 291.1145-1434 & Public Nature 409.745-964
2003 Completion (almost) of Human GenomeStrachan and Read, HMG3 p213 & Sulston and Ferry (2003) Our Common Thread

Jan. 4, 2005 PSB '05
Reference listBotstein D, Risch N. (2003) Discovering genotypes underlying human phenotypes: past successes for mendelian disease, future approaches for complex
disease. Nat Genet. 33 Suppl:228-237. Daly, M. J., Rioux, J. D., Schaner, S. F., Hudson, T. J. & Lander, E. S. (2001), High-resolution haplotype structure in the human genome, Nat Genet 29(2),
229-232.Devlin, B. & Roeder, K. (1999), Genomic control for association studies, Biometrics 55, 997-1004.Gabriel, S. B. et al. (2002), The structure of haplotype blocks in the human genome, Science 296, 2225-2229.Hamer, D., Sirota, L., 2000. Beware the chopstick gene. Mol. Psychiatry 5, 11 �/13.Jobling, M. A. Hurles, M. E., & Tyler-Smith, C. (2004) Human Evolutionary Genetics. Garland Science, UK. Kong A, et al. (2002) A high-resolution recombination map of the human genome. Nat Genet. 31,241-7.Laitinen et al. (2004) Characterization of a common susceptibility locus for Asthma-related traits. Nature 304, 300-304.Martin, E. R., et al. (2000), SNPing away at complex diseases: analysis of single-nucleotide polymorphisms around APOE in Alzheimer disease, Am J Hum
Genet 67, 383-394.McVean GA, Myers SR, Hunt S, Deloukas P, Bentley DR, Donnelly P. (2004) The fine-scale structure of recombination rate variation in the human genome.
Science 304:581-584.Patil, N. et al. (2001) Blocks of limited haplotype diversity revealed by high-resolution scanning of human chromosome 21. Science 294: 1719-1723.Reich, D. E. et al. (2001), Linkage disequilibrium in the human genome, Nature 411(6834), 199-204.Reich D. E. and Lander, E. On the allelic spectrum of human diseases. Trends in Genetics 19, 502-510.Reich, D. E. et al. (2002), Human genome sequence variation and the influence of gene history, mutation and recombination, Nat Genet 32(1), 135-142.Risch, N. and Merikangas, K. (1996) The future of genetic studies of complex human diseases. Science 273, 15161-1517.Pritchard, J. K., Stephens, M., Rosenberg, N. A. & Donnelly, P. (2000), Association mapping in structured populations, Am J Hum Genet 67(1), 170-181.Stefansson, H. et al. (2003), Association of neuregulin 1 with schizophrenia confirmed in a Scottish population, Am J Hum Genet 72(1), 83-87.Stephens JC et al. (2001) Haplotype variation and linkage disequilibrium in 313 human genes. Science.;293(5529):489-93. Strachan, T. & Read, A. P. (2003) Human Molecular Genetics 3, BIOS Scientific Publishers Ltd, Wiley, New York.Spielman R S and W J Ewens (1996) The TDT and other family-based tests for linkage disquilibrium and association. Am. J. Hum. Gen. 59:983-989The International HapMap Consortium (2003) The International HapMap Project. Nature 426, 789-795.Weiss, KM and Clark, AG (2002) Linkage disequilibrium and the mapping of complex human traits. Trends in Genetics 18:19-24.

Jan. 4, 2005 PSB '05
Reference listHudson, R. R. (1990).
Gene genealogies and the coalescent process, “Oxford Surveys in Evolutionary Biology” (D. futuyma and J. Antonovics, Eds.) Vol 7, pp. 1-44, Oxford Univ. Press, Oxford, UK
Fabrice Larribe, Sabin Lessard and Nicholas J. Schork. (2002)Gene Mapping via the Ancestral Recombionation Graph, Theoretical Population Biology, vol 62, pages 215-229, 2002
A. P. Morris, J. C. Whittaker, and D. J. Balding (2004) Little loss of information due to unknown phase for fine-scale LD mapping with SNP genotype data, Am. J. Hum. Gen. 74: 945-953, 2004
A. P. Morris, J. C. Whittaker, and D. J. Balding Fine scale mapping of disease loci via shattered coalescent modelling of genealogies, Am. J. Hum. Gen. 70:686-707, 2002
Jun S. Liu, Chiara Sabatti, Jun Teng, Bronya J. B. Keats, Neil RischBayesian Analysis of Haplotypes for Linkage Disequilibrium Mapping, Genome Research 11: 1716-1724
Andrew P. Morris, John C. Whittaker, Chun-Fang Xu, Louise K. Hosking, and David J. Balding Multipoint linkage-disequilibrium mapping narrows location interval and identifies mutation heterogeneity, PNAS November 11, 2003, Vol. 100, 13442-13446
R. C. Griffiths and P. Marjoram Ancestral inference from samples of DNA sequences with recombination. Journal of Computational Biology 3: 479-502 1996
B. Kerem, J. M. Rommens, J. A. Buchanan D. Markiewicz, T. K. Cox, A. Chakravarti, M. Buchwald and L. C. TsuiIdentification of the Cystic Fibrosis Gene: Genetic Analysis Science 245: 1073-1080, 1989
N Metropolis N AW Rosenbluth, MN Rosenbluth, AH Teller, E Teller (1953) Equation of state calculation by fast computer machines, J. Chem. Phys. 21:1087-1092
R S Spielman and W J Ewens (1996)The TDT and other family-basedtests for linkage disquilibrium and association. Am. J. Hum. Gen. 59:983-989

Jan. 4, 2005 PSB '05
Reference list and WWW. list
McVean, G.A. (2002) A genealogical interpretation of linkage disequilibrium Genetics 162, 987-991
M. A. Beaumont and B. Rannala (2004) The Bayesian Revolution in genetics, Nature Reviews, Genetics vol. 5. 251
Rannala and Reeve (2001) High-Resolution Multipoint Linkage-disequilibrium Mapping in the Context of a Human Genome Sequence. Am. J. Hum. Gen. 69:159-178, 2001
WWW. List:Jeff Reeve and Bruce Rannala
A multipoint linkage disequilibrium disease mapping program (DMLE+) that allows genotype data to be used directly and allows estimation of allele ages. www.dmle.org
Liu, J.S., Sabatti, C., Teng, J., Keats, B.J.B. and N. Risch (Version upgraded by Xin Lu, June/9/2002)This is the software for the Bayesian haplotype analysis method developed by Liu, J.S., Sabatti, C., Teng, J., Keats, B.J.B. and N. Risch in article Bayesian Analysis of Haplogypes for Linkage Disequilibrium Mapping. Genome Research 11:1716, 2001www.people.fas.harvard.edu/~junliu/TechRept/03folder/bladev2.tar
J. N. Madsen, M.H. Schierup, C. Storm, and L. Schauser, T. MailundCoaSim is a tool for simulating the coalescent process with recombination and geneconversion under the assumption of exponential population growthwww.birc.dk/Software/CoaSim/
Bioinformatics ApSBioinformatics Research Center, University of Aarhus, Ny Munkegade, Building 540, DK-8000 Århus CPhone: +45 8942 3075, Fax: +45 8942 3077, E-mail: [email protected], http://bioinformatics.dk/
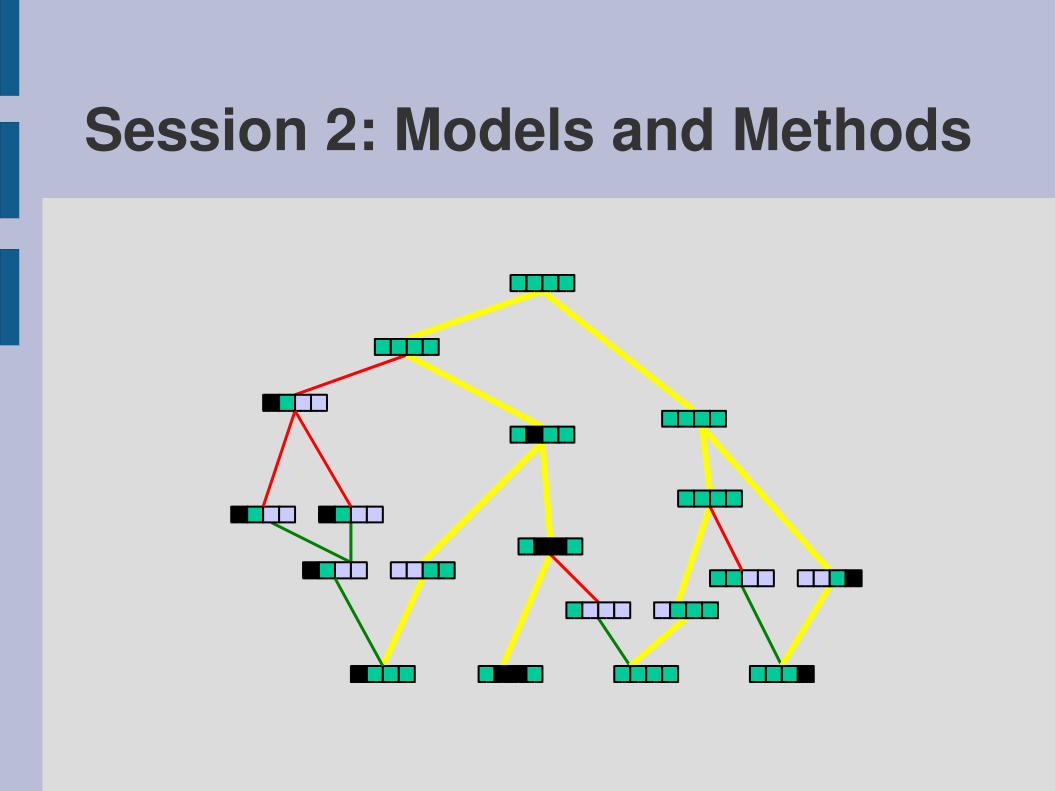
Session 2: Models and Methods
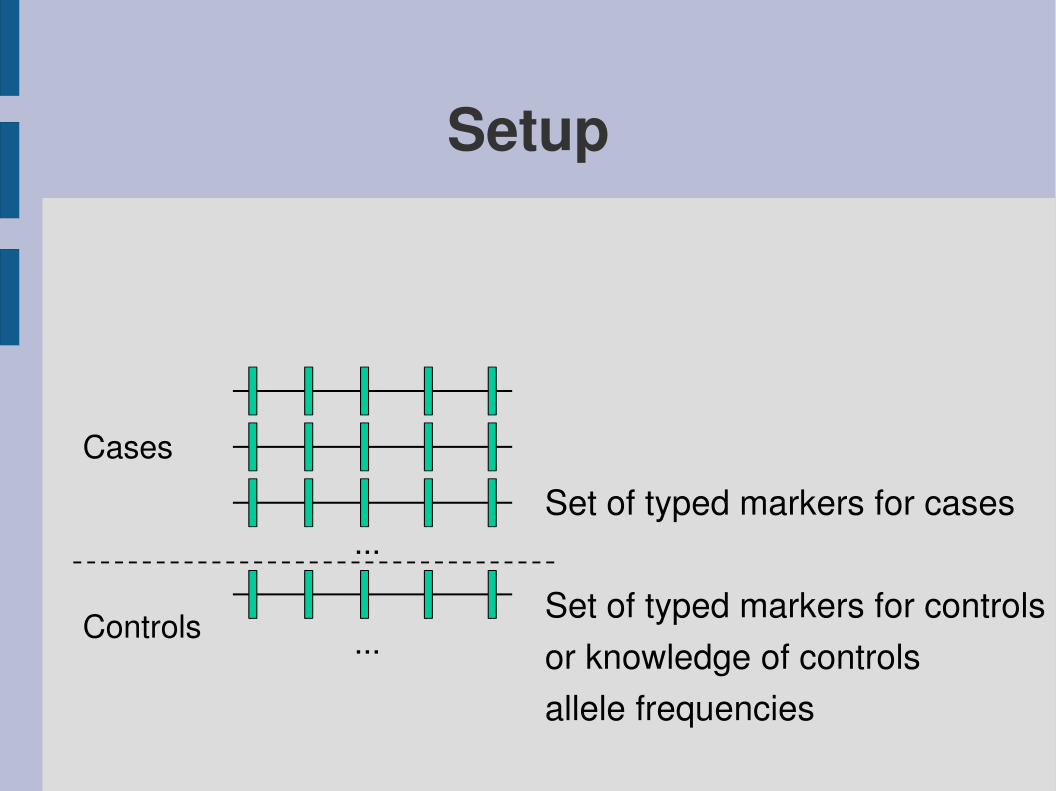
Setup
...
Controls
Cases
...
Set of typed markers for cases
Set of typed markers for controlsor knowledge of controlsallele frequencies

Setup
...
Controls
Cases
...
MutationAn unknown mutation location

Goal
Mutation
Somehow, locate the position of the mutation
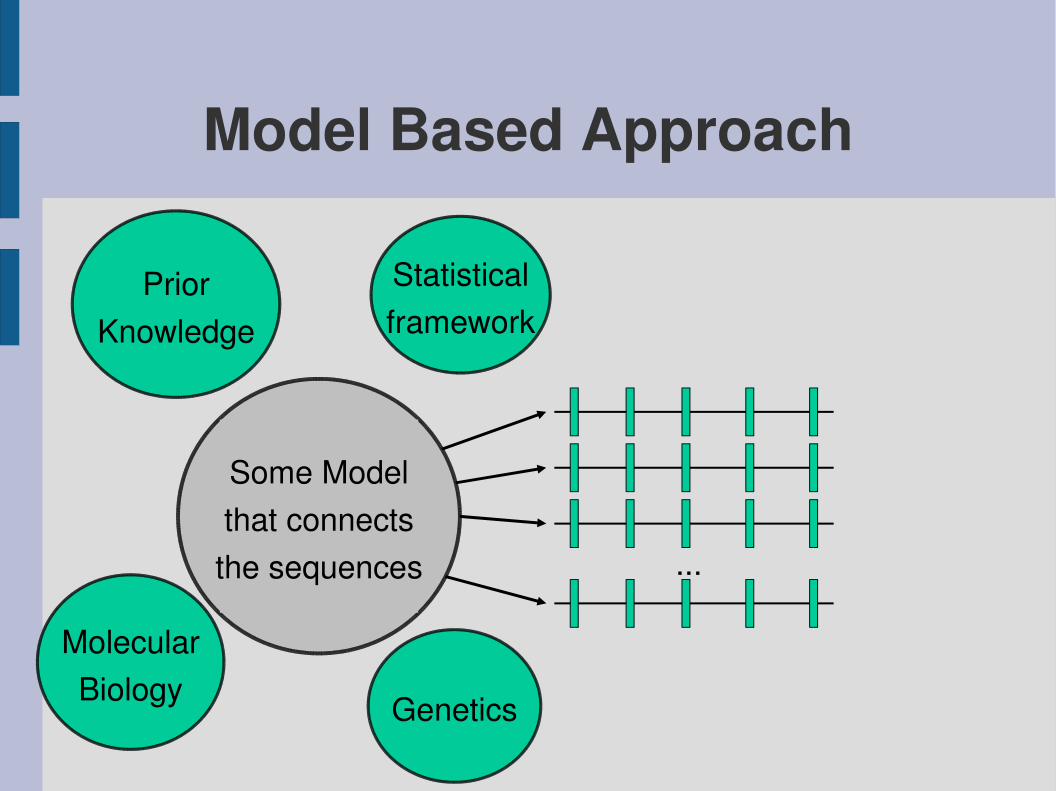
Model Based Approach
...
Statisticalframework
MolecularBiology
PriorKnowledge
Genetics
Some Modelthat connectsthe sequences
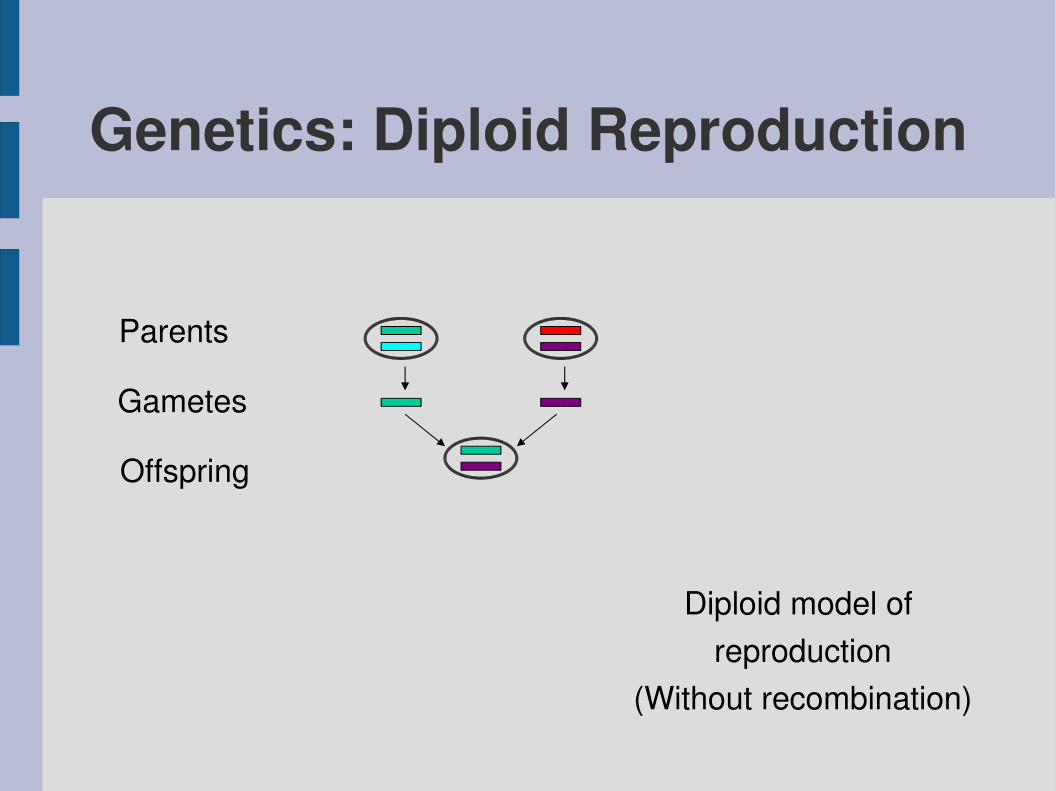
Genetics: Diploid Reproduction
Parents
Gametes
Diploid model of reproduction
(Without recombination)
Offspring
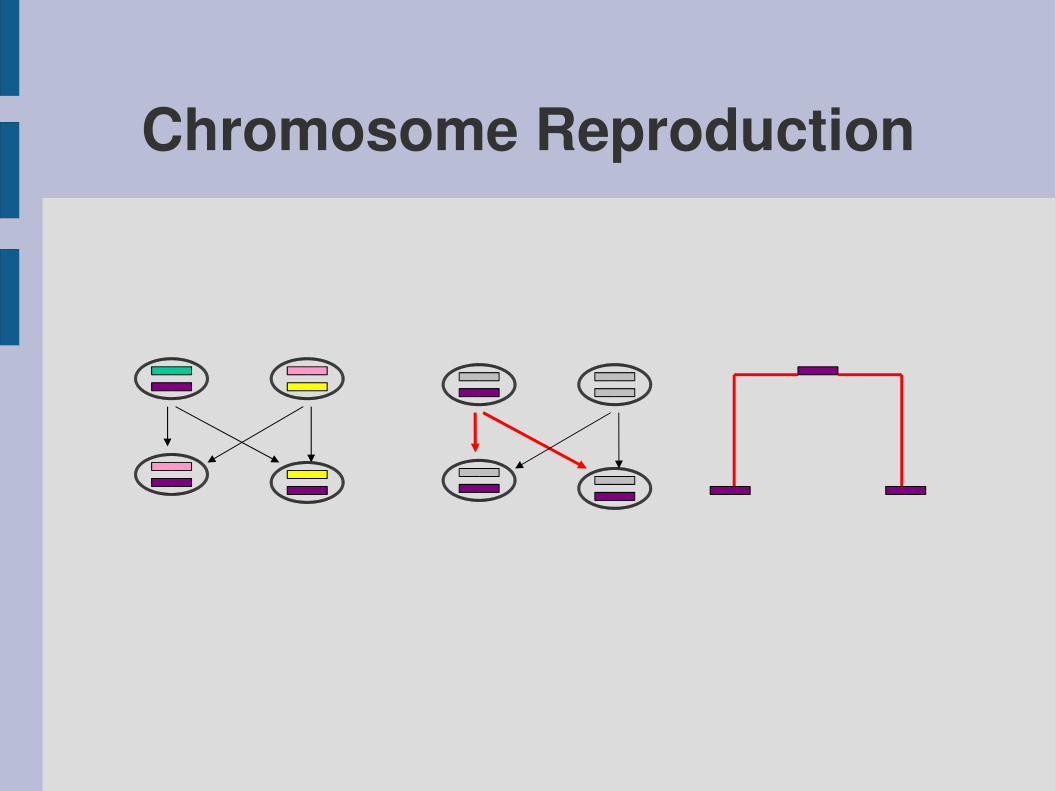
Chromosome Reproduction
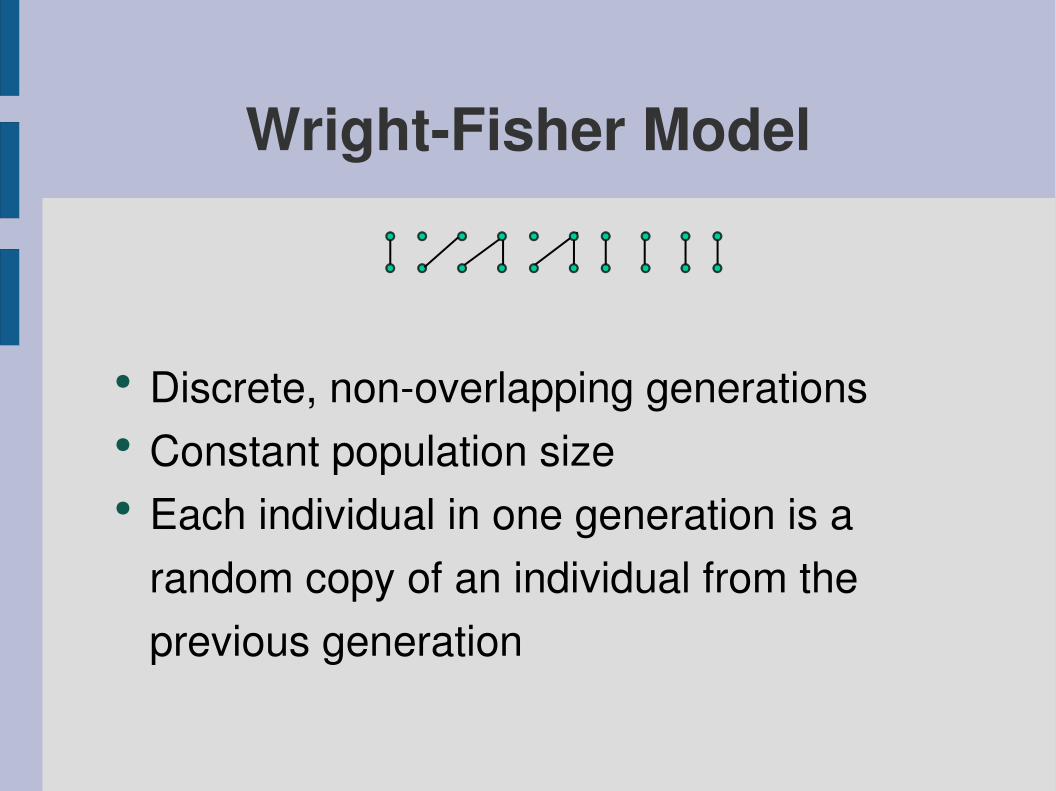
WrightFisher Model
● Discrete, nonoverlapping generations● Constant population size● Each individual in one generation is a
random copy of an individual from the previous generation

WrightFisher Model
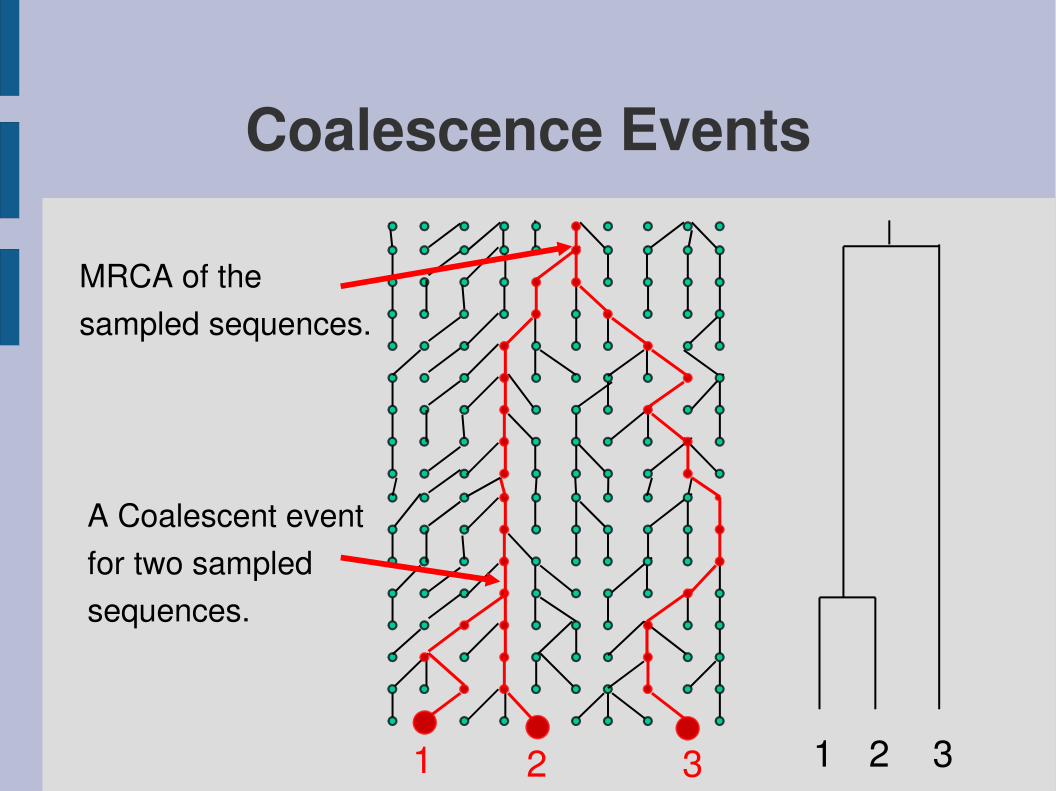
Coalescence Events
MRCA of thesampled sequences.
A Coalescent eventfor two sampled sequences.
1 1 2 32 3

Coalescence
● Simulate “backwards”● Wait for time ~E(k(k1)/2)● Coalesce two random chromosomes
Constant pop. size

Exponential Growth
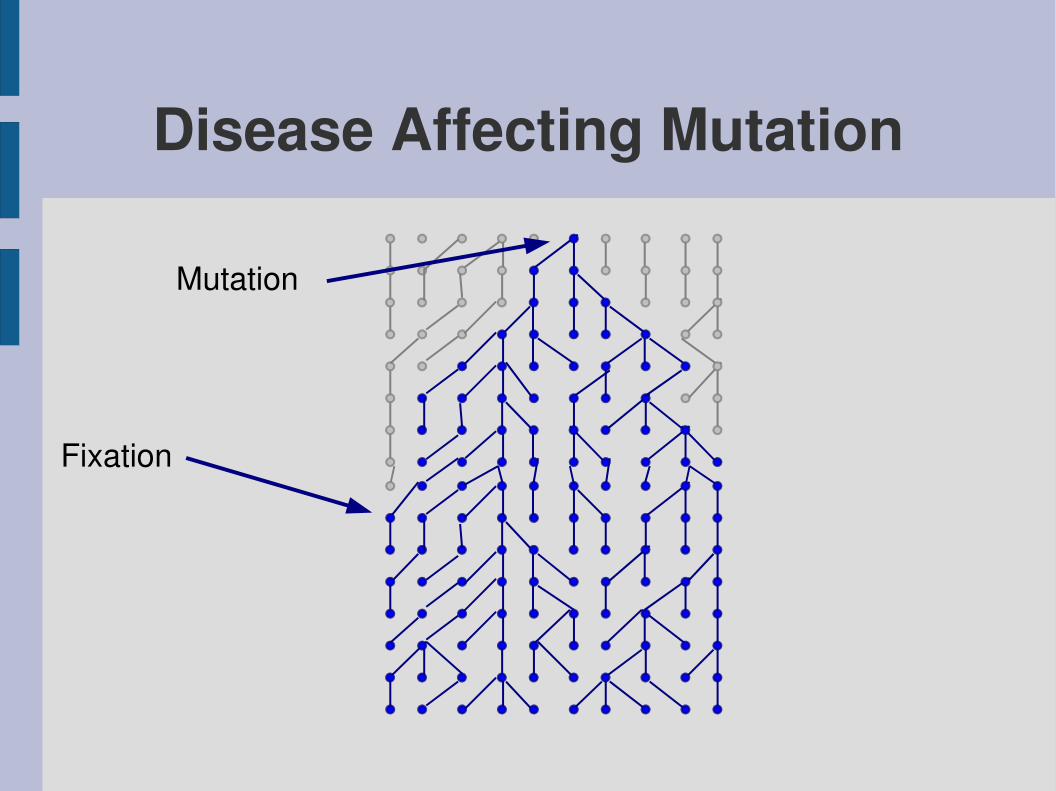
Disease Affecting Mutation
Mutation
Fixation

Disease Affecting Mutation
Mutation
Loss

Disease Affecting Mutation
Mutation

Information?
Complete knowledge of disease haplotypes:
1 if aij = ai
P( aij | ) = 0 otherwise{
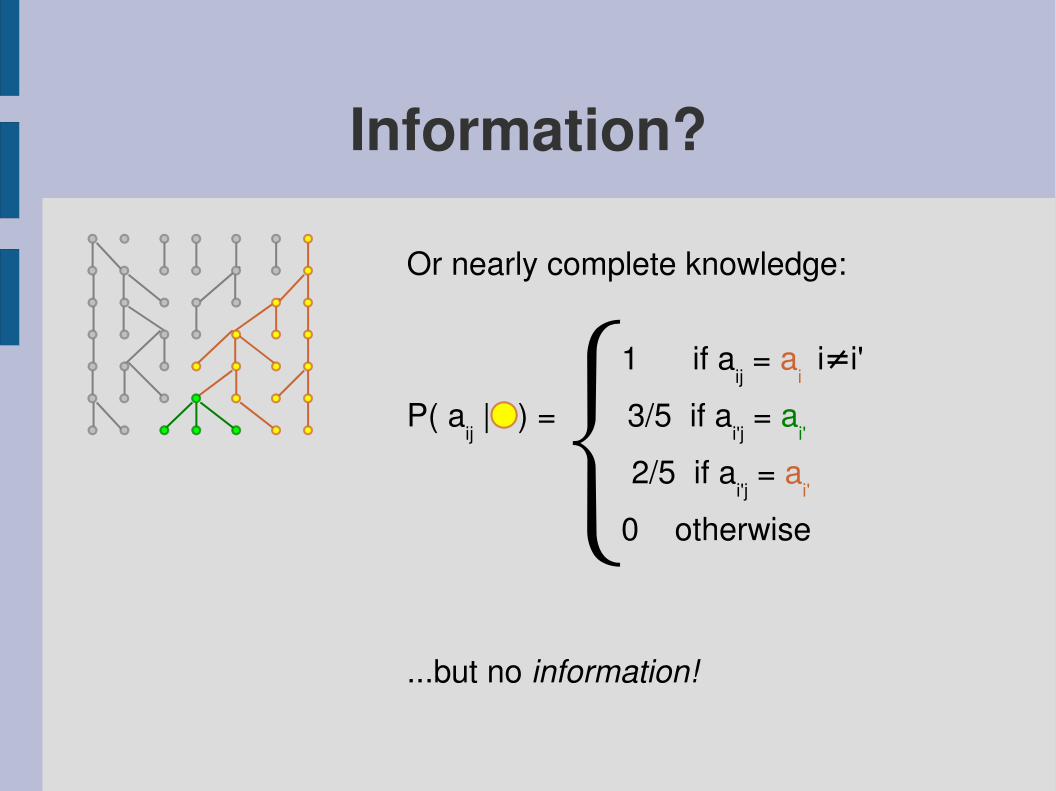
Information?
Or nearly complete knowledge:
1 if aij = ai i≠i'P( aij | ) = 3/5 if ai'j = ai'
2/5 if ai'j = ai'
0 otherwise
...but no information!
{
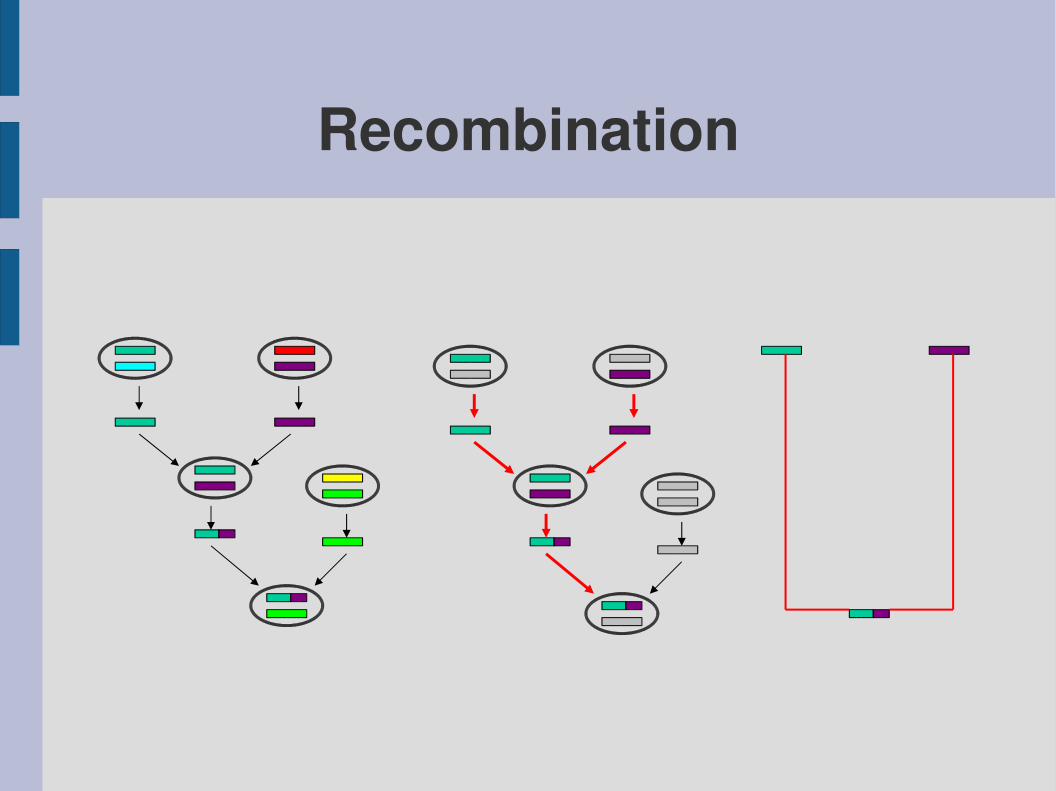
Recombination
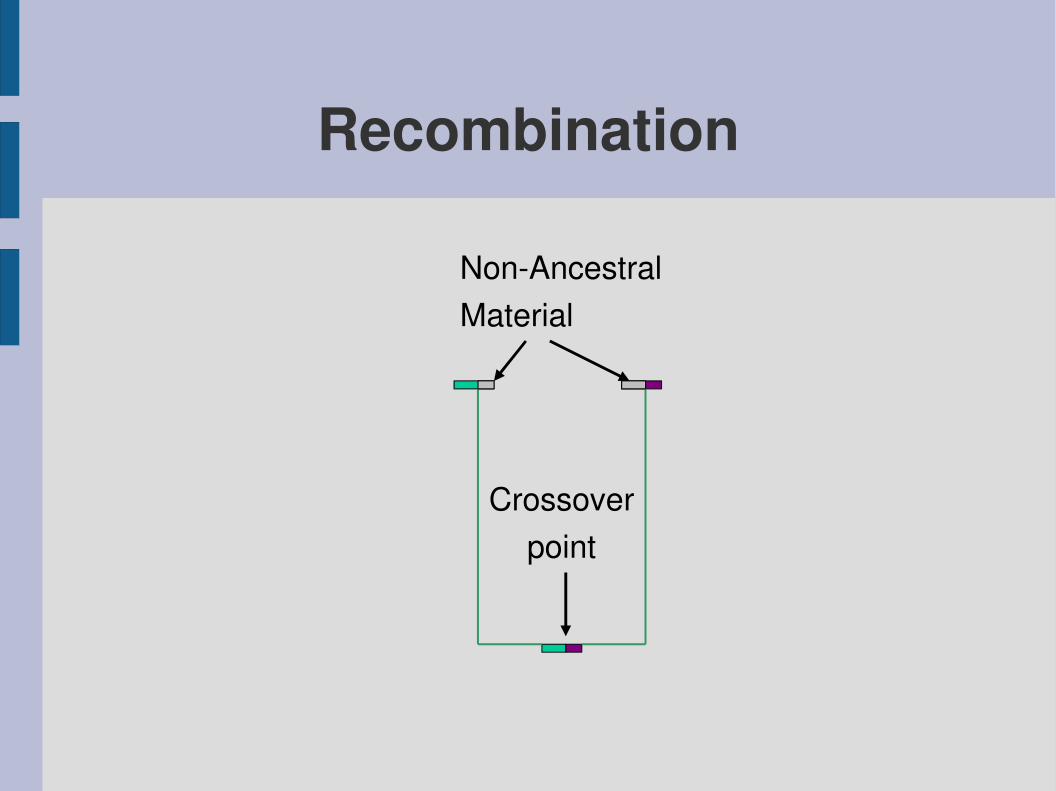
Recombination
NonAncestralMaterial
Crossoverpoint
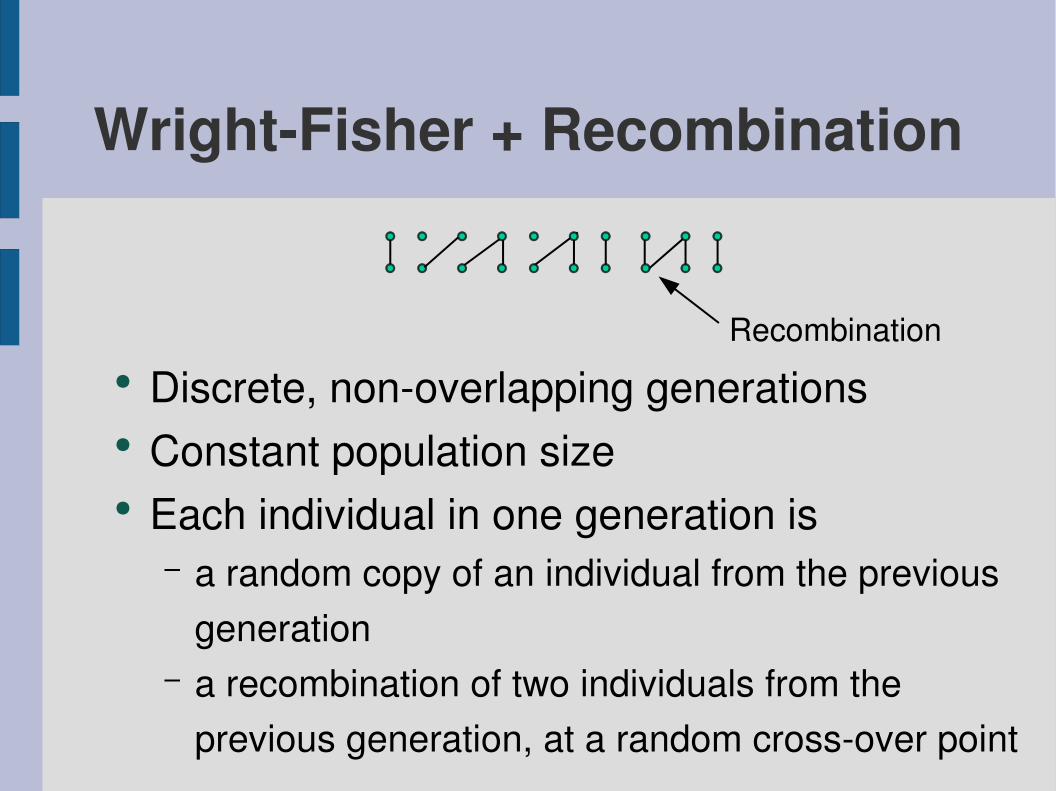
WrightFisher + Recombination
● Discrete, nonoverlapping generations● Constant population size● Each individual in one generation is
– a random copy of an individual from the previous generation
– a recombination of two individuals from the previous generation, at a random crossover point
Recombination
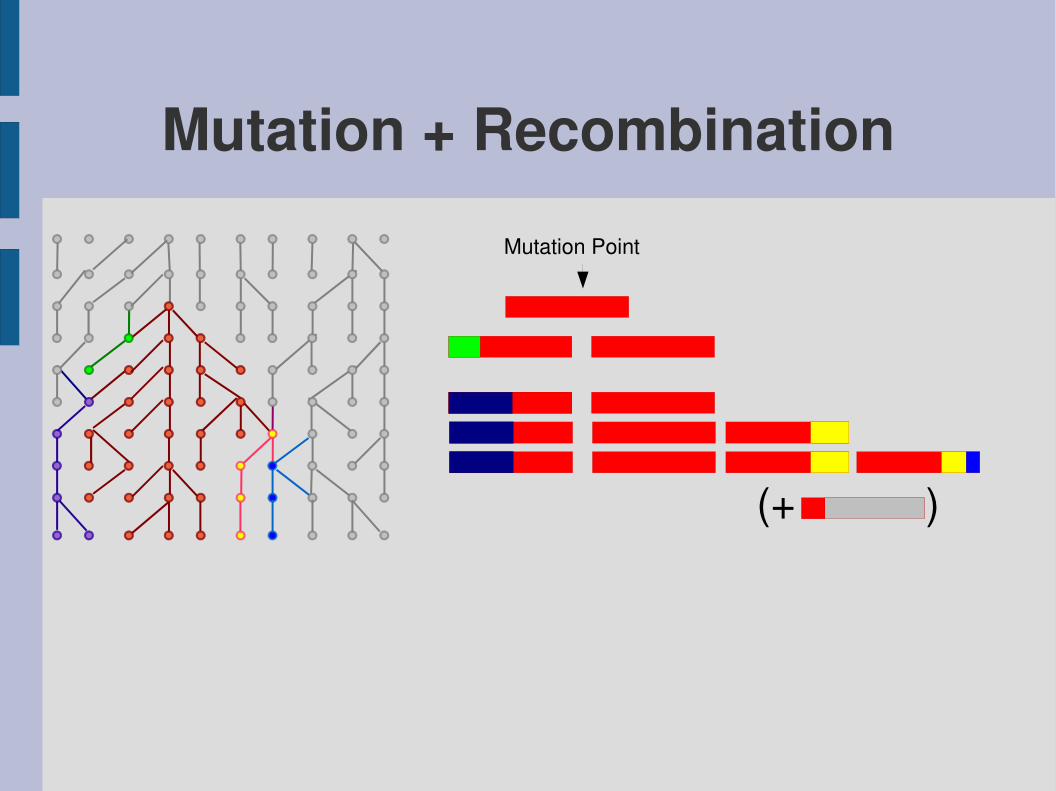
Mutation + RecombinationMutation Point
(+ )
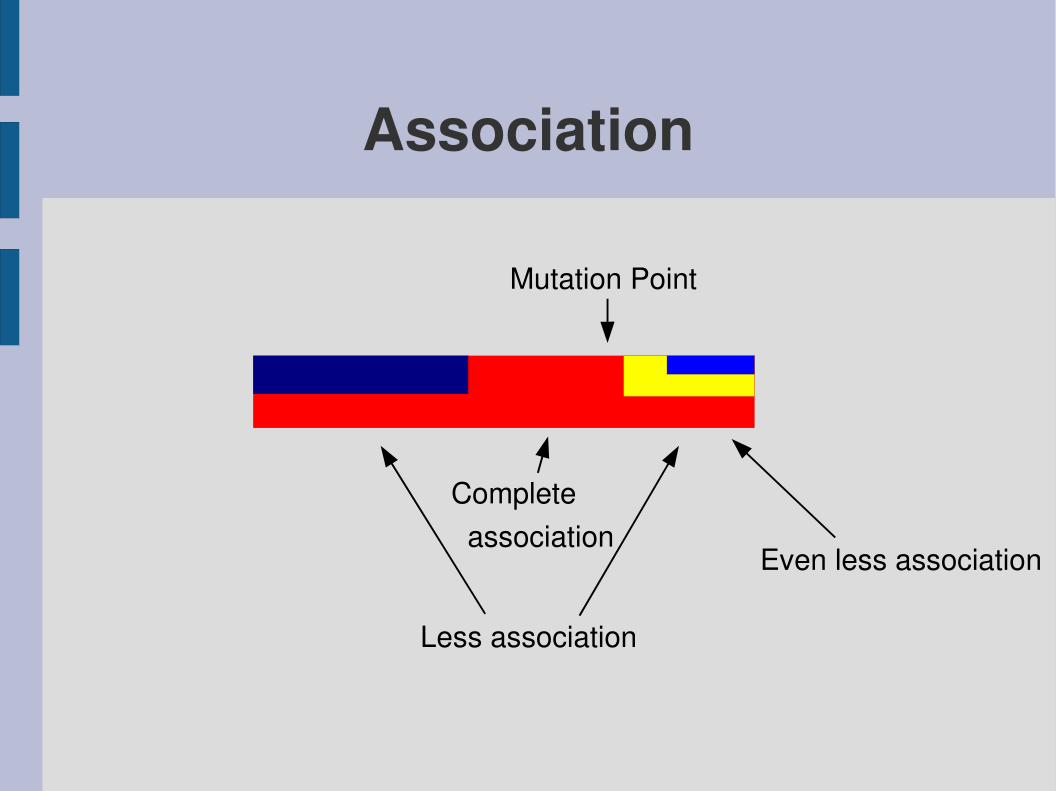
Association
Mutation Point
Complete association
Less association
Even less association
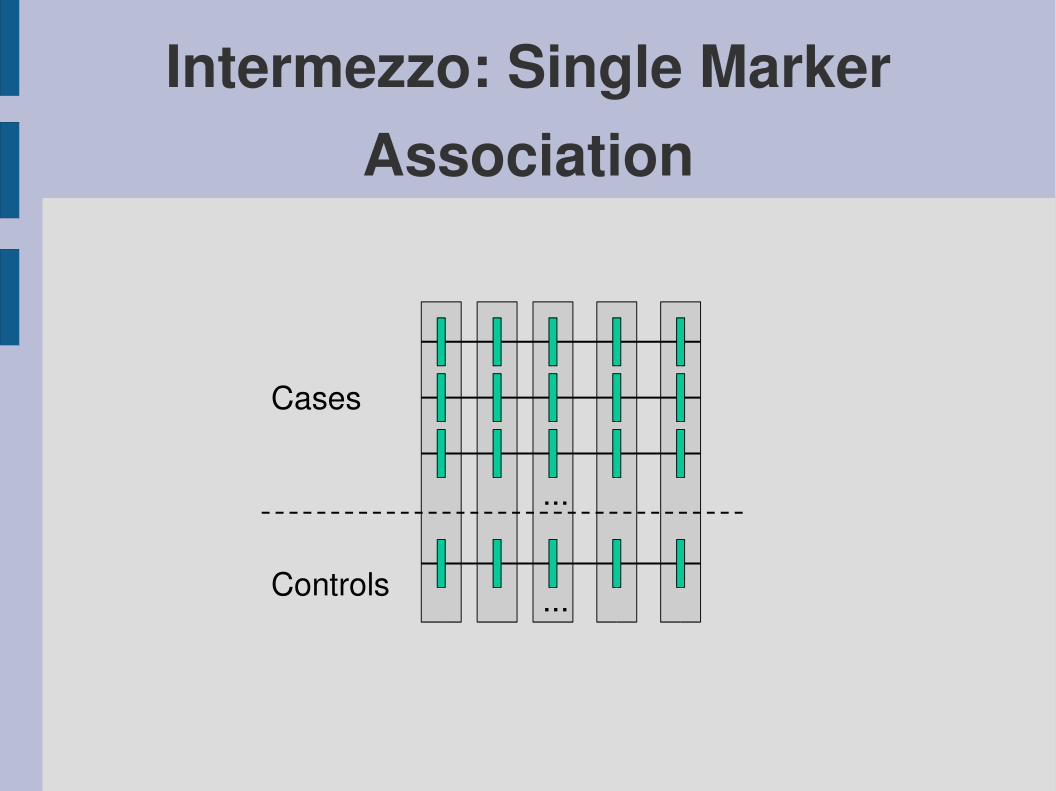
Intermezzo: Single Marker Association
...
Controls
Cases
...
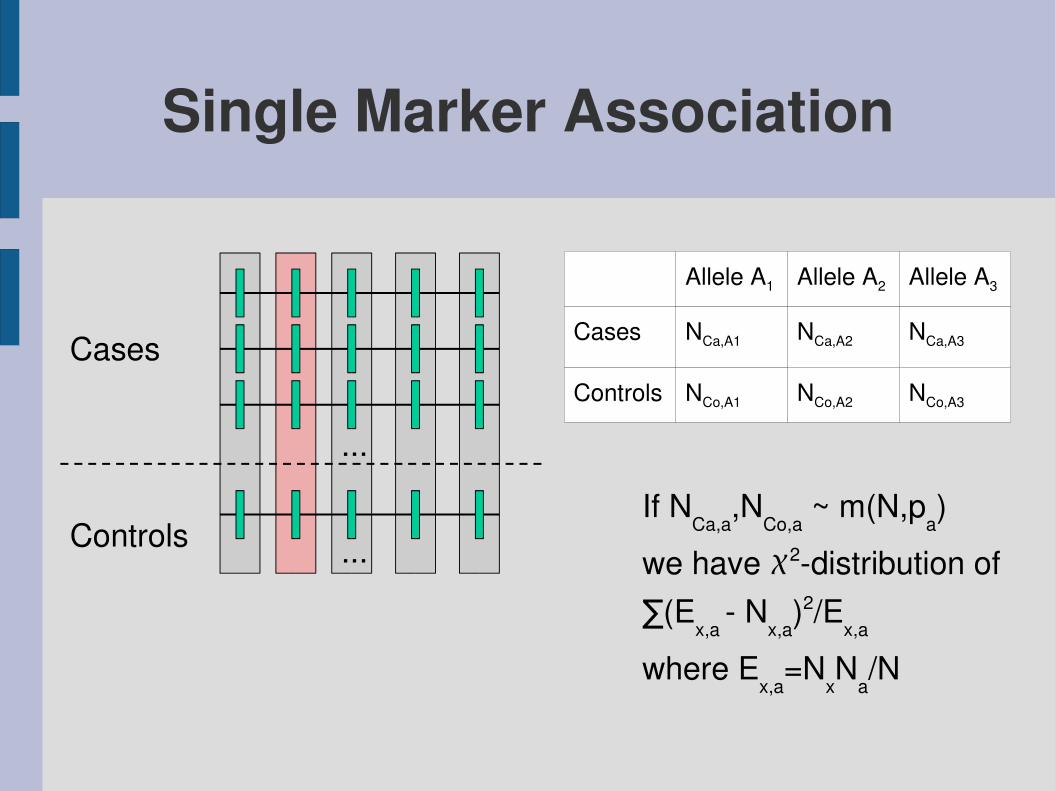
Single Marker Association
...
Controls
Cases
...If NCa,a,NCo,a ~ m(N,pa)we have 2distribution of∑(Ex,a Nx,a)
2/Ex,a
where Ex,a=NxNa/N
NCa,A2
NCo,A2
Allele A2
NCa,A3
NCo,A3NCo,A1Controls
NCa,A1Cases
Allele A3Allele A1

Cystic Fibrosis
Kerem et al. (1989)
Control group: 92 SNP HaplotypesCase group: 94 SNP Haplotypes23 SNP Markers

Cystic Fibrosis: 2measure
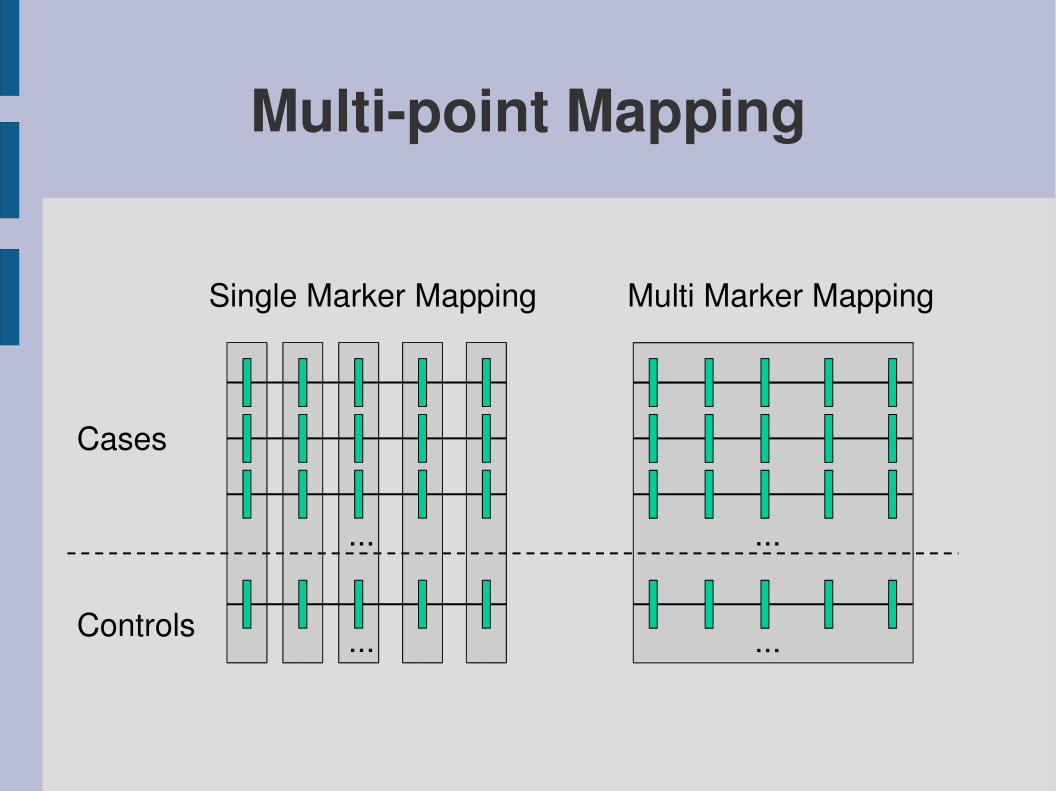
Multipoint Mapping
...
Controls
Cases
...
...
...
Single Marker Mapping Multi Marker Mapping

Coalescence + Recombination
● Simulate “backwards”● Two competing waiting times:
– ~E(k(k1)/2) for coalescing two random chromosomes– ~E(k) for recombination (creating two parents)
● Place mutations
Constant pop. size Coalescence event
Recombination event
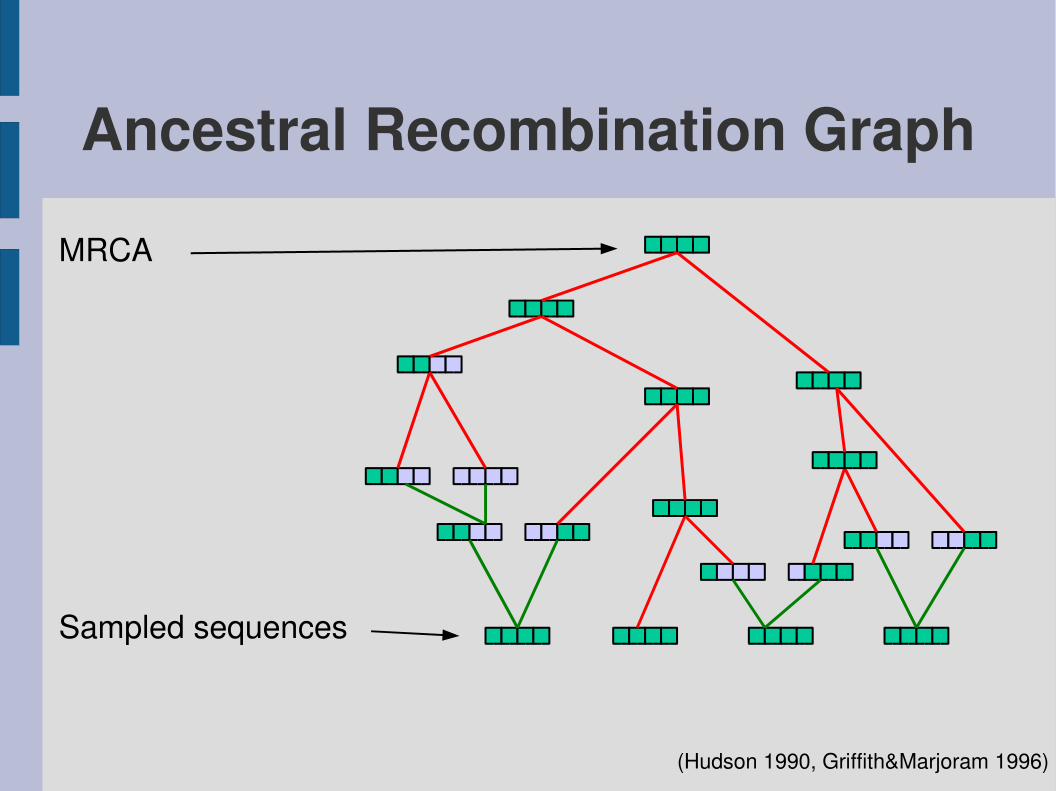
Ancestral Recombination Graph
(Hudson 1990, Griffith&Marjoram 1996)
Sampled sequences
MRCA
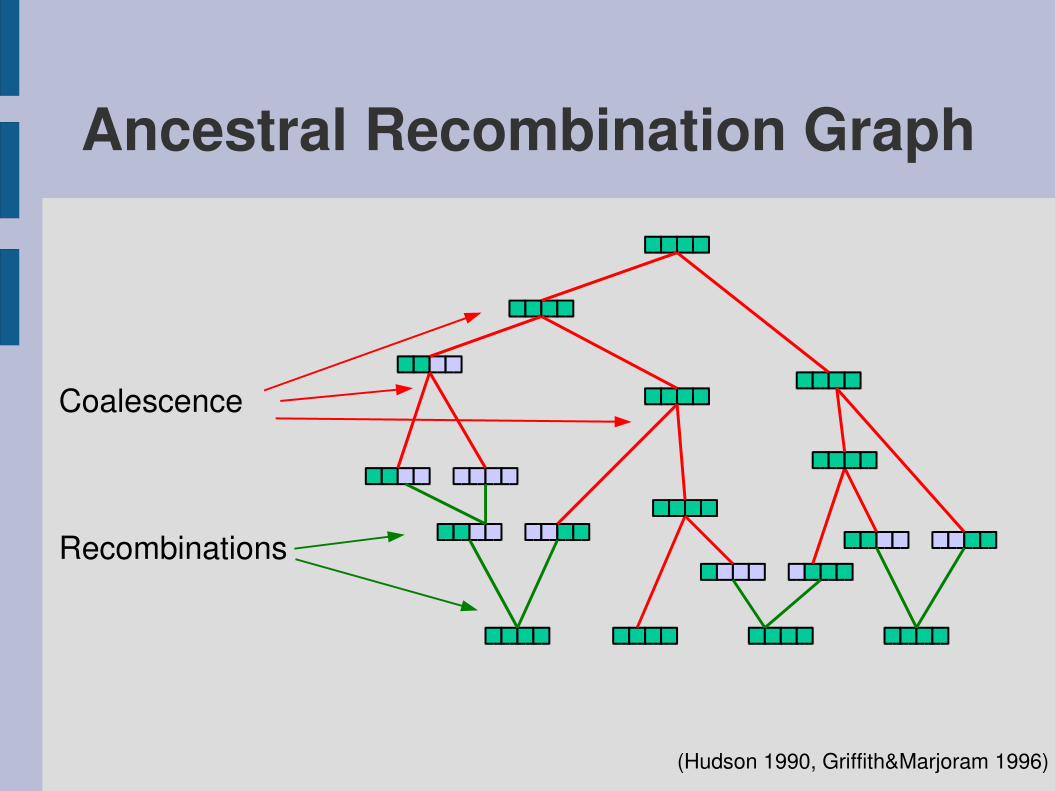
Ancestral Recombination Graph
(Hudson 1990, Griffith&Marjoram 1996)
Recombinations
Coalescence

Ancestral Recombination Graph
(Hudson 1990, Griffith&Marjoram 1996)
Nonancestralmaterial
Nonancestralmaterial

Ancestral Recombination Graph
MutationsMutations
1 2
3 4
Can be placed aftersimulating the graph,or during (a bit more complicated)
(Hudson 1990, Griffith&Marjoram 1996)

A Model for the Sequences
Model relating allsampled sequences
Sampled sequences

Probability ModelUsing the ARG model we can assign probabilities todatasets (the set of sequences) under simulationparameters
P D∣ , ,⋯=∫AP D∣A , , ,⋯P A∣ , ,⋯
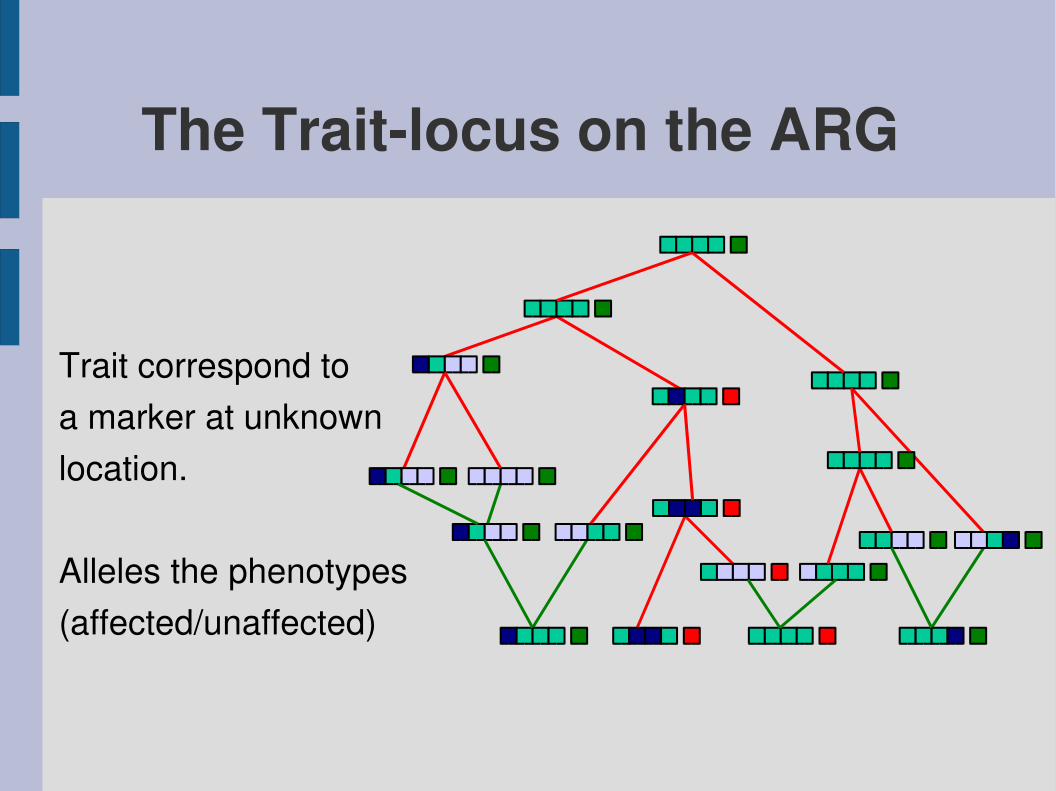
The Traitlocus on the ARG
Trait correspond toa marker at unknownlocation.
Alleles the phenotypes(affected/unaffected)

Placing the TraitlocusThe problem is how to place the trait locuson the chromosomes
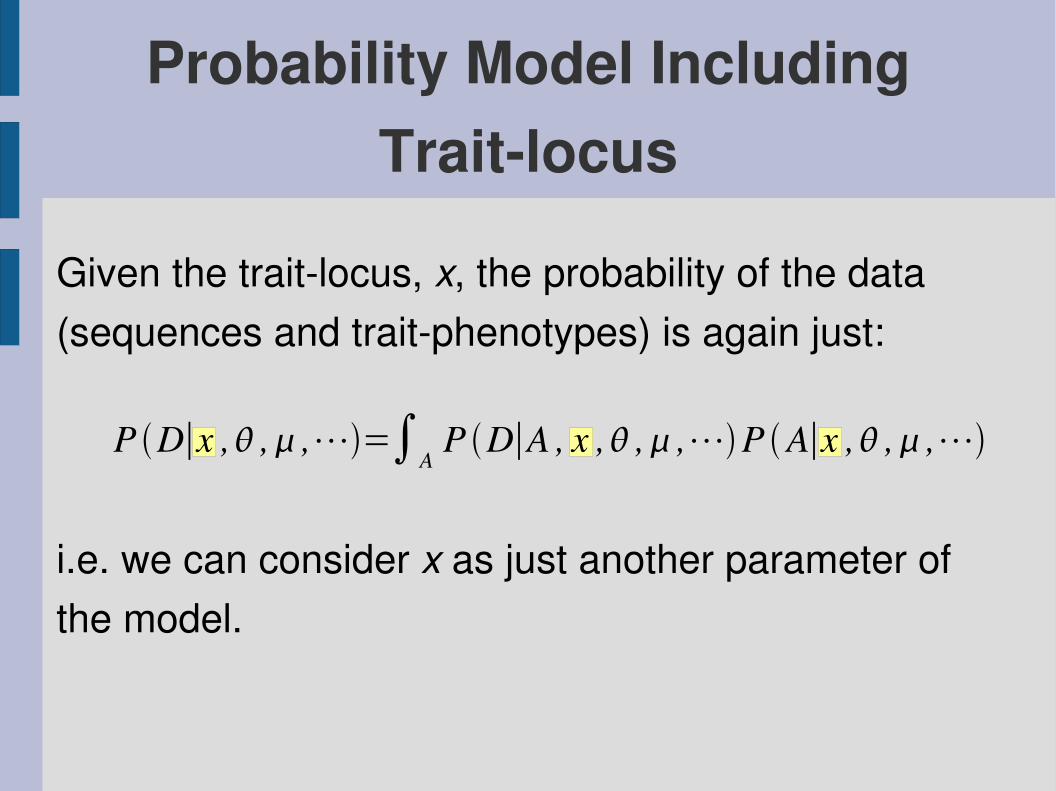
Probability Model Including Traitlocus
Given the traitlocus, x, the probability of the data(sequences and traitphenotypes) is again just:
P D∣x , , ,⋯=∫AP D∣A , x , , ,⋯P A∣x , , ,⋯
i.e. we can consider x as just another parameter ofthe model.

A Bayesian Approach
P x∣D ,⋯ =P D∣x ,⋯P x∣⋯
P D∣⋯
For finding the likelihood of a given traitlocus, x,we can use Bayes' formula:
∝ P D∣x ,⋯P x∣⋯
= ∫AP D∣A , x ,⋯P A∣x ,⋯P x∣⋯
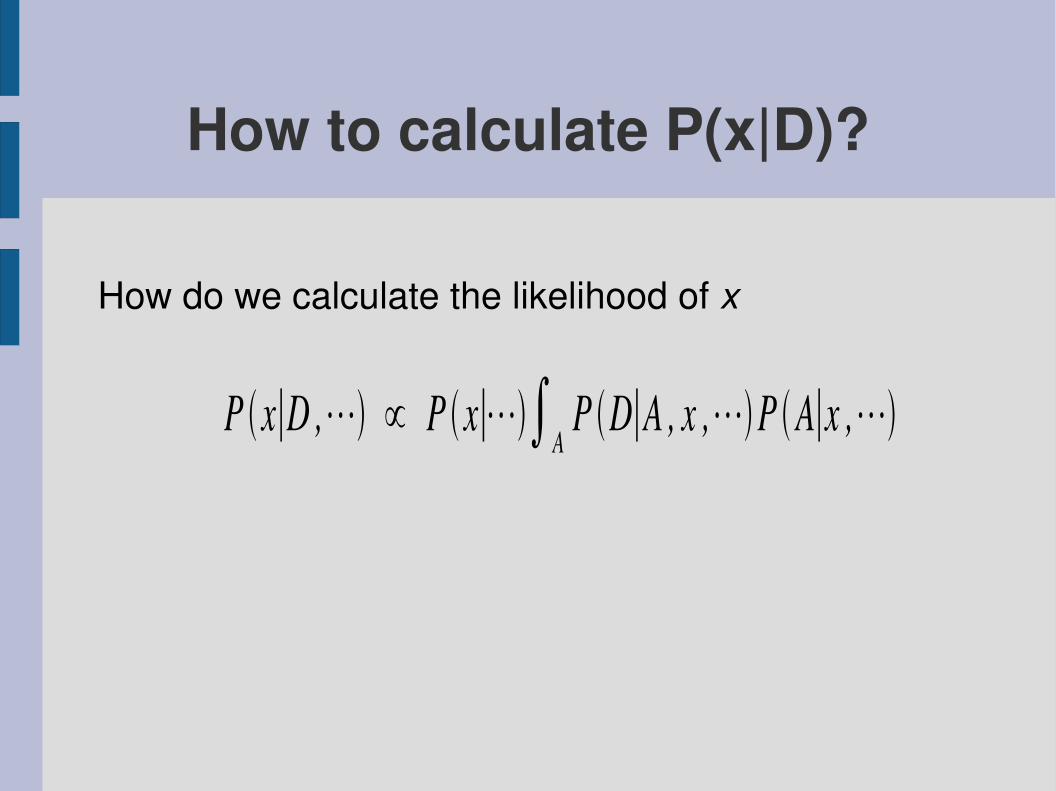
How to calculate P(x|D)?
P x∣D ,⋯ ∝ P x∣⋯∫AP D∣A , x ,⋯P A∣x ,⋯
How do we calculate the likelihood of x

How to calculate P(x|D)?
P x∣D ,⋯ ∝ P x∣⋯∫AP D∣A , x ,⋯P A∣x ,⋯
How do we calculate the likelihood of x
Prior (given a priori)

How to calculate P(x|D)?
P x∣D ,⋯ ∝ P x∣⋯∫AP D∣A , x ,⋯P A∣x ,⋯
How do we calculate the likelihood of x
Prior (given a priori)“Indicator”
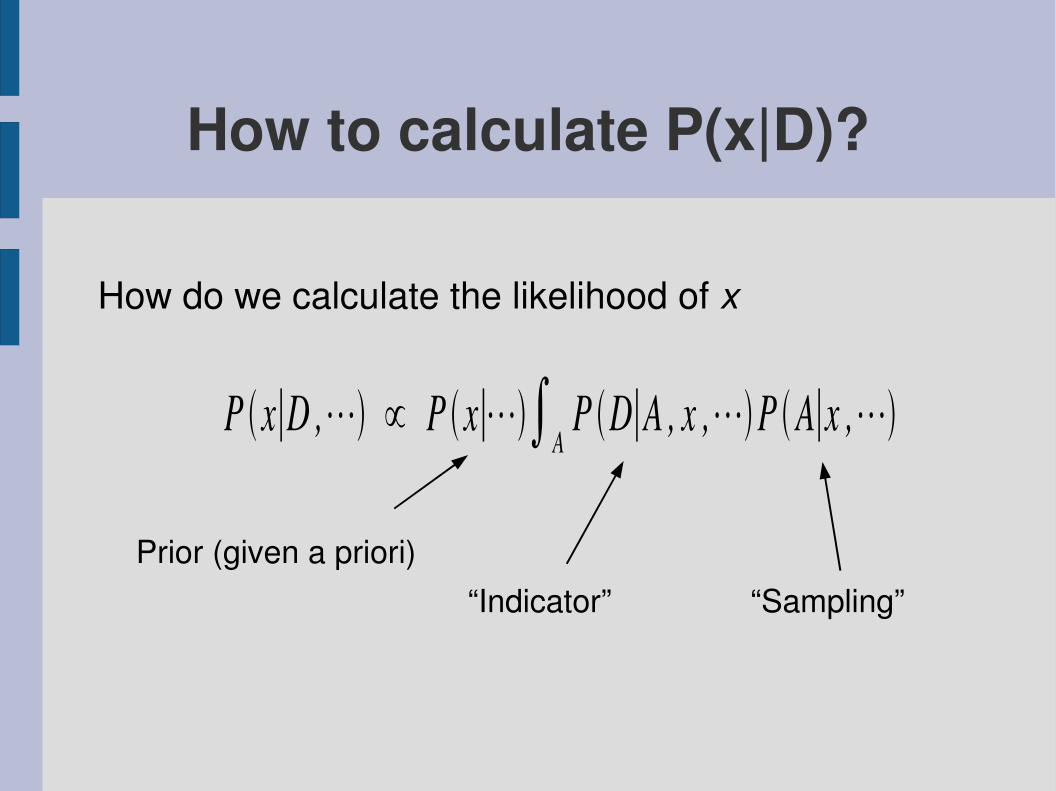
How to calculate P(x|D)?
P x∣D ,⋯ ∝ P x∣⋯∫AP D∣A , x ,⋯P A∣x ,⋯
How do we calculate the likelihood of x
Prior (given a priori)“Indicator” “Sampling”
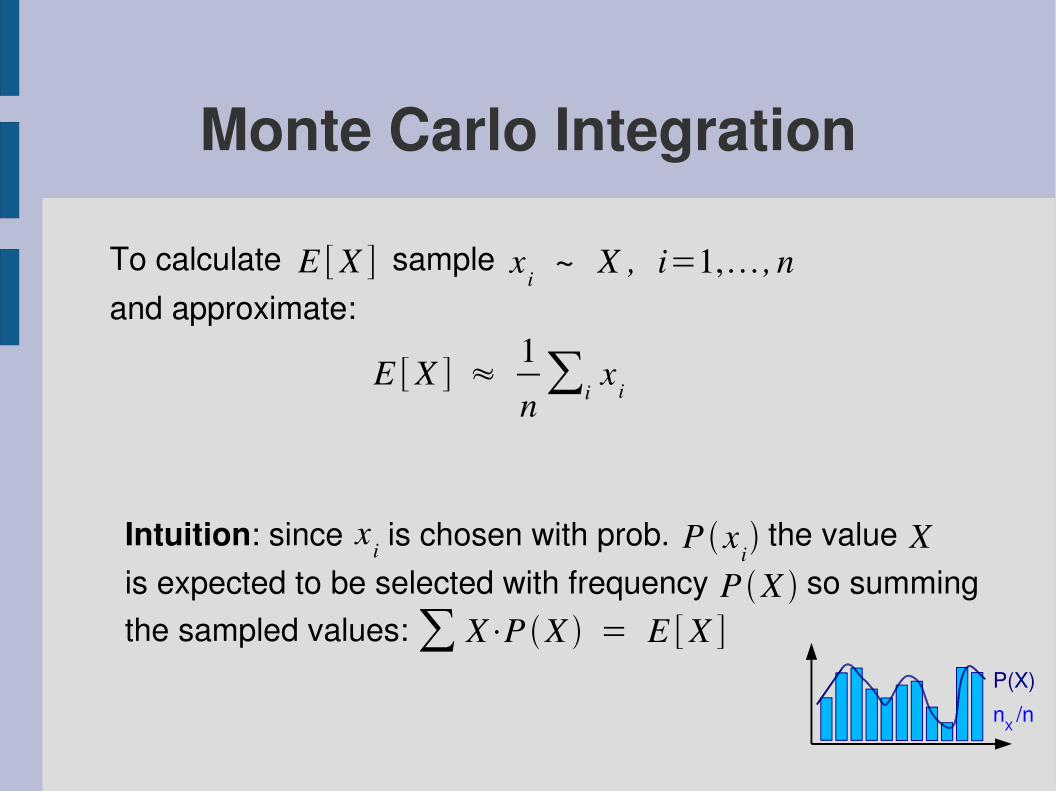
Intuition: since is chosen with prob. the valueis expected to be selected with frequency so summingthe sampled values:
Monte Carlo Integration
To calculate E [X ] sample x i ~ X , i=1, , nand approximate:
E [X ] ≈1n∑i
x i
P x ix i XP X
∑ X⋅P X = E [X ]P(X)nX /n
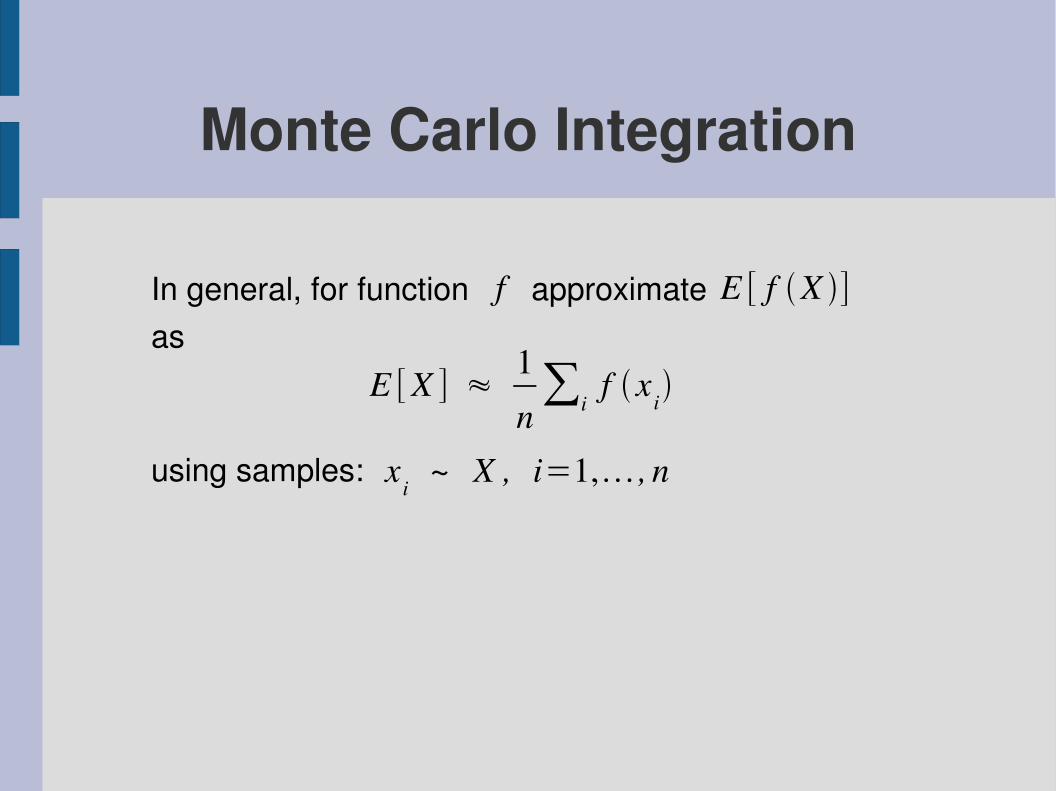
Monte Carlo Integration
In general, for function approximate as
x i ~ X , i=1, , n
E [ f X ]f
E [X ] ≈1n∑i
f x i
using samples:
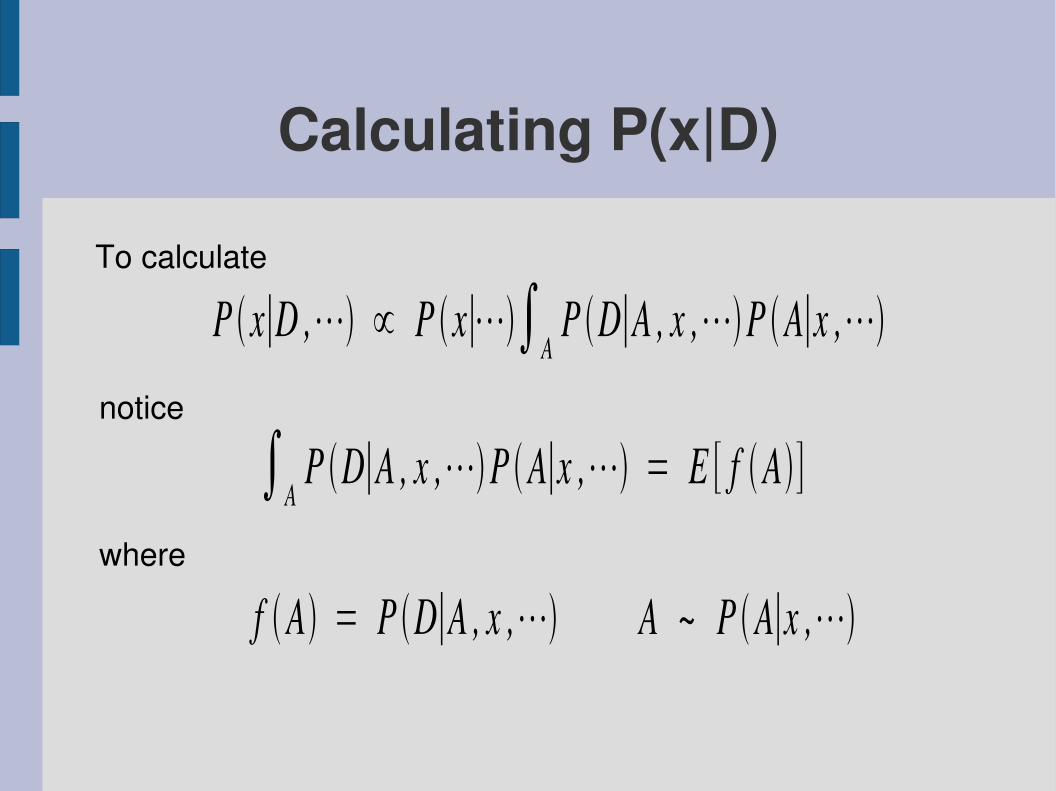
Calculating P(x|D)
P x∣D ,⋯ ∝ P x∣⋯∫AP D∣A , x ,⋯P A∣x ,⋯
To calculate
notice
∫AP D∣A , x ,⋯P A∣x ,⋯ = E [ f A]
where
f A = P D∣A , x ,⋯ A ~ P A∣x ,⋯
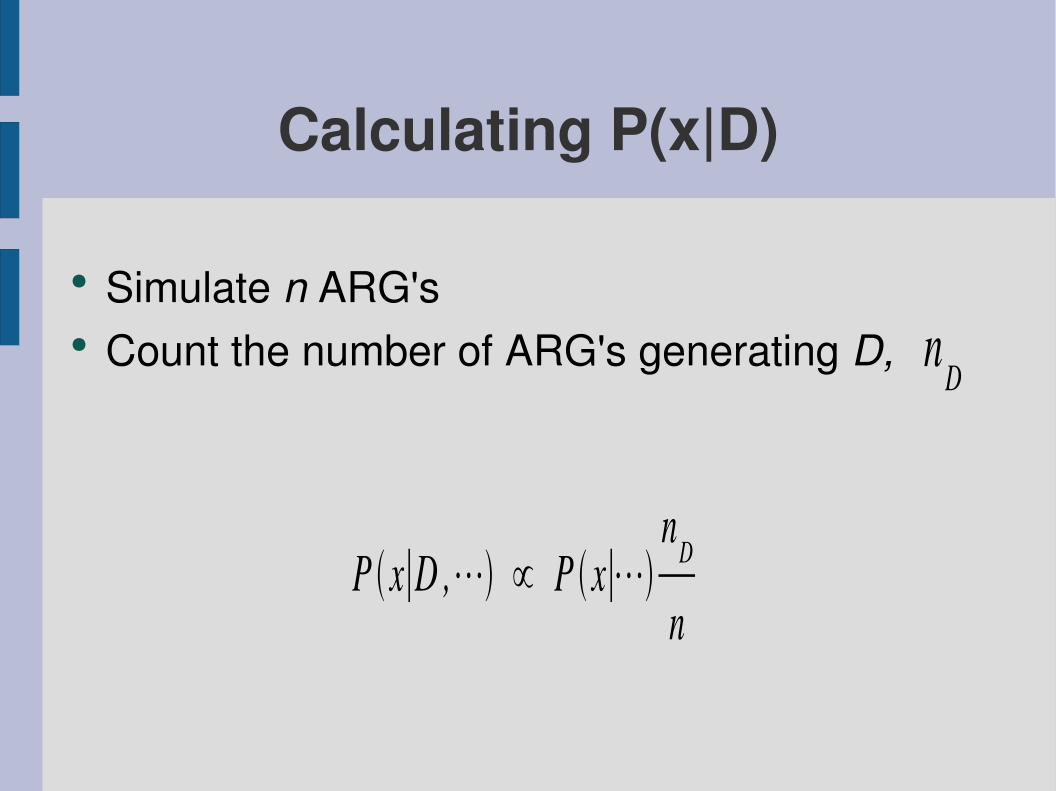
● Simulate n ARG's● Count the number of ARG's generating D,
Calculating P(x|D)
P x∣D ,⋯ ∝ P x∣⋯nD
n
nD

Importance Sampling
For most simulated ARGs, P(D|A,x,...) will be 0
A more efficient method would only sample “correct” ARGsand then weight their probability with P(A|x,...)
(Larribe, Lessard and Schork, 2002)
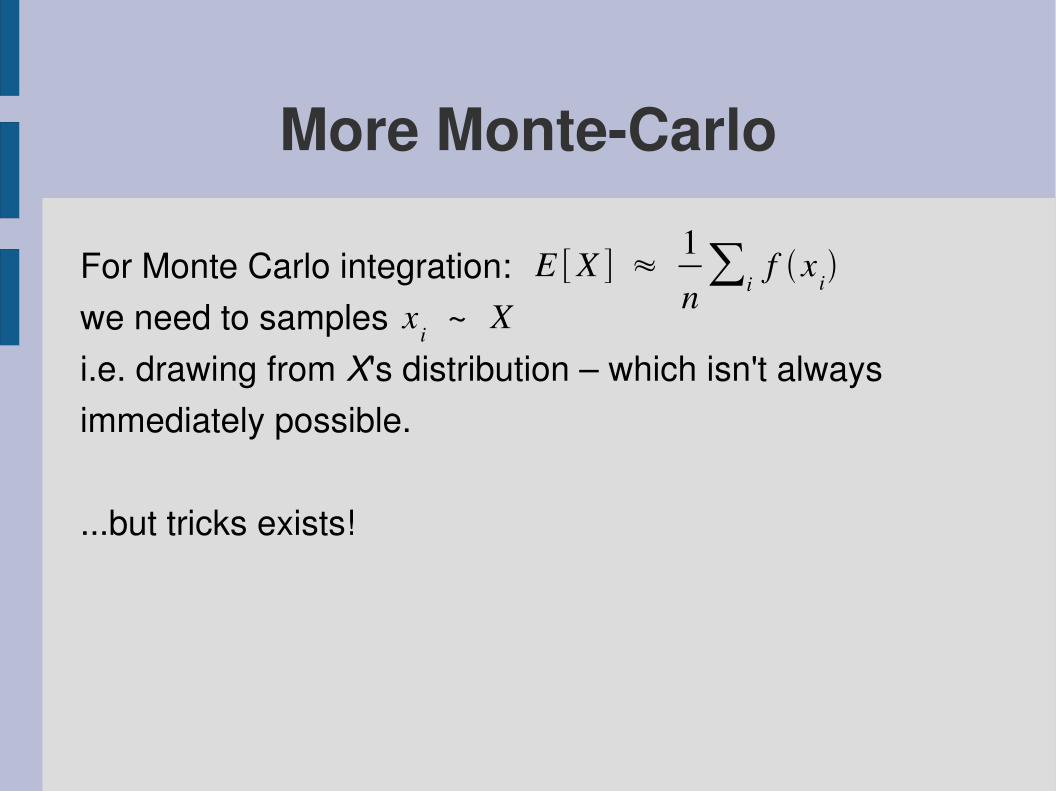
More MonteCarlo
For Monte Carlo integration:we need to samplesi.e. drawing from X's distribution – which isn't alwaysimmediately possible.
...but tricks exists!
E [X ] ≈1n∑i
f x ix i ~ X
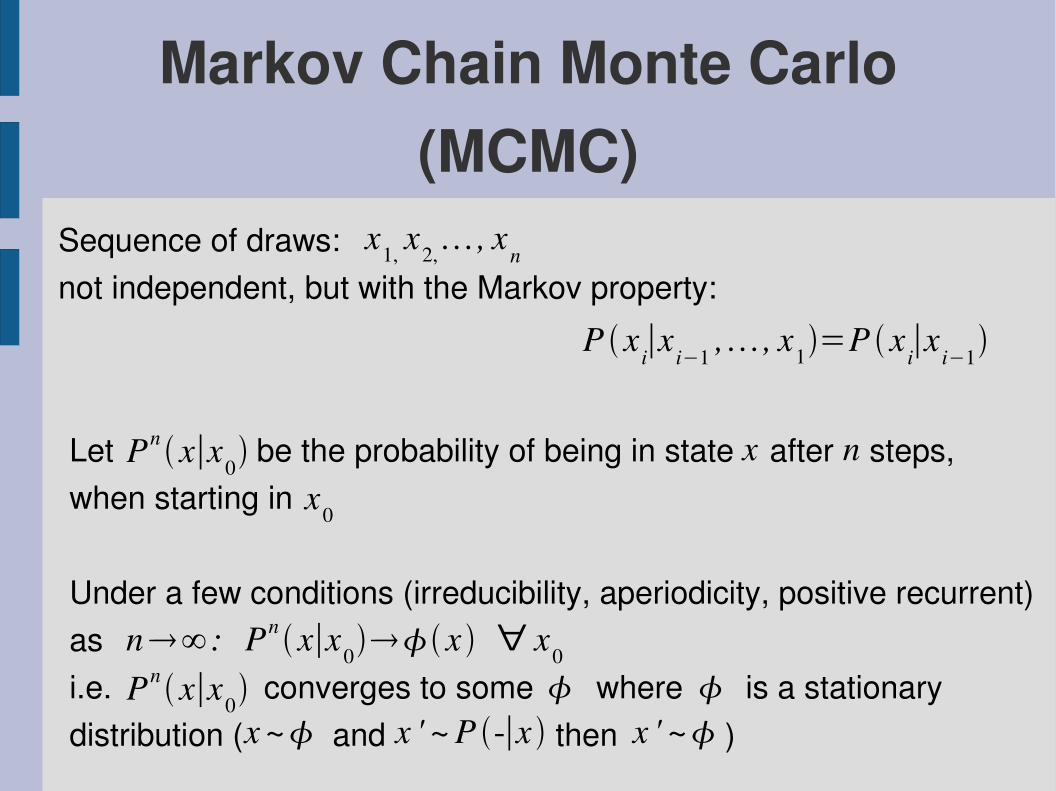
Markov Chain Monte Carlo (MCMC)
Sequence of draws:not independent, but with the Markov property:
x1, x2, , xn
P x i∣x i−1 , , x1=P x i∣x i−1
Let be the probability of being in state after steps,when starting in
Under a few conditions (irreducibility, aperiodicity, positive recurrent)asi.e. converges to some where is a stationary distribution ( and then )
Pn x∣x0 xx0
n
n∞ : Pn x∣x0x ∀ x0
Pnx∣x0 x ~ x ' ~ P ∣x x ' ~

Markov Chain Monte Carlo (MCMC)
● To sample from distribution– Create Markov chain with stationary distribution– Start in arbitrary state and run– After a burnin period, start sampling
● The sampled values are not independent, but with the right frequency for Monte Carlo integration
● The tricky parts are:– Creating the right Markov chain– Mixing (moving around in the state space)
x i ~ P ∣x i−1x0
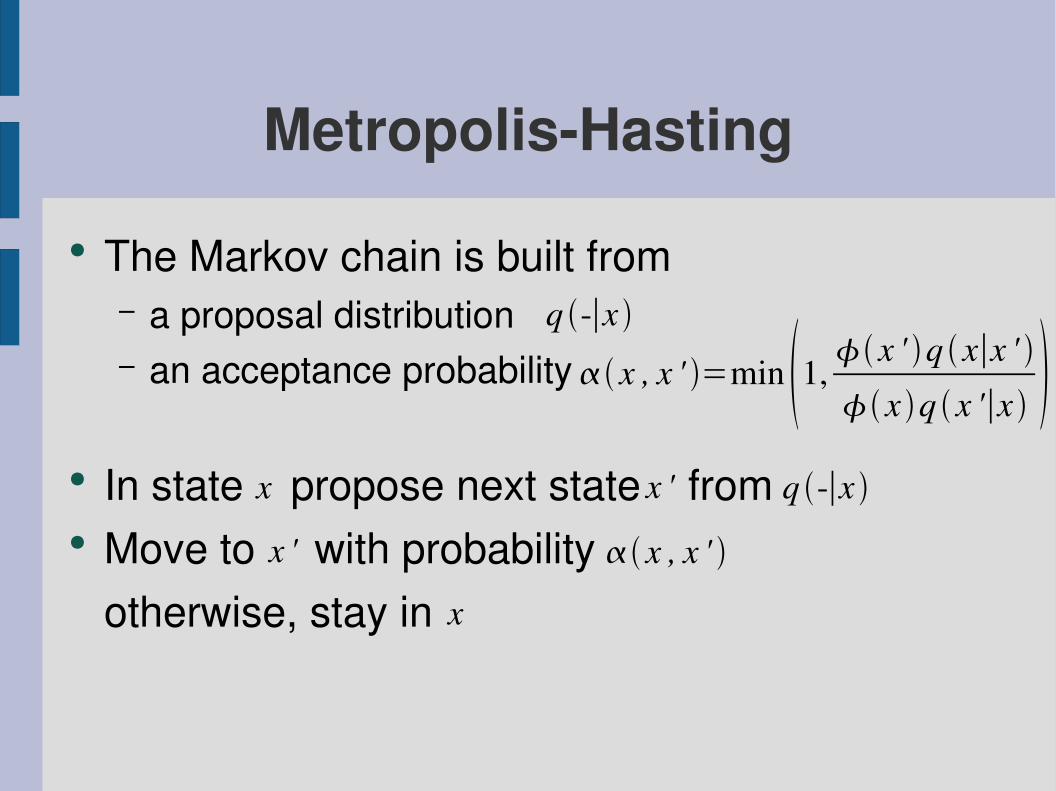
MetropolisHasting● The Markov chain is built from
– a proposal distribution– an acceptance probability
● In state propose next state from● Move to with probability
otherwise, stay in
q ∣x x , x ' =min 1, x ' q x∣x '
x q x '∣x q ∣x
x
x x '
x ' x , x '
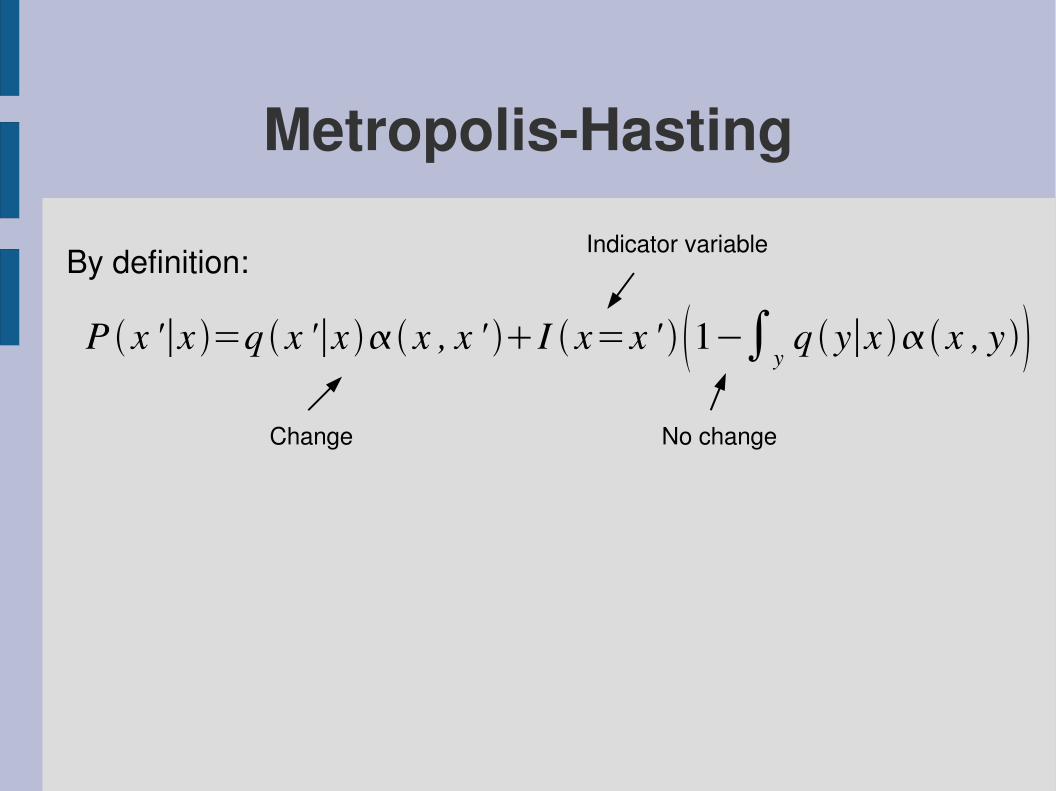
MetropolisHasting
By definition:
P x '∣x =q x '∣x x , x ' I x=x ' 1−∫yq y∣x x , y
Indicator variable
Change No change

MetropolisHasting
By definition:
P x '∣x =q x '∣x x , x ' I x=x ' 1−∫yq y∣x x , y
Usingx q x '∣x x , x ' =x ' q x∣x ' x ' , x
we getx P x '∣x =x ' P x∣x '
and therefore∫x
x P x '∣x =x ' i.e. is the stationary distribution of the Markov chain.
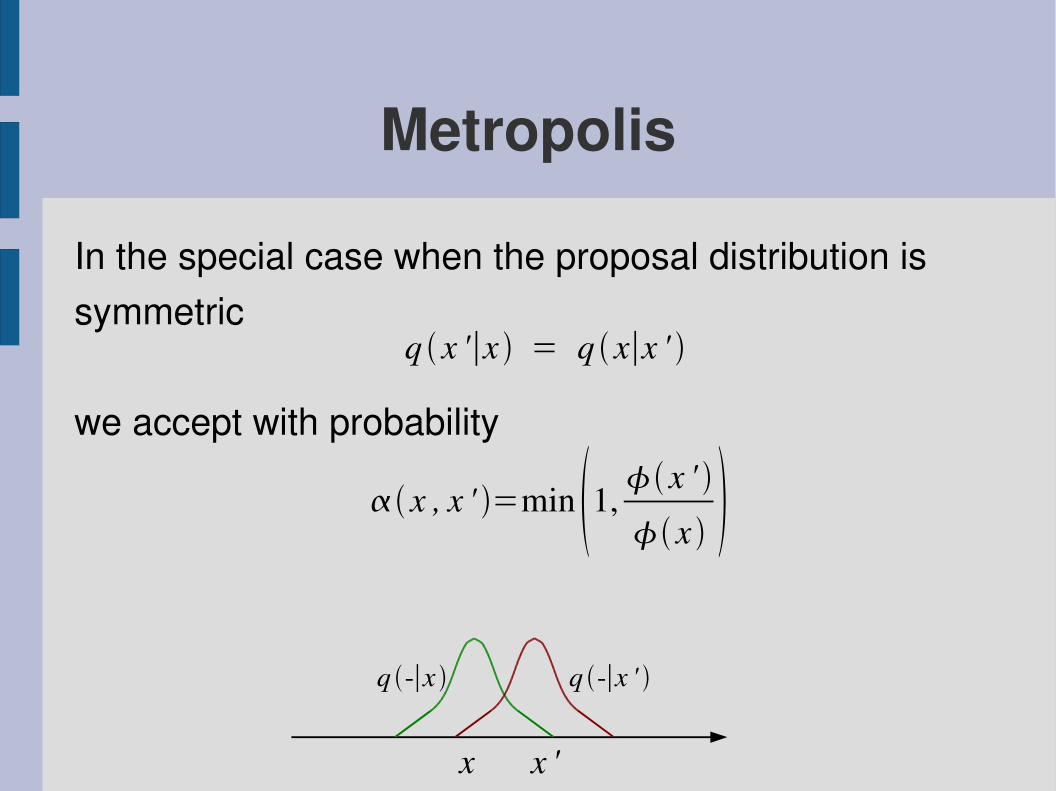
Metropolis
In the special case when the proposal distribution issymmetric
we accept with probability
q x '∣x = q x∣x '
x , x ' =min 1, x ' x
x x '
q ∣x ' q ∣x

MetropolisSet of change functions CLikelihood function L
x = arbitrary initial statefor i = 1..N: c = random from Cx' = c(x)y = random from U[0,1]
if y < L(x')/L(x):x = x'
sample x

Metropolis for MappingState: traitlocus, ARG, other parameters
Change functions: move traitlocus, change ARG topology, change waiting times, change recombination points, change alleles on inner nodes, ...
Likelihood function: product of waiting times from Exp(), prob. of events (mutations, recombinations, coalescence...), ...

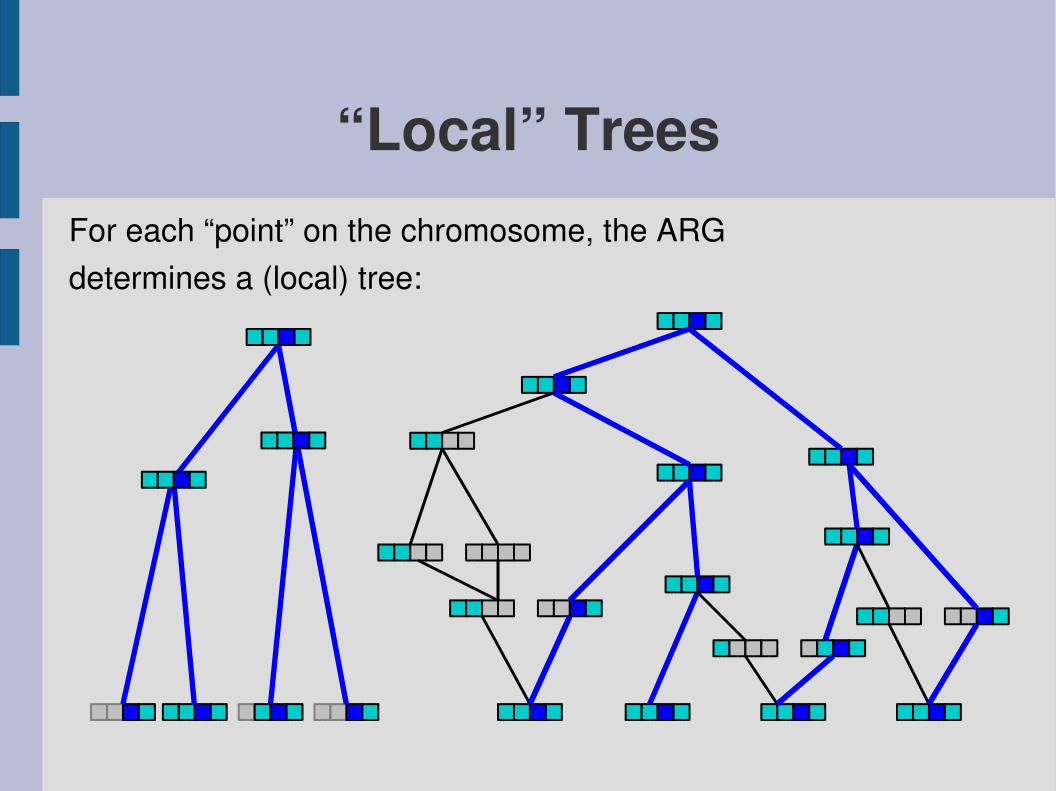
“Local” TreesFor each “point” on the chromosome, the ARGdetermines a (local) tree:

“Local” TreesFor each “point” on the chromosome, the ARGdetermines a (local) tree:
“Local” TreesFor each “point” on the chromosome, the ARGdetermines a (local) tree:

“Local” TreesFor each “point” on the chromosome, the ARGdetermines a (local) tree:
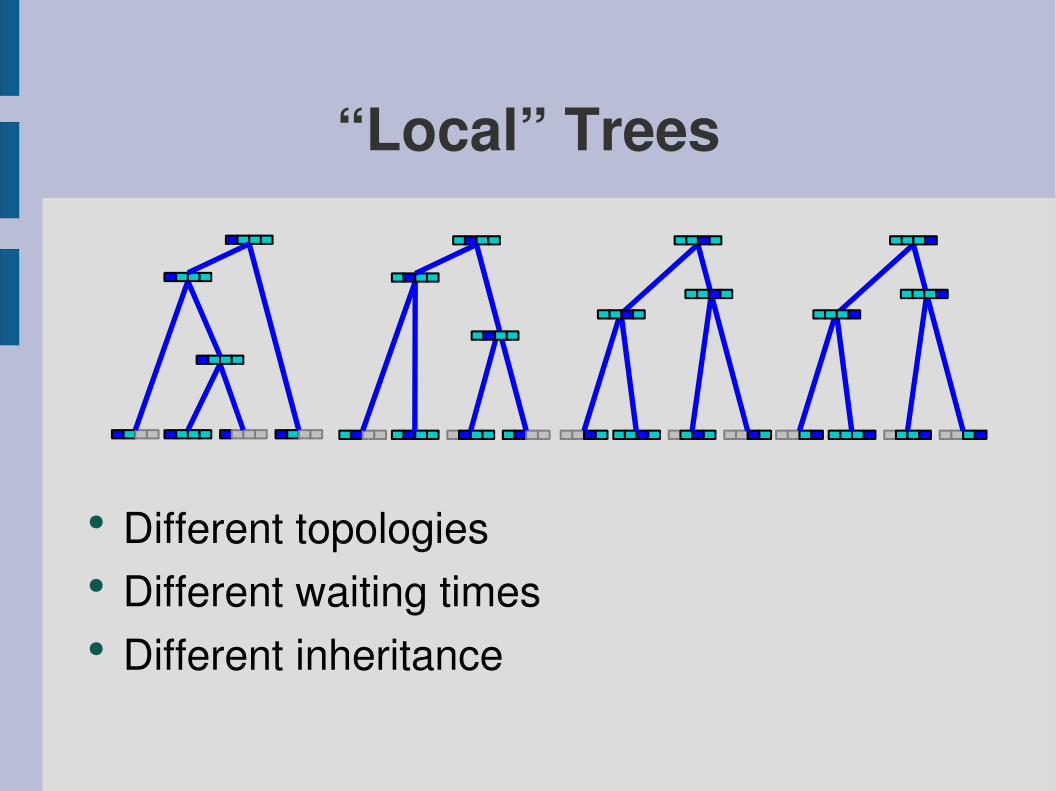
● Different topologies● Different waiting times● Different inheritance
“Local” Trees

The Traitlocus Tree
The tree at the trait locus,with root in the MRCA of the affected chromosomes

Searching the TraittreeState Space
The statespace of traittrees is smaller than the statespace of ARGsand thus easier to explore
But the model for the sequencesmust be changed
(Rannala & Reeve 2001, Morris, Whittaker & Balding 2002)
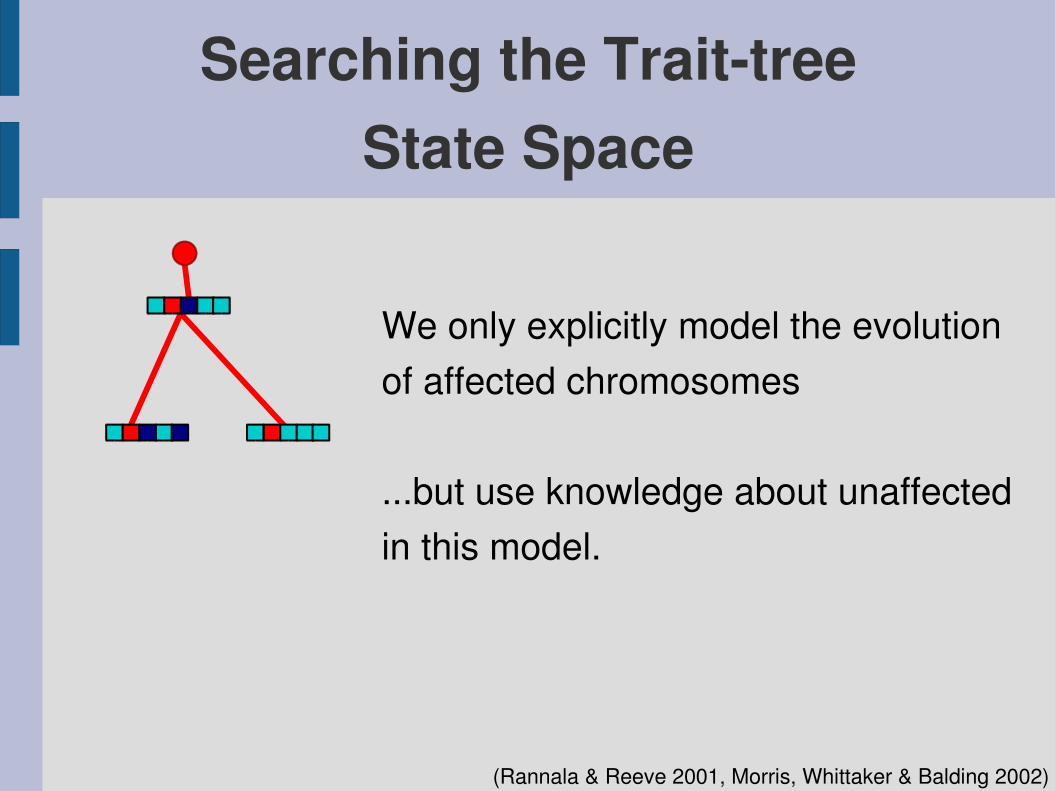
Searching the TraittreeState Space
We only explicitly model the evolutionof affected chromosomes
...but use knowledge about unaffectedin this model.
(Rannala & Reeve 2001, Morris, Whittaker & Balding 2002)
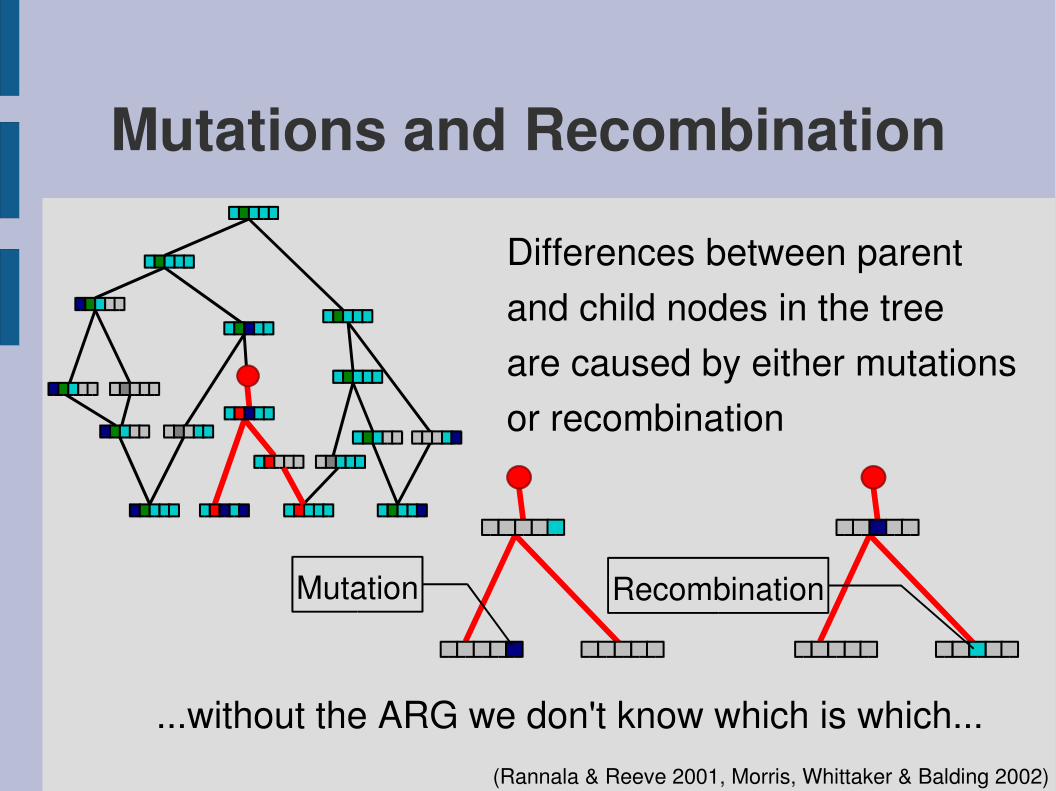
Mutations and Recombination
Differences between parentand child nodes in the treeare caused by either mutationsor recombination
Mutation Recombination
(Rannala & Reeve 2001, Morris, Whittaker & Balding 2002)
...without the ARG we don't know which is which...
P ∣ P
P ∣ P
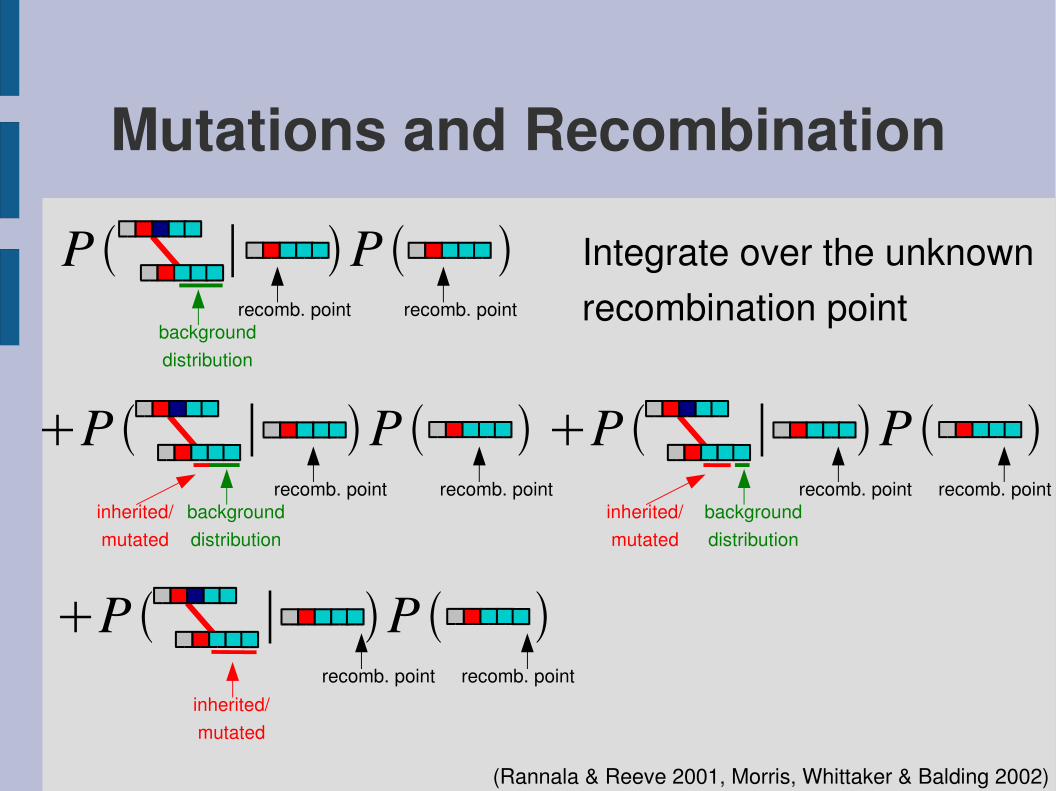
Mutations and Recombination
Integrate over the unknownrecombination point
(Rannala & Reeve 2001, Morris, Whittaker & Balding 2002)
recomb. point recomb. pointbackgrounddistribution
recomb. point recomb. pointbackgrounddistribution
inherited/mutated
P ∣ P recomb. point recomb. point
backgrounddistribution
inherited/mutated
P ∣ P recomb. point recomb. point
inherited/mutated
P ∣ P
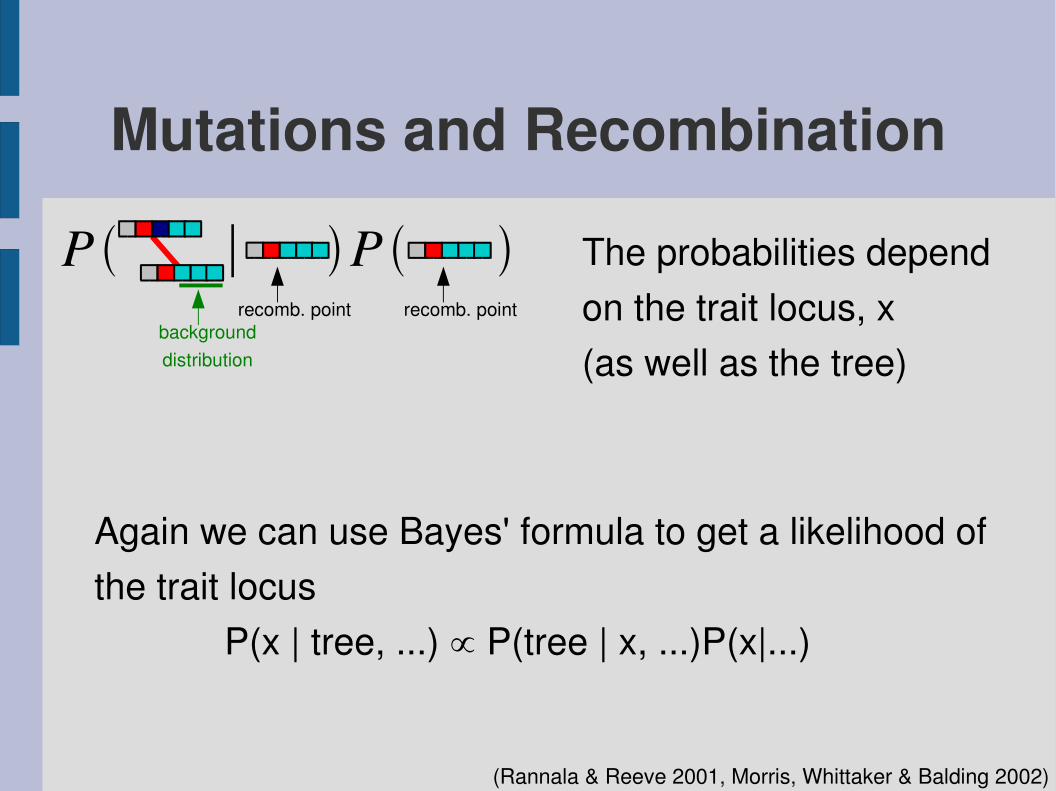
Mutations and Recombination
The probabilities dependon the trait locus, x(as well as the tree)
(Rannala & Reeve 2001, Morris, Whittaker & Balding 2002)
recomb. point recomb. pointbackgrounddistribution
Again we can use Bayes' formula to get a likelihood ofthe trait locus
P(x | tree, ...) ∝ P(tree | x, ...)P(x|...)
P ∣
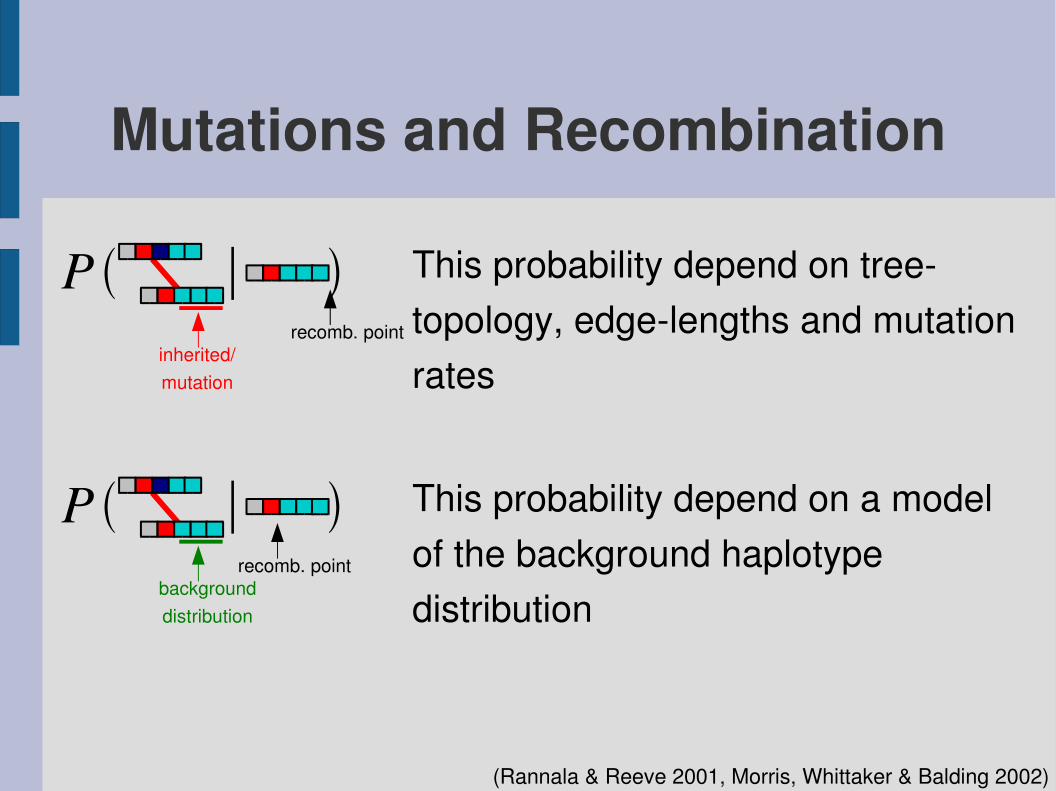
Mutations and Recombination
This probability depend on treetopology, edgelengths and mutation rates
(Rannala & Reeve 2001, Morris, Whittaker & Balding 2002)
recomb. pointinherited/mutation
P ∣ This probability depend on a modelof the background haplotype distribution
recomb. pointbackgrounddistribution

Background Haplotype Distribution
Assume linkage equilibrium:
P = P P P P P
Allele frequencies
(Liu et al. 2001; Morris, Whittaker & Balding 2002)
(Rannala & Reeve 2001)
or perhaps a Markov model:
P = P P ∣ P ∣ P ∣ P ∣

State Space
(Rannala & Reeve 2001, Morris, Whittaker & Balding 2002)
The state in our MCMC consists of: x : the trait locus T : the coalescence tree B : background frequencies (or such) ...

P
Likelihood
1
2
3
Independent waiting timesIndependent edgeprobabilities
P
P
P P
P P
P
P
(Rannala & Reeve 2001, Morris, Whittaker & Balding 2002)
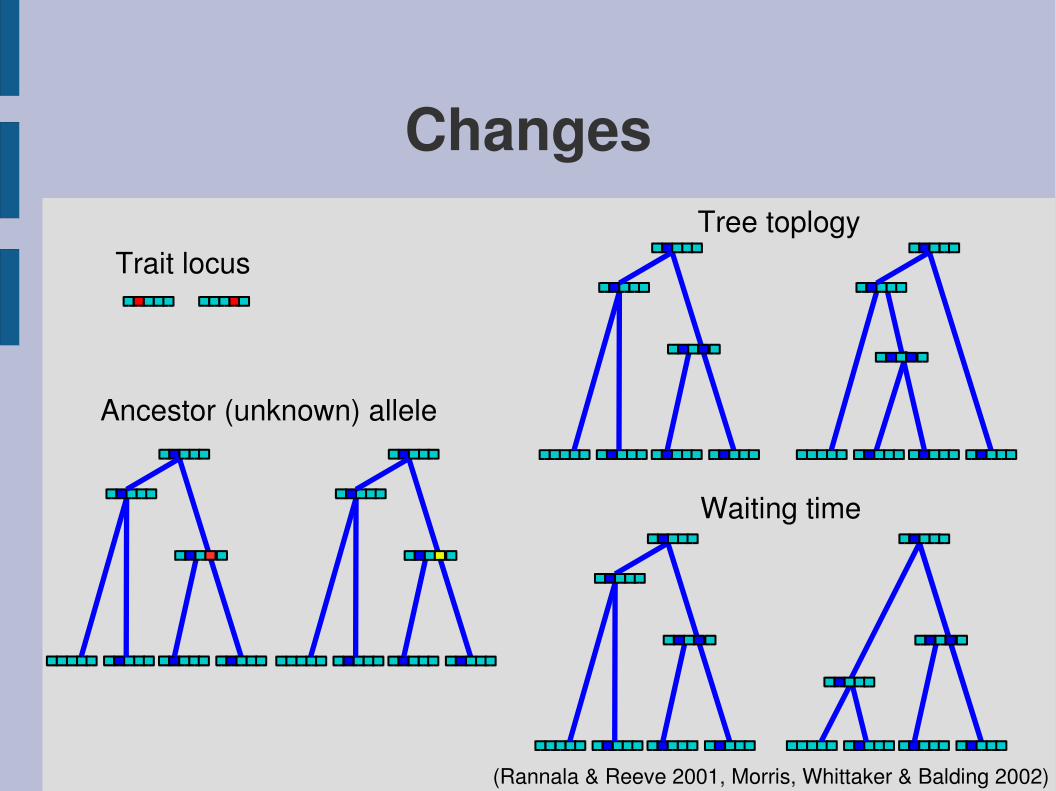
ChangesTree toplogy
(Rannala & Reeve 2001, Morris, Whittaker & Balding 2002)
Waiting time
Trait locus
Ancestor (unknown) allele

Cystic Fibrosis

StarTopology Approximation
Startopology instead of a tree
Justifiable by exponential growth
(Liu et al. 2001)

Summary
● In section 2 we:– Derived a model for the evolution of
sequences (the Ancestral Recombination Graph)
– Derived likelihoods for the traitlocus– Used MCMC techniques for mapping

The End
LiteratureHudson, R. R. (1990).
Gene genealogies and the coalescent process, “Oxford Surveys in Evolutionary Biology” (D. futuyma and J. Antonovics, Eds.) Vol 7, pp. 144, Oxford Univ. Press, Oxford, UK
Fabrice Larribe, Sabin Lessard and Nicholas J. Schork. (2002)Gene Mapping via the Ancestral Recombionation Graph, Theoretical Population Biology, vol 62, pages 215229, 2002
A. P. Morris, J. C. Whittaker, and D. J. Balding Fine scale mapping of disease loci via shattered coalescent modelling of genealogies, Am. J. Hum. Gen. 70:686707, 2002
Jun S. Liu, Chiara Sabatti, Jun Teng, Bronya J. B. Keats, Neil RischBayesian Analysis of Haplotypes for Linkage Disequilibrium Mapping, Genome Research 11: 17161724
R. C. Griffiths and P. Marjoram Ancestral inference from samples of DNA sequences with recombination. Journal of Computational Biology 3: 479502 1996
B. Kerem, J. M. Rommens, J. A. Buchanan D. Markiewicz, T. K. Cox, A. Chakravarti, M. Buchwald and L. C. TsuiIdentification of the Cystic Fibrosis Gene: Genetic Analysis Science 245: 10731080, 1989