association between lottery prize size and self-reported
TRANSCRIPT

Original Investigation | Public Health
Association Between Lottery Prize Size and Self-reported Health Habitsin Swedish Lottery PlayersRobert Östling, PhD; David Cesarini, PhD; Erik Lindqvist, PhD
Abstract
IMPORTANCE Poor health and unhealthy lifestyles are substantially more prevalent amongindividuals with low income than among individuals with high income, but the underlyingmechanisms are not well understood.
OBJECTIVE To evaluate whether changes to unearned wealth from lotteries are associated withlong-term health behaviors and overall health.
DESIGN, SETTING, AND PARTICIPANTS In this quasi-experimental cohort study, 4820 participants(aged 18-70 years at the time of winning) in 3 Swedish lotteries were surveyed from September 1,2016, to November 11, 2016, between 5 and 22 years after a lottery event. Outcomes of participantsin the same lottery who were randomly assigned prizes of different magnitudes by the lotteries butwere ex ante identical in terms of their probability of winning different prizes were compared. Datawere analyzed from December 22, 2016, to November 21, 2019.
EXPOSURES Lottery prizes ranged from $0 for nonwinning players to $1.6 million.
MAIN OUTCOMES AND MEASURES Four lifestyle factors (smoking, alcohol consumption, physicalactivity, and a healthy diet index) and 2 measures of overall health (subjective health and an indexof total health derived from responses to questions about 35 health conditions).
RESULTS The survey was returned by 3344 of 4820 individuals (69%; 1722 [51.5%] male), whichcorresponded to 3362 observations. The mean (SD) age was 48 (11.8) years in the year of the lotterywin and 60 (11.0) years at the time of the survey. There were no statistically significant associationsbetween prize amount won and any of the 6 long-term health outcomes. Estimated associationsexpressed in SD units per $100 000 won were as follows: smoking (−0.006, 95% CI, −0.038 to0.026); alcohol consumption (0.003, 95% CI, −0.027 to 0.033); physical activity (0.001, 95% CI,−0.029 to 0.032); dietary quality (−0.007, 95% CI, −0.040 to 0.026); subjective health (0.013, 95%CI, −0.017 to 0.043); and index of total health (−0.003, 95% CI, −0.033 to 0.027).
CONCLUSIONS AND RELEVANCE In this study of Swedish lottery players, unearned wealth fromrandom lottery prize winnings was not associated with subsequent healthy lifestyle factors or overallhealth. The findings suggest that large, random transfers of unearned wealth are unlikely to beassociated with large, long-term changes in health habits or overall health.
JAMA Network Open. 2020;3(3):e1919713. doi:10.1001/jamanetworkopen.2019.19713
Key PointsQuestion Is unearned wealth from
lottery winnings associated with more
healthy habits and better overall health?
Findings This quasi-experimental
cohort study of 3344 individuals in 3
Swedish lotteries found no statistically
significant differences in long-term (5-22
years) health behaviors or overall health
among individuals who participated in
the same lottery but who randomly won
prizes of different magnitudes.
Meaning The findings suggest that
large, random transfers of unearned
wealth are unlikely to be associated with
large, long-term changes in health habits
or overall health.
+ Supplemental content
Author affiliations and article information arelisted at the end of this article.
Open Access. This is an open access article distributed under the terms of the CC-BY License.
JAMA Network Open. 2020;3(3):e1919713. doi:10.1001/jamanetworkopen.2019.19713 (Reprinted) March 19, 2020 1/12
Downloaded From: https://jamanetwork.com/ on 02/21/2022
Introduction
Research has documented a positive association between income and health.1 The positiveassociation, sometimes characterized as the income-health gradient, has been found across a widerange of institutional settings, including developed countries with extensive welfare systems. Forexample, a Swedish study found that men in the lowest income decile were 5 times more likely toreport being in ill health compared with men in the top decile.2 There is broad agreement thatsystematic differences in lifestyle and behavioral factors contribute to the income-health gradient.3
Research has consistently found that individuals with higher incomes are less likely to engage inhealth-impairing behaviors, such as smoking, and more likely to engage in health-promotingbehaviors, such as maintaining a healthy diet or exercising regularly.4-7
However, to date, the reasons why health behaviors vary by income have not been established.One possibility is that income directly influences people’s health behaviors. For example, it has beenhypothesized that income is associated with health behaviors because it is costly to maintain ahealthy lifestyle.8 Some epidemiologists have also proposed that the higher prevalence of health-impairing behaviors, such as smoking, in low-income households is a behavioral response to thestress caused by limited material resources.9-11
A difficulty when testing such hypotheses is that income is rarely randomly assigned. Manyestimates in the literature are therefore based on observational studies, in which concerns aboutconfounding and reverse causality cannot be eliminated.6 In principle, a randomized trial could beused to study how large changes in income affect health. In practice, a well-powered randomizedevaluation would likely be prohibitively expensive. Researchers are therefore increasingly turning toquasi-experimental designs when attempting to make inferences about the potential effects ofincome on health, but the evidence from this literature remains inconclusive.6
In this study, we leveraged the randomized selection of prize winners by Swedish lotteries totest whether unearned financial prizes were associated with long-term health behaviors and self-assessed health. A key methodological strength of our study that distinguishes it from previousquasi-experimental studies of survey-based measures of health7,12-15 is that our data allowed us toclassify participants into groups within which the lottery prizes were randomly assigned via thealgorithms used by each lottery. We thus compared players who had the same chance of winning thelottery but won different amounts. By using the lottery-determined randomized assignment of prizeamounts within groups, we attempted to mitigate the methodological problems with observationalstudies mentioned above.
Our prior study16 of the same participants examined the association of lottery winnings withself-reported happiness, overall life satisfaction, mental health, and financial life satisfaction, findingthat unearned wealth from lottery winnings was associated with improved life satisfaction but nothappiness or mental health. The current study was intended to assess the associations with self-reported health behaviors.
Credible estimates of how income affects health and health behaviors are potentially valuableto policy makers. Many experts postulate that more wealth among low-income populations results inbetter health and healthier lifestyles.8 This study used the experience of lottery winners to helpinform such discussions.
Methods
Study Design, Setting, and ParticipantsThis quasi-experimental cohort study was approved by the regional ethical review board inStockholm, Sweden, on April 7, 2016. The survey data were collected by Statistics Sweden in the fallof 2016. Data were analyzed from December 22, 2016, to November 21, 2019. eFigure 1 in theSupplement provides a detailed summary of the survey timeline. Informed consent was obtained in
JAMA Network Open | Public Health Association Between Lottery Prize Size and Self-reported Health Habits in Swedish Lottery Players
JAMA Network Open. 2020;3(3):e1919713. doi:10.1001/jamanetworkopen.2019.19713 (Reprinted) March 19, 2020 2/12
Downloaded From: https://jamanetwork.com/ on 02/21/2022

writing through survey responses or orally during telephone survey interviews. This study followedthe Strengthening the Reporting of Observational Studies in Epidemiology (STROBE) guideline.
Our study builds on a previous analysis of a large administrative sample of Swedish lotteryparticipants.17 That study analyzed outcomes, such as mortality and health care utilization, measuredup to 10 years after the lottery event. Despite excellent power, most of the study’s quasi-experimental estimates were not statistically distinguishable from 0 (a possible exception was thatlarge-prize winners consumed fewer anxiolytics, hypnotics, and sedatives, but the reductions weremodest). A key limitation of the administrative study was that government registers do not containinformation about health behaviors. As a result, the study was limited in its ability to test some of thehypotheses about the mechanisms linking income to health.
In the design stage of the present study, we identified a subset of the population in the originaladministrative sample. We surveyed members of the resulting survey population (N = 4820) abouttheir overall health and health behaviors (eTable 1 in the Supplement gives additional data on howrespondents were selected). The majority of the survey population received and returned the surveyvia regular mail. Statistics Sweden contacted a subsample of nonrespondents (n = 501) via telephoneand asked them to complete an abbreviated version of the survey. The survey population wascomposed of participants in 3 different lotteries. One group consisted of participants in Kombi, amonthly subscription lottery with approximately 500 000 subscribers. The other 2 lottery groupsconsisted of winners from televised draws in a popular scratch-off lottery called Triss. Wedistinguished between individuals who won a monthly income supplement (Triss-monthly) andthose who won a single, lump-sum prize (Triss–lump sum). For comparability, we used the netpresent value of the Triss-monthly installments throughout the analysis. The survey population wasan approximately 1% subsample of the pooled lottery sample analyzed in the previous administrativestudy.17 However, because we oversampled large-prize winners, our statistical power comparedfavorably with the previous quasi-experimental studies of lottery participants.
To mitigate concerns about experimenter demand effects, the invitation letter accompanyingthe survey did not mention that all respondents had been drawn from lottery samples. The finalsurvey attained an overall response rate of 69% (3344 of 4820 participants; 3233 mail respondentsand 111 telephone respondents). Hereafter, we refer to the survey respondents as therespondent sample.
We publicly archived an analysis plan before accessing the survey data.18 The analysis plan fullyspecified criteria for inclusion in the estimation sample, 3 diagnostic tests of endogenous attrition,a set of primary outcomes, variable coding (including handling of missing values and outliers), theanalytic framework and estimating equation, heterogeneity and robustness analyses, andprocedures for multiple-hypothesis adjustment of P values.
Constructing Group IdentifiersWe classified participants into groups within which the prize amount was randomly assigned by thelotteries. In our analyses, we controlled for group-identifier fixed effects, thus ensuring that allestimates were derived from within-group associations between health outcomes and lotterywinnings.
To construct the group identifiers, we followed previously published procedures.17 In Kombi, wedefined a unique group identifier for each large-prize winner. We then assigned 4 nonwinners to eachlarge-prize winner’s group. These control individuals were randomly sampled (using apreprogrammed routine in Stata [StataCorp LLC]) from the group of participants who were identicalto the winners in terms of age, sex, and number of tickets purchased in the month of the win.eFigure 2 in the Supplement provides the construction of the Kombi group identifiers.
For the 2 Triss lotteries, we did not have information about lottery ticket purchases. Instead, wecompared individuals who participated in large-stake televised lottery draws. Individuals qualifiedfor the television show by winning either the lump-sum or the monthly first-stage lottery. At theshow, they drew their second-stage prize from a distribution specified by a prize plan. Two
JAMA Network Open | Public Health Association Between Lottery Prize Size and Self-reported Health Habits in Swedish Lottery Players
JAMA Network Open. 2020;3(3):e1919713. doi:10.1001/jamanetworkopen.2019.19713 (Reprinted) March 19, 2020 3/12
Downloaded From: https://jamanetwork.com/ on 02/21/2022
individuals who qualified through the same first-stage lottery under the same prize plan faced exactlythe same distribution of lottery prizes in the second stage. We therefore assigned lottery winners tothe same group identifier if they won the same type of prize (lump-sum or monthly) within the sameyear and within the same prize plan.
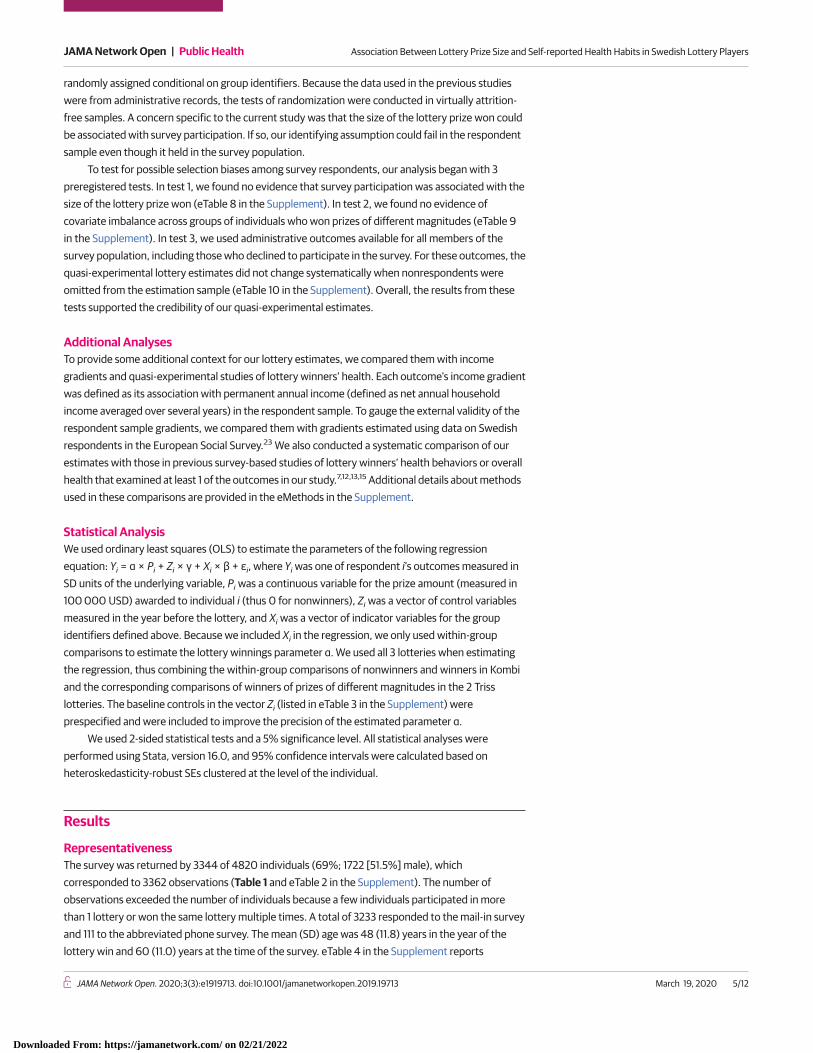
Outcome MeasuresFigure 1 summarizes the 6 primary outcomes (subjective health, health index, smoking, alcoholconsumption, physical activity, and healthy diet) and reports their Pearson pairwise correlations(eMethods and eTable 7 in the Supplement). In selecting outcome variables, we prioritized variablesthat are not captured reliably by administrative registers. Four of our primary outcomes were lifestylefactors (smoking, alcohol consumption, physical activity, and healthy diet). Smoking was measuredas the number of cigarettes the respondent reported smoking on a typical day. The variable was setto 0 for nonsmokers. Alcohol consumption was measured as the respondent’s score on a 3-itemscreening test for heavy drinking and alcohol dependence.19 This variable ranged from 0 to 12, withhigher values indicating greater risk. Physical activity was given as an estimate of weekly energyexpenditure (measured in metabolic equivalent minutes) in a typical week because of physicalactivity. Healthy diet was based on an index derived from responses to questions about self-reportedconsumption of sweet drinks, seafood, and vegetables. Health behaviors are prominently featuredin both epidemiologic and economic theories of the association between income and health.3,11,20
Knowledge about how lottery wins are associated with health behaviors is therefore valuable forevaluating some of the mechanisms hypothesized to contribute to the income gradients.
Our final 2 outcomes were measures of overall health. Subjective health was derived from therespondent’s answer to the question, “How do you judge your overall state of health?” The variablehad 5 values, ranging from a value of 1 (very poor) to 5 (very good). The other outcome, the healthindex, was defined as a weighted average of 35 health conditions listed in our survey. It was coded sothat greater values denoted better health.
Survey-based measures of overall health are known to substantially improve the assessment ofmortality risk even in specifications with a rich set of covariates.21 Thus, the 2 outcomes were likelyto capture some information not contained in the register variables analyzed in the administrativeanalysis.17 Including these 2 variables also facilitated comparisons with the quasi-experimentalestimates reported in 2 previous studies.12,15
Testing Random AssignmentPrevious analyses17,22 of the administrative sample of lottery participants from which we selected oursurvey population have found support for the key identifying assumption that lottery prizes are
Figure 1. Pairwise Correlations Between Variables
Subjective health Subjective evaluation of overall health.
Health index Weighted average of indicator variables for 35 conditions(ailments, diseases, or symptoms).
0.58
Number of cigarettes smoked per day.
Score on screening test for problem drinking.
0.08
Weekly energy expenditure (metabolic equivalent minutes) on exercise,walking, and biking.
Index of dietary quality based on self-reported consumption of soda,sweet drinks, seafood, and vegetables.
0.19
–0.01
Cigarettes
Alcohol
Physical activity
Dietary quality
–0.13
–0.02
–0.11
The numbers in the circles are the pairwise correlations(Pearson r) between the 2 variables connected bythe lines.
JAMA Network Open | Public Health Association Between Lottery Prize Size and Self-reported Health Habits in Swedish Lottery Players
JAMA Network Open. 2020;3(3):e1919713. doi:10.1001/jamanetworkopen.2019.19713 (Reprinted) March 19, 2020 4/12
Downloaded From: https://jamanetwork.com/ on 02/21/2022
randomly assigned conditional on group identifiers. Because the data used in the previous studieswere from administrative records, the tests of randomization were conducted in virtually attrition-free samples. A concern specific to the current study was that the size of the lottery prize won couldbe associated with survey participation. If so, our identifying assumption could fail in the respondentsample even though it held in the survey population.
To test for possible selection biases among survey respondents, our analysis began with 3preregistered tests. In test 1, we found no evidence that survey participation was associated with thesize of the lottery prize won (eTable 8 in the Supplement). In test 2, we found no evidence ofcovariate imbalance across groups of individuals who won prizes of different magnitudes (eTable 9in the Supplement). In test 3, we used administrative outcomes available for all members of thesurvey population, including those who declined to participate in the survey. For these outcomes, thequasi-experimental lottery estimates did not change systematically when nonrespondents wereomitted from the estimation sample (eTable 10 in the Supplement). Overall, the results from thesetests supported the credibility of our quasi-experimental estimates.
Additional AnalysesTo provide some additional context for our lottery estimates, we compared them with incomegradients and quasi-experimental studies of lottery winners’ health. Each outcome’s income gradientwas defined as its association with permanent annual income (defined as net annual householdincome averaged over several years) in the respondent sample. To gauge the external validity of therespondent sample gradients, we compared them with gradients estimated using data on Swedishrespondents in the European Social Survey.23 We also conducted a systematic comparison of ourestimates with those in previous survey-based studies of lottery winners’ health behaviors or overallhealth that examined at least 1 of the outcomes in our study.7,12,13,15 Additional details about methodsused in these comparisons are provided in the eMethods in the Supplement.
Statistical AnalysisWe used ordinary least squares (OLS) to estimate the parameters of the following regressionequation: Yi = α × Pi + Zi × γ + Xi × β + εi, where Yi was one of respondent i’s outcomes measured inSD units of the underlying variable, Pi was a continuous variable for the prize amount (measured in100 000 USD) awarded to individual i (thus 0 for nonwinners), Zi was a vector of control variablesmeasured in the year before the lottery, and Xi was a vector of indicator variables for the groupidentifiers defined above. Because we included Xi in the regression, we only used within-groupcomparisons to estimate the lottery winnings parameter α. We used all 3 lotteries when estimatingthe regression, thus combining the within-group comparisons of nonwinners and winners in Kombiand the corresponding comparisons of winners of prizes of different magnitudes in the 2 Trisslotteries. The baseline controls in the vector Zi (listed in eTable 3 in the Supplement) wereprespecified and were included to improve the precision of the estimated parameter α.
We used 2-sided statistical tests and a 5% significance level. All statistical analyses wereperformed using Stata, version 16.0, and 95% confidence intervals were calculated based onheteroskedasticity-robust SEs clustered at the level of the individual.
Results
RepresentativenessThe survey was returned by 3344 of 4820 individuals (69%; 1722 [51.5%] male), whichcorresponded to 3362 observations (Table 1 and eTable 2 in the Supplement). The number ofobservations exceeded the number of individuals because a few individuals participated in morethan 1 lottery or won the same lottery multiple times. A total of 3233 responded to the mail-in surveyand 111 to the abbreviated phone survey. The mean (SD) age was 48 (11.8) years in the year of thelottery win and 60 (11.0) years at the time of the survey. eTable 4 in the Supplement reports
JAMA Network Open | Public Health Association Between Lottery Prize Size and Self-reported Health Habits in Swedish Lottery Players
JAMA Network Open. 2020;3(3):e1919713. doi:10.1001/jamanetworkopen.2019.19713 (Reprinted) March 19, 2020 5/12
Downloaded From: https://jamanetwork.com/ on 02/21/2022
descriptive statistics for the baseline controls in the respondent sample (overall and by lottery) andthe survey population.
Table 1 shows the period for which we had lottery data, the survey response rate, and thedistribution of prizes awarded for each lottery (prizes in SEK net of taxes converted to 2011 USD). Thesurvey outcomes were, on average, measured approximately 10 years (range, 5-22 years) after thelottery draw. Although most Kombi winners won prizes of approximately around $150 000, therange of prizes was greater for Triss–lump sum ($7000 to just over $900 000) and Triss-monthly($160 000 to almost $1.6 million).
Although our quasi-experimental method did not rely on comparisons of lottery participantswith nonparticipants, comparisons of lottery participants with a representative sample was used toassess whether our results were likely to generalize to the general population. eTable 4 in theSupplement provides the descriptive statistics for a representative sample of Swedish individualsfrom 2010 (reweighted to match the sex and age distribution of the respondent sample). In terms ofeducational attainment, marital status, and other baseline characteristics, all measured before thelottery events, the differences were modest. For example, 26% of the weighted survey populationcompleted college compared with 30% in the representative sample.
We also compared the health characteristics of members of the respondent sample with thoseof the general population (eTable 5 and eTable 6 in the Supplement). These comparisons weresubject to 2 caveats: (1) all health variables in the respondents sample were derived from surveyresponses obtained after the lottery, and (2) the survey questions were not always phrasedidentically in the 2 samples. Overall, lottery participants’ health was worse than that of the generalpopulation sample, although the differences were mostly modest. For example, 69% of lotteryparticipants (2302 of 3338 observations) indicated that they were in good health (compared with68% in a representative survey), 363 of 3213 (11%) smoked daily (vs 10%), 833 of 3224 (26%)engaged in at least 5 hours of physical activities per week (vs 34%), and 350 of 3237 (11%) reportednever drinking alcohol (vs 14%).
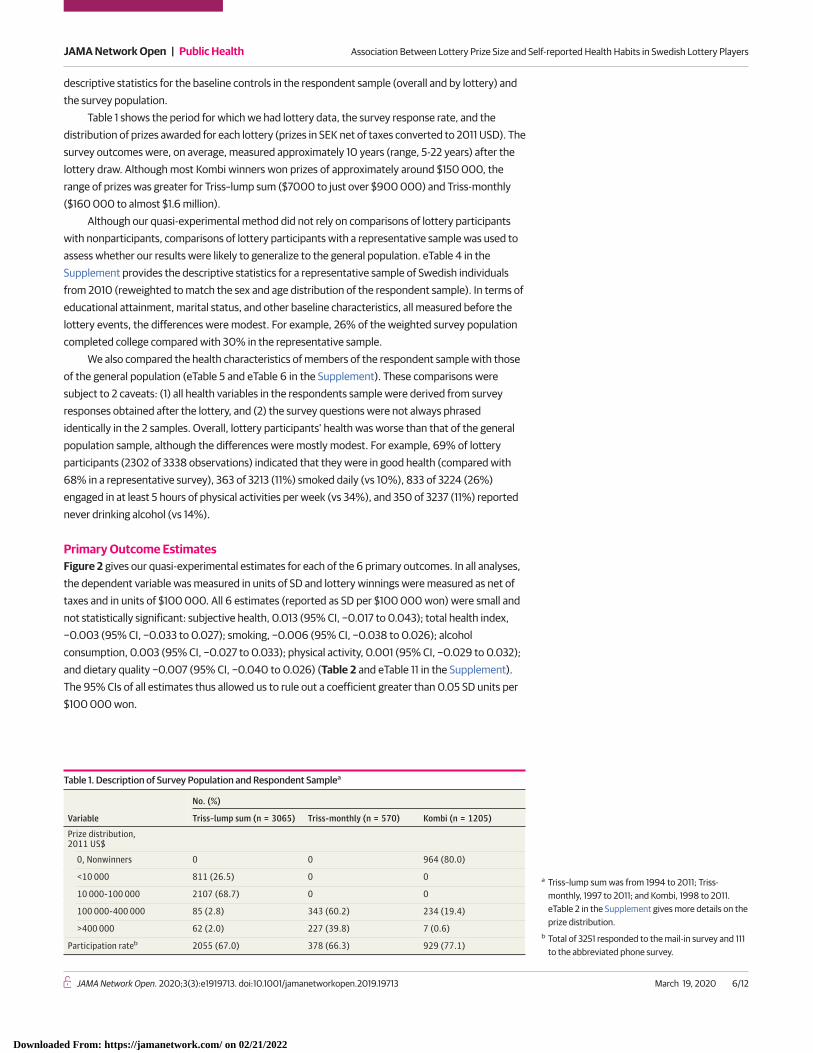
Primary Outcome EstimatesFigure 2 gives our quasi-experimental estimates for each of the 6 primary outcomes. In all analyses,the dependent variable was measured in units of SD and lottery winnings were measured as net oftaxes and in units of $100 000. All 6 estimates (reported as SD per $100 000 won) were small andnot statistically significant: subjective health, 0.013 (95% CI, −0.017 to 0.043); total health index,−0.003 (95% CI, −0.033 to 0.027); smoking, −0.006 (95% CI, −0.038 to 0.026); alcoholconsumption, 0.003 (95% CI, −0.027 to 0.033); physical activity, 0.001 (95% CI, −0.029 to 0.032);and dietary quality −0.007 (95% CI, −0.040 to 0.026) (Table 2 and eTable 11 in the Supplement).The 95% CIs of all estimates thus allowed us to rule out a coefficient greater than 0.05 SD units per$100 000 won.
Table 1. Description of Survey Population and Respondent Samplea
Variable
No. (%)
Triss–lump sum (n = 3065) Triss-monthly (n = 570) Kombi (n = 1205)
Prize distribution,2011 US$
0, Nonwinners 0 0 964 (80.0)
<10 000 811 (26.5) 0 0
10 000-100 000 2107 (68.7) 0 0
100 000-400 000 85 (2.8) 343 (60.2) 234 (19.4)
>400 000 62 (2.0) 227 (39.8) 7 (0.6)
Participation rateb 2055 (67.0) 378 (66.3) 929 (77.1)
a Triss–lump sum was from 1994 to 2011; Triss-monthly, 1997 to 2011; and Kombi, 1998 to 2011.eTable 2 in the Supplement gives more details on theprize distribution.
b Total of 3251 responded to the mail-in survey and 111to the abbreviated phone survey.
JAMA Network Open | Public Health Association Between Lottery Prize Size and Self-reported Health Habits in Swedish Lottery Players
JAMA Network Open. 2020;3(3):e1919713. doi:10.1001/jamanetworkopen.2019.19713 (Reprinted) March 19, 2020 6/12
Downloaded From: https://jamanetwork.com/ on 02/21/2022

Heterogeneity and RobustnessWe reran our main analyses in subsamples stratified by sex, age at the time of the win (below orabove median), prelottery income (below or above median), years since the win (before or after2005), and type of winnings (Triss-monthly vs Triss–lump sum). The estimates were similar acrosssubsamples, and it is unlikely that the null results reported in the full respondent sample maskedstrong heterogeneity (eTable 13 and eFigure 4 in the Supplement). eTable 12 and eFigure 3 in theSupplement show that our 2 preregistered robustness analyses yielded results similar to those fromthe primary analysis. Contrary to what one might expect if wealth has rapidly diminishing marginaleffects, our coefficient estimates were broadly similar when we reran the analyses with large-prizewinners ($500 000 or more) omitted.
Benchmarking the Lottery EstimatesFigure 3 and eTable 15 in the Supplement show the estimated gradients in the respondent sample foreach of our 6 primary outcomes. We verified that the gradients in the respondent sample weresimilar to gradients estimated using data on Swedish respondents in the European Social Survey(eTable 14 in the Supplement). Overall, the gradients in Figure 3 replicate standard patterns in theliterature, both qualitatively and quantitatively. For example, a $10 000 increase in annual householddisposable income was associated with an increase in subjective health of approximately 0.080 SDunits (95% CI, 0.066-0.094 SD units). Higher income was also associated with less smoking, moreexercise, and better diet. In addition, we found a weak but positive association with alcohol use,which may partly reflect a higher prevalence of moderate drinking among high-income individuals.7
The previous literature has documented that heavy drinking is more common at lower incomes.11 Weverified that the gradient reversed if alcohol use was redefined as an indicator variable for individualswith a score of at least 7, the cutoff for alcohol dependence recommended in a recentvalidation study.24
To compare our lottery estimates with the income gradients, we converted each lump-sumprize to an annual income by calculating the annual payout that it would generate if it were
Figure 2. Lottery Wealth, Health Behaviors, and Overall Health
0.050
0.025
0
–0.025
–0.050
Stan
dard
ized
Lot
tery
Est
imat
e, p
er $
100K
Won
SubjectiveHealth
HealthIndex
Cigarettes Alcohol PhysicalActivity
DietaryQuality
Each bar represents the estimated associationbetween lottery wealth measured in $100 000 USD(net of taxes) and outcomes measured in SD units.Error bars denote 95% CIs. Subjective health andhealth index are coded such that higher values denotebetter health. Each of the 4 behaviors is coded suchthat higher values denote greater prevalence of thebehavior. eTable 11 in the Supplement gives underlyingdata and descriptive statistics.
Table 2. Primary Outcome Estimates
Outcome Estimate (95% CI), SD units per $100 000 wonSubjective health 0.013 (−0.017 to 0.043)
Health index −0.003 (−0.033 to 0.027)
Smoking −0.006 (−0.038 to 0.026)
Alcohol consumption 0.003 (−0.027 to 0.033)
Physical activity 0.001 (−0.029 to 0.032)
Dietary quality −0.007 (−0.040 to 0.026)
JAMA Network Open | Public Health Association Between Lottery Prize Size and Self-reported Health Habits in Swedish Lottery Players
JAMA Network Open. 2020;3(3):e1919713. doi:10.1001/jamanetworkopen.2019.19713 (Reprinted) March 19, 2020 7/12
Downloaded From: https://jamanetwork.com/ on 02/21/2022

annuitized over a 20-year period. For example, a $100 000 prize would correspond to an increase innet annual income of $5996. We then compared annuity-rescaled lottery estimates with the cross-sectional gradients described above. Figure 3 shows that, for all outcomes, the rescaled lotteryestimates were smaller in magnitude than the gradients and for 4 of our outcomes: subjective health,health index, physical activity, and dietary quality; the differences were statistically significant at the5% level.
Compared with previous survey-based studies of lottery winners’ health behaviors or overallhealth7,12,13,15 that examined at least 1 of the outcomes in our study, the 95% CIs of our estimates wereat least 8 times smaller. The main explanation for our substantially greater precision was that wepurposefully oversampled large-prize winners. To illustrate the improved precision of our estimates,we compared our results for the health index with estimates reported in 2 previous lottery studiesthat analyzed comparable outcomes. One of these studies measured the index shortly after a lotterywin, whereas the other analyzed a long-term health index defined similarly to ours.12,15 The 95% CIsin these 2 studies after rescaling to match our estimates were −0.39 to 0.35 and 0.00 to 0.50 SDunits per $100 000 won, which can be compared with the 95% CI for our health index of −0.03 to0.03. The eMethods section in the Supplement shows that the differences in precision were greaterfor other comparable outcomes and reports design calculations25 informed by our new evidence forthe association between unearned wealth from lottery winnings and subsequent health.
Discussion
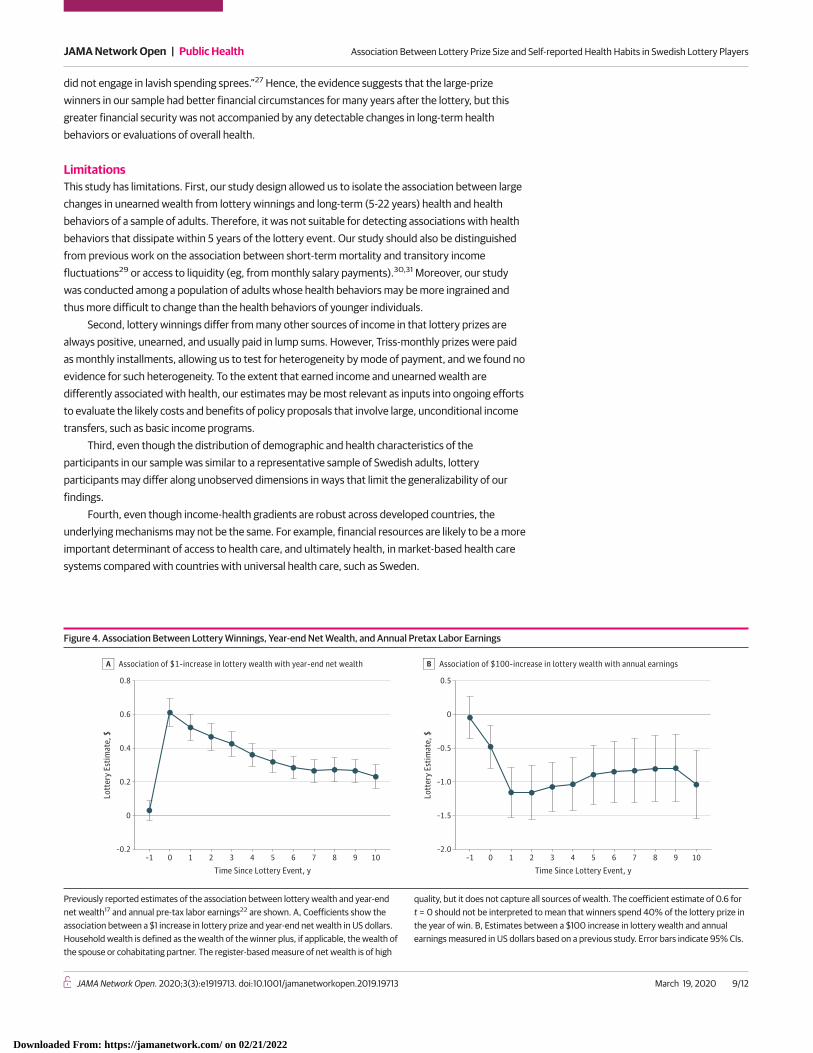
We found no statistically significant association between the magnitude of the lottery prize won andlong-term health outcomes among Swedish lottery participants. Given the discrepancy betweenlottery estimates and income gradients estimated in our sample, it is natural to ask if there issomething particular about winning the lottery that limits the generalizability of our findings. Inparticular, a common view in popular culture is that lottery winners squander their wealth.26 If thisview were correct, our null results could simply reflect most winners having fully used their winningsby the time of the survey. However, as we have discussed elsewhere,16 there is little evidence thatlottery winners often squander their winnings. Previous analyses of the administrative sample fromwhich we drew the survey population have found that winners reduced their labor supply and spenttheir lottery winnings.17,22 However, these adjustments were modest in magnitude and spread evenlyover a long time (Figure 4). In our previous related study,16 lottery winnings were associated withimprovements in financial life satisfaction over a decade after the lottery event (effect size, 0.067 SDunits per $100 000 won; 95% CI, 0.043-0.091 SD units per $100 000 won).16 Interview-basedstudies of lottery winners in multiple countries,26-28 including Sweden,28 have reached similarconclusions, with 1 study of US lottery winners concluding that “contrary to popular beliefs, winners
Figure 3. Comparison of Lottery Estimates With Household-Income Gradients
–0.10
0.20
0.15
0.10
0.05
0
–0.05
Resc
aled
Lot
tery
Est
imat
e vs
Gra
dien
t,pe
r $10
K
SubjectiveHealth
HealthIndex
Cigarettes Alcohol PhysicalActivity
DietaryQuality
Lottery estimate
Household-income gradient
P = .03P = .004
P = .13P = .43
P = .05 P = .008P = .03
P = .004
P = .13P = .43
P = .05 P = .008
Comparison between lottery estimates and householdpermanent income gradients. Permanent income wascalculated as a multiple-year mean income in the fullrespondent sample. Error bars indicate 95% CIs. The Pvalues are for the null hypothesis that the lotteryestimate equals the gradient. Underlying estimates aregiven in eTable 15 in the Supplement.
JAMA Network Open | Public Health Association Between Lottery Prize Size and Self-reported Health Habits in Swedish Lottery Players
JAMA Network Open. 2020;3(3):e1919713. doi:10.1001/jamanetworkopen.2019.19713 (Reprinted) March 19, 2020 8/12
Downloaded From: https://jamanetwork.com/ on 02/21/2022
did not engage in lavish spending sprees.”27 Hence, the evidence suggests that the large-prizewinners in our sample had better financial circumstances for many years after the lottery, but thisgreater financial security was not accompanied by any detectable changes in long-term healthbehaviors or evaluations of overall health.
LimitationsThis study has limitations. First, our study design allowed us to isolate the association between largechanges in unearned wealth from lottery winnings and long-term (5-22 years) health and healthbehaviors of a sample of adults. Therefore, it was not suitable for detecting associations with healthbehaviors that dissipate within 5 years of the lottery event. Our study should also be distinguishedfrom previous work on the association between short-term mortality and transitory incomefluctuations29 or access to liquidity (eg, from monthly salary payments).30,31 Moreover, our studywas conducted among a population of adults whose health behaviors may be more ingrained andthus more difficult to change than the health behaviors of younger individuals.
Second, lottery winnings differ from many other sources of income in that lottery prizes arealways positive, unearned, and usually paid in lump sums. However, Triss-monthly prizes were paidas monthly installments, allowing us to test for heterogeneity by mode of payment, and we found noevidence for such heterogeneity. To the extent that earned income and unearned wealth aredifferently associated with health, our estimates may be most relevant as inputs into ongoing effortsto evaluate the likely costs and benefits of policy proposals that involve large, unconditional incometransfers, such as basic income programs.
Third, even though the distribution of demographic and health characteristics of theparticipants in our sample was similar to a representative sample of Swedish adults, lotteryparticipants may differ along unobserved dimensions in ways that limit the generalizability of ourfindings.
Fourth, even though income-health gradients are robust across developed countries, theunderlying mechanisms may not be the same. For example, financial resources are likely to be a moreimportant determinant of access to health care, and ultimately health, in market-based health caresystems compared with countries with universal health care, such as Sweden.
Figure 4. Association Between Lottery Winnings, Year-end Net Wealth, and Annual Pretax Labor Earnings
–2.0
Lott
ery
Estim
ate,
$
Association of $100-increase in lottery wealth with annual earningsB
0.5
–1.5
–1.0
–0.5
0
0
–0.2
0.8
0.6
Lott
ery
Estim
ate,
$
0.4
0.2
Time Since Lottery Event, y–1 1 2 3 4 5 6 7 8 9 100
Association of $1-increase in lottery wealth with year-end net wealthA
Time Since Lottery Event, y–1 1 2 3 4 5 6 7 8 9 100
Previously reported estimates of the association between lottery wealth and year-endnet wealth17 and annual pre-tax labor earnings22 are shown. A, Coefficients show theassociation between a $1 increase in lottery prize and year-end net wealth in US dollars.Household wealth is defined as the wealth of the winner plus, if applicable, the wealth ofthe spouse or cohabitating partner. The register-based measure of net wealth is of high
quality, but it does not capture all sources of wealth. The coefficient estimate of 0.6 fort = 0 should not be interpreted to mean that winners spend 40% of the lottery prize inthe year of win. B, Estimates between a $100 increase in lottery wealth and annualearnings measured in US dollars based on a previous study. Error bars indicate 95% CIs.
JAMA Network Open | Public Health Association Between Lottery Prize Size and Self-reported Health Habits in Swedish Lottery Players
JAMA Network Open. 2020;3(3):e1919713. doi:10.1001/jamanetworkopen.2019.19713 (Reprinted) March 19, 2020 9/12
Downloaded From: https://jamanetwork.com/ on 02/21/2022
Conclusions
In this quasi-experimental cohort study, we found no association between the magnitude of the lotteryprize won and long-term health outcomes among adult Swedish lottery players. For several outcomes,the lottery estimates were significantly smaller than the corresponding income gradients estimatedfrom observational data. A plausible reason for the small lottery estimates is that lottery prizes wererandomly assigned by the lotteries, so that health status and healthy behaviors could not have affectedthe distribution of these winnings. Overall, our results are difficult to reconcile with the view that finan-cial resources are needed to maintain a healthy lifestyle in rich welfare states like Sweden.
ARTICLE INFORMATIONAccepted for Publication: November 25, 2019.
Published: March 19, 2020. doi:10.1001/jamanetworkopen.2019.19713
Open Access: This is an open access article distributed under the terms of the CC-BY License. © 2020 Östling R et al.JAMA Network Open.
Corresponding Author: Erik Lindqvist, PhD, Swedish Institute for Social Research, Stockholm University,Universitetsvägen 10F, 106 91 Stockholm, Sweden ([email protected]).
Author Affiliations: Department of Economics, Stockholm School of Economics, Stockholm, Sweden (Östling);Research Institute for Industrial Economics, Stockholm, Sweden (Östling, Cesarini, Lindqvist); Department ofEconomics, New York University, New York (Cesarini); Swedish Institute for Social Research, Stockholm University,Stockholm, Sweden (Lindqvist).
Author Contributions: Dr Östling had full access to all of the data in the study and takes responsibility for theintegrity of the data and the accuracy of the data analysis.
Concept and design: All authors.
Acquisition, analysis, or interpretation of data: All authors.
Drafting of the manuscript: All authors.
Critical revision of the manuscript for important intellectual content: All authors.
Statistical analysis: All authors.
Obtained funding: All authors.
Conflict of Interest Disclosures: All authors reported receiving grants from Swedish Research Council, theHedelius Wallander Foundation, and the Riksbankens Jubileumsfond during the conduct of the study.
Funding/Support: The study was supported by grant B0213903 from the Swedish Research Council, grant 2011:0032:1 from the Hedelius Wallander Foundation, and grant P15-0615:1 from the Riksbankens Jubileumsfond.
Role of the Funder/Sponsor: The funding organizations had no role in the design and conduct of the study;collection, management, analysis, and interpretation of the data; preparation, review, or approval of themanuscript; and decision to submit the manuscript for publication.
REFERENCES1. Deaton A. Policy implications of the gradient of health and wealth. Health Aff (Millwood). 2002;21(2):13-30. doi:10.1377/hlthaff.21.2.13
2. Fritzell J, Nermo M, Lundberg O. The impact of income: assessing the relationship between income and healthin Sweden. Scand J Public Health. 2004;32(1):6-16. doi:10.1080/14034950310003971
3. Cutler DM, Lleras-Muney A. Understanding differences in health behaviors by education. J Health Econ. 2010;29(1):1-28. doi:10.1016/j.jhealeco.2009.10.003
4. Cawley J, Ruhm CJ. The economics of risky health behaviors. In: McGuire TG, Pauly MV, Barros PP, eds.Handbook of Health Economics. Vol 2. Elsevier; 2012:95-199.
5. Contoyannis P, Jones AM. Socio-economic status, health and lifestyle. J Health Econ. 2004;23(5):965-995. doi:10.1016/j.jhealeco.2004.02.001
6. Cutler DM, Lleras-Muney A, Vogl T. Socioeconomic status and health: dimensions and mechanisms. In: Glied S,Smith PC, eds. The Oxford Handbook of Health Economics. Oxford University Press; 2011:124-163.
7. van Kippersluis H, Galama TJ. Wealth and health behavior: testing the concept of a health cost. Eur Econ Rev.2014;72:197-220. doi:10.1016/j.euroecorev.2014.10.003
JAMA Network Open | Public Health Association Between Lottery Prize Size and Self-reported Health Habits in Swedish Lottery Players
JAMA Network Open. 2020;3(3):e1919713. doi:10.1001/jamanetworkopen.2019.19713 (Reprinted) March 19, 2020 10/12
Downloaded From: https://jamanetwork.com/ on 02/21/2022
8. The Marmot Review. Fair Society, Healthy Lives: Strategic Review of Health Inequalities in England Post-2010.UCL Institute of Healthy Equity; 2010.
9. Link BG, Phelan J. Social conditions as fundamental causes of disease. J Health Soc Behav. 1995;(extraissue):80-94. doi:10.2307/2626958
10. Williams DR. Socioeconomic differentials in health: a review and redirection. Soc Psychol Q. 1990;53(2):81-99.doi:10.2307/2786672
11. Adler NE, Newman K. Socioeconomic disparities in health: pathways and policies. Health Aff (Millwood). 2002;21(2):60-76. doi:10.1377/hlthaff.21.2.60
12. Lindahl M. Estimating the effect of income on health and mortality using lottery prizes as an exogenous sourceof variation in income. J Hum Resour. 2005;40(1):144-168. doi:10.3368/jhr.XL.1.144
13. Apouey B, Clark AE. Winning big but feeling no better? the effect of lottery prizes on physical and mentalhealth. Health Econ. 2015;24(5):516-538. doi:10.1002/hec.3035
14. Cheng TC, Costa-I-Font J, Powdthavee N. Do you have to win it to fix it? a longitudinal study of lottery winnersand their health-care demand. Am J Health Econ. 2018;4(1):26-50. doi:10.1162/ajhe_a_00092
15. Raschke C. Unexpected windfalls, education, and mental health: evidence from lottery winners in Germany.Appl Econ. 2019;51(2):207-218. doi:10.1080/00036846.2018.1494813
16. Lindqvist E, Östling R, Cesarini D. Long-run effects of lottery wealth on psychological well-being.The Review ofEconomic Studies. Posted January 26, 2020. Accessed February 4, 2020. http://www.restud.com/paper/long-run-effects-of-lottery-wealth-on-psychological-well-being/
17. Cesarini D, Lindqvist E, Östling R, Wallace B. Wealth, health, and child development: evidence fromadministrative data on Swedish lottery players. Q J Econ. 2016;131(2):687-738. doi:10.1093/qje/qjw001
18. Östling R, Lindqvist E, Cesarini D. The effect of wealth on survey outcomes: analysis plan for survey datacollected from Swedish lottery players. Preprint. Posted online November 23, 2016. Open Science Framework. https://osf.io/t3qb5/
19. Bush K, Kivlahan DR, McDonell MB, Fihn SD, Bradley KA. The AUDIT alcohol consumption questions (AUDIT-C):an effective brief screening test for problem drinking. Ambulatory Care Quality Improvement Project (ACQUIP)—Alcohol Use Disorders Identification Test. Arch Intern Med. 1998;158(16):1789-1795. doi:10.1001/archinte.158.16.1789
20. Grossman M. On the concept of health capital and the demand for health. J Polit Econ. 1972;80(2):223-255.doi:10.1086/259880
21. Idler EL, Benyamini Y. Self-rated health and mortality: a review of twenty-seven community studies. J HealthSoc Behav. 1997;38(1):21-37. doi:10.2307/2955359
22. Cesarini D, Lindqvist E, Notowidigdo MJ, Östling R. The effect of wealth on individual and household laborsupply: evidence from Swedish lotteries. Am Econ Rev. 2017;107(12):3917-3946. doi:10.1257/aer.20151589
23. European Social Survey (ESS). ESS Round 7: European Social Survey Round 7 Data (2014). Data file edition 2.1.NSD—Norwegian Centre for Research Data, Norway—Data Archive and distributor of ESS data for ESS ERIC. doi:10.21338/NSD-ESS7-2014
24. Lundin A, Hallgren M, Balliu N, Forsell Y. The use of alcohol use disorders identification test (AUDIT) indetecting alcohol use disorder and risk drinking in the general population: validation of AUDIT using schedules forclinical assessment in neuropsychiatry. Alcohol Clin Exp Res. 2015;39(1):158-165. doi:10.1111/acer.12593
25. Gelman A, Carlin J. Beyond power calculations: assessing type S (sign) and type M (magnitude) errors.Perspect Psychol Sci. 2014;9(6):641-651. doi:10.1177/1745691614551642
26. Eckblad GF, von der Lippe AL. Norwegian lottery winners: cautious realists. J Gambl Stud. 1994;10(4):305-322. doi:10.1007/BF02104899
27. Kaplan HR. Lottery winners: the myth and reality. J Gambl Behav. 1987;3(3):168-178. doi:10.1007/BF01367438
28. Hedenus A. Finding prosperity as a lottery winner: presentations of self after acquisition of sudden wealth.Sociology. 2011;45(1):22-37. doi:10.1177/0038038510387197
29. Ruhm CJ. Are recessions good for your health? Q J Econ. 2000;115(2):617-650. doi:10.1162/003355300554872
30. Evans WN, Moore TJ. Liquidity, economic activity, and mortality. Rev Econ Stat. 2012;94(2):400-418. doi:10.1162/REST_a_00184
31. Dobkin C, Puller SL. The effects of government transfers on monthly cycles in drug abuse, hospitalization andmortality. J Public Econ. 2007;91(11-12):2137-2157. doi:10.1016/j.jpubeco.2007.04.007
JAMA Network Open | Public Health Association Between Lottery Prize Size and Self-reported Health Habits in Swedish Lottery Players
JAMA Network Open. 2020;3(3):e1919713. doi:10.1001/jamanetworkopen.2019.19713 (Reprinted) March 19, 2020 11/12
Downloaded From: https://jamanetwork.com/ on 02/21/2022
SUPPLEMENT.eMethods. Survey Design, Representativeness, Primary Outcomes, Statistical Inference, Survey Nonresponse andTests of Endogenous Attrition, Robustness Analyses, Benchmarking Lottery Estimates.eReferences.eTable 1. Selecting Sample of Survey RespondentseTable 2. Distribution of Prizes AwardedeTable 3. Administrative Variables and Baseline ControlseTable 4. Representativeness of Survey RespondentseTable 5. Prevalence in Respondents Sample vs Swedish Level of Living SurveyeTable 6. Health and Habits in Respondents Sample vs Representative SurveyeTable 7. Summary Overview of Primary OutcomeseTable 8. Testing Endogenous Selection into the Respondent SampleeTable 9. Testing for Conditional Random Assignment of Lottery PrizeseTable 10. Lottery Estimates in Survey Population and Respondent SampleeTable 11. Subjective Health and Health Behaviors (Primary Outcomes)eTable 12. Robustness AnalyseseTable 13. Heterogeneity AnalyseseTable 14. Gradients in Respondents Sample and European Social SurveyeTable 15. Comparison to Permanent Income GradientseFigure 1. Schematic Overview of Timeline for Collection of Survey DataeFigure 2. Illustration of Identification Strategy in Kombi SampleeFigure 3. Results from Pre-registered Robustness AnalyseseFigure 4. Results from Pre-registered Heterogeneity Analyses
JAMA Network Open | Public Health Association Between Lottery Prize Size and Self-reported Health Habits in Swedish Lottery Players
JAMA Network Open. 2020;3(3):e1919713. doi:10.1001/jamanetworkopen.2019.19713 (Reprinted) March 19, 2020 12/12
Downloaded From: https://jamanetwork.com/ on 02/21/2022