assignment tooth
DESCRIPTION
Use of statistical inference.TRANSCRIPT

Tooth Growth Data Analysis.Mario Zamora Aleman.25 de octubre de 2015
Overview.
Now in the second portion of the class assignment , we’re going to analyze the ToothGrowth data in the Rdatasets package:
1. Loading the ToothGrowth data and perform some basic exploratory data analyses2. Providing a basic summary of the data.3. Using confidence intervals and/or hypothesis tests to compare tooth growth by supp and dose. (Only
use the techniques from class, even if there’s other approaches worth considering)4. Stating the conclusions and the assumptions needed for the conclusions.
1. Loading the ToothGrowth data and perform some basic ex-ploratory data analyses
1.1 loading data.
The below code loads the ToothGrowth data in the ´R´ datasets package.
library(datasets)data("ToothGrowth")
1.2 Perform some basic exploratory data analyses.
The ToothGrowth format is: A data frame with 60 observations on 3 variables.
## 'data.frame': 60 obs. of 3 variables:## $ len : num 4.2 11.5 7.3 5.8 6.4 10 11.2 11.2 5.2 7 ...## $ supp: Factor w/ 2 levels "OJ","VC": 2 2 2 2 2 2 2 2 2 2 ...## $ dose: num 0.5 0.5 0.5 0.5 0.5 0.5 0.5 0.5 0.5 0.5 ...
There are two factors for suplement: “OJ” and “VC”, but it is not possible to determine how many values forthe dosage, so let us find out.
## dose## supp 0.5 1 2## OJ 10 10 10## VC 10 10 10
As we can see there are 10 values for each dosage in each group(Oj, VC).
I.e, the response is the length of odontoblasts (teeth) in each of 10 guinea pigs at each of three dose levels ofVitamin C (0.5, 1, and 2 mg) with each of two delivery methods (orange juice or ascorbic acid).
1

2. Provide a basic summary of the data.
2.1 Visual Summary
summary(ToothGrowth)
## len supp dose## Min. : 4.20 OJ:30 0.5:20## 1st Qu.:13.07 VC:30 1 :20## Median :19.25 2 :20## Mean :18.81## 3rd Qu.:25.27## Max. :33.90
We will use a boxplot to show the relation between tooth length and Vitamin C.
OJ VC
10
20
30
0.5 1 2 0.5 1 2Dose(mg)
Leng
th
Dose
0.5
1
2
Analyzing ToothGrowth data
This shows that longer teeth tend to use a higher dose.
Now let us check what might be the relation between delivery methods at each dose level in a boxplot.
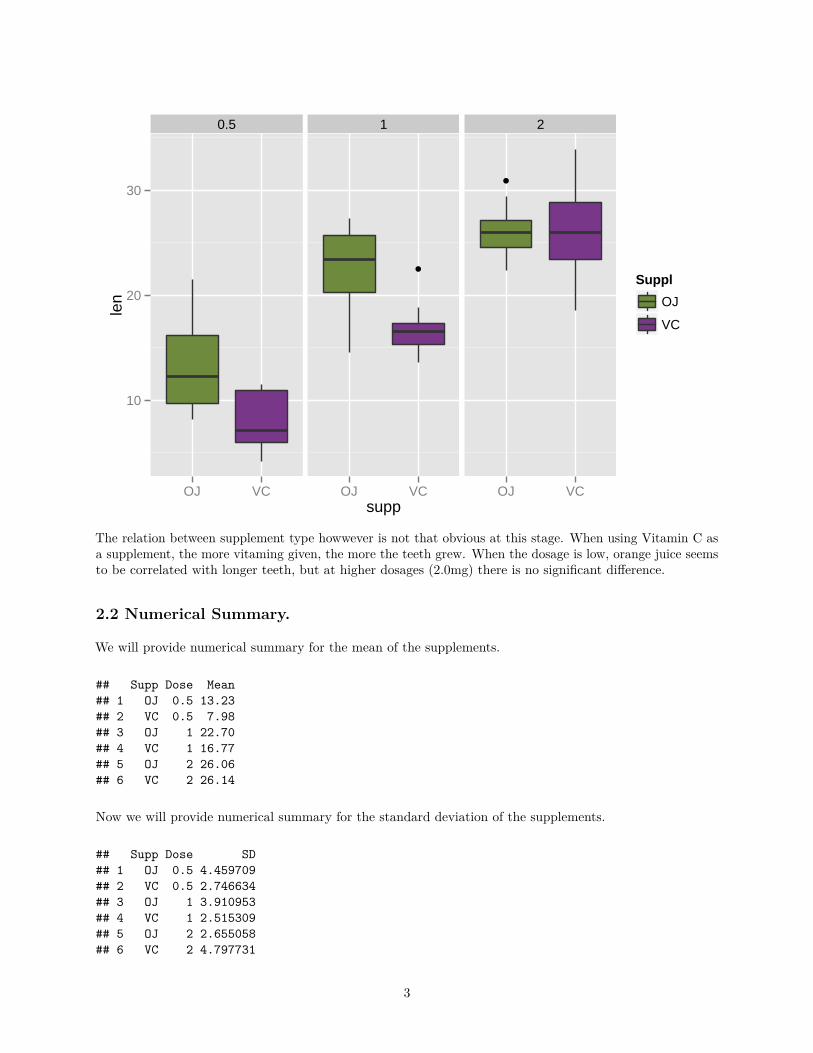
ggplot(aes(x = supp, y = len), data = ToothGrowth) +geom_boxplot(aes(fill = supp)) + facet_grid(.~ dose)+scale_fill_manual("Suppl",values=c("darkolivegreen4","mediumorchid4"))
2
0.5 1 2
10
20
30
OJ VC OJ VC OJ VCsupp
len
Suppl
OJ
VC
The relation between supplement type howwever is not that obvious at this stage. When using Vitamin C asa supplement, the more vitaming given, the more the teeth grew. When the dosage is low, orange juice seemsto be correlated with longer teeth, but at higher dosages (2.0mg) there is no significant difference.
2.2 Numerical Summary.
We will provide numerical summary for the mean of the supplements.
## Supp Dose Mean## 1 OJ 0.5 13.23## 2 VC 0.5 7.98## 3 OJ 1 22.70## 4 VC 1 16.77## 5 OJ 2 26.06## 6 VC 2 26.14
Now we will provide numerical summary for the standard deviation of the supplements.
## Supp Dose SD## 1 OJ 0.5 4.459709## 2 VC 0.5 2.746634## 3 OJ 1 3.910953## 4 VC 1 2.515309## 5 OJ 2 2.655058## 6 VC 2 4.797731
3
As we can see there is less variability in the dosage 0.5 and 1 in Vitamin C supplement though there is morevariability in the 2 dosage Vitamin C supplement. Although in the Orange Juice the variability is decreasingas long as increasing dosage.
3. Confidence Intervals and Hypothesis Testing to compare toothgrowth by supp and dose.
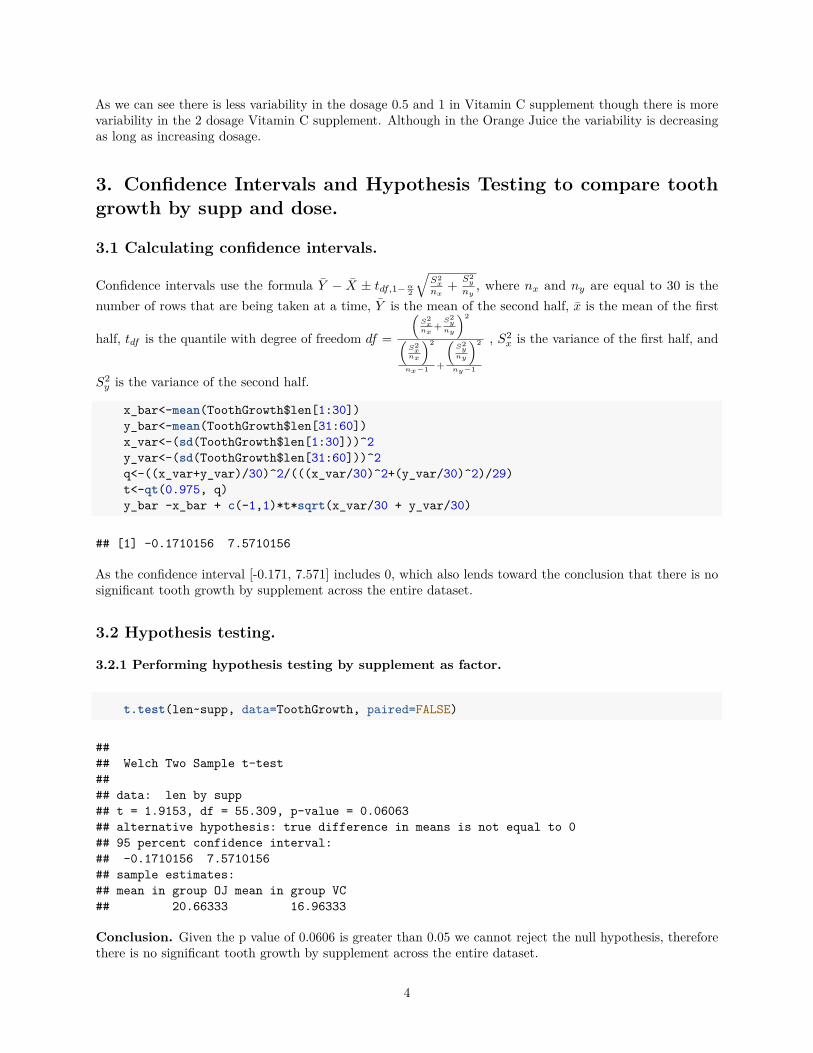
3.1 Calculating confidence intervals.
Confidence intervals use the formula Y − X ± tdf,1−α2
√S2x
nx+ S2
y
ny, where nx and ny are equal to 30 is the
number of rows that are being taken at a time, Y is the mean of the second half, x is the mean of the first
half, tdf is the quantile with degree of freedom df =
(S2xnx
+S2yny
)2(S2xnx
)2
nx−1 +
(S2yny
)2
ny−1
, S2x is the variance of the first half, and
S2y is the variance of the second half.
x_bar<-mean(ToothGrowth$len[1:30])y_bar<-mean(ToothGrowth$len[31:60])x_var<-(sd(ToothGrowth$len[1:30]))^2y_var<-(sd(ToothGrowth$len[31:60]))^2q<-((x_var+y_var)/30)^2/(((x_var/30)^2+(y_var/30)^2)/29)t<-qt(0.975, q)y_bar -x_bar + c(-1,1)*t*sqrt(x_var/30 + y_var/30)
## [1] -0.1710156 7.5710156
As the confidence interval [-0.171, 7.571] includes 0, which also lends toward the conclusion that there is nosignificant tooth growth by supplement across the entire dataset.
3.2 Hypothesis testing.
3.2.1 Performing hypothesis testing by supplement as factor.
t.test(len~supp, data=ToothGrowth, paired=FALSE)
#### Welch Two Sample t-test#### data: len by supp## t = 1.9153, df = 55.309, p-value = 0.06063## alternative hypothesis: true difference in means is not equal to 0## 95 percent confidence interval:## -0.1710156 7.5710156## sample estimates:## mean in group OJ mean in group VC## 20.66333 16.96333
Conclusion. Given the p value of 0.0606 is greater than 0.05 we cannot reject the null hypothesis, thereforethere is no significant tooth growth by supplement across the entire dataset.
4
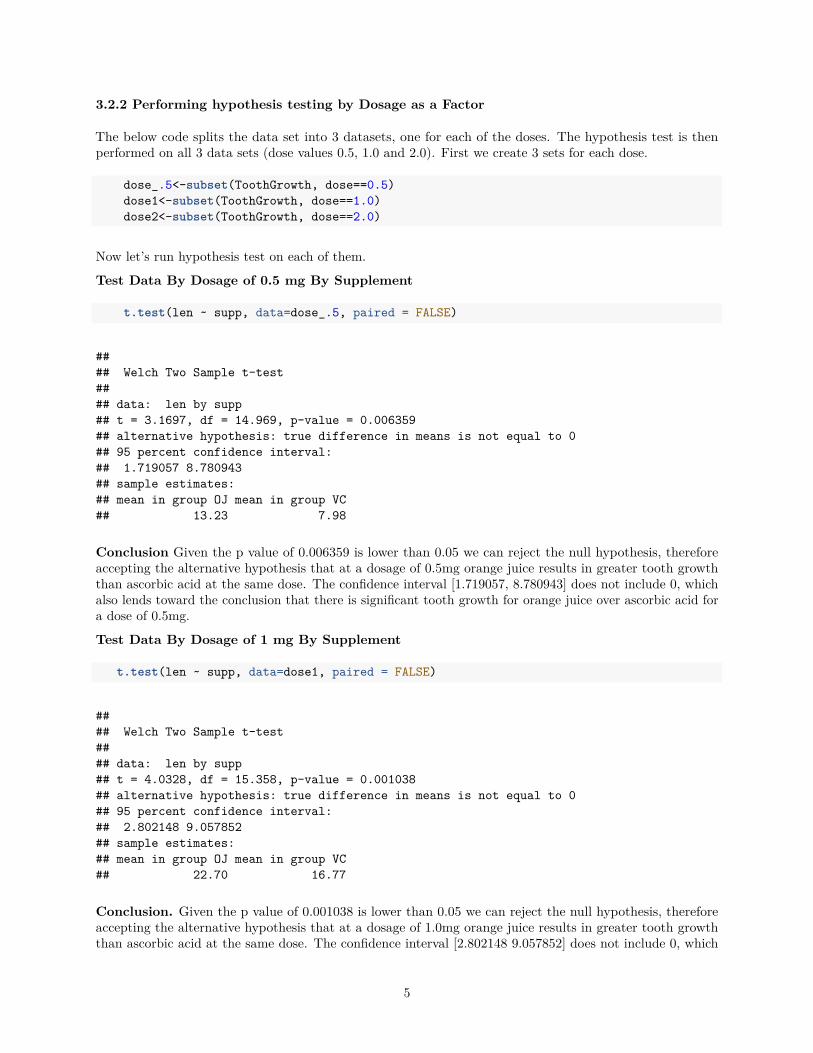
3.2.2 Performing hypothesis testing by Dosage as a Factor
The below code splits the data set into 3 datasets, one for each of the doses. The hypothesis test is thenperformed on all 3 data sets (dose values 0.5, 1.0 and 2.0). First we create 3 sets for each dose.
dose_.5<-subset(ToothGrowth, dose==0.5)dose1<-subset(ToothGrowth, dose==1.0)dose2<-subset(ToothGrowth, dose==2.0)
Now let’s run hypothesis test on each of them.
Test Data By Dosage of 0.5 mg By Supplement
t.test(len ~ supp, data=dose_.5, paired = FALSE)
#### Welch Two Sample t-test#### data: len by supp## t = 3.1697, df = 14.969, p-value = 0.006359## alternative hypothesis: true difference in means is not equal to 0## 95 percent confidence interval:## 1.719057 8.780943## sample estimates:## mean in group OJ mean in group VC## 13.23 7.98
Conclusion Given the p value of 0.006359 is lower than 0.05 we can reject the null hypothesis, thereforeaccepting the alternative hypothesis that at a dosage of 0.5mg orange juice results in greater tooth growththan ascorbic acid at the same dose. The confidence interval [1.719057, 8.780943] does not include 0, whichalso lends toward the conclusion that there is significant tooth growth for orange juice over ascorbic acid fora dose of 0.5mg.
Test Data By Dosage of 1 mg By Supplement
t.test(len ~ supp, data=dose1, paired = FALSE)
#### Welch Two Sample t-test#### data: len by supp## t = 4.0328, df = 15.358, p-value = 0.001038## alternative hypothesis: true difference in means is not equal to 0## 95 percent confidence interval:## 2.802148 9.057852## sample estimates:## mean in group OJ mean in group VC## 22.70 16.77
Conclusion. Given the p value of 0.001038 is lower than 0.05 we can reject the null hypothesis, thereforeaccepting the alternative hypothesis that at a dosage of 1.0mg orange juice results in greater tooth growththan ascorbic acid at the same dose. The confidence interval [2.802148 9.057852] does not include 0, which
5

also lends toward the conclusion that there is significant tooth growth for orange juice over ascorbic acid fora dose of 1.0mg.
Test Data By Dosage of 2 mg By Supplement
t.test(len ~ supp, data=dose2, paired = FALSE)
#### Welch Two Sample t-test#### data: len by supp## t = -0.046136, df = 14.04, p-value = 0.9639## alternative hypothesis: true difference in means is not equal to 0## 95 percent confidence interval:## -3.79807 3.63807## sample estimates:## mean in group OJ mean in group VC## 26.06 26.14
Conclusion. Given the p value of 0.9639 is greater than 0.05 we cannot reject the null hypothesis, thereforethere is no significant tooth growth by supplement for dosages of 2.0mg. The confidence interval [-3.79807,3.63807] includes 0, which also lends toward the conclusion that there is no significant tooth growth bysupplement for dosages of 2.0mg.
4. State your conclusions and the assumptions needed for your conclusions.
4.1 Hypothesis.
1. Null hypothesis #1: there is no difference on tooth length across OJ and VC.
2. Null hypothesis #2: there is no difference on tooth length with dose change.
4.2 Conclusion.
Conclusion null hypothesis #1. The true mean has a probability of 95% of being in the interval between-0.17 and 7.57. T-value is 1.91, p-value is 0.06, confidence interval contains zero so we fail to reject the nullhypothesis #1. In other words, there is no effect from VC or OJ treatment itself.
Conclusion null hypothesis #2. Making conclusion about different doses we can say that for dose 0.5and 1.0 there is a significant difference in means of VC and OJ groups is large. So we reject null hypothesis#2. With dose 2.0 it didn’t happen, mean difference is very low. We fail to reject null hypothesis #2.
4.3 Assumptions.
1. We are assuming that the original random variable is normally distributed, and the samples areindependent.
2. For the populations to be independent, 60 guinea pigs would have to be used so each combination ofdose level and delivery method were not affected by the other methods.
6