asset management plan plan de gestion de nos immobilisations hall... · plan de gestion de nos...
TRANSCRIPT
ASSET MANAGEMENT PLAN
PLAN DE GESTION DE NOS IMMOBILISATIONS
SUBJECT SUJET
Presentation of the asset management plan Présentation du plan de gestion de nos immobilisations
RECOMMENDATION RECOMMANDATION
That Council acknowledges receipt of the Asset Management Plan and that it be further discussed at our December 16
th meeting so to have it finalized and
in place before December 31st, 2013 deadline.
Que le conseil accuse réception du plan de gestion de nos immobilisations et de plus, que d’autres discussions et détails suivront le 16 décembre dans le but de finaliser et mettre le tout en place d’içi le 31 décembre 2013.
FINANCIAL IMPLICATION IMPLICATIONS FINANCIÈRES
The asset management plan does refer to funding requirements so to have the Municipality fully sustainable on its own within the next 10 years. We understand that over time provincial and federal grants should be expected and will certainly play a key role in assisting us to our full sustainability. A corporate financial strategy is still to be developed but it shall only be possible upon having the database of all corporate assets incorporated into the software. Currently, only two departments (Public Works and Public utilities) have been fully included in the database as per the province’s requirements and guide. At this time, no formal financing plan is to be submitted for Council’s approval.
Le plan de gestion d’immobilisation fait référence à nos besoins financiers afin de rendre notre municipalité financièrement durable au cours des 10 prochaines années. Nous comprenons que nous recevrons possiblement des fonds de la province et du fédéral et que ceux-ci auront un impact important pour nous assister à atteindre notre pleine durabilité. Une stratégie financière corporative doit être développée, par contre celle-ci peut être fait seulement après l’inclusion de toutes nos immobilisations dans la base de données du programme informatique. Présentement, seulement deux départements sont inclus (département des utilités et département des travaux publics) dans la base de données et ce tel que requis par la province. A ce point ci, aucun plan financier n’est soumis pour approbation du conseil.
BUSINESS PLAN PLAN D’AFFAIRES
This item is identified as T2 2013-17 in the 2013 Business Plan. STRATEGIC PLAN This recommendation is in support of Strategic Pillar #1 Develop and Renew Infrastructure and more specific to section
Cet item est identifié comme T2 2013-17 dans le plan d’affaires 2013 PLAN STRATEGIQUE Cette recommandation vient en appui au Pilier stratégique #1 et plus spécifiquement à Développer et renouveler l’infrastructure.
COMMUNICATION PLAN PLAN DE COMMUNICATION
REPORT TO COUNCIL: RAPPORT AU CONSEIL: FS-36-2013 DATE: 12/02/2013
REPORT- FS 36-2013 asset management plan Page 2 of 5 12/4/2013
N / A S / O
December 2 décembre 2013
SUBMITTED BY | SOUMIS PAR:
Claudette Landry Executive Director of Administrative Services/Treasurer Directeur exécutif des services administratifs/ Trésorière
Date
APPROVAL(S) | APPROBATION(S):
Jean Leduc Date Chief Administrative Officer Directeur général
December 2 décembre 2013
Date
PROJECT DESCRIPTION DU PROJET
HISTORY, REFERENCE AND SUPPORT INFORMATION HISTORIQUE, RÉFÉRENCES ET INFORMATION DE SUPPORT
The municipalities in Ontario had to meet PSAB requirements by including assets in their 2009 Financial Statements. This first exercise was to inventory all of the municipal assets in different categories with the main purpose of putting a value and calculating amortization. In 2012, the Province requested municipalities to put in place by of December 31
st, 2013 an Asset Management
Plan (AMP) that is to meet all the requirements as outlined in the provincial “Building Together Guide for Municipal Asset Management Plans”. The purpose of an AMP will be to serve as a strategic, tactical and financial document, ensuring the management of the municipal infrastructure follows sound asset management practices and principles, while optimizing available resources and establishing desired levels or services. Furthermore, the Province shall refer to our AMP when deciding future grant allocations and it has made it known that municipalities seeking grants must have completed their AMP as per the guide.
Over the coming years, the Township of Russell has to
take some important steps toward ensuring that funding will
be available to meet new and replacement infrastructure
En 2009, toutes les municipalités en Ontario ont dû se conformer à la règlementation de PSAB dans le but d’inclure nos immobilisations dans nos états financiers. Ce premier exercice consistait d’inclure nos immobilisations par catégories dans le but d’inclure une valeur et de calculer l’amortissement. En 2012, la province a demandé aux municipalités de préparer un plan de gestion d’immobilisations (PGI) par le 31 décembre 2013 qui doit rencontrer toutes les exigences tel que décrits au guide provincial : « Construire ensemble : Guide relatif à l’élaboration des plans de gestion des infrastructures municipales ». Le but du PGI sera d’établir les stratégies, les tactiques et des documents financiers permets de bien gérer les infrastructures municipales en optimisant les pratiques exemplaires et les principes des infrastructures en maximisant les ressources financières disponibles afin d’en établir les niveaux de services voulus. De plus, la province se réfèrera à ce PGI lors des décisions d’octrois futurs et il est déjà connu que les municipalités désirant obtenir ces octrois devront avoir terminé leur PGI selon le guide. Dans les années à venir, le canton de Russell devra entreprendre des démarches importantes pour s’assurer que les financements disponibles pour rencontrer les nouvelles dépenses pour infrastructures

REPORT- FS 36-2013 asset management plan Page 3 of 5 12/4/2013
requirements. Life cycle information of current assets will
enable the development of financial strategies and policies
and establish appropriate levels of dedicated reserve funds
based on quantified needs. This will ensure the financial
resources are available to fund the hard infrastructure
needs without devaluing the importance or financial
requirements of the other priority areas. In order to prepare this AMP, staff has had to: 1. Revise, modify and add to the PSAB database 2. Evaluate assets conditions based on rules and regulations. 3. Review and adopt standards for the Township assets that address quality, utilization and sustainability. 4. Tagged every asset we own and added onto the U.C.P.R. GIS system for easy visual access and viewing. This Asset Management Plan is: 1. An important tool in informing Council, the public, and department heads of the infrastructure priorities over the coming years. 2. An important tool for the Province to better understand our current financial infrastructure needs and shortfalls. 3. An important tool for Council to be able to measure year after year on how we are progressing towards financial sustainability of the maintenance and replacement of our assets. 4. An important tool for taxpayers to better understand where their tax dollars are being invested. 5. An important tool in prioritizing infrastructure projects therefore helping in the budget deliberations process. You will find in appendix D our asset management plan prepared by our consultants, Public Sector Digest. Our consultants are currently working with over 85 municipalities through its City Wide Software to prepare and produce such AMP. This AMP provides us with a wide range of information and you may find key information highlighted in the respective section. A further report to council will be presented on December 16
th with further explanation of the following
ou le remplacement de celle-ci. L’information sur la durée de vie des infrastructures existantes nous permettra de développer des politiques et des stratégies financières visant à établir les niveaux voulus des réserves dédiées aux projets selon les besoins identifiés. Cette méthode permettra d’assurer que le financement est disponible pour les projets d’infrastructures lourdes sans dévalué l’importance ou le besoin financier requis dans les autres domaines prioritaires. Pour préparer le PGI, le personnel a dû : 1. Réviser, modifier et ajouter à la base de données
de PSAB. 2. Évaluer les conditions des actifs selon des
règlements précis. 3. Réviser et adopter des standards pour le canton
de Russell dans le but d’adresser la qualité, l’utilisation et la viabilité
4. Étiqueter chaque actif que nous appartenons et lier les données au système de GIS pour permettre un accès visuel plus efficace.
Ce plan de gestion d’immobilisation est :
1. Un outil comportant pour informer le conseil, le public et les chefs de départements concernant les priorités dans les années futures.
2. Un outil important pour la province de mieux comprendre notre situation financière présente et de nos besoins
3. Un outil important pour le conseil de mesurer
année après année le progrès de la viabilité financière avec la maintenance et le remplacement de nos immobilisations.
4. Un outil important pour le payeur de taxes afin de mieux comprendre la valeur de chaque dollar investi.
5. Un outil important pour établir l’ordre des priorités des projets d’infrastructures aidant lors des discussions du budgétaires.
Vous trouverez dans l’appendice D, notre plan de gestion d’immobilisation préparé par notre firme de consultants, Public Sector Digest. Nos consultants travaillent présentement avec 85 municipalités qui ont le programme informatique City Wide à préparer leur PGI. Ce PGI nous fournit une grande variété d’informations que vous pourrez trouver dans les sections en question. Un rapport supplémentaire sera présenté au conseil le 16 décembre prochain qui inclura plus d’informations sur :
REPORT- FS 36-2013 asset management plan Page 4 of 5 12/4/2013
information: 1. Report car. What does it mean? 2. Risk Matrix and scoring methodology. What does it mean? 3. What infrastructure do we have that falls into the critical area? And why makes these infrastructure critical? Lessons learned: 1. The value of our assets has increased dramatically from the PSAB value as of more detailing of costs and review of list of assets. This information will be reflected in the 2013 Financial Statements. 2. Very often the maintenance of our assets was not properly documented. This has a direct impact to the life cycle of every asset involved. The Asset Management Team has already started providing training sessions in order to educate and sensitise staff as to the importance of documenting this maintenance information. 3. In the 2015 Budget, we will be transferring maintenance cost of assets (also known as betterment) from the operational budget to the infrastructure budget as these expenses play an important part in prolonging the life cycle of an asset. 4. The Asset Management Team will work closely with all the different departments to enhance and invest more money in preventive maintenance. The next phase in 2014: 1. Complete the list of services delivered by our Township. 2. Evaluate the level of services delivered and at what cost. 3. Determine the information needed to conduct long-range financial forecasts and incorporate what is the acceptable level of risk. 4. Identify and evaluate Best Practices and implement new Best Practices and/or modify and improve current practices. 5. Revise, modify and add to the PSAB database of all other departments not done in the 2013 AMP. 6. The Asset Management Team and the Treasurer will
1. Bulletin. Qu’est ce ça veut dire? 2. Matrice de risque et méthode de pointage.
Qu’est ce ça veut dire? 3. Quelle infrastructure fait partie de la section
critique? Et qu’est-ce qui rend une infrastructure critique?
Leçons apprises : 1. La valeur de nos immobilisations a été augmentée de façon considérable de la valeur de PSAB suite à la révision détaillée des coûts. Cette information sera incluse dans les états financiers 2013. 2. Très souvent, la maintenance de nos immobilisations n’était pas bien documentée. Ceci a un gros impact sur la durée de vie de nos immobilisations. L’équipe de gestion d’immobilisation a déjà commencé à offrir de la formation au personnel dans le but d’éduquer et sensibiliser les employés à l’importance de documenter cette information. 3. En 2015, une partie des argents investis en maintenance (amélioration) sera transférée du budget opérationnel au budget d’infrastructure car ces dépenses jouent un rôle très important dans le prolongement de la durée de vie de nos immobilisations. 4. L’équipe de gestion d’immobilisation travaillera de près avec tous les départements dans le but d’augmenter les argents investis dans l’entretien préventive de nos immobilisations. La prochaine phase 2014 :
1. Liste complète des services livrés par la municipalité.
2. Évaluer le niveau des services livrés et à quel coût.
3. Déterminer quelle information est nécessaire pour préparer nos prévisions financières et inclure le niveau de risque acceptable. Par conséquence, une stratégie financière sera développée et présentée au conseil pour approbation.
4. Identifier et évaluer nos méthodes de travail et implémenter nouvelles méthodes de travail et/ou modifier nos méthodes de travail.
5. Réviser, modifier et ajouter à notre base de données PSAB pour inclure les autres départements non fait en 2013.
6. L’équipe de gestion d’immobilisation ainsi que

REPORT- FS 36-2013 asset management plan Page 5 of 5 12/4/2013
work closely with the department heads to make the link between asset management and Master Plans that are to be updated in 2014.
le trésorier travaillera de près avec tous les chefs de départements dans le but de faire le lien avec la mise à jour de notre ‘Plan directeur’ en 2014.
OTHER OPTION(S) TO THE RECOMMENDATION
AUTRES OPTION(S) À LA RECOMMANDATION
N/A S/O
ATTACHMENT(S) PIÈCE(S) JOINTE(S)
Schedule ‘A’ History of taxation contribution towards infrastructure Schedule ‘B’ History of investments into infrastructure Schedule ‘C’ History of funds in reserve and reserve funds Schedule “D” Asset Management Plan
Annexe ‘A’ Historique de la portion de taxation envers projets d’infrastructure Annexe ‘B’ Historique de nos investissements envers nos d’infrastructures Annexe ‘C’ Historique des argents dans les réserves et fonds réserves. Annexe ‘D’ Plan de gestion de nos immobilisations

1
$0
$2,000,000
$4,000,000
$6,000,000
$8,000,000
$10,000,000
$12,000,000
$14,000,000
$16,000,000
$18,000,000
$20,000,000
2006 2007 2008 2009 2010 2011 2012 2013 Budget 2014 Budget
Investissements annuels en infrastructure / Annual Infrastructures investments
$
Valeur annuelle /Yearly value

Historique –Fond infrastructure History - Infrastructure Funds
Réel / Actual
2
$3
68
,68
0
$2
57
,52
5 $
42
8,8
93
$3
20
,58
4
$9
62
,03
5
$1
,00
8,5
00
$1
,02
1,0
00
$1
,14
8,8
08
$1
,18
6,6
08
$1
39
,16
4
$3
5,6
70
$1
23
,38
5
$1
5,8
52
$2
9,5
62
$1
,32
0 $
13
9,2
66
$1
20
,00
0
$1
30
,00
0
$-
$200,000
$400,000
$600,000
$800,000
$1,000,000
$1,200,000
$1,400,000
2006 2007 2008 2009 2010 2011 2012 2013 proposé/ Proposed
2014 Final
TaxationInfrastructureFunds - General
TaxationInfrastructureFunds - Eau etégout / Water &Sewer

3
$1,008,628
$1,413,006
$800,000 $800,000 $800,000
$-
$-
$74,749 $74,749 $74,749
$1,562,204
$-
$- $- $-
$90,000
$180,979
$669,719 $844,719
$645,144
$-
$500,000
$1,000,000
$1,500,000
$2,000,000
$2,500,000
$3,000,000
$3,500,000
2010 2011 2012 2013 2014
Réserve Eau / Water Reserves
Asset replacement Remplacment desimmobilisationscorporellesWater Treatment PlantExpansion
Water reservoir
Accumulated surpluses
Working Fund / FondRoulement

4
$497,994
$781,843
$250,000 $250,000 $250,000
$-
$-
$36,713 $36,713 $36,713
$80,000
$180,887
$801,117 $858,899
$964,437
$-
$107,407
$108,481
$108,481
$108,481
$-
$200,000
$400,000
$600,000
$800,000
$1,000,000
$1,200,000
$1,400,000
$1,600,000
2010 2011 2012 2013 2014
Réserves Égout / Sewer Reserves
Embrun Sewer (# 70-05)
Asset replacement Remplacement des immobilisationscorporellesAccumulated surpluses
Working Fund / Fond Roulement

5
$4,228,540
$1,781,847 $2,151,554
$4,861,110
($1,703,952)
($3,000,000)
($2,000,000)
($1,000,000)
$0
$1,000,000
$2,000,000
$3,000,000
$4,000,000
$5,000,000
$6,000,000
2010 2011 2012 2013 2014
Réserve de frais de développement / Development Charge reserves
Réserve de frais dedéveloppement /Development Chargereserves

6
$1,242,270
$1,527,182 $1,398,793 $1,398,793 $1,398,793
$727,173
$741,095 $953,793
$1,193,328
$944,392
$587,588 $193,045
$456,329
$621,329
$406,734
$0
$500,000
$1,000,000
$1,500,000
$2,000,000
$2,500,000
$3,000,000
$3,500,000
2010 2011 2012 2013 2014
Réserves générales / General reserves
Autres / Other
Asset replacementreserves
Working Fund / Fondde roulement

THE ASSET MANAGEMENT PLAN FOR THE TOWNSHIP OF RUSSELL
2013
THE TOWNSHIP OF RUSSELL
717 NOTRE-DAME ST
EMBRUN, ONTARIO,K0A 1W1
SUBMITTED NOVEMBER 2013
BY PUBLIC SECTOR DIGEST
250 YORK STREET, SUITE 310
LONDON, ONTARIO, N6A 6K2

Annual Funding Available
Annual Funding Deficit
State of the Infrastructure The Township of Russell
AVERAGE ANNUAL FUNDING REQUIRED vs. AVERAGE ANNUAL FUNDING AVAILABLE
$657,000
$35,000
$267,000
$105,000
$334,000
-$780,000
-$491,000
-$1,617,000
-$342,000-$281,000
ROAD NETWORK WATER NETWORK SANITARY NETWORK STORM NETWORKBRIDGES & CULVERTS
Total Annual Deficit: $3,511,000

PUBLIC SECTOR DIGEST
250 York Street, Suite 310
London, Ontario, Canada
N6A 6K2
T: 519.690.2565 F: 519.649.2010
www.publicsectordigest.com
www.citywidesolutions.com
November 2013
The Township of Russell
717 Notre-Dame St
Embrun, Ontario,K0A 1W1
Attention: Claudette Landry, Director of Finance
We are pleased to submit the 2013 Asset Management Plan (AMP) for the Township of Russell. This AMP complies with the
requirements as outlined within the provincial Building Together Guide for Municipal Asset Management Plans. It will
serve as a strategic, tactical, and financial document, ensuring the management of the municipal infrastructure follows
sound asset management practices and principles, while optimizing available resources and establishing desired levels
of service. Given the broad and profound impact of asset management on the community, and the financial &
administrative complexity involved in this ongoing process, we recommend that senior decision-makers from across the
organization are actively involved in its implementation.
The performance of a community’s infrastructure provides the foundation for its economic development,
competitiveness, prosperity, reputation, and the overall quality of life for its residents. As such, we are appreciative of
your decision to entrust us with the strategic direction of its infrastructure and asset management planning, and are
confident that this AMP will serve as a valuable tool.
Sincerely,
The Public Sector Digest Inc.
Matthew Dawe Israr Ahmad
Vice President Managing Editor
[email protected] [email protected]
INTELLIGENCE FOR THE PUBLIC SECTOR.

PUBLIC SECTOR DIGEST
Contacts
Matthew Dawe
Vice President
Israr Ahmad
Managing Editor
Christine Beneteau
Data Analyst
Chad Gale
Data Analyst
Jona Mema
Data Analyst
Salman Zafar
Data Analyst
Tyler Sutton
Senior Research Analyst
Matthew Van Dommelen
Regional Director
Gabe Metron
Regional Director
Holly Jennings
Account Manager
LEGAL NOTICE
This report has been prepared by The Public Sector Digest Inc. (“PSD”) in accordance with instructions received from the
Township of Russell (the “Client”) and for the sole use of the Client. The content of (and recommendations) this report
reflects the best judgement of PSD personnel based on the information made available to PSD by the Client.
Unauthorized use of this report for any other purpose, or by any third party, without the express written consent of PSD,
shall be at such third party’s sole risk without liability to PSD.
This report is protected by copyright.
INTELLIGENCE FOR THE PUBLIC SECTOR.

1
T H E A S S E T M A N AG E M E N T P L A N F O R T H E T OW N S H I P O F R U S S E L L
Table of Contents
1.0 Executive Summary ............................................................................................................................................... 4
2.0 Introduction ............................................................................................................................................................ 7
2.1 Importance of Infrastructure ....................................................................................................................................................... 7
2.2 Asset Management Plan (AMP) - Relationship to Strategic Plan .......................................................................................... 8
2.3 AMP - Relationship to other Plans ............................................................................................................................................... 8
2.4 Purpose and Methodology ......................................................................................................................................................... 9
2.5 CityWide Software alignment with AMP.................................................................................................................................. 11
3.0 State of the Infrastructure (SOTI) ......................................................................................................................... 12
3.1 Objective and Scope ................................................................................................................................................................. 12
3.2 Approach ..................................................................................................................................................................................... 12
3.2.1 Base Data ...................................................................................................................................................................................................... 12
3.2.2 Asset Deterioration Review ......................................................................................................................................................................... 12
3.2.3 Identify Sustainable Investment Requirements ......................................................................................................................................... 13
3.2.4 Asset Rating Criteria ..................................................................................................................................................................................... 13
3.2.5 Infrastructure Report Card........................................................................................................................................................................... 13
3.2.6 General Methodology and Reporting Approach ................................................................................................................................... 14
3.3 Road Network .............................................................................................................................................................................. 15
3.3.1 What do we own? ........................................................................................................................................................................................ 16
3.3.2 What is it worth? ............................................................................................................................................................................................ 16
3.3.3 What condition is it in? ................................................................................................................................................................................. 17
3.3.4 What do we need to do to it? .................................................................................................................................................................... 18
3.3.5 When do we need to do it? ........................................................................................................................................................................ 18
3.3.6 How much money do we need? ............................................................................................................................................................... 19
3.3.7 How do we reach sustainability? ............................................................................................................................................................... 19
3.3.8 Recommendations ....................................................................................................................................................................................... 20
3.4 Gravel Roads – Maintenance Requirements ......................................................................................................................... 21
3.4.1 Introduction ................................................................................................................................................................................................... 21
3.4.2 Maintaining a Good Cross Section ............................................................................................................................................................ 21
3.4.3 Grading Operations ..................................................................................................................................................................................... 22
3.4.4 Good Surface Gravel ................................................................................................................................................................................... 22
3.4.5 Dust Abatement and stabilization .............................................................................................................................................................. 22
3.4.6 The Cost of Maintaining Gravel Roads ...................................................................................................................................................... 22
3.4.7 Minnesota Study (2005)................................................................................................................................................................................ 22
3.4.8 South Dakota study (2004) .......................................................................................................................................................................... 23
3.4.9 Ontario Municipal Benchmarking Initiative (OMBI) ................................................................................................................................. 23
3.4.10 Conclusion ................................................................................................................................................................................................... 23
3.5 Bridges & Culverts ....................................................................................................................................................................... 24
3.5.1 What do we own? ........................................................................................................................................................................................ 25

2
3.5.2 What is it worth? ............................................................................................................................................................................................ 25
3.5.3 What condition is it in? ................................................................................................................................................................................. 26
3.5.4 What do we need to do to it? .................................................................................................................................................................... 27
3.5.5 When do we need to do it? ........................................................................................................................................................................ 27
3.5.6 How much money do we need? ............................................................................................................................................................... 28
3.5.7 How do we reach sustainability? ............................................................................................................................................................... 28
3.5.8 Recommendations ....................................................................................................................................................................................... 29
3.6 Water Network ............................................................................................................................................................................. 30
3.6.1 What do we own? ........................................................................................................................................................................................ 31
3.6.2 What is it worth? ............................................................................................................................................................................................ 32
3.6.3 What condition is it in? ................................................................................................................................................................................. 33
3.6.4 What do we need to do to it? .................................................................................................................................................................... 34
3.6.5 When do we need to do it? ........................................................................................................................................................................ 34
3.6.6 How much money do we need? ............................................................................................................................................................... 36
3.6.7 How do we reach sustainability? ............................................................................................................................................................... 36
3.6.8 Recommendations ....................................................................................................................................................................................... 37
3.7 Sanitary Sewer Network ............................................................................................................................................................. 38
3.7.1 What do we own? ........................................................................................................................................................................................ 39
3.7.2 What is it worth? ............................................................................................................................................................................................ 39
3.7.3 What condition is it in? ................................................................................................................................................................................. 40
3.7.4 What do we need to do to it? .................................................................................................................................................................... 41
3.7.5 When do we need to do it? ........................................................................................................................................................................ 41
3.7.6 How much money do we need? ............................................................................................................................................................... 42
3.7.7 How do we reach sustainability? ............................................................................................................................................................... 43
3.7.8 Recommendations ....................................................................................................................................................................................... 43
3.8 Storm Sewer Network .................................................................................................................................................................. 44
3.8.1 What do we own? ........................................................................................................................................................................................ 45
3.8.2 What is it worth? ............................................................................................................................................................................................ 46
3.8.3 What condition is it in? ................................................................................................................................................................................. 47
3.8.4 What do we need to do to it? .................................................................................................................................................................... 48
3.8.5 When do we need to do it? ........................................................................................................................................................................ 48
3.8.6 How much money do we need? ............................................................................................................................................................... 49
3.8.7 How do we reach sustainability? ............................................................................................................................................................... 50
3.8.8 Recommendations ....................................................................................................................................................................................... 50
4.0 Infrastructure Report Card ................................................................................................................................... 51
5.0 Desired Levels of Service .................................................................................................................................... 52
5.1 Key factors that influence a level of service: ......................................................................................................................... 52
5.1.1 Strategic and Corporate Goals .................................................................................................................................................................. 52
5.1.2 Legislative Requirements ............................................................................................................................................................................. 52
5.1.3 Expected Asset Performance ..................................................................................................................................................................... 52
5.1.4 Community Expectations ............................................................................................................................................................................ 52
5.1.5 Availability of Finances ................................................................................................................................................................................ 53
5.2 Key Performance Indicators ...................................................................................................................................................... 53
5.3 Transportation Services ............................................................................................................................................................... 54
5.3.1 Service Description ....................................................................................................................................................................................... 54
5.3.2 Scope of Services ......................................................................................................................................................................................... 55
5.3.3 Performance Indicators (reported annually) ............................................................................................................................................ 55

3
5.4 Water / Sanitary / Storm Networks ............................................................................................................................................ 55
5.4.1 Service Description ....................................................................................................................................................................................... 55
5.4.2 Scope of services .......................................................................................................................................................................................... 56
5.4.3 Performance Indicators (reported annually) ............................................................................................................................................ 56
6.0 Asset Management Strategy .............................................................................................................................. 57
6.1 Objective ...................................................................................................................................................................................... 57
6.2 Non-Infrastructure Solutions and Requirements ..................................................................................................................... 57
6.3 Condition Assessment Programs ............................................................................................................................................... 57
6.3.1 Pavement Network Inspections .................................................................................................................................................................. 58
6.3.2 Bridges & Culverts (greater than 3m) Inspections .................................................................................................................................... 59
6.3.3 Sewer Network Inspections (Sanitary & Storm) ......................................................................................................................................... 59
6.3.4 Water network inspections .......................................................................................................................................................................... 60
6.4 AM Strategy – Life Cycle Analysis Framework ........................................................................................................................ 62
6.4.1 Paved Roads ................................................................................................................................................................................................. 62
6.4.2 Gravel Roads................................................................................................................................................................................................. 64
6.4.3 Sanitary and Storm Sewers .......................................................................................................................................................................... 64
6.4.4 Bridges & Culverts (greater than 3m span) ............................................................................................................................................... 66
6.4.5 Water Network .............................................................................................................................................................................................. 66
6.5 Growth and Demand ................................................................................................................................................................. 69
6.6 Project Prioritization ..................................................................................................................................................................... 69
6.6.1 Risk Matrix and Scoring Methodology ....................................................................................................................................................... 69
7.0 Financial Strategy ................................................................................................................................................ 72
7.1 General overview of financial plan requirements ................................................................................................................. 72
7.2 Financial information relating to Russell’s AMP ...................................................................................................................... 73
7.2.1 Funding objective ......................................................................................................................................................................................... 73
7.3 Tax funded assets ........................................................................................................................................................................ 73
7.3.1 Current funding position .............................................................................................................................................................................. 73
7.3.2 Recommendations for full funding ............................................................................................................................................................. 74
7.4 Rate funded assets ..................................................................................................................................................................... 75
7.4.1 Current funding position .............................................................................................................................................................................. 75
7.4.2 Recommendations for full funding ............................................................................................................................................................. 75
7.5 Use of debt ................................................................................................................................................................................... 77
7.6 Use of reserves ............................................................................................................................................................................. 79
7.6.1 Available reserves......................................................................................................................................................................................... 79
7.6.2 Recommendation ........................................................................................................................................................................................ 80
8.0 Appendix A: Report Card Calculations ............................................................................................................. 81

4
1.0 Executive Summary The performance of a community’s infrastructure provides the foundation for its economic development,
competitiveness, prosperity, reputation, and the overall quality of life for its residents. Reliable and well-maintained infrastructure assets are essential for the delivery of critical core services for the citizens of a
municipality.
A technically precise and financially rigorous asset management plan, diligently implemented, will mean
that sufficient investments are made to ensure delivery of sustainable infrastructure services to current and
future residents. The plan will also indicate the respective financial obligations required to maintain this
delivery at established levels of service.
This Asset Management Plan (AMP) for the Township of Russell meets all requirements as outlined within the
provincial Building Together Guide for Municipal Asset Management Plans. It will serve as a strategic,
tactical, and financial document, ensuring the management of the municipal infrastructure follows sound
asset management practices and principles, while optimizing available resources and establishing desired
levels of service. Given the expansive financial and social impact of asset management on both a
municipality, and its citizens, it is critical that senior decision-makers, including department heads as well as
the chief executives, are strategically involved.
Measured in 2012 dollars, the replacement value of the asset classes analyzed totaled approximately $207 million for Russell.
Road Network,
$35,709,006 25%
Bridges & Culverts,
$8,032,938 6%
Water Network,
$36,932,357 26%
Sanitary Sewer
Network, $45,462,678 32%
Storm Sewer
Network, $15,490,675, 11%
Replacement Cost by Asset Class in 2012 DollarsTotal: $206,653,860

5
While the municipality is responsible for the strategic direction, it is the taxpayer in Russell who ultimately
bears the financial burden. As such, a ‘cost per household’ (CPH) analysis was conducted for each of the
asset classes to determine the financial obligation of each household in sharing the replacement cost of
the municipality’s assets. Such a measurement can serve as an excellent communication tool for both the
administration and the council in communicating the importance of asset management to the citizen. The
diagram below illustrates the total CPH, as well as the CPH for individual asset classes.
In assessing the municipality’s state of the infrastructure, we examined, and graded, both the current
condition (Condition vs. Performance) of the asset classes as well as the municipality’s financial capacity to
fund the asset’s average annual requirement for sustainability (Funding vs. Need). We then generated the
municipality’s infrastructure report card. The municipality received a cumulative GPA of ‘D’, with an annual, cumulative infrastructure deficit of $3.5 million. Russell Township received an ‘F’ on the Funding vs. Need dimension on four of the five asset classes analyzed in this document, funding less than 50% of its annual
requirements for infrastructure sustainability. In the storm network, it received a ‘D’ with an annual funding
percentage of 54%.
The township’s grades on the Condition vs. Performance dimension were considerably better, receiving a
‘B’ in three of the five asset categories, suggesting only minor or negligible signs of deterioration. In the
water network category, it received a ‘C’, indicative of increasing signs of disrepair and a likely compromise in function. Its lowest grade of ‘D+’, in the storm category, suggests significant signs of
deterioration and a considerable decline in function.
In order for an AMP to be effectively put into action, it must be integrated with financial planning and long-
term budgeting. We have developed scenarios that would enable Russell to achieve full funding within 5 years or 10 years for the following: tax funded assets, including road network (paved roads), bridges &
culverts, storm sewer network, and; rate funded assets, including water network, and sanitary sewer
network.
The average annual investment requirement for paved roads, bridges & culverts, and storm sewers is
$2,578,000. Annual revenue currently allocated to these assets for capital purposes is $1,026,000 leaving an
Storm Sewer Network
Total Replacement Cost: $25,628,346
Cost Per Household: $5,676
Road Network (excludes gravel) Total Replacement Cost: $39,125,353 Cost Per Household: $8,666
Infrastructure Replacement Cost Per Household Total: $45,771 per household
Sanitary Sewer Network Total Replacement Cost: $40,260,700 Cost Per Household: $8,917
Water Network Total Replacement Cost: $79,050,679 Cost Per Household: $17,508
Bridges & Culverts Total Replacement Cost: $22,588,782 Cost Per Household: $5,003

6
annual deficit of $1,552,000. To put it another way, these infrastructure categories are currently funded at
40% of their long-term requirements. In 2013, Russell has annual tax revenues of $8,832,000. Without
consideration of any other sources of revenue, full funding for the three asset classes would require a
combined tax increase of 17.6%. We recommend a 10 year option which involves full funding being
achieved over 10 years by:
a) when realized, reallocating the debt cost reductions of $76,000 to the infrastructure deficit as outlined above.
b) increasing tax revenues by 1.7% each year for the next 10 years solely for the purpose of phasing in full funding to the tax
funded asset categories c) allocating the $426,000 of gas tax revenue to the roads category.
d) increasing existing and future infrastructure budgets by the applicable inflation index on an annual basis in addition to the deficit phase-in.
The average annual investment requirement for sanitary services and water services is $2,331,000. Annual
revenue currently allocated to these assets for capital purposes is $372,000 leaving an annual deficit of
$1,959,000. To put it another way, these infrastructure categories are currently funded at 16% of their long-
term requirements. In 2013, Russell has annual sanitary revenues of $1,189,000 and annual water revenues
of $3,150,000. Without consideration of any other sources of revenue, full funding for the two categories
would require a rate increase of 28.8% in sanitary services, and 51.3% in water services. Similar to the tax
funded classes, we recommend a 10 year option which involves full funding being achieved over 10 years
by:
a) when realized, reallocating the debt cost reductions of $134,000 for sanitary services to the applicable infrastructure
deficit.
b) increasing rate revenues by 1.8% for sanitary services and 5.1% for water services each year for the next 10 years solely
for the purpose of phasing in full funding to the sanitary and water services c) increasing existing and future infrastructure budgets by the applicable inflation index on an annual basis in addition to
the deficit phase-in.
The revenue options outlined in this plan allow Russell to fully fund its long-term infrastructure requirements
without further use of debt. However, as explained in sections 7.3.2 and 7.4.2, the recommended condition
rating analysis may require otherwise. Reserves can mitigate financial pressures as needed, and play a
critical role in long-term financial planning. However, due to the absence of reserves for tax based asset
categories and relatively low level of reserves for rate based asset categories, the scenarios developed in
this report do not draw on these funds during the phase-in period to full funding. This, coupled with Russell’s
judicious use of debt in the past, allows the scenarios to assume that, if required, available reserves and
debt capacity can be used for high priority and emergency situations until reserves are built to desired
levels. This will allow the Russell to address high priority infrastructure investments in the short to medium-
term.

7
2.0 Introduction
This Asset Management Plan meets all provincial requirements as outlined within the Ontario Building
Together Guide for Municipal Asset Management Plans. As such, the following key sections and content
are included:
1. Executive Summary and Introduction
2. State of the Current Infrastructure
3. Desired Levels of Service 4. Asset Management Strategy
5. Financial Strategy
The following asset classes are addressed:
1. Roads: HCB and LCB paved roads, gravel and earth roads 2. Structures: Bridges and large culverts with a span greater than 3m, small culverts
3. Water: Water mains, hydrants, valves, services, water tower and reservoir
4. Wastewater: Sanitary sewer mains, lagoon
5. Storm: Storm sewer mains, catch basins, manholes, services, ponds
Municipalities are encouraged to cover all asset classes in future iterations of the AMP.
This asset management plan will serve as a strategic, tactical, and financial document ensuring the
management of the municipal infrastructure follows sound asset management practices and principles,
while optimizing available resources and establishing desired levels of service.
At a strategic level, within the State of the Current Infrastructure section, it will identify current and future challenges that should be addressed in order to maintain sustainable infrastructure services on a long-term,
life cycle basis.
It will outline a Desired Level of Service (LOS) Framework for each asset category to assist the development
and tracking of LOS through performance measures across strategic, financial, tactical, operational, and
maintenance activities within the organization.
At a tactical level, within the Asset Management Strategy section, it will develop an implementation
process to be applied to the needs-identification and prioritization of renewal, rehabilitation, and
maintenance activities, resulting in a 10 year plan that will include growth projections.
At a financial level, within the Financial Strategy section, a strategy will be developed that fully integrates with other sections of this asset management plan, to ensure delivery and optimization of the 10 year infrastructure budget.
Through the development of this plan, all data, analysis, life cycle projections, and budget models will be
provided through the Public Sector Digest’s CityWide suite of software products. The software and plan will
be synchronized, will evolve together, and therefore, will allow for ease of updates, and annual reporting of
performance measures and overall results.
This will allow for continuous improvement of the plan and its projections. It is therefore recommended that
the plan be revisited and updated on an annual basis, particularly as more detailed information becomes
available.
2.1 Importance of Infrastructure
Municipalities throughout Ontario, large and small, own a diverse portfolio of infrastructure assets that in
turn provide a varied number of services to their citizens. The infrastructure, in essence, is a conduit for the
various public services the municipality provides, e.g., the roads supply a transportation network service;
the water infrastructure supplies a clean drinking water service. A community’s prosperity, economic

8
development, competitiveness, image, and overall quality of life are inherently and explicitly tied to the
performance of its infrastructure.
2.2 Asset Management Plan (AMP) - Relationship to Strategic Plan
The major benefit of strategic planning is the promotion of strategic thought and action. A strategic plan
spells out where an organization wants to go, how it’s going to get there, and helps decide how and where
to allocate resources, ensuring alignment to the strategic priorities and objectives. It will help identify
priorities and guide how municipal tax dollars and revenues are spent into the future.
The strategic plan usually includes a vision and mission statement, and key organizational priorities with
alignment to objectives and action plans. Given the growing economic and political significance of
infrastructure, the asset management plan will become a central component of most municipal strategic
plans, influencing corporate priorities, objectives, and actions.
2.3 AMP - Relationship to other Plans
An asset management plan is a key component of the municipality’s planning process linking with multiple
other corporate plans and documents. For example:
� The Official Plan – The AMP should utilize and influence the land use policy directions for long-term growth and
development as provided through the Official Plan.
� Long Term Financial Plan – The AMP should both utilize and conversely influence the financial forecasts within the long-
term financial plan.
� Capital Budget – The decision framework and infrastructure needs identified in the AMP form the basis on which future capital budgets are prepared.
� Infrastructure Master Plans – The AMP will utilize goals and projections from infrastructure master plans and in turn will
influence future master plan recommendations.
� By-Laws, standards, and policies – The AMP will influence and utilize policies and by-laws related to infrastructure
management practices and standards.
� Regulations – The AMP must recognize and abide by industry and senior government regulations.
� Business Plans – The service levels, policies, processes, and budgets defined in the AMP are incorporated into business
plans as activity budgets, management strategies, and performance measures.

9
INFRASTRUCTURE–STRATEGIC PLAN Strategic Plan Goals, Asset Performance & Community Expectations,
Legislated Requirements
STATE OF THE CURRENT INFRASTRUCTURE REPORTS Asset Inventory, Valuation, Current Condition/Performance,
Sustainable Funding Analysis
EXPECTED LEVELS OF SERVICE Key Performance Indicators, Performance Measures, Public
Engagement
ASSET MANAGEMENT STRATEGY Lifecycle Analysis, Growth Requirements, Risk Management, Project
Prioritization Methodologies
FINANCING STRATEGY Available Revenue Analysis, Develop Optional Scenarios, Define
Optimal Budget & Financial Plan
AMP PERFORMANCE REPORTING Project Implementation, Key Performance Measures Tracked, Progress
Reported to Senior Management & Council
Are levels of service achievable?
2.4 Purpose and Methodology
The following diagram depicts the approach and methodology, including the key components and links
between those components that embody this asset management plan:
It can be seen from the above that a municipality’s infrastructure planning starts at the corporate level with
ties to the strategic plan, alignment to the community’s expectations, and compliance with industry and
government regulations.
Then, through the State of the Infrastructure analysis, overall asset inventory, valuation, condition and
performance are reported. Further, a life cycle analysis of needs for each infrastructure class is conducted.
This analysis yields the sustainable funding level, compared against actual current funding levels, and
determines whether there is a funding surplus or deficit for each infrastructure program. The overall
measure of condition and available funding is finally scored for each asset class and presented as a star
rating (similar to the hotel star rating) and a letter grade (A-F) within the Infrastructure Report card.
From the lifecycle analysis above, the municipality gains an understanding of the level of service provided
today for each infrastructure class and the projected level of service for the future. The next section of the
AMP provides a framework for a municipality to develop a Desired Level of Service (or target service level)
and develop performance measures to track the year-to-year progress towards this established target level
of service.

10
The Asset Management Strategy then provides a detailed analysis for each infrastructure class. Included in
this analysis are best practices and methodologies from within the industry which can guide the overall
management of the infrastructure in order to achieve the desired level of service. This section also provides
an overview of condition assessment techniques for each asset class; life cycle interventions required,
including those interventions that yield the best return on investment; and prioritization techniques,
including risk quantification, to determine which priority projects should move forward into the budget first.
The Financing Strategy then fully integrates with the asset management strategy and asset management
plan, and provides a financial analysis that optimizes the 10 year infrastructure budget. All revenue sources
available are reviewed, such as the tax levy, debt allocations, rates, reserves, grants, gas tax, development
charges, etc., and necessary budget allocations are analysed to inform and deliver the infrastructure
programs.
Finally, in subsequent updates to this AMP, actual project implementation will be reviewed and measured
through the established performance metrics to quantify whether the desired level of service is achieved or
achievable for each infrastructure class. If shortfalls in performance are observed, these will be discussed and alternate financial models or service level target adjustments will be presented.

11
INFRASTRUCTURE–STRATEGIC PLAN Strategic Plan Goals, Asset Performance & Community Expectations,
Legislated Requirements
STATE OF THE CURRENT INFRASTRUCTURE REPORTS Asset Inventory, Valuation, Current Condition/Performance,
Sustainable Funding Analysis
EXPECTED LEVELS OF SERVICE Key Performance Indicators, Performance Measures, Public
Engagement
ASSET MANAGEMENT STRATEGY Lifecycle Analysis, Growth Requirements, Risk Management, Project
Prioritization Methodologies
FINANCING STRATEGY Available Revenue Analysis, Develop Optional Scenarios, Define
Optimal Budget & Financial Plan
AMP PERFORMANCE REPORTING Project Implementation, Key Performance Measures Tracked, Progress
Reported to Senior Management & Council
Are levels of service achievable?
2.5 CityWide Software alignment with AMP
The plan will be built and developed hand in hand with a database of municipal infrastructure information
in the CityWide software suite of products. The software will ultimately contain the municipality’s asset base,
valuation information, life cycle activity predictions, costs for activities, sustainability analysis, project
prioritization parameters, key performance indicators and targets, 10 year asset management strategy,
and the financial plan to deliver the required infrastructure budget.
The software and plan will be synchronized, and will evolve together year-to-year as more detailed
information becomes available. This synchronization will allow for ease of updates, modeling and scenario
building, and annual reporting of performance measures and results. This will allow for continuous
improvement of the plan and its projections. It is therefore recommended that it is revisited and updated
on an annual basis.
The following diagram outlines the various CityWide software products and how they align to the various
components of the AMP.

12
3.0 State of the Infrastructure (SOTI)
3.1 Objective and Scope
Objective: To identify the state of the municipality’s infrastructure today and the projected state in the
future if current funding levels and management practices remain status quo.
The analysis and subsequent communication tools will outline future asset requirements, will start the development of tactical implementation plans, and ultimately assist the organization to provide cost
effective sustainable services to the current and future community.
The approach was based on the following key industry state of the infrastructure documents:
� Canadian Infrastructure Report Card
� City of Hamilton’s State of the Infrastructure reports
� Other Ontario Municipal State of the Infrastructure reports
The above reports are themselves based on established principles found within key, industry best practices
documents such as:
� The National Guide for Sustainable Municipal Infrastructure (Canada)
� The International Infrastructure Management Manual (Australia / New Zealand)
� American Society of Civil Engineering Manuals (U.S.A.)
Scope: Within this State of the Infrastructure report, a high level review will be undertaken for the following
asset classes:
1. Roads: HCB and LCB paved roads, gravel and earth roads 2. Structures: Bridges and large culverts with a span greater than 3m, small culverts
3. Water: Water mains, hydrants, valves, services, water tower and reservoir 4. Wastewater: Sanitary sewer mains, lagoon
5. Storm: Storm sewer mains, catch basins, manholes, services, ponds
3.2 Approach
The asset classes above were reviewed at a very high level due to the nature of data and information
available. Subsequent detailed reviews of this analysis are recommended on an annual basis, as more
detailed conditions assessment information becomes available for each infrastructure program.
3.2.1 Base Data In order to understand the full inventory of infrastructure assets within Russell, all tangible capital asset data,
as collected to meet the PSAB 3150 accounting standard, was loaded into the CityWide Tangible Asset™
software module. This data base now provides a detailed and summarized inventory of assets as used
throughout the analysis within this report and the entire Asset Management Plan.
3.2.2 Asset Deterioration Review The township has supplied field condition data for a significant amount of the infrastructure categories
within the report. Compared with other similar sized municipalities within Ontario Russell township appears to be ahead within this area and should be applauded. Condition data has been loaded into the City
Wide software system for the following assets: all paved roads, sidewalks and stop signs; all bridges and
large culverts; water mains; and storm catch basins and manholes. The condition data recalculates a new
performance age for each individual asset and, as such, a far more accurate prediction of future
replacement can be established and applied to the future investment requirements within this AMP report.

13
For all other assets reported within this AMP the deterioration review will rely on the ‘straight line’
amortization schedule approach provided from the accounting data. Although this approach is based on
age data and useful life projections, and is not as accurate as the use of detailed condition data, it does
provide a relatively reliable benchmark of future requirements.
3.2.3 Identify Sustainable Investment Requirements A gap analysis was performed to identify sustainable investment requirements for each asset category.
Information on current spending levels and budgets was acquired from the organization, future investment
requirements were calculated, and the gap between the two was identified.
The above analysis is performed by using investment and financial planning models, and life cycle costing
analysis, embedded within the CityWide software suite of applications.
3.2.4 Asset Rating Criteria Each asset category will be rated on two key dimensions:
� Condition vs. Performance: Based on the condition of the asset today and how well performs its function.
� Funding vs. Need: Based on the actual investment requirements to ensure replacement of the asset at the right time,
versus current spending levels for each asset group.
3.2.5 Infrastructure Report Card The dimensions above will be based on a simple 1–5 star rating system, which will be converted into a letter
grading system ranging from A-F. An average of the two ratings will be used to calculate the combined
rating for each asset class. The outputs for all municipal assets will be consolidated within the CityWide
software to produce one overall Infrastructure Report Card showing the current state of the assets.
Grading Scale: Condition vs. Performance What is the condition of the asset today and how well does it perform its function?
Star Rating Letter Grade Color
Indicator Description
����� A Excellent: No noticeable defects
���� B Good: Minor deterioration
��� C Fair: Deterioration evident, function is affected
�� D Poor: Serious deterioration. Function is inadequate
� F Critical: No longer functional. General or complete failure
Grading Scale: Funding vs. Need Based on the actual investment requirements to ensure replacement of the asset at the right time, versus
current spending levels for each asset group.
Star Rating Letter Grade Description
����� A Excellent: 91 to 100% of need
���� B Good: 76 to 90% of need
��� C Fair: 61 to 75% of need
�� D Poor: 46 – 60% of need
� F Critical: under 45% of need

14
3.2.6 General Methodology and Reporting Approach The report will be based on the seven key questions of asset management as outlined within the National
Guide for Sustainable Municipal Infrastructure:
� What do you own and where is it? (inventory) � What is it worth? (valuation / replacement cost)
� What is its condition / remaining service life? (function & performance)
� What needs to be done? (maintain, rehabilitate, replace)
� When do you need to do it? (useful life analysis) � How much will it cost? (investment requirements)
� How do you ensure sustainability? (long-term financial plan)
The above questions will be answered for each individual asset category in the following report sections.

15
3.3 Road Network Infrastructure
D+ INFRASTRUCTURE REPORT CARD GRADE
3.3 Road Network

16
3.3 Road Network
Note: The financial analysis in this section includes paved and tar and chip roads. Gravel roads are
excluded from the capital replacement analysis, as by nature, they require perpetual maintenance
activities and funding. However, the gravel roads have been included in the Road Network inventory and
replacement value tables. There is also further information regarding gravel roads in section 3.4 “Gravel
Roads – Maintenance Requirements” of this AMP.
3.3.1 What do we own? As shown in the summary table below, the entire network comprises approximately 238 centreline km of
road.
Road Network Inventory
Asset Type Asset Component Quantity/Units
Road Network
Earth 37,165m
Gravel 26,050m
High Class Bituminous 129,792m
Low Class Bituminous 45,420m
Sidewalks 27,051m
Stop Signs 309 Units
Street Lighting 1,017 Units
Street Scape 27 Units
Yield Signs 6 Units
Other Signs 892 Units
The road network data was extracted from the Tangible Capital Asset module of the CityWide software
suite.
3.3.2 What is it worth? The estimated replacement value of the road network, in 2012 dollars, is approximately $39 million. The cost
per household for the road network is $8,666 based on 4,515 households.
Road Network Replacement Value
Asset Type Asset Component Quantity/Units 2012 Unit
Replacement Cost 2012 Overall Replacement Cost
Road Network
Earth 37,165m User-Defined Not Planned For Replacement
Gravel 26,050m User-Defined Not Planned For Replacement
High Class Bituminous 129,792m User-Defined $24,887,128
Low Class Bituminous 45,420m User-Defined $7,805,400
Sidewalks 27,051m User-Defined $3,234,125
Stop Signs 309 Units User-Defined $30,900
Street Lighting 1,017 Units User-Defined $3,051,000
Street Scape 27 Units User-Defined $27,000
Yield Signs 6 Units User-Defined $600
Other Signs 892 Units User-Defined $89,200
$39,125,353

17
The pie chart below provides a breakdown of each of the network components to the overall system
value.
Road Network Components
3.3.3 What condition is it in? Based on assessed condition data, nearly 93% of the municipality’s road network is in fair to excellent
condition. As such, the municipality received a Condition vs. Performance rating of ‘B’.
Road Network Condition by Length (m); includes HCB, LCB, and Sidewalks
18
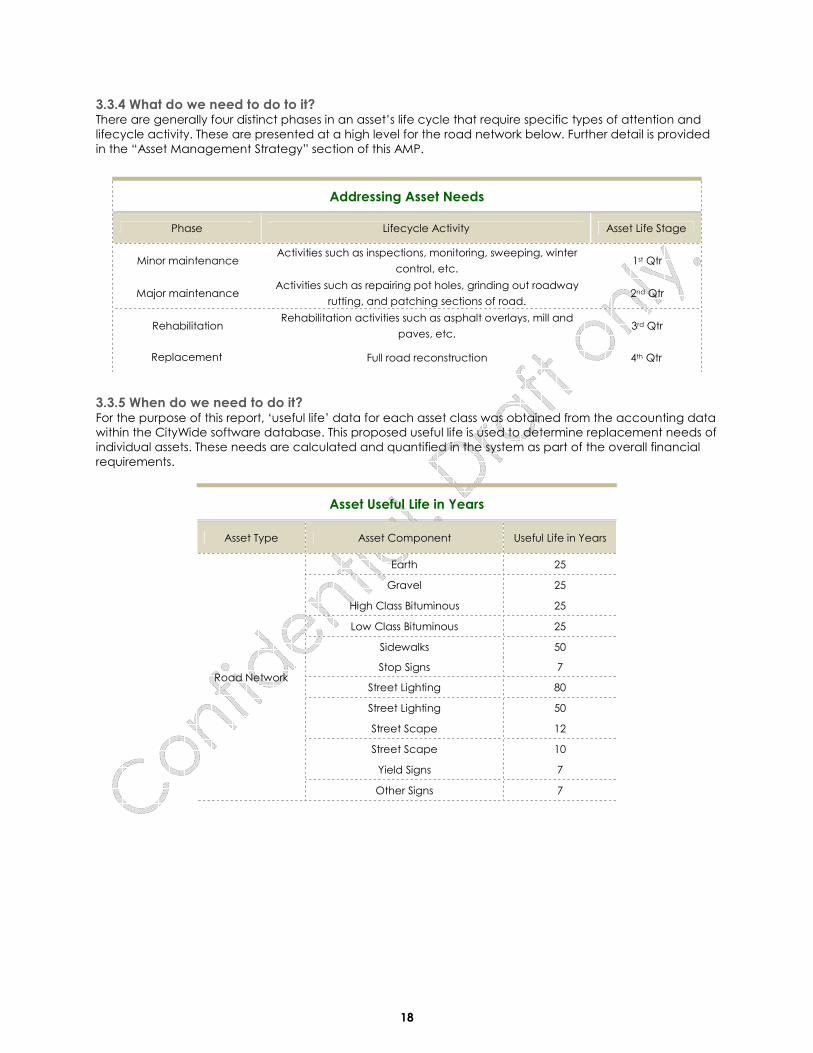
3.3.4 What do we need to do to it? There are generally four distinct phases in an asset’s life cycle that require specific types of attention and
lifecycle activity. These are presented at a high level for the road network below. Further detail is provided
in the “Asset Management Strategy” section of this AMP.
Addressing Asset Needs
Phase Lifecycle Activity Asset Life Stage
Minor maintenance Activities such as inspections, monitoring, sweeping, winter
control, etc. 1st Qtr
Major maintenance Activities such as repairing pot holes, grinding out roadway
rutting, and patching sections of road. 2nd Qtr
Rehabilitation Rehabilitation activities such as asphalt overlays, mill and
paves, etc. 3rd Qtr
Replacement Full road reconstruction 4th Qtr
3.3.5 When do we need to do it? For the purpose of this report, ‘useful life’ data for each asset class was obtained from the accounting data within the CityWide software database. This proposed useful life is used to determine replacement needs of
individual assets. These needs are calculated and quantified in the system as part of the overall financial
requirements.
Asset Useful Life in Years
Asset Type Asset Component Useful Life in Years
Road Network
Earth 25
Gravel 25
High Class Bituminous 25
Low Class Bituminous 25
Sidewalks 50
Stop Signs 7
Street Lighting 80
Street Lighting 50
Street Scape 12
Street Scape 10
Yield Signs 7
Other Signs 7

19
Road Network Replacement Profile (excludes gravel roads)
3.3.6 How much money do we need? The analysis completed to determine capital revenue requirements was based on the following constraints
and assumptions:
1. Replacement costs are based upon the unit costs identified within the “What is it worth” section.
2. The timing for individual road replacement was defined by the replacement year as described in the “When do you
need to do it?” section. 3. All values are presented in 2012 dollars.
4. The analysis was run for an 80 year period to ensure all assets went through at least one iteration of replacement,
therefore providing a sustainable projection.
3.3.7 How do we reach sustainability?
Based upon the above parameters, the average annual revenue required to sustain Russell’s paved road
network is approximately $1,437,000. Based on Russell’s current annual funding of $657,000, there is an annual deficit of $780,000. Given this deficit, the municipality received a Funding vs. Need rating of ‘F’. The
following graph illustrates the expenditure requirements in five year increments against the sustainable
funding threshold line.
Sustainable Funding Requirements (excludes gravel roads)
In conclusion, based on field condition assessment data, there is a significant portion of the road network in
excellent, good and fair condition and also approximately 10% of the network in poor or critical condition.
Also, as LCB and HCB have a 25 year life, over the next 5 years a significant portion of the network will
deteriorate further. Total road network requirements, including street lights and signs, within the next 5 years
total approximately $10 million. The condition assessment data, along with risk management strategies,
should be reviewed together to aid in prioritizing overall needs for rehabilitation and replacement and
assist with optimizing the long and short term budgets. Further detail is outlined within the “asset
management strategy” section of this AMP.
20
3.3.8 Recommendations The municipality received an overall rating of ‘D+’ for its road network, calculated from the Condition vs.
Performance and the Funding vs. Need ratings. Accordingly, we recommend the following:
1. The condition assessment data, along with risk management strategies, should be reviewed together to aid in prioritizing
overall needs for rehabilitation and replacement.
2. A tailored life cycle activity framework should be also be developed by the Township as outlined further within the “Asset
Management Strategy” section of this AMP.
3. As approximately 10% of the Municipality’s road network is gravel roads, a detailed study should be undertaken to assess
the overall maintenance costs of gravel roads and whether there is benefit to converting some gravel roads to paved ,
or surface treated roads, thereby reducing future costs. This is further outlined within the “Asset Management Strategy”
section of this AMP.
4. Once the above studies are complete or underway, the data should be loaded into the CityWide software and an
updated “current state of the infrastructure” analysis should be generated.
5. An appropriate % of asset replacement value should be used for operations and maintenance activities on an annual
basis. This should be determined through a detailed analysis of O & M activities and be added to future AMP reporting.
6. The Infrastructure Report Card should be updated on an annual basis.
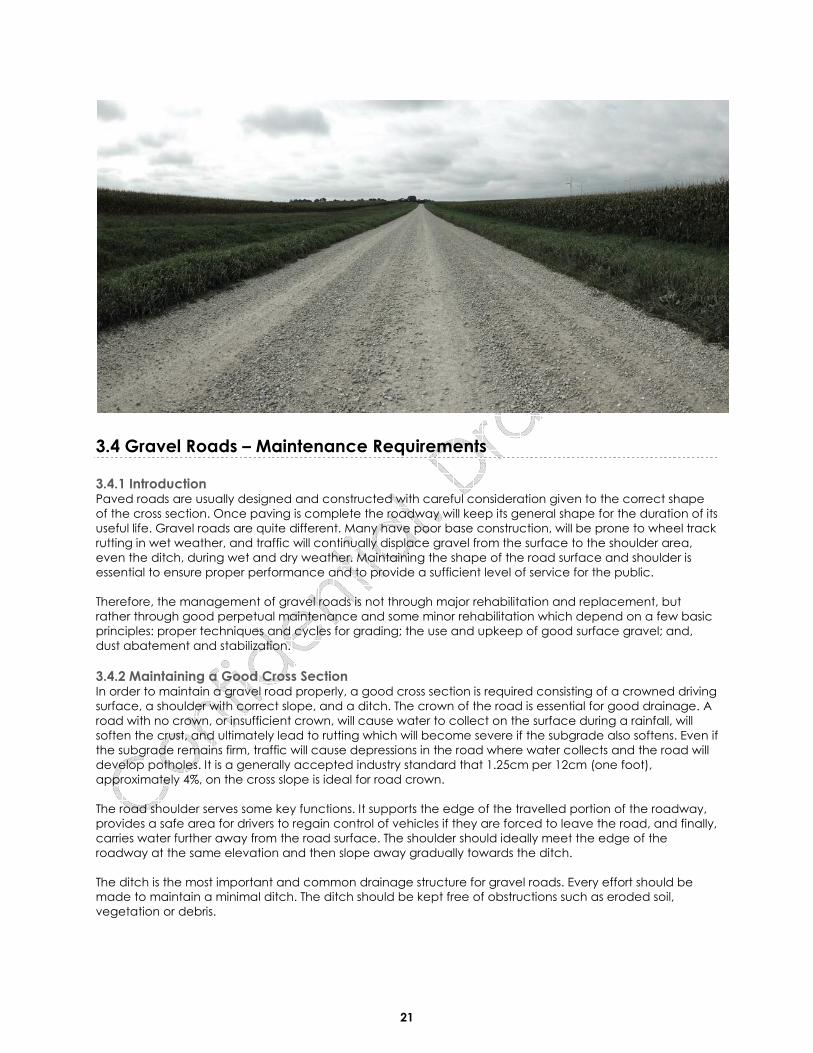
21
3.4 Gravel Roads – Maintenance Requirements
3.4.1 Introduction Paved roads are usually designed and constructed with careful consideration given to the correct shape
of the cross section. Once paving is complete the roadway will keep its general shape for the duration of its
useful life. Gravel roads are quite different. Many have poor base construction, will be prone to wheel track
rutting in wet weather, and traffic will continually displace gravel from the surface to the shoulder area,
even the ditch, during wet and dry weather. Maintaining the shape of the road surface and shoulder is
essential to ensure proper performance and to provide a sufficient level of service for the public.
Therefore, the management of gravel roads is not through major rehabilitation and replacement, but
rather through good perpetual maintenance and some minor rehabilitation which depend on a few basic
principles: proper techniques and cycles for grading; the use and upkeep of good surface gravel; and,
dust abatement and stabilization.
3.4.2 Maintaining a Good Cross Section In order to maintain a gravel road properly, a good cross section is required consisting of a crowned driving
surface, a shoulder with correct slope, and a ditch. The crown of the road is essential for good drainage. A
road with no crown, or insufficient crown, will cause water to collect on the surface during a rainfall, will
soften the crust, and ultimately lead to rutting which will become severe if the subgrade also softens. Even if
the subgrade remains firm, traffic will cause depressions in the road where water collects and the road will
develop potholes. It is a generally accepted industry standard that 1.25cm per 12cm (one foot),
approximately 4%, on the cross slope is ideal for road crown.
The road shoulder serves some key functions. It supports the edge of the travelled portion of the roadway,
provides a safe area for drivers to regain control of vehicles if they are forced to leave the road, and finally,
carries water further away from the road surface. The shoulder should ideally meet the edge of the
roadway at the same elevation and then slope away gradually towards the ditch.
The ditch is the most important and common drainage structure for gravel roads. Every effort should be made to maintain a minimal ditch. The ditch should be kept free of obstructions such as eroded soil,
vegetation or debris.

22
3.4.3 Grading Operations Routine grading is the activity that ensures gravel roadways maintain a good cross section or proper profile.
The three key components to good grading are: operating speed, blade angle, and blade pitch.
Excessive operating speed can cause many problems such as inconsistent profile, and blade movement or
bouncing that can cut depressions and leave ridges in the road surface. It is generally accepted that
grader speed should not exceed 8km per hour. The angle of the blade is also critical for good
maintenance and industry standards suggest the optimal angle is between 30 and 45 degrees. Finally, the
correct pitch or tilt of the blade is very important. If the blade is pitched back too far, the material will tend
to build up in front of the blade and will not fall forward, which mixes the materials, and will move along
and discharge at the end of the blade.
3.4.4 Good Surface Gravel Once the correct shape is established on a roadway and drainage matters are taken care of, attention
must be given to the placement of good gravel. Good surface gravel requires a percentage of stone
which gives strength to support loads, particularly in wet weather. It also requires a percentage of sand size
particles to fill the voids between the stones which provide stability. And finally, a percentage of plastic
fines are needed to bind the material together which allows a gravel road to form a crust and shed water.
Typical municipal maintenance routines will include activities to ensure a good gravel surface through both
spot repairs (often annually) and also re-graveling of roadways (approximately every five years).
3.4.5 Dust Abatement and stabilization A typical maintenance activity for gravel roads also includes dust abatement and stabilization. All gravel
roads will give off dust at some point, although the amount of dust can vary greatly from region to region.
The most common treatment to reduce dust is the application of Calcium Chloride, in flake or liquid form,
or Magnesium Chloride, generally just in liquid form. Of course, there are other products on the market as well. Calcium and Magnesium Chloride can be very effective if used properly. They are hygroscopic
products which draw moisture from the air and keep the road surface constantly damp. In addition to
alleviating dust issues, the continual dampness also serves to maintain the loss of fine materials within the
gravel surface, which in turn helps maintain road binding and stabilization. A good dust abatement
program can actually help waterproof and bind the road, in doing so can reduce gravel loss, and
therefore, reduce the frequency of grading.
3.4.6 The Cost of Maintaining Gravel Roads We conducted an industry review to determine the standard cost for maintaining gravel roads. However, it
became apparent that no industry standard exists for either the cost of maintenance or for the frequency
at which the maintenance activities should be completed. Presented below, as a guideline only, are two
studies on the maintenance costs for gravel roads:
3.4.7 Minnesota Study (2005) The first study is from the Minnesota Department of Transportation (MnDOT) Local Road Research Board
(LRRB), where the researchers looked at historical and estimated cost data from multiple counties in
Minnesota.
The study team found that the typical maintenance schedule consisted of routine grading and re-
graveling with two inches of new gravel every five years. They found that a typical road needed to be
graded 21 times a year or three times a month from April – October, and the upper bound for re-graveling
was five years for any road over 100 ADT; lower volume roads could possibly go longer. The calculated costs including materials, labour, and hauling totaled $1,400 per year or $67 per visit for the grading activity
and $13,800 for the re-gravel activity every five years. The re-gravel included an estimate gravel cost of
$7.00 per cubic yard and a 2.5” thick lift of gravel (to be compacted down to 2”). Therefore, they
developed an average estimated annual maintenance cost for gravel roads at $4,160 per mile. This
converts to $2,600 per km of roadway and if adjusted for inflation into 2012 dollars, using the Non-
Residential Building Construction Price Index (NRBCPI), it would be $3,500.
Reference: Jahren, Charles T. et. al. “Economics of Upgrading an Aggregate Road,” Minnesota Department of
Transportation, St. Paul, Mn, January 2005.
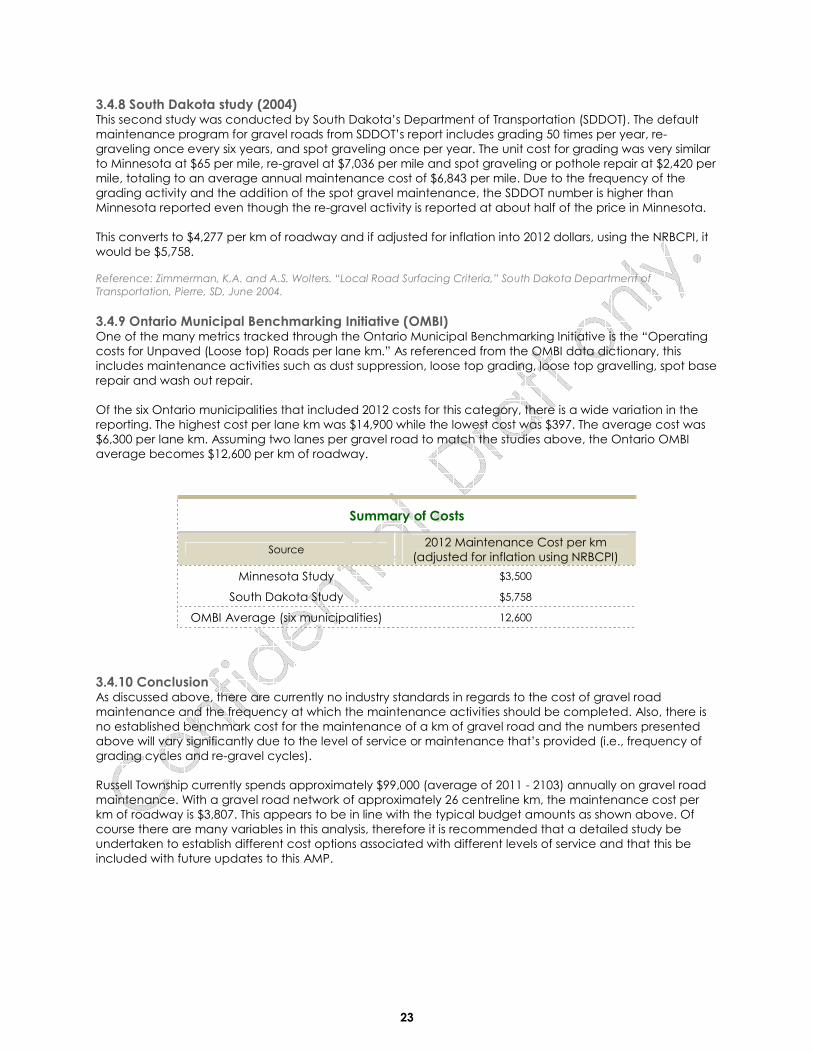
23
3.4.8 South Dakota study (2004) This second study was conducted by South Dakota’s Department of Transportation (SDDOT). The default
maintenance program for gravel roads from SDDOT’s report includes grading 50 times per year, re-
graveling once every six years, and spot graveling once per year. The unit cost for grading was very similar
to Minnesota at $65 per mile, re-gravel at $7,036 per mile and spot graveling or pothole repair at $2,420 per
mile, totaling to an average annual maintenance cost of $6,843 per mile. Due to the frequency of the
grading activity and the addition of the spot gravel maintenance, the SDDOT number is higher than
Minnesota reported even though the re-gravel activity is reported at about half of the price in Minnesota.
This converts to $4,277 per km of roadway and if adjusted for inflation into 2012 dollars, using the NRBCPI, it
would be $5,758. Reference: Zimmerman, K.A. and A.S. Wolters. “Local Road Surfacing Criteria,” South Dakota Department of
Transportation, Pierre, SD, June 2004.
3.4.9 Ontario Municipal Benchmarking Initiative (OMBI) One of the many metrics tracked through the Ontario Municipal Benchmarking Initiative is the “Operating
costs for Unpaved (Loose top) Roads per lane km.” As referenced from the OMBI data dictionary, this
includes maintenance activities such as dust suppression, loose top grading, loose top gravelling, spot base
repair and wash out repair.
Of the six Ontario municipalities that included 2012 costs for this category, there is a wide variation in the
reporting. The highest cost per lane km was $14,900 while the lowest cost was $397. The average cost was
$6,300 per lane km. Assuming two lanes per gravel road to match the studies above, the Ontario OMBI
average becomes $12,600 per km of roadway.
Summary of Costs
Source 2012 Maintenance Cost per km
(adjusted for inflation using NRBCPI)
Minnesota Study $3,500
South Dakota Study $5,758
OMBI Average (six municipalities) 12,600
3.4.10 Conclusion As discussed above, there are currently no industry standards in regards to the cost of gravel road
maintenance and the frequency at which the maintenance activities should be completed. Also, there is
no established benchmark cost for the maintenance of a km of gravel road and the numbers presented
above will vary significantly due to the level of service or maintenance that’s provided (i.e., frequency of
grading cycles and re-gravel cycles).
Russell Township currently spends approximately $99,000 (average of 2011 - 2103) annually on gravel road
maintenance. With a gravel road network of approximately 26 centreline km, the maintenance cost per
km of roadway is $3,807. This appears to be in line with the typical budget amounts as shown above. Of
course there are many variables in this analysis, therefore it is recommended that a detailed study be
undertaken to establish different cost options associated with different levels of service and that this be
included with future updates to this AMP.

24
3.4 Bridges & Culverts
D INFRASTRUCTURE REPORT CARD GRADE
3.5 Bridges & Culverts

25
3.5 Bridges & Culverts
3.5.1 What do we own? As shown in the summary table below, the municipality owns 14 bridges and 11 large culverts, and 273
small culverts.
Bridge and Culvert Inventory
Asset Type Asset Component Quantity Quantity/Units
Bridges & Culverts
Bridges 3,793m2 14 Units
Bridge Culverts 256m2 11 Units
Guide Rails 1,028m 13 Units
Culverts - 273 Units
Driveway Culverts - 1 Unit
The bridges & culverts data was extracted from the Tangible Capital Asset module of the CityWide
software suite.
3.5.2 What is it worth? The estimated replacement value of the municipality’s bridges & culverts, in 2012 dollars, is approximately
$23 million. The cost per household for bridges & culverts is $5,003 based on 4,515 households.
Bridge and Culvert Replacement Value
Asset Type Asset Component Quantity Count 2012 Unit
Replacement Cost 2012 Overall Replacement Cost
Bridges & Culverts
Bridges 3,793m2 14 Units User-Defined $15,891,000
Bridge Culverts 256m2 11 Units User-Defined $3,822,000
Guide Rails 1,028m 13 Units User-Defined $2,730,000
Culverts - 273 Units User-Defined $5,000
Driveway Culverts - 1 Unit User-Defined $140,782
$22,588,782
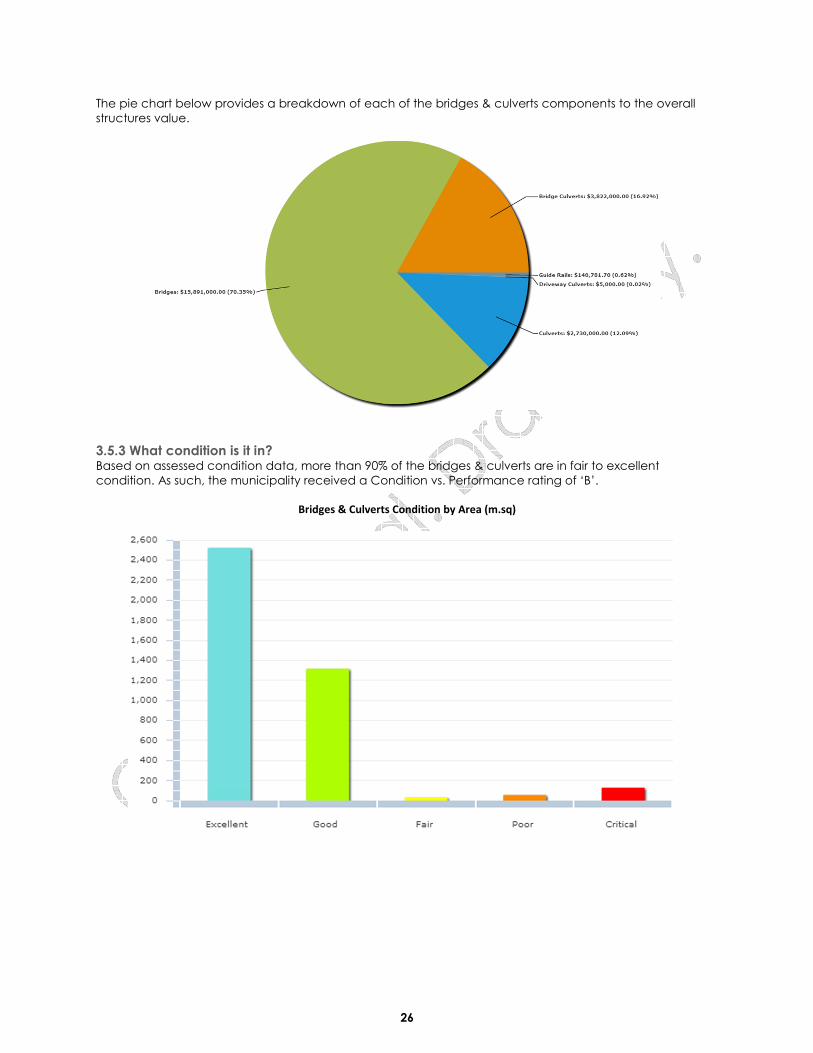
26
The pie chart below provides a breakdown of each of the bridges & culverts components to the overall
structures value.
3.5.3 What condition is it in? Based on assessed condition data, more than 90% of the bridges & culverts are in fair to excellent
condition. As such, the municipality received a Condition vs. Performance rating of ‘B’.
Bridges & Culverts Condition by Area (m.sq)

27
3.5.4 What do we need to do to it? There are generally four distinct phases in an asset’s life cycle. These are presented at a high level for the
bridge and culvert structures below. Further detail is provided in the “Asset Management Strategy” section
of this AMP.
Addressing Asset Needs
Phase Lifecycle Activity Asset Life Stage
Minor Maintenance Activities such as inspections, monitoring, sweeping, winter control, etc. 1st Qtr
Major Maintenance Activities such as repairs to cracked or spalled concrete, damaged
expansion joints, bent or damaged railings, etc. 2nd Qtr
Rehabilitation Rehabilitation events such as structural reinforcement of structural
elements, deck replacements, etc. 3rd Qtr
Replacement Full structure reconstruction 4th Qtr
3.5.5 When do we need to do it? For the purpose of this report, ‘useful life’ data for each asset class was obtained from the accounting data
within the CityWide software database. This proposed useful life is used to determine replacement needs of
individual assets, which are calculated in the system as part of the overall financial requirements.
Asset Useful Life in Years
Asset Type Asset Component Useful Life in
Years
Bridges & Culverts
Bridges 50
Bridge Culverts 25
Bridge Culverts 50
Guiderails 25
Guide Rails 50
Culverts 50
Driveway Culverts 25

28
The following graph shows the current projection of structure replacements based on the age of the asset
only.
Structures Replacement Profile
3.5.6 How much money do we need? The analysis completed to determine capital revenue requirements was based on the following constraints
and assumptions:
1. Replacement costs are based upon the “What is it worth” section above.
2. The timing for individual structure replacement was defined by the replacement year as described in the “When do you
need to do it?” section above. 3. All values are presented in 2012 dollars.
4. The analysis was run for a 50 year period to ensure all assets cycled through at least one iteration of replacement,
therefore providing a sustainable projection.
3.5.7 How do we reach sustainability? Based upon the above assumptions, the average annual revenue required to sustain Russell’s bridges &
culverts is $526,000. Based on Russell’s current annual funding of $35,000, there is an annual deficit of $491,000. As such, the municipality received a Funding vs. Need rating of ‘F’. The following graph presents
five year blocks of expenditure requirements against the sustainable funding threshold line.
Sustainable Revenue Requirement

29
In conclusion, based on field condition assessment data, the majority of bridges and large structures are in
good condition, however, over the next 5 years a portion of structures and/or their elements will require
rehabilitation or replacement. In addition a large number of the small culverts are in poor condition, and
therefore, there are needs totaling approximately $5.8 million to be addressed within the next 5 years. The
condition assessment data, along with risk management strategies, should be reviewed together to aid in
prioritizing overall needs for rehabilitation and replacement and assist with optimizing the long and short
term budgets. Further detail is outlined within the “asset management strategy” section of this AMP.
3.5.8 Recommendations The municipality received an overall rating of ‘D’ for its bridges & culverts, calculated from the Condition vs.
Performance and the Funding vs. Need ratings. Accordingly, we recommend the following:
1. The condition assessment data, along with risk management strategies, should be reviewed together to aid in prioritizing
overall needs for rehabilitation and replacement.
2. An appropriate % of asset replacement value should be used for operations and maintenance activities on an annual
basis. This should be determined through a detailed analysis of O & M activities and added to future AMP reporting.
3. The Infrastructure Report Card should be updated on an annual basis.

30
3.5 Water Infrastructure
F INFRASTRUCTURE REPORT CARD GRADE
3.6 Water Network

31
3.6 Water Network 3.6.1 What do we own? Township of Russell is responsible for the following asset inventory which includes approximately 73 km of
water mains and a 34km feeder main.
Water Network Inventory
Asset Type Asset Component Quantity
Water Network
Feedermain 33,887m
Hydrants 426 Units
Water Valves 748 Units
Yard Hydrant 13 Units
Water Tower – Around The Wt 2 Units
Water Tower – Barbwire 1,176m
Water Tower - Driveway 1,479m2
Water Tower - Electrical 3 Units
Water Tower - Fence 380m
Water Tower – Gate 29m2
Water Tower – Generator 3 Units
Water Tower – Loading Zone 271m2
Water Tower – Mechanical 3 Units
Water Tower – Olnd 3 Units
Water Tower – Parking Lot 4 Units
Water Tower – Scada 3 Units
Water Tower – Security Signs 6 Units
Water Tower – Structure 3 Units
Water Stamps 36 Units
Water Standpost 3,443 Units
Emr Reservoir – Electrical 3 Units
Emr Reservoir – Generator 4 Units
Emr Reservoir – Mechanical 68 Units
Emr Reservoir – Scada 3 Units
Emr Reservoir – Structure 6 Units
Service Pipes 34,790m
Forcemains (100mm) 145m
Forcemains (125mm) 151m
Forcemains (150mm) 687m
Forcemains (250mm) 3,034m
Forcemains (300mm) 4,873m
Forcemains (600mm) 720m
Forcemains (900mm) 760m
Watermains (150mm) 25,355m
Watermains (200mm) 22,866m
Watermains (300mm) 14,548m

32
The water network data was extracted from the Tangible Capital Asset module of the CityWide software
suite.
3.6.2 What is it worth? The estimated replacement value of the water network, in 2012 dollars, is approximately $79 million. The
cost per household for the water network is $17,508 based on 4,515 households.
Water Network Replacement Value
Asset Type Asset Component Quantity 2012 Unit
Replacement Cost
2012 Overall
Replacement Cost
Water
Network
Feedermain 33,887m $500/m $16,943,550
Hydrants 426 Units $5,000/unit $2,130,000
Water Valves 748 Units $2,875/unit $2,150,500
Yard Hydrant 13 Units $178/unit $2,314
Water Tower – Around The WT 2 Units $123,830/unit $247,660
Water Tower – Barbwire 1,176m $0.19/m $222
Water Tower - Driveway 1,479m2 $500/m2 $739,310
Water Tower - Electrical 3 Units $134,000/unit $402,000
Water Tower - Fence 380m $175/m $66,535
Water Tower – Gate 29m2 $36/m2 $1,050
Water Tower – Generator 3 Units $12,000/unit $36,000
Water Tower – Loading Zone 271m2 $506/m2 $137,160
Water Tower – Mechanical 3 Units $212,000/unit $636,000
Water Tower – OLND 3 Units $6,459/unit $19,378
Water Tower – Parking Lot 4 Units $100/unit $400
Water Tower – Scada 3 Units $44,333/unit $133,000
Water Tower – Security Signs 6 Units $50/unit $300
Water Tower – Structure 3 Units $1,186,667/unit $3,560,000
Water Stamps 36 Units $200/unit $7,200
Water Standpost 3,443 Units $200/unit $688,600
Emr Reservoir – Electrical 3 Units $707,667/unit $2,123,000
Emr Reservoir – Generator 4 Units $135,500/unit $542,000
Emr Reservoir – Mechanical 68 Units $38,726/unit $2,633,400
Emr Reservoir – Scada 3 Units $220,333/unit $661,000
Emr Reservoir – Structure 6 Units $567,000/unit $3,402,000
Service Pipes 34,790m $150/m $5,218,500
Forcemains (100mm) 145m $500/m $72,500
Forcemains (125mm) 151m $500/m $75,500
Forcemains (150mm) 687m $500/m $343,500
Forcemains (250mm) 3,034m $500/m $1,517,000
Forcemains (300mm) 4,873m $500/m $2,436,500
Forcemains (600mm) 720m $500/m $360,000
Forcemains (900mm) 760m $500/m $380,000
Watermains (150mm) 25,355m $500/m $12,677,500
Watermains (200mm) 22,866.2m $500/m $11,433,100
Watermains (300mm) 14,548m $500/m $7,274,000
$79,050,679

33
The pie chart below provides a breakdown of each of the network components to the overall system
value.
Water Network Components
3.6.3 What condition is it in? Based on assessed condition data, 64% of the municipality’s water mains are in fair to excellent condition,
with the remaining 36% in poor to critical condition. Based on replacement cost, 97% of the facilities assets
are in fair to excellent condition, while the remaining are in critical condition. As such, the municipality
received a Condition vs. Performance rating of ‘C’.
Water (Mains, Service Pipes, Forcemains, Feedermains) Condition by Length (metres)

34
Water Tower and Reservoir condition by Replacement Cost
3.6.4 What do we need to do to it? There are generally four distinct phases in an asset’s life cycle. These are presented at a high level for the
water network below. Further detail is provided in the “Asset Management Strategy” section of this AMP.
Addressing Asset Needs
Phase Lifecycle Activity Asset Age
Minor Maintenance Activities such as inspections, monitoring, cleaning and flushing,
hydrant flushing, pressure tests, visual inspections, etc.
1st Qtr
Major Maintenance Such events as repairing water main breaks, repairing valves,
replacing individual small sections of pipe etc.
2nd Qtr
Rehabilitation Rehabilitation events such as structural lining of pipes and a
cathodic protection program to slow the rate of pipe deterioration.
3rd Qtr
Replacement Pipe replacements 4th Qtr
3.6.5 When do we need to do it? For the purpose of this report “useful life” data for each asset class was obtained from the accounting data
within the CityWide software database. This proposed useful life is used to determine replacement needs of
individual assets, which are calculated in the system as part of the overall financial requirements.

35
Asset Useful Life in Years
Asset Type Asset Component Useful Life in Years
Water Network
Feedermain 40
Hydrants 50
Water Valves 40
Yard Hydrant 40
Water Tower - Around the WT 25
Water Tower - Around the WT 50
Water Tower - Barbwire 25
Water Tower - Driveway 25
Water Tower - Electrical 50
Water Tower - Fence 25
Water Tower - Gate 25
Water Tower - Generator 50
Water Tower - Loading Zone 25
Water Tower - Mechanical 50
Water Tower - OLND 50
Water Tower - Parking Lot 30
Water Tower - Scada 50
Water Tower - Security Signs 10
Water Tower - Structure 50
Water Stamps 50
Water Standpost 50
EMR Reservoir - Electrical 50
EMR RESERVOIR - Generator 50
EMR Reservoir - Mechanical 50
EMR RESERVOIR - Scada 50
EMR Reservoir - Structure 50
Service Pipes 50
Forcemains (100mm) 40
Forcemains (125mm) 40
Forcemains (150mm) 40
Forcemains (250mm) 40
Forcemains (300mm) 40
Forcemains (600mm) 40
Forcemains (900mm) 40
Watermains (150mm) 40
Watermains (200mm) 40
Watermains (300mm) 40

36
Water Network Replacement Profile
3.6.6 How much money do we need? The analysis completed to determine capital revenue requirements was based on the following
assumptions:
1. Replacement costs are based upon the unit costs identified within the “What is it worth” section above.
2. The timing for individual water main replacement was defined by the replacement year as described in the “When do you need to do it?” section above.
3. All values are presented in 2012 dollars.
4. The analysis was run for a 50 year period to ensure all assets went through at least one iteration of replacement, therefore providing a sustainable projection.
3.6.7 How do we reach sustainability? Based upon the above assumptions, the average annual revenue required to sustain Russell’s water
network is approximately $1,884,000. Based on Russell’s current annual funding of $267,000, there is a deficit $1,617,000. As such, the municipality received a Funding vs. Need rating of ‘F’. The following graph presents
five year blocks of expenditure requirements against the sustainable funding threshold line.

37
Sustainable Revenue Requirements
There are minimal needs to be addressed within the 5 year window, however, there are needs totaling over
$20 million in the 5 – 10 year window. The condition assessment data, along with risk management
strategies, should be reviewed together to aid in prioritizing overall needs for rehabilitation and
replacement and assist with optimizing the long and short term budgets. Further detail is outlined within the
“asset management strategy” section of this AMP.
3.6.8 Recommendations The municipality received an overall rating of ‘F’ for its water network, calculated from the Condition vs.
Performance and the Funding vs. Need ratings. Accordingly, we recommend the following:
1. The condition assessment data, along with risk management strategies, should be reviewed together to aid in prioritizing overall needs for rehabilitation and replacement.
2. The useful life projections used by the municipality should be reviewed for consistency with industry standards.
3. Also, a detailed study to define the current condition of the water facilities and their components (structural,
architectural, electrical, mechanical, process, etc.) should be undertaken, as collectively they account for
approximately 20% of the water infrastructure’s value.
4. Once the above studies are complete, a new performance age should be applied to each water main and an
updated “current state of the infrastructure” analysis should be generated.
5. An appropriate % of asset replacement value should be used for operations and maintenance activities on an annual
basis. This should be determined through a detailed analysis of O & M activities and be added to future AMP reporting.
6. The Infrastructure Report Card should be updated on an annual basis.
38
3.6 Sanitary Sewer Infrastructure
3.7 Sanitary Sewer Network
D INFRASTRUCTURE REPORT CARD GRADE

39
3.7 Sanitary Sewer Network 3.7.1 What do we own? The inventory components of the sanitary sewer network are outlined in the table below. The entire
Network consists of approximately 29km of sewer main.
Sanitary Sewer Network Inventory
Asset Type Asset Component Quantity/Units
Sanitary
Sewer
Network
Lagoon - Aerator 92 Units
Lagoon - Aluminium Building 12 Units
Lagoon - Blower Building 12 Units
Lagoon - Cells 11 Units
Lagoon - Chamber Valve 13 Units
Lagoon - Control Building 10 Units
Lagoon - Electrical 37 Units
Lagoon - Forcemain Connection 2 Units
Lagoon - Gate 25 Units
Lagoon - Knife Gate Valve 12 Units
Lagoon - Outlet Chamber 2 Units
Lagoon - Propane 8 Units
Sanitary Pipes 29,350m
The Sanitary Sewer Network data was extracted from the Tangible Capital Asset module of the CityWide
software application.
3.7.2 What is it worth? The estimated replacement value of the sanitary sewer network, in 2012 dollars, is approximately $22.3
million. The cost per household for the sanitary network is $4,946 based on 4,515 households.
Sanitary Sewer Network Replacement Value
Asset Type Asset Component Quantity 2012 Unit
Replacement Cost
2012 Overall
Replacement Cost
Sanitary
Sewer Network
Lagoon - Aerator 92 Units $75,971/unit $752,468
Lagoon - Aluminium Building 12 Units $36,222/unit $434,666
Lagoon - Blower Building 12 Units $25,372/unit $304,464
Lagoon - Cells 11 Units $1,364,427/unit $15,008,699
Lagoon - Chamber Valve 13 Units $20,571/unit $267,423
Lagoon - Control Building 10 Units $32,884/unit $328,842
Lagoon - Electrical 37 Units $100/unit $3,700
Lagoon - Forcemain Connection 2 Units $10,330/unit $20,660
Lagoon - Gate 25 Units $3,371/unit $84,286
Lagoon - Knife Gate Valve 12 Units $41,418/unit $497,016
Lagoon - Outlet Chamber 2 Units $111,438/unit $222,876
Lagoon - Propane 8 Units $500/unit $4,000
Sanitary Pipes 29,350m $150/m $4,402,500
$22,331,600

40
The pie chart below provides a breakdown of each of the network components to the overall system
value.
Sanitary Sewer Network Components
3.7.3 What condition is it in? Based on age data, 100% of the municipality’s sanitary sewer mains and facilities (based on replacement
cost) are in fair to excellent condition. As such, the municipality received a Condition vs. Performance
rating of ‘B’.
Sanitary Sewer Main Condition by Length (metres)

41
Sanitary Sewer Facilities Condition by Replacement Cost
3.7.4 What do we need to do to it? There are generally four distinct phases in an assets life cycle. These are presented at a high level for the
sanitary sewer network below. Further detail is provided in the “Asset Management Strategy” section of this
AMP.
Addressing Asset Needs
Phase Lifecycle Activity Asset Life Stage
Minor Maintenance Activities such as inspections, monitoring, cleaning and flushing, zoom
camera and CCTV inspections, etc.
1st Qtr
Major Maintenance Activities such as repairing manholes and replacing individual small
sections of pipe.
2nd Qtr
Rehabilitation Rehabilitation events such as structural lining of pipes are extremely cost
effective and provide an additional 75 plus years of life.
3rd Qtr
Replacement Pipe replacements 4th Qtr
3.7.5 When do we need to do it? For the purpose of this report “useful life” data for each asset class was obtained from the accounting data
within the CityWide software database. This proposed useful life is used to determine replacement needs of
individual assets, which are calculated in the system as part of the overall financial requirements.

42
Asset Useful Life in Years
Asset Type Asset Component Useful Life in Years
Sanitary Sewer
Network
Lagoon - Aerator 50
Lagoon - Aluminium Building 50
Lagoon - Blower Building 50
Lagoon - Cells 50
Lagoon - Chamber Valve 50
Lagoon - Control Building 50
Lagoon - Electrical 50
Lagoon - Forcemain Connection 50
Lagoon - Gate 50
Lagoon - Knife Gate Valve 50
Lagoon - Outlet Chamber 50
Lagoon - Propane 50
Sanitary Pipes 50
As additional field condition information becomes available in time, the data should be loaded into the
CityWide system in order to increasingly have a more accurate picture of current asset performance age
and, therefore, future replacement requirements. The following graph shows the current projection of
sanitary sewer main replacements based on the age of the asset only.
Sanitary Sewer Network Replacement Profile
3.7.6 How much money do we need? The analysis completed to determine capital revenue requirements was based on the following
assumptions:
1. Replacement costs are based upon the unit costs identified within the “What is it worth” section above.
2. The timing for individual sewer main replacement was defined by the replacement year as described in the “When do
you need to do it?” section above. 3. All values are presented in 2012 dollars.
4. The analysis was run for a 50 year period to ensure all assets went through at least one iteration of replacement,
therefore providing a sustainable projection.

43
3.7.7 How do we reach sustainability? Based upon the above assumptions, the average annual revenue required to sustain Russell’s sanitary
sewer network is approximately $447,000. Based on Russell’s current annual funding of $105,000, there is an annual deficit of $342,000. As such, the municipality received a Funding vs. Need rating of ‘F’. The following
graph presents five year blocks of expenditure requirements against the sustainable funding threshold line.
Sustainable Revenue Requirements
In conclusion, the sanitary sewer network, from an age based analysis only, is generally in good condition
and there is not a significant amount of replacement until 2017. It should be noted, however, that a
condition assessment program would outline any pipes that have accelerated deterioration and could be
good candidates for a rehabilitation program. This is discussed further in the Asset Management Strategy
portion of the Asset Management Plan.
3.7.8 Recommendations The municipality received an overall rating of ‘D’ for its sanitary sewer network, calculated from the
Condition vs. Performance and the Funding vs. Need ratings. Accordingly, we recommend the following:
1. A condition assessment program should be established for the sanitary sewer network to gain a better understanding of
current condition and performance as outlined further within the “Asset Management Strategy” section of this AMP.
2. Also, a detailed study to define the current condition of the lagoon and associated components should be undertaken,
as collectively they account for approximately 60% of the sanitary infrastructure’s value.
3. Once the above studies are complete or underway, the condition data should be loaded into the CityWide software
and an updated “current state of the infrastructure” analysis should be generated.
4. An appropriate % of asset replacement value should be used for operations and maintenance activities on an annual basis. This should be determined through a detailed analysis of O & M activities and be added to future AMP reporting.
5. The Infrastructure Report Card should be updated on an annual basis.

44
3.7 Storm Sewer Infrastructure
D INFRASTRUCTURE REPORT CARD GRADE
3.8 Storm Sewer Network

45
3.8 Storm Sewer Network 3.8.1 What do we own? The inventory components of the storm sewer collection system are outlined in the table below.
Storm Inventory (Detailed)
Asset Type Asset Component Quantity
Storm Sewer
Network
Catch Basin 1,334 Units
Manhole 572 Units
Ponds 1.6 Hectares
Service Storm Pipes 34,990m
Storm Pipe (100mm) 71.3m
Storm Pipe (125mm) 250m
Storm Pipe (150mm) 1,218.2m
Storm Pipe (200mm) 1,242m
Storm Pipe (225mm) 851.5m
Storm Pipe (250mm) 1,075.5m
Storm Pipe (300mm) 13,110.1m
Storm Pipe (375mm) 6,993.9m
Storm Pipe (400mm) 1,435.7m
Storm Pipe (450mm) 10,084.9m
Storm Pipe (500mm) 543.6m
Storm Pipe (525mm) 4,868.1m
Storm Pipe (575mm) 122m
Storm Pipe (600mm) 7,281.8m
Storm Pipe (675mm) 1,986.3m
Storm Pipe (750mm) 2,510.1m
Storm Pipe (825mm) 229.5m
Storm Pipe (900mm) 1,109.6m
Storm Pipe (1000mm) 290m
Storm Pipe (1050mm) 416.7m
Storm Pipe (1200mm) 100m
Storm Pipe (1800mm) 50m

46
The storm sewer network data was extracted from the Tangible Capital Asset module of the CityWide
software suite.
3.8.2 What is it worth? The estimated replacement value of the storm sewer network, in 2012 dollars, is approximately $25.6 million.
The cost per household for the storm sewer network is $5,676 based on 4,515 households.
Storm Replacement Value
Asset Type Asset Component Quantity 2012 Unit Replacement
Cost 2012 Overall Replacement
Cost
Storm
Sewer
Network
Catch Basin 1,334 Units $4,066/Unit $5,424,044
Manhole 572 Units $4,696/Unit $2,686,112
Ponds 1.6 Hectares - Not Planned For Replacement
Service Storm Pipes 34,990m $1,500/m $5,248,500
Storm Pipe (100mm) 71.3m $117/m $8,342
Storm Pipe (125mm) 250m $125/m $31,250
Storm Pipe (150mm) 1,218.2m $119/m $145,117
Storm Pipe (200mm) 1,242m $117/m $145,313
Storm Pipe (225mm) 851.5m $117/m $99,625
Storm Pipe (250mm) 1,075.5m $117/m $125,832
Storm Pipe (300mm) 13,110.1m $129/m $1,691,128
Storm Pipe (375mm) 6,993.9m $148/m $1,034,115
Storm Pipe (400mm) 1,435.7m $184/m $264,157
Storm Pipe (450mm) 10,084.9m $174/m $1,753,544
Storm Pipe (500mm) 543.6m $192/m $104,400
Storm Pipe (525mm) 4,868.1m $204/m $991,010
Storm Pipe (575mm) 122m $200/m $24,400
Storm Pipe (600mm) 7,281.8m $266/m $1,940,076
Storm Pipe (675mm) 1,986.3m $306/m $608,674
Storm Pipe (750mm) 2,510.1m $410/m $1,029,420
Storm Pipe (825mm) 229.5m $396/m $90,882
Storm Pipe (900mm) 1,109.6m $622/m $689,962
Storm Pipe (1000mm) 290m $664/m $192,470
Storm Pipe (1050mm) 416.7m $678/m $282,523
Storm Pipe (1200mm) 100m $4,696/m $469,600
Storm Pipe (1800mm) 50m $10,957/m $547,850
$25,628,345

47
The pie chart below provides a breakdown of each of the network components to the overall system
value.
Storm Network Components
3.8.3 What condition is it in? Based on condition data, less than 60% of the municipality’s storm sewer mains are in fair to excellent
condition, with the remaining in poor to critical. Further, approximately 60% of the appurtenances are in fair
to excellent condition with the remaining in poor to critical. As such, the municipality received a Condition
vs. Performance rating of ‘D+’.
Storm pipes and services pipes Condition by Length (metres)

48
Catch Basins and Manhole Condition by Units
3.8.4 What do we need to do to it? There are generally four distinct phases in an assets life cycle. These are presented at a high level for the
storm sewer network below. Further detail is provided in the “Asset Management Strategy” section of this
AMP.
Addressing Asset Needs
Phase Lifecycle Activity Asset Age
Minor Maintenance Activities such as inspections, monitoring, cleaning and flushing, zoom
camera and CCTV inspections, etc. 1st Qtr
Major Maintenance Activities such as repairing manholes and replacing individual small
sections of pipe. 2nd Qtr
Rehabilitation Rehabilitation events such as structural lining of pipes are extremely
cost effective and provide an additional 75 plus years of life. 3rd Qtr
Replacement Pipe replacements 4th Qtr
3.8.5 When do we need to do it? For the purpose of this report “useful life” data for each asset class was obtained from the accounting data
within the CityWide software database. This proposed useful life is used to determine replacement needs of
individual assets, which are calculated in the system as part of the overall financial requirements.

49
Asset Useful Life
Asset Type Asset Component Useful Life
Storm
Storm Pipe (Less Than 450mm) 40
Storm Pipe (Larger Than 450mm) 40
Service Storm Pipes 50
As field condition information, e.g., on storm mains, becomes available in time, the data should be loaded
into the CityWide system in order to increasingly have a more accurate picture of current asset
performance age and, therefore, future replacement requirements. The following graph shows the current
projection of storm sewer main replacements based on the age of the asset only.
Storm Sewer Network Replacement Profile
3.8.6 How much money do we need? The analysis completed to determine capital revenue requirements was based on the following
assumptions:
1. Replacement costs are based upon the unit costs identified within the “What is it worth” section above.
2. The timing for individual storm sewer main replacement was defined by the replacement year as described in the “When
do you need to do it?” section above. 3. All values are presented in 2012 dollars.
4. The analysis was run for a 50 year period to ensure all assets went through one iteration of replacement, therefore
providing a sustainable projection.

50
3.8.7 How do we reach sustainability? Based upon the above assumptions, the average annual revenue required to sustain Russell’s storm sewer
network is approximately $615,000. Based on Russell’s current annual funding of $334,000, there is an annual deficit of $281,000. As such, the municipality received a Funding vs. Need rating of ‘D’.
Storm Sewer Main Replacement Profile
In conclusion, the analysis was run using condition assessment data for the catch basins and manholes and
age based data for all other storm assets including mains and services. Russell’s storm sewer collection
network has a significant portion of assets in poor and critical condition. Although there are no funding
requirements in the first 5 years, the following 5 years has a very significant spike of replacement
requirements totaling approximately $14 million. Future funds should be directed towards a condition
assessment program for the storm mains and services to gain a better understanding of current
performance. A condition assessment program will aid in prioritizing overall needs for rehabilitation and
replacement and will assist with optimizing the long term budget. Further detail is outlined within the “asset
management strategy” section of this AMP.
3.8.8 Recommendations The municipality received an overall rating of ‘D’ for its storm sewer network, calculated from the Condition
vs. Performance and the Funding vs. Need ratings. Accordingly, we recommend the following:
1. A condition assessment program should be established for the storm sewer network to gain a better understanding of
current condition and performance as outlined further within the “Asset Management Strategy” section of this AMP.
2. Once the above study is complete or underway, the condition data should be loaded into the CityWide software and
an updated “current state of the infrastructure” analysis should be generated.
3. An appropriate % of asset replacement value should be used for operations and maintenance activities on an annual
basis. This should be determined through a detailed analysis of O & M activities and be added to future AMP reporting.
4. The Infrastructure Report Card should be updated on an annual basis.

51
4.0 Infrastructure Report Card
CUMULATIVE GPA
D
Infrastructure Report Card The Township of Russell
1. Each asset category was rated on two key, equally weighted (50/50) dimensions: Condition vs. Performance, and Funding vs. Need.
2. See the “What condition is it in?” section for details on the grade of each asset category on the Condition vs. Performance dimension.
3. See the “How do we reach sustainability?” section for details on the grade of each asset category on the Funding vs. Need dimension.
4. The ‘Overall Rating’ below is the average of the two ratings.
Asset Category
Condition vs. Performance
Funding vs. Need
Overall Grade
Comments
Road
Network B F D+ Based on assessed condition data, nearly 93% of the municipality’s road
network is in fair to excellent condition. The average annual revenue
required to sustain Russell’s paved road network is approximately
$1,437,000. Based on Russell’s current annual funding of $657,000, there is an annual deficit of $780,000.
Bridges &
Culverts
B F D Based on assessed condition data, more than 90% of the bridges & culverts
are in fair to excellent condition. The average annual revenue required to
sustain Russell’s bridges & culverts is $526,000. Based on Russell’s current annual funding of $35,000, there is an annual deficit of $491,000.
Water
Network C F F
Based on assessed condition data, 64% of the municipality’s water mains
are in fair to excellent condition, with the remaining 36% in poor to critical
condition. Based on replacement cost, 97% of the facilities assets are in fair
to excellent condition, while the remaining are in critical condition. The average annual revenue required to sustain Russell’s water network is
approximately $1,884,000. Based on Russell’s current annual funding of $267,000, there is a deficit $1,617,000.
Sanitary
Sewer Network
B F D Based on age data, 100% of the municipality’s sanitary sewer mains and
facilities (based on replacement cost) are in fair to excellent condition.
The average annual revenue required to sustain Russell’s sanitary sewer network is approximately $447,000. Based on Russell’s current annual funding of $105,000, there is an annual deficit of $342,000.
Storm
Sewer
Network D+ D D
Based on condition data, less than 60% of the municipality’s storm sewer
mains are in fair to excellent condition, with the remaining in poor to critical. Further, approximately 60% of the appurtenances are in fair to
excellent condition with the remaining in poor to critical. The average
annual revenue required to sustain Russell’s storm sewer network is
approximately $615,000. Based on Russell’s current annual funding of $334,000, there is an annual deficit of $281,000.

52
5.0 Desired Levels of Service
Desired levels of service are high level indicators, comprising many factors, as listed below, that establish
defined quality thresholds at which municipal services should be supplied to the community. They support
the organisation’s strategic goals and are based on customer expectations, statutory requirements,
standards, and the financial capacity of a municipality to deliver those levels of service.
Levels of Service are used: � to inform customers of the proposed type and level of service to be offered;
� to identify the costs and benefits of the services offered;
� to assess suitability, affordability and equity of the services offered; � as a measure of the effectiveness of the asset management plan
� as a focus for the AM strategies developed to deliver the required level of service
In order for a municipality to establish a desired level of service, it will be important to review the key factors
involved in the delivery of that service, and the interactions between those factors. In addition, it will be
important to establish some key performance metrics and track them over an annual cycle to gain a
better understanding of the current level of service supplied.
Within this first Asset Management Plan, key factors affecting level of service will be outlined below and
some key performance indicators for each asset type will be outlined for further review. This will provide a
framework and starting point from which the municipality can determine future desired levels of service for
each infrastructure class.
5.1 Key factors that influence a level of service:
� Strategic and Corporate Goals � Legislative Requirements
� Expected Asset Performance
� Community Expectations
� Availability of Finances
5.1.1 Strategic and Corporate Goals Infrastructure levels of service can be influenced by strategic and corporate goals. Strategic plans spell out
where an organization wants to go, how it’s going to get there, and helps decide how and where to
allocate resources, ensuring alignment to the strategic priorities and objectives . It will help identify priorities
and guide how municipal tax dollars and revenues are spent into the future. The level of importance that a
community’s vision is dependent upon infrastructure, will ultimately affect the levels of service provided or
those levels that it ultimately aspires to deliver.
5.1.2 Legislative Requirements Infrastructure levels of service are directly influenced by many legislative and regulatory requirements. For
instance, the Safe Drinking Water Act, the Minimum Maintenance Standards for municipal highways,
building codes, and the Accessibility for Ontarians with Disabilities Act are all legislative requirements that
prevent levels of service from declining below a certain standard.
5.1.3 Expected Asset Performance A level of service will be affected by current asset condition, and performance and limitations in regards to safety, capacity, and the ability to meet regulatory and environmental requirements. In addition, the
design life of the asset, the maintenance items required, the rehabilitation or replacement schedule of the
asset, and the total costs, are all critical factors that will affect the level of service that can be provided.
5.1.4 Community Expectations Levels of services are directly related to the expectations that the general public has from the
infrastructure. For example, the public will have a qualitative opinion on what an acceptable road looks
like, and a quantitative one on how long it should take to travel between two locations. Infrastructure costs

53
are projected to increase dramatically in the future, therefore it is essential that the public is not only
consulted, but also be educated, and ultimately make choices with respect to the service levels that they
wish to pay for.
5.1.5 Availability of Finances Availability of finances will ultimately control all aspects of a desired level of service. Ideally, these funds
must be sufficient to achieve corporate goals, meet legislative requirements, address an asset’s life cycle
needs, and meet community expectations. Levels of service will be dictated by availability of funds or elected officials’ ability to increase funds, or the community’s willingness to pay.
5.2 Key Performance Indicators Performance measures or key performance indicators (KPIs) that track levels of service should be specific,
measurable, achievable, relevant, and timebound (SMART). Many good performance measures can be
established and tracked through the CityWide suite of software products. In this way, through automation,
results can be reviewed on an annual basis and adjustments can be made to the overall asset
management plan, including the desired level of service targets.
In establishing measures, a good rule of thumb to remember is that maintenance activities ensure the performance of an asset and prevent premature aging, whereas rehab activities extend the life of an
asset. Replacement activities, by definition, renew the life of an asset. In addition, these activities are
constrained by resource availability (in particular, finances) and strategic plan objectives. Therefore,
performance measures should not just be established for operating and maintenance activities, but also for
the strategic, financial, and tactical levels of the asset management program. This will assist all levels of
program delivery to review their performance as part of the overall level of service provided.
This is a very similar approach to the “balanced score card” methodology, in which financial and non-
financial measures are established and reviewed to determine whether current performance meets
expectations. The “balanced score card”, by design, links day to day operations activities to tactical and
strategic priorities in order to achieve an overall goal, or in this case, a desired level of service.
The structure of accountability and level of indicator with this type of process is represented in the following
table, modified from the InfraGuide’s best practice document, “Developing Indicators and Benchmarks”
published in April 2003.

54
As a note, a caution should be raised over developing too many performance indicators that may result in
data overload and lack of clarity. It is better to develop a select few that focus in on the targets of the
asset management plan.
Outlined below for each infrastructure class is a suggested service description, suggested service scope,
and suggested performance indicators. These should be reviewed and updated in each iteration of the
AMP.
5.3 Transportation Services
5.3.1 Service Description The municipality’s transportation network comprises approximately 238 centreline km of road, of which
approximately 63 km are gravel/earth and 175km are paved roads. The transport network also includes 14
bridges, 11 large culverts, 27km of sidewalk, and the associated signs, traffic signals and street lights.
Together, the above infrastructure enables the Municipality to deliver transportation and pedestrian facility
services and give people a range of options for moving about in a safe and efficient manner.
STRATEGIC
COUNCIL
CAO
CITY ENGINEER TACTICAL
TACTICAL &
OPERATIONAL
OPERATIONAL WATER
DEPARTMENT
ROAD
DEPARTMENT
WATER
MANAGER ROAD MANAGER
LEVEL OF INDICATOR MUNICIPAL STRUCTURE

55
5.3.2 Scope of Services
� Movement – providing for the movement of people and goods.
� Access – providing access to residential, commercial, and industrial properties and other community amenities. � Recreation –providing for recreational use, such as walking, cycling, or special events such as parades.
5.3.3 Performance Indicators (reported annually)
Performance Indicators (reported annually)
Strategic Indicators
� percentage of total reinvestment compared to asset replacement value
� completion of strategic plan objectives (related to transportation)
Financial Indicators
� annual revenues compared to annual expenditures
� annual replacement value depreciation compared to annual expenditures
� total cost of borrowing compared to total cost of service
� revenue required to maintain annual network growth
Tactical Indicators
� percentage of road network rehabilitated / reconstructed
� value of bridge / large culvert structures rehabilitated or reconstructed
� overall road condition index as a percentage of desired condition index
� overall bridge condition index as a percentage of desired condition index
� annual adjustment in condition indexes
� annual percentage of network growth
� percent of paved road lane km where the condition is rated poor or critical
� number of bridge / large culvert structures where the condition is rated poor or
critical
� percentage of road network replacement value spent on operations and
maintenance
� percentage of bridge / large culvert structures replacement value spent on
operations and maintenance
Operational Indicators
� percentage of road network inspected within last 5 years
� percentage of bridge / large culvert structures inspected within last two years
� operating costs for paved roads per lane km
� operating costs for gravel roads per lane km
� operating costs for bridge / large culvert structures per square metre
� number of customer requests received annually
� percentage of customer requests responded to within 24 hours
5.4 Water / Sanitary / Storm Networks
5.4.1 Service Description The municipality’s water distribution network comprises 73km of water main, 34km of feeder mains, valves,
hydrants, reservoirs and a water tower. The waste water network comprises 29km of sanitary sewer main
and a lagoon. The storm water network comprises 56km of storm main, catch basins, manholes and ponds..
Together, the above infrastructure enables the municipality to deliver a potable water distribution service,
and a waste water and storm water collection service to the residents of the municipality.

56
5.4.2 Scope of services
� The provision of clean safe drinking water through a distribution network of water mains and pumps. � The removal of waste water through a collection network of sanitary sewer mains.
� The removal of storm water through a collection network of storm sewer mains, and catch basins
5.4.3 Performance Indicators (reported annually)
Performance Indicators (reported annually)
Strategic Indicators
� Percentage of total reinvestment compared to asset replacement value
� Completion of strategic plan objectives (related water / sanitary / storm)
Financial Indicators
� Annual revenues compared to annual expenditures
� Annual replacement value depreciation compared to annual expenditures
� Total cost of borrowing compared to total cost of service
� Revenue required to maintain annual network growth
� Lost revenue from system outages
Tactical Indicators
� Percentage of water / sanitary / storm network rehabilitated / reconstructed
� Overall water / sanitary / storm network condition index as a percentage of desired
condition index
� Annual adjustment in condition indexes
� Annual percentage of growth in water / sanitary / storm network
� Percentage of mains where the condition is rated poor or critical for each network
� Percentage of water / sanitary / storm network replacement value spent on
operations and maintenance
Operational Indicators
� Percentage of water / sanitary / storm network inspected
� Operating costs for the collection of wastewater per kilometre of main.
� Number of wastewater main backups per 100 kilometres of main
� Operating costs for storm water management (collection, treatment, and disposal)
per kilometre of drainage system.
� Operating costs for the distribution/ transmission of drinking water per kilometre of
water distribution pipe.
� Number of days when a boil water advisory issued by the medical officer of health,
applicable to a municipal water supply, was in effect.
� Number of water main breaks per 100 kilometres of water distribution pipe in a
year.
� Number of customer requests received annually per water / sanitary / storm
networks
� Percentage of customer requests responded to within 24 hours per water / sanitary
/ storm network
57
6.0 Asset Management Strategy
6.1 Objective To outline and establish a set of planned actions, based on best practice, that will enable the assets to
provide a desired and sustainable level of service, while managing risk, at the lowest life cycle cost.
The Asset Management Strategy will develop an implementation process that can be applied to the needs identification and prioritization of renewal, rehabilitation, and maintenance activities. This will assist in the
production of a 10 year plan, including growth projections, to ensure the best overall health and
performance of the municipality’s infrastructure.
This section includes an overview of condition assessment techniques for each asset class; the life cycle
interventions required, including interventions with the best ROI; and prioritization techniques, including risk,
to determine which priority projects should move forward into the budget first.
6.2 Non-Infrastructure Solutions and Requirements
The municipality should explore, as requested through the provincial requirements, which non-infrastructure
solutions should be incorporated into the budgets for the road, water, sewer (sanitary and storm), and bridges & culverts programs. Non- Infrastructure solutions are such items as studies, policies, condition
assessments, consultation exercises, etc., that could potentially extend the life of assets or lower total asset
program costs in the future.
Typical solutions for a municipality include linking the asset management plan to the strategic plan, growth
and demand management studies, infrastructure master plans, better integrated infrastructure and land
use planning, public consultation on levels of service, and condition assessment programs. As part of future
asset management plans, a review of these requirements should take place, and a portion of the capital
budget should be dedicated for these items in each programs budget.
It is recommended, under this category of solutions, that the municipality implement holistic condition
assessment programs for their road, water, sanitary, and storm sewer networks. This will lead to higher
understanding of infrastructure needs, enhanced budget prioritization methodologies, and a clearer path
of what is required to achieve sustainable infrastructure programs.
6.3 Condition Assessment Programs
The foundation of good asset management practice is based on having comprehensive and reliable
information on the current condition of the infrastructure. Municipalities need to have a clear
understanding regarding performance and condition of their assets, as all management decisions
regarding future expenditures and field activities should be based on this knowledge. An incomplete
understanding about an asset may lead to its premature failure or premature replacement.
Some benefits of holistic condition assessment programs within the overall asset management process are
listed below:
� Understanding of overall network condition leads to better management practices
� Allows for the establishment of rehabilitation programs
� Prevents future failures and provides liability protection � Potential reduction in operation / maintenance costs
� Accurate current asset valuation
� Allows for the establishment of risk assessment programs
� Establishes proactive repair schedules and preventive maintenance programs � Avoids unnecessary expenditures

58
� Extends asset service life therefore improving level of service
� Improves financial transparency and accountability � Enables accurate asset reporting which, in turn, enables better decision making
Condition assessment can involve different forms of analysis such as subjective opinion, mathematical
models, or variations thereof, and can be completed through a very detailed or very cursory approach.
When establishing the condition assessment of an entire asset class, the cursory approach (metrics such as
good, fair, poor, critical) is used. This will be a less expensive approach when applied to thousands of
assets, yet will still provide up to date information, and will allow for detailed assessment or follow up
inspections on those assets captured as poor or critical condition later.
The following section outlines condition assessment programs available for road, bridge, sewer, and water
networks that would be useful for the municipality.
6.3.1 Pavement Network Inspections Typical industry pavement inspections are performed by consulting firms using specialised assessment
vehicles equipped with various electronic sensors and data capture equipment. The vehicles will drive the
entire road network and typically collect two different types of inspection data – surface distress data and
roughness data.
Surface distress data involves the collection of multiple industry standard surface distresses, which are
captured either electronically, using sensing detection equipment mounted on the van, or visually, by the
van's inspection crew. Examples of surface distresses are:
� For asphalt surfaces alligator cracking; distortion; excessive crown; flushing; longitudinal cracking; map cracking; patching; edge cracking;
potholes; ravelling; rippling; transverse cracking; wheel track rutting
� For concrete surfaces coarse aggregate loss; corner 'C' and 'D' cracking; distortion; joint faulting; joint sealant loss; joint spalling; linear cracking;
patching; polishing; potholes; ravelling; scaling; transverse cracking
Roughness data capture involves the measurement of the roughness of the road, measured by lasers that
are mounted on the inspection van's bumper, calibrated to an international roughness index.
Most firms will deliver this data to the client in a database format complete with engineering algorithms
and weighting factors to produce an overall condition index for each segment of roadway. This type of
scoring database is ideal for upload into the CityWide software database, in order to tag each road with a
present condition and then further life cycle analysis to determine what activity should be completed on
which road, in what timeframe, and to calculate the cost for the work will be completed within the
CityWide system.
The above process is an excellent way to capture road condition as the inspection trucks will provide
detailed surface and roughness data for each road segment, and often include video or street imagery. A
very rough industry estimate of cost would be about $100 per centreline km of road, which means it would
cost the municipality approximately $5,600 for the 56 centreline km of paved road network.
Another option for a cursory level of condition assessment is for municipal road crews to perform simple
windshield surveys as part of their regular patrol. Many municipalities have created data collection
inspection forms to assist this process and to standardize what presence of defects would constitute a
good, fair, poor, or critical score. Lacking any other data for the complete road network, this can still be
seen as a good method and will assist greatly with the overall management of the road network. The
CityWide Works software has a road patrol component built in that could capture this type of inspection
data during road patrols in the field, enabling later analysis of rehabilitation and replacement needs for
budget development.

59
It is recommended that the municipality establish a pavement condition assessment program and that a
portion of capital funding is dedicated to this.
6.3.2 Bridges & Culverts (greater than 3m) Inspections Ontario municipalities are mandated by the Ministry of Transportation to inspect all structures that have a
span of 3 metres or more, according to the OSIM (Ontario Structure Inspection Manual). At present, in the
municipality, there are 25 structures that meet this criterion.
Structure inspections must be performed by, or under the guidance of, a structural engineer, must be
performed on a biennial basis (once every two years), and include such information as structure type,
number of spans, span lengths, other key attribute data, detailed photo images, and structure element by
element inspection, rating and recommendations for repair, rehabilitation, and replacement.
The best approach to develop a 10 year needs list for the municipality’s structure portfolio would be to
have the structural engineer who performs the inspections to develop a maintenance requirements report,
and rehabilitation and replacement requirements report as part of the overall assignment. In addition to
refining the overall needs requirements, the structural engineer should identify those structures that will
require more detailed investigations and non-destructive testing techniques. Examples of these
investigations are:
� Detailed deck condition survey
� Non-destructive delamination survey of asphalt covered decks
� Substructure condition survey � Detailed coating condition survey
� Underwater investigation
� Fatigue investigation
� Structure evaluation
Through the OSIM recommendations and additional detailed investigations, a 10 year needs list will be
developed for the municipality’s bridges.
The 10 year needs list developed could then be further prioritized using risk management techniques to
better allocate resources. Also, the results of the OSIM inspection for each structure, whether BCI (bridge
condition index) or general condition (good, fair, poor, critical) should be entered into the CityWide
software to update results and analysis for the development of the budget.
6.3.3 Sewer Network Inspections (Sanitary & Storm) The most popular and practical type of sanitary and storm sewer assessment is the use of Closed Circuit
Television Video (CCTV). The process involves a small robotic crawler vehicle with a CCTV camera
attached that is lowered down a maintenance hole into the sewer main to be inspected. The vehicle and
camera then travels the length of the pipe providing a live video feed to a truck on the road above where
a technician / inspector records defects and information regarding the pipe. A wide range of construction
or deterioration problems can be captured including open/displaced joints, presence of roots, infiltration &
inflow, cracking, fracturing, exfiltration, collapse, deformation of pipe and more. Therefore, sewer CCTV
inspection is a very good tool for locating and evaluating structural defects and general condition of
underground pipes.
Even though CCTV is an excellent option for inspection of sewers it is a fairly costly process and does take
significant time to inspect a large volume of pipes.
Another option in the industry today is the use of Zoom Camera equipment. This is very similar to traditional CCTV, however, a crawler vehicle is not used but in it’s a place a camera is lowered down a maintenance
hole attached to a pole like piece of equipment. The camera is then rotated towards each connecting
pipe and the operator above progressively zooms in to record all defects and information about each
pipe. The downside to this technique is the further down the pipe the image is zoomed, the less clarity is
available to accurately record defects and measurement. The upside is the process is far quicker and
significantly less expensive and an assessment of the manhole can be provided as well. Also, it is important
to note that 80% of pipe deficiencies generally occur within 20 metres of each manhole. The following is a
list of advantages of utilizing Zoom Camera technology:

60
� A time and cost efficient way of examining sewer systems;
� Problem areas can be quickly targeted; � Can be complemented by a conventional camera (CCTV), if required afterwards;
� In a normal environment, 20 to 30 manholes can be inspected in a single day, covering more than 1,500 meters of pipe;
� Contrary to the conventional camera approach, cleaning and upstream flow control is not required prior to inspection;
� Normally detects 80% of pipe deficiencies, as most deficiencies generally occur within 20 meters of manholes.
The following table is based on general industry costs for traditional CCTV inspection and Zoom Camera
inspection; however, costs should be verified through local contractors. It is for illustrative purposes only but
supplies a general idea of the cost to inspect Russell’s entire sanitary and storm networks.
Sanitary and Sewer Inspection Cost Estimates
Sewer Network Assessment Activity Cost Metres of Main / # of Manholes Total
Sanitary Full CCTV $10 (per m) 29,000 m $290,000
Zoom $300 (per mh) 363 manholes (estimated)* $108,900
Storm
Full CCTV $10 (per m) 56,000 m $560,000
Zoom $300 (Per mh) 572 manholes $171,600
*manholes estimated by using one manhole per 80 metres of main
It can be seen from the above table that there is a significant cost savings achieved through the use of
Zoom Camera technology. A good industry trend and best practice is to inspect the entire network using
Zoom Camera technology and follow up on the poor and critical rated pipes with more detail using a full
CCTV inspection. In this way, inspection expenditures are kept to a minimum, however, an accurate
assessment on whether to rehabilitate or replace pipes will be provided for those with the greatest need.
It is recommended that the municipality establish a sewer condition assessment program and that a
portion of capital funding is dedicated to this.
In addition to receiving a video and defect report of each pipe’s CCTV or Zoom camera inspection, many
companies can now provide a database of the inspection results, complete with scoring matrixes that
provide an overall general condition score for each pipe segment that has been assessed. Typically pipes
are scored from 1 – 5, with 1 being a relatively new pipe and 5 being a pipe at the end of its design life. This
type of scoring database is ideal for upload into the CityWide software database, in order to tag each
pipe with a present condition and then further life cycle analysis to determine what activity should be done
to which pipe, in what timeframe, and to calculate the cost for the work will be completed by the
CityWide system.
6.3.4 Water network inspections Unlike sewer mains, it is very difficult to inspect water mains from the inside due to the high pressure flow of
water constantly underway within the water network. Physical inspections require a disruption of service to
residents, can be an expensive exercise, and are time consuming to set up. It is recommended practice
that physical inspection of water mains typically only occurs for high risk, large transmission mains within the
system, and only when there is a requirement. There are a number of high tech inspection techniques in
the industry for large diameter pipes but these should be researched first for applicability as they are quite
expensive. Examples are:
� Remote eddy field current (RFEC)
� Ultrasonic and acoustic techniques
� Impact echo (IE)
� Georadar
For the majority of pipes within the distribution network gathering key information in regards to the main
and its environment can supply the best method to determine a general condition. Key data that could be
used, along with weighting factors, to determine an overall condition score are listed below.

61
� Age
� Material Type � Breaks
� Hydrant Flow Inspections
� Soil Condition
Understanding the age of the pipe will determine useful life remaining, however, water mains fail for many
other reasons than just age. The pipe material is important to know as different pipe types have different
design lives and different deterioration profiles. Keeping a water main break history is one of the best
analysis tools to predict future pipe failures and to assist with programming rehabilitation and replacement
schedules. Also, most municipalities perform hydrant flow tests for fire flow prevention purposes. The
readings from these tests can also help determine condition of the associated water main. If a hydrant has
a relatively poor flow condition it could be indicative of a high degree of encrustation within the attached
water main, which could then be flagged as a candidate for cleaning or possibly lining. Finally, soil
condition is important to understand as certain soil types can be very aggressive at causing deterioration
on certain pipe types.
It is recommended that the municipality develop a rating system for the mains within the distribution
network based on the availability of key data, and that funds are budgeted for this development.
Also, it is recommended that the municipality utilize the CityWide Works application to track water main
break work orders and hydrant flow inspection readings as a starting point to develop a future scoring
database for each water main.

62
6.4 AM Strategy – Life Cycle Analysis Framework
An industry review was conducted to determine which life cycle activities can be applied at the
appropriate time in an asset’s life, to provide the greatest additional life at the lowest cost. In the asset
management industry, this is simply put as doing the right thing to the right asset at the right time. If these
techniques are applied across entire asset networks or portfolios (e.g., the entire road network), the
municipality could gain the best overall asset condition while expending the lowest total cost for those
programs.
6.4.1 Paved Roads The following analysis has been conducted at a fairly high level, using industry standard activities and costs
for paved roads. With future updates of this Asset Management Strategy, the municipality may wish to run
the same analysis with a detailed review of municipality activities used for roads and the associated local
costs for those work activities. All of this information can be input into the CityWide software suite in order to
perform updated financial analysis as more detailed information becomes available.
The following diagram depicts a general deterioration profile of a road with a 30 year life.
As shown above, during the road’s life cycle there are various windows available for work activity that will
maintain or extend the life of the asset. These windows are: maintenance; preventative maintenance;
rehabilitation; and replacement or reconstruction.

63
The windows or thresholds for when certain work activities should be applied to also coincide
approximately with the condition state of the asset as shown below:
Asset Condition and Related Work Activity: Paved Roads
Condition Condition Range Work Activity
excellent condition (Maintenance only phase) 100-76 � maintenance only
good Condition (Preventative maintenance phase) 75 - 51 � crack sealing � emulsions
fair Condition (Rehabilitation phase) 50 -26
� resurface - mill & pave
� resurface - asphalt overlay
� single & double surface treatment (for rural roads)
poor Condition (Reconstruction phase) 25 - 1 � reconstruct - pulverize and pave � reconstruct - full surface and base
reconstruction
critical Condition (Reconstruction phase)
0
� critical includes assets beyond their useful
lives which make up the backlog. They
require the same interventions as the “poor” category above.
With future updates of this Asset Management Strategy the municipality may wish to review the above
condition ranges and thresholds for when certain types of work activity occur, and adjust to better suit the
municipality’s work program. Also note: when adjusting these thresholds, it actually adjusts the level of
service provided and ultimately changes the amount of money required. These threshold and condition
ranges can be easily updated with the CityWide software suite and an updated financial analysis can be
calculated. These adjustments will be an important component of future Asset Management Plans, as the Province requires each municipality to present various management options within the financing plan.
The table below outlines the costs for various road activities, the added life obtained for each, the
condition range at which they should be applied, and the cost of 1 year added life for each (cost of
activity / added life) in order to present an apples to apples comparison.
Road Lifecycle Activity Options
Treatment Average Unit Cost
(per sq. m)
Added Life
(Years)
Condition
Range Cost Of Activity/Added Life
Urban Reconstruction $205 30 25 - 0 $6.83
Urban Resurfacing $84 15 50 - 26 $5.60
Rural Reconstruction $135 30 25 - 0 $4.50
Rural Resurfacing $40 15 50 - 26 $2.67
Double Surface Treatment $25 10 50 - 26 $2.50
Routing & Crack Sealing (P.M) $2 3 75 - 51 $0.67

64
As can be seen in the table above, preventative maintenance activities such as routing and crack sealing
have the lowest associated cost (per sq. m) in order to obtain one year of added life. Of course,
preventative maintenance activities can only be applied to a road at a relatively early point in the life
cycle. It is recommended that the municipality engage in an active preventative maintenance program
for all paved roads and that a portion of the maintenance budget is allocated to this.
Also, rehabilitation activities, such as urban and rural resurfacing or double surface treatments (tar and
chip) for rural roads have a lower cost to obtain each year of added life than full reconstruction activities. It
is recommended, if not in place already, that the municipality engages in an active rehabilitation program
for urban and rural paved roads and that a portion of the capital budget is dedicated to this.
Of course, in order to implement the above programs it will be important to also establish a general condition score for each road segment, established through standard condition assessment protocols as
previously described.
It is important to note that a “worst first” budget approach, whereby no life cycle activities other than
reconstruction at the end of a roads life are applied, will result in the most costly method of managing a
road network overall.
6.4.2 Gravel Roads The life cycle activities required for these roads are quite different from paved roads. Gravel roads require
a cycle of perpetual maintenance, including general re-grading, reshaping of the crown and cross
section, gravel spot and section replacement, dust abatement and ditch clearing and cleaning.
Gravel roads can require frequent maintenance, especially after wet periods and when accommodating
increased traffic. Wheel motion shoves material to the outside (as well as in-between travelled lanes),
leading to rutting, reduced water-runoff, and eventual road destruction if unchecked. This deterioration
process is prevented if interrupted early enough, simple re-grading is sufficient, with material being pushed
back into the proper profile.
As a high proportion of gravel roads can have a significant impact on the maintenance budget, it is
recommended that with further updates of this asset management plan the municipality study the traffic
volumes and maintenance requirements in more detail for its gravel road network.
Similar studies elsewhere have found converting certain roadways to paved roads can be very cost
beneficial especially if frequent maintenance is required due to higher traffic volumes. Roads within the
gravel network should be ranked and rated using the following criteria:
� Usage - traffic volumes and type of traffic
� Functional importance of the roadway
� Known safety issues
� Frequency of maintenance and overall expenditures required
Through the above type of analysis, a program could be introduced to convert certain gravel roadways
into paved roads, reducing overall costs, and be brought forward into the long range budget.
6.4.3 Sanitary and Storm Sewers The following analysis has been conducted at a fairly high level, using industry standard activities and costs
for sanitary and storm sewer rehabilitation and replacement. With future updates of this asset management
strategy, the municipality may wish to run the same analysis with a detailed review of municipality activities
used for sewer mains and the associated local costs for those work activities. All of this information can be
input into the CityWide software suite in order to perform updated financial analysis as more detailed
information becomes available.
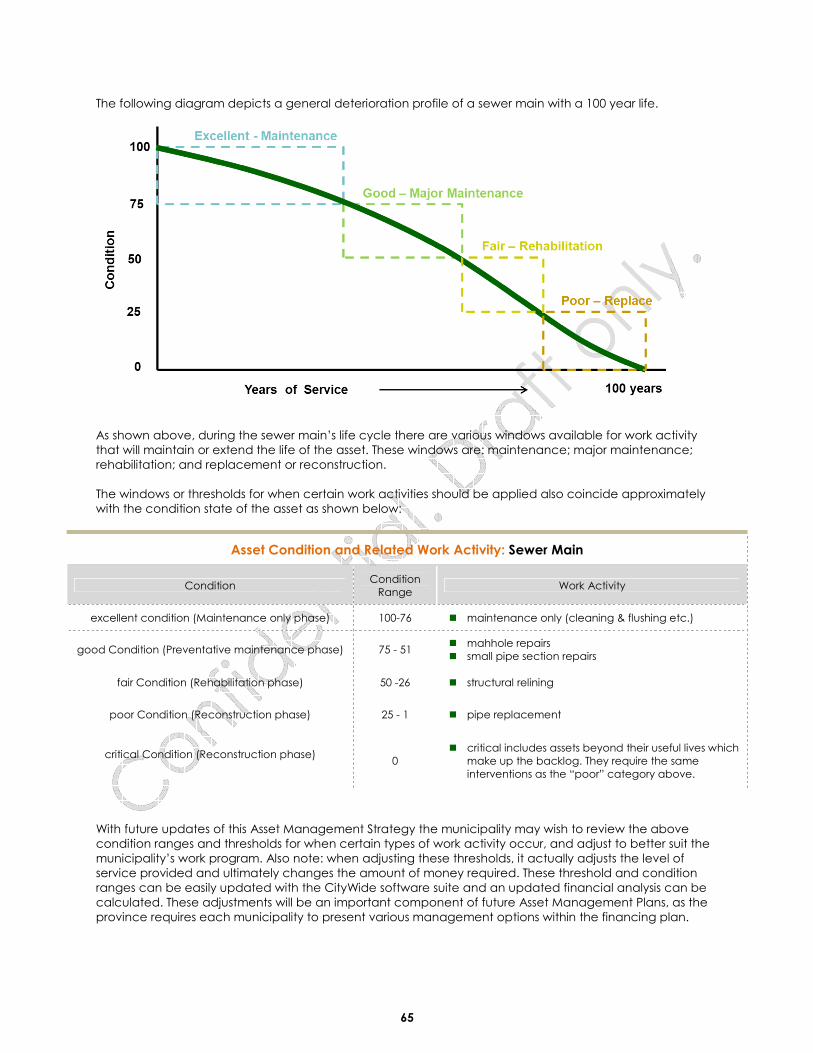
65
The following diagram depicts a general deterioration profile of a sewer main with a 100 year life.
As shown above, during the sewer main’s life cycle there are various windows available for work activity
that will maintain or extend the life of the asset. These windows are: maintenance; major maintenance;
rehabilitation; and replacement or reconstruction.
The windows or thresholds for when certain work activities should be applied also coincide approximately
with the condition state of the asset as shown below:
Asset Condition and Related Work Activity: Sewer Main
Condition Condition
Range Work Activity
excellent condition (Maintenance only phase) 100-76 � maintenance only (cleaning & flushing etc.)
good Condition (Preventative maintenance phase) 75 - 51 � mahhole repairs
� small pipe section repairs
fair Condition (Rehabilitation phase) 50 -26 � structural relining
poor Condition (Reconstruction phase) 25 - 1 � pipe replacement
critical Condition (Reconstruction phase)
0
� critical includes assets beyond their useful lives which
make up the backlog. They require the same
interventions as the “poor” category above.
With future updates of this Asset Management Strategy the municipality may wish to review the above
condition ranges and thresholds for when certain types of work activity occur, and adjust to better suit the
municipality’s work program. Also note: when adjusting these thresholds, it actually adjusts the level of
service provided and ultimately changes the amount of money required. These threshold and condition
ranges can be easily updated with the CityWide software suite and an updated financial analysis can be
calculated. These adjustments will be an important component of future Asset Management Plans, as the
province requires each municipality to present various management options within the financing plan.

66
The table below outlines the costs, by pipe diameter, for various sewer main rehabilitation (lining) and
replacement activities. The columns display the added life obtained for each activity, the condition range
at which they should be applied, and the cost of 1 year added life for each (cost of activity / added life) in
order to present an apples to apples comparison.
Sewer Main Lifecycle Activity Options
Category Cost (per m) Added Life Condition Range 1 year Added Life Cost (Cost / Added Life)
Structural Rehab (m)
0 - 325mm $174.69 75 50 - 75 $2.33
325 - 625mm $283.92 75 50 - 75 $3.79
625 - 925mm $1,857.11 75 50 - 75 $24.76
> 925mm $1,771.34 75 50 - 75 $23.62
Replacement (m)
$475.00 100 76 - 100 $4.75
325 - 625mm $725.00 100 76 - 100 $7.25
625 - 925mm $900.00 100 76 - 100 $9.00
> 925mm $1,475.00 100 76 - 100 $14.75
As can be seen in the above table, structural rehabilitation or lining of sewer mains is an extremely cost
effective industry activity and solution for pipes with a diameter less than 625mm. The unit cost of lining is
approximately one third of replacement and the cost to obtain one year of added life is half the cost. For
Russell, this diameter range would account for over 100% of sanitary sewer mains and 75% of storm mains.
Structural lining has been proven through industry testing to have a design life (useful life) of 75 years,
however, it is believed that liners will probably obtain 100 years of life (the same as a new pipe).
For sewer mains with diameters greater than 625mm specialized liners are required and therefore the costs
are no longer effective. It should be noted, however, that the industry is continually expanding its
technology in this area and therefore future costs should be further reviewed for change and possible price
reductions.
It is recommended, if not in place already, that the municipality engage in an active structural lining
program for sanitary and storm sewer mains and that a portion of the capital budget be dedicated to this.
In order to implement the above, it will be important to also establish a condition assessment program to
establish a condition score for each sewer main within the sanitary and storm collection networks, and
therefore identify which pipes are good candidates for structural lining.
6.4.4 Bridges & Culverts (greater than 3m span) The best approach to develop a 10 year needs list for the municipality’s relatively small bridge structure
portfolio would be to have the structural engineer who performs the inspections to develop a maintenance
requirements report, a rehabilitation and replacement requirements report and identify additional detailed
inspections as required. This approach is described in more detail within the “Bridges & Culverts (greater than 3m) Inspections” section above.
6.4.5 Water Network As with roads and sewers above, the following analysis has been conducted at a fairly high level, using
industry standard activities and costs for water main rehabilitation and replacement.

67
The following diagram depicts a general deterioration profile of a water main with an 80 year life.
As shown above, during the water main’s life cycle there are various windows available for work activity
that will maintain or extend the life of the asset. These windows are: maintenance; major maintenance;
rehabilitation; and replacement or reconstruction.
The windows or thresholds for when certain work activities should be applied also coincide approximately
with the condition state of the asset as shown below:
Asset Condition and Related Work Activity: Water Main
Condition Condition
Range Work Activity
excellent condition (Maintenance only phase) 100-76 � maintenance only (cleaning & flushing etc.)
good Condition (Preventative maintenance phase) 75 - 51 � water main break repairs � small pipe section repairs
fair Condition (Rehabilitation phase) 50 -26 � structural water main relining
poor Condition (Reconstruction phase) 25 - 1 � pipe replacement
critical Condition (Reconstruction phase)
0
� critical includes assets beyond their useful lives which
make up the backlog. They require the same
interventions as the “poor” category above.
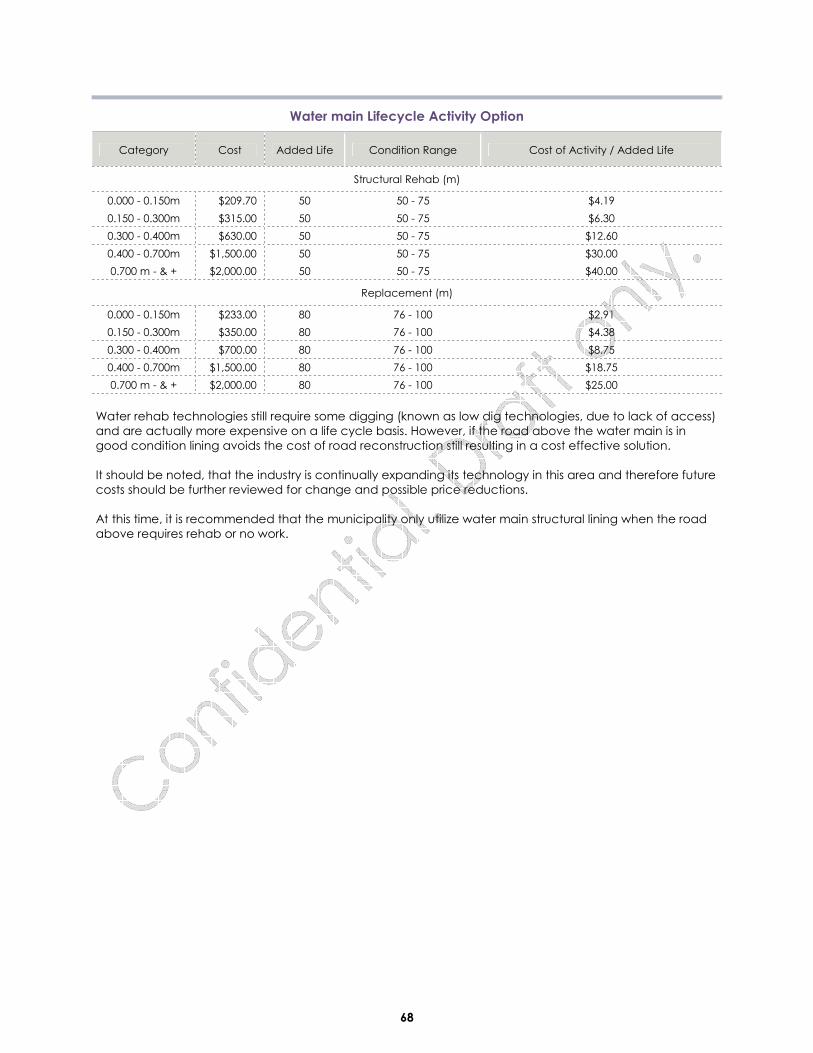
68
Water main Lifecycle Activity Option
Category Cost Added Life Condition Range Cost of Activity / Added Life
Structural Rehab (m)
0.000 - 0.150m $209.70 50 50 - 75 $4.19
0.150 - 0.300m $315.00 50 50 - 75 $6.30
0.300 - 0.400m $630.00 50 50 - 75 $12.60
0.400 - 0.700m $1,500.00 50 50 - 75 $30.00
0.700 m - & + $2,000.00 50 50 - 75 $40.00
Replacement (m)
0.000 - 0.150m $233.00 80 76 - 100 $2.91
0.150 - 0.300m $350.00 80 76 - 100 $4.38
0.300 - 0.400m $700.00 80 76 - 100 $8.75
0.400 - 0.700m $1,500.00 80 76 - 100 $18.75
0.700 m - & + $2,000.00 80 76 - 100 $25.00
Water rehab technologies still require some digging (known as low dig technologies, due to lack of access)
and are actually more expensive on a life cycle basis. However, if the road above the water main is in
good condition lining avoids the cost of road reconstruction still resulting in a cost effective solution.
It should be noted, that the industry is continually expanding its technology in this area and therefore future
costs should be further reviewed for change and possible price reductions.
At this time, it is recommended that the municipality only utilize water main structural lining when the road
above requires rehab or no work.

69
6.5 Growth and Demand
Typically a municipality will have specific plans associated with population growth. It is essential that the
asset management strategy should address not only the existing infrastructure, as above, but must include
the impact of projected growth on defined project schedules and funding requirements. Projects would
include the funding of the construction of new infrastructure, and/or the expansion of existing infrastructure
to meet new demands. The municipality should enter these projects into the CityWide software in order to
be included within the short and long term budgets as required.
6.6 Project Prioritization
The above techniques and processes when established for the road, water, sewer networks and bridges will
supply a significant listing of potential projects. Typically the infrastructure needs will exceed available
resources and therefore project prioritization parameters must be developed to ensure the right projects
come forward into the short and long range budgets. An important method of project prioritization is to
rank each project, or each piece of infrastructure, on the basis of how much risk it represents to the
organization.
6.6.1 Risk Matrix and Scoring Methodology Risk within the infrastructure industry is often defined as the probability (likelihood) of failure multiplied by the
consequence of that failure.
RISK = LIKELIHOOD OF FAILURE x CONSEQUENCE OF FAILURE
The likelihood of failure relates to the current condition state of each asset, whether they are in excellent,
good, fair, poor or critical condition, as this is a good indicator regarding their future risk of failure. The
consequence of failure relates to the magnitude, or overall effect, that an asset’s failure will cause. For
instance, a small diameter water main break in a sub division may cause a few customers to have no
water service for a few hours, whereby a large trunk water main break outside a hospital could have
disastrous effects and would be a front page news item. The following table represents the scoring matrix
for risk:
All of the municipality’s assets analyzed within this asset management plan have been given both a
likelihood of failure score and a consequence of failure score within the CityWide software.
The following risk scores have been developed at a high level for each asset class within the CityWide
software system. It is recommended that the municipality undertake a detailed study to develop a more

70
tailored suite of risk scores, particularly in regards to the consequence of failure, and that this be updated
within the CityWide software with future updates to this Asset Management Plan.
The current scores that will determine budget prioritization currently within the system are as follows:
All assets: The Likelihood of Failure score is based on the condition of the assets:
Likelihood of Failure: All Assets
Asset condition Likelihood of failure
Excellent condition Score of 1
Good condition Score of 2
Fair condition Score of 3
Poor condition Score of 4
Critical condition Score of 5
Bridges (based on valuation): The consequence of failure score for this initial AMP is based upon the replacement value of the structure.
The higher the value, probably the larger the structure and therefore probably the higher the
consequential risk of failure:
Consequence of Failure: Bridges
Replacement Value Consequence of failure
Up to $100k Score of 1
$101 to $200k Score of 2
$201 to $300k Score of 3
$301 to $700k Score of 4
$701k and over Score of 5
Roads (based on classification): The consequence of failure score for this initial AMP is based upon the road classification as this will reflect
traffic volumes and number of people affected.
Consequence of Failure: Roads
Road Classification Consequence of failure
Earth Score Of 1
Gravel Score Of 2
Low Class Bituminous Score Of 3
High Class Bituminous Score Of 5

71
Sanitary Sewer (based on diameter):
The consequence of failure score for this initial AMP is based upon pipe diameter as this will reflect potential
upstream service area affected.
Consequence of Failure: Sanitary Sewer
Pipe Diameter Consequence of failure
Less than 100mm Score of 1
101-250mm Score of 2
251-400mm Score of 3
401-550mm Score of 4
551mm And Over Score of 5
Water (based on diameter):
The consequence of failure score for this initial AMP is based upon pipe diameter as this will reflect potential
service area affected.
Consequence of Failure: Water
Pipe Diameter Consequence of Failure
Less than 100 mm Score of 1
101 – 200 mm Score of 2
201 – 300 mm Score of 3
301 – 400 mm Score of 4
401 and over Score of 5
Storm Sewer (based on diameter):
The consequence of failure score for this initial AMP is based upon pipe diameter as this will reflect potential
upstream service area affected.
Consequence of Failure: Storm Sewer
Replacement Value Consequence of failure
less than 200 mm Score of 1
201 – 400 mm Score of 2
401 – 600 mm Score of 3
601 – 899 mm Score of 4
900 mm and over Score of 5

72
7.0 Financial Strategy
7.1 General overview of financial plan requirements
In order for an AMP to be effectively put into action, it must be integrated with financial planning and long-
term budgeting. The development of a comprehensive financial plan will allow Russell to identify the
financial resources required for sustainable asset management based on existing asset inventories, desired
levels of service, and projected growth requirements.
The following pyramid depicts the various cost elements and resulting funding levels that should be
incorporated into AMPs that are based on best practices. This report develops such a financial plan by
presenting several scenarios for consideration and culminating with final recommendations. As outlined
below, the scenarios presented model different combinations of the following components:
a) the financial requirements (as documented in the SOTI section of this report) for:
� existing assets
� existing service levels � requirements of contemplated changes in service levels (none identified for this plan)
� requirements of anticipated growth (none identified for this plan)
b) use of traditional sources of municipal funds: � tax levies
� user fees
� reserves
� debt � development charges

73
c) use of non-traditional sources of municipal funds:
� reallocated budgets � partnerships
� procurement methods
d) use of senior government funds: � gas tax
� grants (not included in this plan due to Provincial requirements for firm commitments)
If the financial plan component of an AMP results in a funding shortfall, the Province requires the inclusion
of a specific plan as to how the impact of the shortfall will be managed. In determining the legitimacy of a
funding shortfall, the Province may evaluate a municipality’s approach to the following:
a) in order to reduce financial requirements, consideration has been given to revising service levels downward b) all asset management and financial strategies have been considered. For example:
� if a zero debt policy is in place, is it warranted? If not, the use of debt should be considered.
� do user fees reflect the cost of the applicable service? If not, increased user fees should be considered.
This AMP includes recommendations that avoid long-term funding deficits.
7.2 Financial information relating to Russell’s AMP 7.2.1 Funding objective We have developed scenarios that would enable Russell to achieve full funding within 5 to 10 years for the
following assets:
a) Tax funded assets: Road Network; Bridges & Culverts; Storm Sewer Network
b) Rate funded assets: Sanitary Sewer Network; Water Network
Note: For the purposes of this AMP, we have excluded the category of gravel roads since gravel roads are
a perpetual maintenance asset and end of life replacement calculations do not normally apply. If gravel
roads are maintained properly, they, in essence, could last forever.
For each scenario developed we have included strategies, where applicable, regarding the use of tax
revenues, user fees, reserves and debt.
7.3 Tax funded assets
7.3.1 Current funding position Tables 1 and 2 outline, by asset category, Russell’s average annual asset investment requirements, current
funding positions, and funding increases required to achieve full funding on assets funded by taxes.
Table 1. Summary of Infrastructure Requirements & Current Funding Available
Asset Category
Average
Annual Investment
Required
2013 Annual Funding Available
Annual Deficit/Surplus
Taxes Gas Tax Other Total
Funding
Available
Road Network 1,437,000 231,000 426,000 0 657,000 780,000
Bridges & Culverts 526,000 35,000 0 0 35,000 491,000
Storm Sewer Network 615,000 334,000 0 0 334,000 281,000
Total 2,578,000 600,000 426,000 0 1,026,000 1,552,000
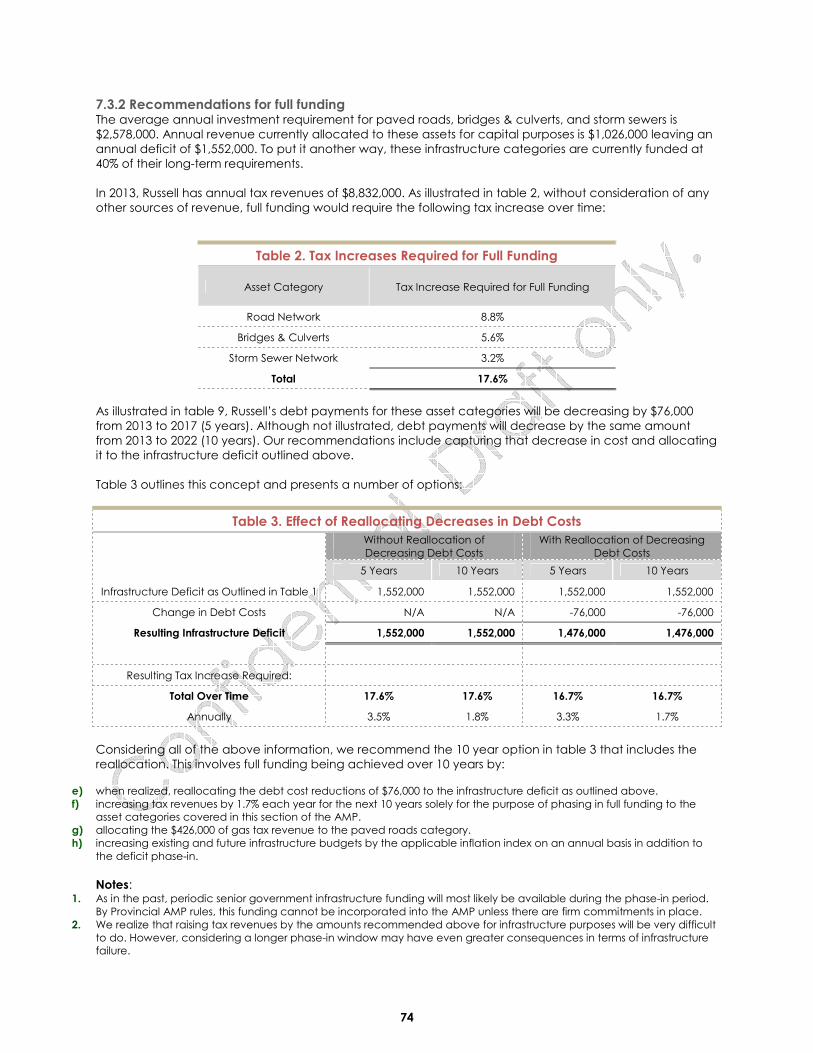
74
7.3.2 Recommendations for full funding The average annual investment requirement for paved roads, bridges & culverts, and storm sewers is
$2,578,000. Annual revenue currently allocated to these assets for capital purposes is $1,026,000 leaving an
annual deficit of $1,552,000. To put it another way, these infrastructure categories are currently funded at
40% of their long-term requirements.
In 2013, Russell has annual tax revenues of $8,832,000. As illustrated in table 2, without consideration of any
other sources of revenue, full funding would require the following tax increase over time:
Table 2. Tax Increases Required for Full Funding
Asset Category Tax Increase Required for Full Funding
Road Network 8.8%
Bridges & Culverts 5.6%
Storm Sewer Network 3.2%
Total 17.6%
As illustrated in table 9, Russell’s debt payments for these asset categories will be decreasing by $76,000
from 2013 to 2017 (5 years). Although not illustrated, debt payments will decrease by the same amount
from 2013 to 2022 (10 years). Our recommendations include capturing that decrease in cost and allocating
it to the infrastructure deficit outlined above.
Table 3 outlines this concept and presents a number of options:
Table 3. Effect of Reallocating Decreases in Debt Costs
Without Reallocation of
Decreasing Debt Costs
With Reallocation of Decreasing
Debt Costs
5 Years 10 Years 5 Years 10 Years
Infrastructure Deficit as Outlined in Table 1 1,552,000 1,552,000 1,552,000 1,552,000
Change in Debt Costs N/A N/A -76,000 -76,000
Resulting Infrastructure Deficit 1,552,000 1,552,000 1,476,000 1,476,000
Resulting Tax Increase Required:
Total Over Time 17.6% 17.6% 16.7% 16.7%
Annually 3.5% 1.8% 3.3% 1.7%
Considering all of the above information, we recommend the 10 year option in table 3 that includes the
reallocation. This involves full funding being achieved over 10 years by:
e) when realized, reallocating the debt cost reductions of $76,000 to the infrastructure deficit as outlined above.
f) increasing tax revenues by 1.7% each year for the next 10 years solely for the purpose of phasing in full funding to the asset categories covered in this section of the AMP.
g) allocating the $426,000 of gas tax revenue to the paved roads category.
h) increasing existing and future infrastructure budgets by the applicable inflation index on an annual basis in addition to
the deficit phase-in.
Notes: 1. As in the past, periodic senior government infrastructure funding will most likely be available during the phase-in period.
By Provincial AMP rules, this funding cannot be incorporated into the AMP unless there are firm commitments in place.
2. We realize that raising tax revenues by the amounts recommended above for infrastructure purposes will be very difficult
to do. However, considering a longer phase-in window may have even greater consequences in terms of infrastructure failure.

75
Although this option achieves full funding on an annual basis in 10 years and provides financial
sustainability over the period modeled (to 2050), the recommendations do require prioritizing capital
projects to fit the resulting annual funding available. As of 2013, age based data shows a pent up
investment demand of $29,543,000 for paved roads, $5,087,000 for bridges & culverts, and $0 for storm
sewers. Prioritizing future projects will require the age based data to be replaced by condition based data.
Although our recommendations include no further use of debt, the results of the condition based analysis
may require otherwise.
7.4 Rate funded assets
7.4.1 Current funding position Tables 4 and 5 outline, by asset category, Russell’s average annual asset investment requirements, current
funding positions and funding increases required to achieve full funding on assets funded by rates.
Table 4. Summary of Infrastructure Requirements & Current Funding Available
Asset Category
Average
Annual
Investment
Required
2013 Annual Funding Available
Annual
Deficit/Surplus
Rates
Less:
Allocated
to
Operations
Less:
Allocated
to Debt
Payments
Total
Funding
Available
Sanitary Sewer Network 447,000 1,189,000 -931,000 -153,000 105,000 342,000
Water Network 1,884,000 3,150,000 -1,751,000 -1,132,000 267,000 1,617,000
Total 2,331,000 4,339,000 -2,682,000 -1,285,000 372,000 1,959,000
7.4.2 Recommendations for full funding The average annual investment requirement for sanitary services and water services is $2,331,000. Annual
revenue currently allocated to these assets for capital purposes is $372,000 leaving an annual deficit of
$1,959,000. To put it another way, these infrastructure categories are currently funded at 16% of their long-term requirements.
In 2013, Russell has annual sanitary revenues of $1,189,000 and annual water revenues of $3,150,000. As
illustrated in table 5, without consideration of any other sources of revenue, full funding would require the
following increases over time:
Table 5. Rate Increases Required for Full Funding
Asset Category Rate Increase Required
for Full Funding
Sanitary Sewer Network 28.8%
Water Network 51.3%
As illustrated in table 9, Russell’s debt payments for sanitary services will be decreasing by $4,000 from 2013
to 2017 (5 years). Although not illustrated, debt payments for sanitary services will be decreasing by
$134,000 from 2013 to 2022 (10 years). For water services, there is no change in either 5 or 10 years. Our
recommendations include capturing those decreases in cost and allocating them to the applicable
infrastructure deficit.
Tables 6a and 6b outline the above concept and present a number of options:

76
Table 6a. Without Change in Debt Costs
Sanitary Sewer Network Water Network
5 Years 10 Years 5 Years 10 Years
Infrastructure Deficit as Outlined in Table 4 342,000 342,000 1,617,000 1,617,000
Change in Debt Costs N/a n/a N/A n/a
Resulting Infrastructure Deficit 342,000 342,000 1,617,000 1,617,000
Resulting Rate Increase Required:
Total Over Time 28.8% 28.8% 51.3% 51.3%
Annually 5.8% 2.9% 10.3% 5.1%
Table 6b. With Change in Debt Costs
Sanitary Sewer Network Water Network
5 Years 10 Years 5 Years 10 Years
Infrastructure Deficit as Outlined in Table 4 342,000 342,000 1,617,000 1,617,000
Change in Debt Costs -4,000 -134,000 0 0
Resulting Infrastructure Deficit 338,000 208,000 1,617,000 1,617,000
Resulting Rate Increase Required:
Total Over Time 28.4% 17.5% 51.3% 51.3%
Annually 5.7% 1.8% 10.3% 5.1%
Considering all of the above information, we recommend the 10 year option in table 6b that includes the
reallocations. This involves full funding being achieved over 10 years by:
a) when realized, reallocating the debt cost reductions of $134,000 for sanitary services to the applicable infrastructure
deficit.
b) increasing rate revenues by 1.8% for sanitary services and 5.1% for water services each year for the next 10 years solely
for the purpose of phasing in full funding to the asset categories covered in this section of the AMP. c) increasing existing and future infrastructure budgets by the applicable inflation index on an annual basis in addition to
the deficit phase-in.
Notes: 1. As in the past, periodic senior government infrastructure funding will most likely be available during the phase-in period.
By Provincial AMP rules, this funding cannot be incorporated into an AMP unless there are firm commitments in place.
2. We realize that raising rate revenues by the amounts recommended above for infrastructure purposes will be very
difficult to do. However, considering a longer phase-in window may have even greater consequences in terms of
infrastructure failure. 3. Any increase in rates required for operations would be in addition to the above recommendations.
Although this option achieves full funding on an annual basis in 10 years and provides financial
sustainability over the period modeled (to 2050), the recommendations do require prioritizing capital
projects to fit the resulting annual funding available. As of 2013, age based data shows a pent up
investment demand of $0 for sanitary services and $490,000 for water services. Prioritizing future projects will
require the age based data to be replaced by condition based data. Although our recommendations
include no further use of debt, the results of the condition based analysis may require otherwise.

77
7.5 Use of debt
For reference purposes, table 7 outlines the premium paid on a project if financed by debt. For example, a
$1M project financed at 3.0%1 over 15 years would result in a 26% premium or $260,000 of increased costs
due to interest payments. For simplicity, the table does not take into account the time value of money or
the effect of inflation on delayed projects.
Table 7. Total Interest Paid as a % of Project Costs
Interest Rate Number of Years Financed
5 10 15 20 25 30
7.0% 22% 42% 65% 89% 115% 142%
6.5% 20% 39% 60% 82% 105% 130%
6.0% 19% 36% 54% 74% 96% 118%
5.5% 17% 33% 49% 67% 86% 106%
5.0% 15% 30% 45% 60% 77% 95%
4.5% 14% 26% 40% 54% 69% 84%
4.0% 12% 23% 35% 47% 60% 73%
3.5% 11% 20% 30% 41% 52% 63%
3.0% 9% 17% 26% 34% 44% 53%
2.5% 8% 14% 21% 28% 36% 43%
2.0% 6% 11% 17% 22% 28% 34%
1.5% 5% 8% 12% 16% 21% 25%
1.0% 3% 6% 8% 11% 14% 16%
0.5% 2% 3% 4% 5% 7% 8%
0.0% 0% 0% 0% 0% 0% 0%
It should be noted that current interest rates are near all-time lows. Sustainable funding models that include
debt need to incorporate the risk of rising interest rates. The following graph shows where historical lending
rates have been:
1 Current municipal Infrastructure Ontario rates for 15 year money is 3.2%.

78
0.00%
2.00%
4.00%
6.00%
8.00%
10.00%
12.00%
14.00%
16.00%
1990 1995 2000 2005 2010
Year
Historical Prime Business Interest Rate
As illustrated in table 7, a change in 15 year rates from 3% to 6% would change the premium from 26% to
54%. Such a change would have a significant impact on a financial plan.
Tables 8 and 9 outline how Russell has historically used debt for investing in the asset categories as listed.
There is currently $17,150,000 of debt outstanding for the assets covered by this AMP. In terms of overall
debt capacity, Russell currently has $17,850,000 of total outstanding debt and $1,545,000 of total annual
principal and interest payment commitments. These principal and interest payments are well within its
provincially prescribed annual maximum of $3,936,000.
Table 8. Overview of Use of Debt
Asset Category Current Debt
Outstanding
Use Of Debt in the Last Five Years
2009 2010 2011 2012 2013
Road Network 218,000 0 0 347,000 0 0
Bridges & Culverts 0 0 0 0 0 0
Storm Sewers 0 0 0 0 0 0
Total Tax Funded 218,000 0 0 347,000 0 0
Sanitary Sewer Network 624,000 0 0 146,000 503,000 0
Water Network 16,526,000 0 0 16,937,000 0 0
Total rate Funded 17,150,000 0 0 17,083,000 503,000 0
Total AMP Debt 17,368,000 0 0 17,430,000 503,000 0
Non AMP Debt 482,000 0 0 669,000 0 0
Overall Total 17,850,000 0 0 18,099,000 503,000 0

79
Table 9. Overview of Debt Costs
Asset Category
Principal & Interest Payments in the Next Five Years
2013 2014 2015 2016 2017
Road Network 76,000 76,000 76,000 0 0
Bridges & Culverts 0 0 0 0 0
Storm Sewer Network 0 0 0 0 0
Total Tax Funded 76,000 76,000 76,000 0 0
Sanitary Sewer Network 134,000 134,000 134,000 130,000 130,000
Water Network 1,132,000 1,132,000 1,132,000 1,132,000 1,132,000
Total Rate Funded 1,266,000 1,266,000 1,266,000 1,262,000 1,262,000
Total Amp Debt 1,342,000 1,342,000 1,342,000 1,262,000 1,262,000
Non Amp Debt 203,000 147,000 146,000 0 0
Overall Total 1,545,000 1,489,000 1,488,000 1,262,000 1,262,000
The revenue options outlined in this plan allow Russell to fully fund its long-term infrastructure requirements
without further use of debt. However, as explained in sections 7.3.2 and 7.4.2, the recommended condition
rating analysis may require otherwise.
7.6 Use of reserves 7.6.1 Available reserves Reserves play a critical role in long-term financial planning. The benefits of having reserves available for
infrastructure planning include:
� the ability to stabilize tax rates when dealing with variable and sometimes uncontrollable factors
� financing one-time or short-term investments
� accumulating the funding for significant future infrastructure investments
� managing the use of debt � normalizing infrastructure funding requirements
By infrastructure category, table 10 outlines the details of the reserves currently available to Russell.
Table 10. Summary of Reserves Available
Asset Category Balance at December 31,
2012
Road Network 0
Bridges 0
Storm Sewers 0
Total Tax Funded 0
Water Network 670,000
Sanitary Sewer Network 910,000
Total Rate Funded 1,580,000

80
There is considerable debate in the municipal sector as to the appropriate level of reserves that a
municipality should have on hand. There is no clear guideline that has gained wide acceptance. Factors
that municipalities should take into account when determining their capital reserve requirements include:
� breadth of services provided � age and condition of infrastructure
� use and level of debt
� economic conditions and outlook
� internal reserve and debt policies.
Due to the absence of reserves for tax based asset categories and relatively low level of reserves for rate
based asset categories, the scenarios developed in this report do not draw on these funds during the
phase-in period to full funding. This, coupled with Russell’s judicious use of debt in the past, allows the
scenarios to assume that, if required, available reserves and debt capacity can be used for high priority
and emergency situations until reserves are built to desired levels. This will allow the Russell to address high
priority infrastructure investments in the short to medium-term.
7.6.2 Recommendation As Russell updates its AMP and expands it to include other asset categories, we recommend that future
planning should include determining what its long-term reserve balance requirements are and a plan to
achieve such balances.

81
8.0 Appendix A: Report Card Calculations
Key Calculations
1. “Weighted, unadjusted star rating”:
(% of assets in given condition) x (potential star rating)
2. “Adjusted star rating”
(weighted, unadjsted star rating) x (% of total replacement value)
3. “Overall Rating”
(Condition vs. Performance star rating) + (Funding vs. Need star rating)
___________________________________________________________________
2

Roads
Segment replacement value $35,926,653 100.0%
Segment ConditionLetter
gradeStar rating
Quantity (m) in given
condition
% of Assets in given
condition
Weighted, unadjusted
star rating
Excellent A 5 92,650 46% 2.29
Good B 4 53,602 27% 1.06
Fair C 3 41,179 20% 0.61
Poor D 2 14,216 7% 0.14
Critical F 1 615 0% 0.00
Totals 202,262 100% 4.10
4.1 B
Average annual
investment required
2013 funding
availableDeficit
Category star
rating
Category letter
grade
$1,437,000 $657,000 $780,000
Average star rating
3. Overall RatingCondition vs Performance star rating Funding vs. Need star rating Overall letter grade
4.1 1.0
2.6 D+
2. Funding vs. Need
Funding percentage
45.7%
1.0 F
Category star
rating
Category letter
grade
Segment adjusted star rating
HCB, LCB, Sidewalks4.1
Russell
1. Condition vs. Performance
Total category replacement value $35,926,653Segment value as a % of total category
replacement value

Bridges & culverts
Segment replacement value $19,713,000 87.8%
Segment ConditionLetter
gradeStar rating
Quantity (m.sq) in given
condition
% of Assets in given
condition
Weighted, unadjusted
star rating
Excellent A 5 2,521 62% 3.11
Good B 4 1,314 32% 1.30
Fair C 3 30 1% 0.02
Poor D 2 56 1% 0.03
Critical F 1 128 3% 0.03
Totals 4,049 100% 4.49
Segment replacement value $2,730,000 12.2%
Segment ConditionLetter
gradeStar rating
Quantity (m) in given
condition
% of Assets in given
condition
Weighted, unadjusted
star rating
Excellent A 5 188 18% 0.91
Good B 4 161 16% 0.63
Fair C 3 0 0% 0.00
Poor D 2 263 26% 0.51
Critical F 1 416 40% 0.40
Totals 1,028 100% 2.46
4.2 B
Average annual
investment required
2013 funding
availableDeficit
Category star
rating
Category letter
grade
$526,000 $35,000 $491,000
Average star rating
Segment adjusted star rating
Russell
1. Condition vs. Performance
Total category replacement value $22,443,000Segment value as a % of total category
replacement value
Bridges & culverts3.9
Total category replacement value $22,443,000Segment value as a % of total category
replacement value
Segment adjusted star rating
Guiderails0.3
Category star
rating
Category letter
grade
2. Funding vs. Need
Funding percentage
6.7%
0.0 F
3. Overall RatingCondition vs Performance star rating Funding vs. Need star rating Overall letter grade
4.2 0.0
2.1 D

Water
Segment replacement value $58,731,650 78.6%
Segment ConditionLetter
gradeStar rating
Quantity (m) in given
condition
% of Assets in given
condition
Weighted, unadjusted
star rating
Excellent A 5 46,410 33% 1.64
Good B 4 11,420 8% 0.32
Fair C 3 33,218 23% 0.70
Poor D 2 15,444 11% 0.22
Critical F 1 35,325 25% 0.25
Totals 141,817 100% 3.13
Segment replacement value $16,036,215 21.4%
Segment ConditionLetter
gradeStar rating
Quantities ($) given
condition
% of Assets in given
condition
Weighted, unadjusted
star rating
Excellent A 5 $32,230,800 72% 3.58
Good B 4 $6,932,699 15% 0.62
Fair C 3 $4,790,579 11% 0.32
Poor D 2 $293,155 1% 0.01
Critical F 1 $788,982 2% 0.02
Totals $45,036,215 100% 4.54
3.4 C
Average annual
investment required
2013 funding
availableDeficit
Category star
rating
Category letter
grade
$1,884,000 $267,000 $1,617,000
Average star rating
3. Overall RatingCondition vs Performance star rating Funding vs. Need star rating Overall letter grade
3.4 0.0
1.7 F
2. Funding vs. Need
Funding percentage
14.2%
0.0 F
Category star
rating
Category letter
grade
Segment adjusted star rating
Facilities1.0
Russell
1. Condition vs. Performance
Total category replacement value $74,767,865Segment value as a % of total category
replacement value
Total category replacement value $74,767,865Segment value as a % of total category
replacement value
Segment adjusted star rating
Mains2.5

Sanitary
Segment replacement value $4,402,500 19.7%
Segment ConditionLetter
gradeStar rating
Quantity (m) in given
condition
% of Assets in given
condition
Weighted, unadjusted
star rating
Excellent A 5 6,240 21% 1.06
Good B 4 3,040 10% 0.41
Fair C 3 20,070 68% 2.05
Poor D 2 0 0% 0.00
Critical F 1 0 0% 0.00
Totals 29,350 100% 3.53
Segment replacement value $17,929,100 80.3%
Segment ConditionLetter
gradeStar rating
Quantities ($) given
condition
% of Assets in given
condition
Weighted, unadjusted
star rating
Excellent A 5 $8,805,300 49% 2.46
Good B 4 $9,123,800 51% 2.04
Fair C 3 $0 0% 0.00
Poor D 2 $0 0% 0.00
Critical F 1 $0 0% 0.00
Totals $17,929,100 100% 4.49
4.3 B
Average annual
investment required
2013 funding
availableDeficit
Category star
rating
Category letter
grade
$447,000 $105,000 $342,000
Average star rating
Segment adjusted star rating
Russell
1. Condition vs. Performance
Total category replacement value $22,331,600Segment value as a % of total category
replacement value
Mains0.7
Total category replacement value $22,331,600Segment value as a % of total category
replacement value
Segment adjusted star rating
Facilities3.6
Category star
rating
Category letter
grade
2. Funding vs. Need
Funding percentage
23.5%
0.0 F
3. Overall RatingCondition vs Performance star rating Funding vs. Need star rating Overall letter grade
4.3 0.0
2.2 D

Storm
Segment replacement value $17,518,190 68.4%
Segment ConditionLetter
gradeStar rating
Quantity (m) in given
condition
% of Assets in given
condition
Weighted, unadjusted
star rating
Excellent A 5 12,584 14% 0.69
Good B 4 9,526 10% 0.42
Fair C 3 28,870 32% 0.95
Poor D 2 9,802 11% 0.22
Critical F 1 30,049 33% 0.33
Totals 90,831 100% 2.61
Segment replacement value $8,110,156 31.6%
Segment ConditionLetter
gradeStar rating Units in given condition
% of Assets in given
condition
Weighted, unadjusted
star rating
Excellent A 5 256 13% 0.67
Good B 4 632 33% 1.33
Fair C 3 311 16% 0.49
Poor D 2 207 11% 0.22
Critical F 1 500 26% 0.26
Totals 1,906 100% 2.97
2.7 D+
Average annual
investment required
2013 funding
availableDeficit
Category star
rating
Category letter
grade
$615,000 $334,000 $281,000
Average star rating
Segment adjusted star rating
Russell
1. Condition vs. Performance
Total category replacement value $25,628,346Segment value as a % of total category
replacement value
Mains1.8
Total category replacement value $25,628,346Segment value as a % of total category
replacement value
Segment adjusted star rating
Catch basins and man
holes 0.9
Category star
rating
Category letter
grade
2. Funding vs. Need
Funding percentage
54.3%
1.9 D
3. Overall RatingCondition vs Performance star rating Funding vs. Need star rating Overall letter grade
2.7 1.9
2.3 D

Township of Russell
Daily Investment Required Per Household for Infrastructure Sustainability
$0.87
$0.32
$1.14
$0.27
$0.37
$0.00
$0.50
$1.00
$1.50
$2.00
$2.50
$3.00
$3.50
Road Network Bridges & Culverts Water Network Sanitary Sewer Network Storm Sewer Network
Daily cup of coffee: $1.56
Daily infrastructure investment: $2.98
Storm Sewer Network
Total Replacement Cost: $25,628,346
Cost Per Household: $5,676
Road Network (excludes gravel) Total Replacement Cost: $39,125,353 Cost Per Household: $8,666
Infrastructure Replacement Cost Per Household Total: $45,771 per household
Sanitary Sewer Network Total Replacement Cost: $40,260,700 Cost Per Household: $8,917
Water Network Total Replacement Cost: $79,050,679 Cost Per Household: $17,508
Bridges & Culverts Total Replacement Cost: $22,588,782 Cost Per Household: $5,003