asset management market study - fca · 2016. 11. 18. · interim report asset management market...
TRANSCRIPT
MS15/2.2: Annex 6
Market Study
Asset Management Market StudyInterim Report: Annex 6 – Institutional Econometric Analysis
November 2016

Interim Report Asset Management Market Study
November 2016 1
Annex 6: Institutional Econometric Analysis
Introduction
A key aim of this market study is to establish whether competition is working 1.
effectively in the asset management industry. We consider that an important first
step in assessing this is to understand the nature of competition in the asset
management industry. This annex is split into two sections. The first section sets out
how we have sought to understand the factors over which asset managers compete
for the supply of services to institutional investors. The second section looks at the
outcomes for institutional investors.
Drivers of institutional net flows
Commercial asset managers typically charge investors using an ad valorem fee, set 2.
as a percentage of AUM. While there are occasional departures from this fee model in
the form of asymmetric performance fees, these performance fees are ultimately
applied as a percentage of AUM.1
An ad valorem fee structure provides asset managers with an incentive to compete 3.
for net inflows of assets, and subsequently retain those assets. This is because an
additional £ in assets under management represents additional revenues to the asset
management firm. So long as the marginal revenue from additional AUM exceeds the
marginal cost of servicing that additional AUM, we would expect asset management
firms to continue competing for assets and seeking to retain those assets.2
Ad valorem fees should also provide firms with an incentive to perform well, as this 4.
(i) will raise the value of a fund manager’s AUM and therefore revenues to the asset
manager, even if this does not lead to an increase in inflows; (ii) may subsequently
lead to additional inflows of money attracted by the better performance; and (iii)
may improve the likelihood of retaining existing client assets. However, given that
asset managers continue to be paid at the same rate (percentage of AUM) under an
ad valorem fee structure, even if they deliver poor performance, this last incentive
may not be strong if assets do not flow out in response to below average
performance.3
We consider that this fee structure gives asset managers an incentive to focus on 5.
delivering aspects of performance to investors that result in greater inflows of assets,
and that improve the likelihood of retaining assets. These aspects could include, for
example, high returns, brand awareness, appearance on distributors’ best buy lists
and inclusion in adviser recommendations.
1 Performance fees are typically a fixed percentage applied to a measure of outperformance.2 These costs may not be captured fully by accounting measures of costs.3 To the extent that there is a convex and increasing relationship between fund flows and performance, this could lead to
asset management firms facing perverse incentives. For example, if this relationship existed then rational firms could have an incentive to encourage their fund managers to focus their efforts and resources on the current winning fund(s) at the expense of other funds that are currently underperforming. A convex and increasing relationship between fund flows and performance could therefore explain a finding that there exist funds with negative (excess) performance persistence.

Interim Report Asset Management Market Study
November 2016 2
In this annex we have sought to analyse (i) the determinants of flows, with particular 6.
focus on how investment consultant recommendations affect institutional flows; and
(ii) whether these recommendations add value for investors. 4 We have used
econometric techniques to identify the determinants of flows. We have performed
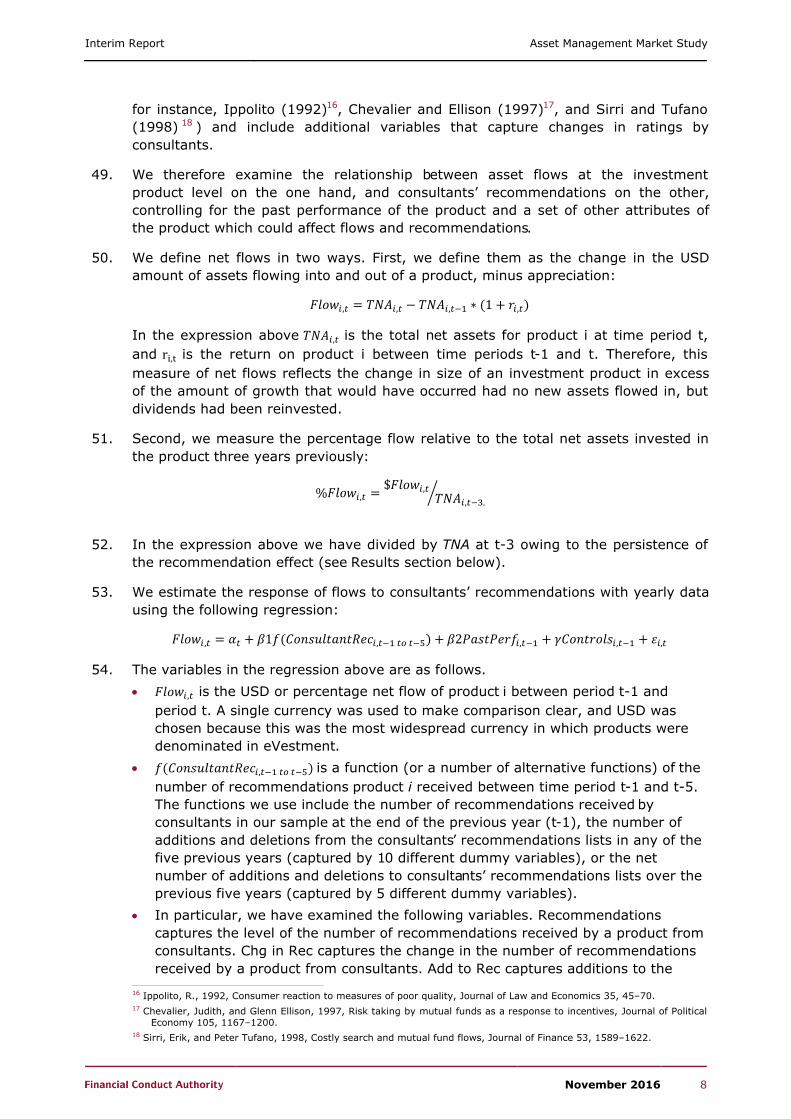
two analyses as part of this market study, one for institutional end investors, and a
second analysis for retail end investors (see separate annex for the retail analysis).
The same framework is used for each analysis.
The evidence from this econometric analysis sits alongside other evidence we have 7.
collected on the drivers of net flows, which includes questionnaires sent to a large
sample of asset managers with a UK presence, surveys of retail and institutional end
investors, existing studies on the asset management industry, and statistical
analysis. This other evidence is covered in Chapter 8.
Background
Institutional investors are entities that have pooled money in order to invest in 8.
assets. We define institutional investors to include organisations such as pension
funds, banks, insurance firms, and endowments. The largest of these groups is
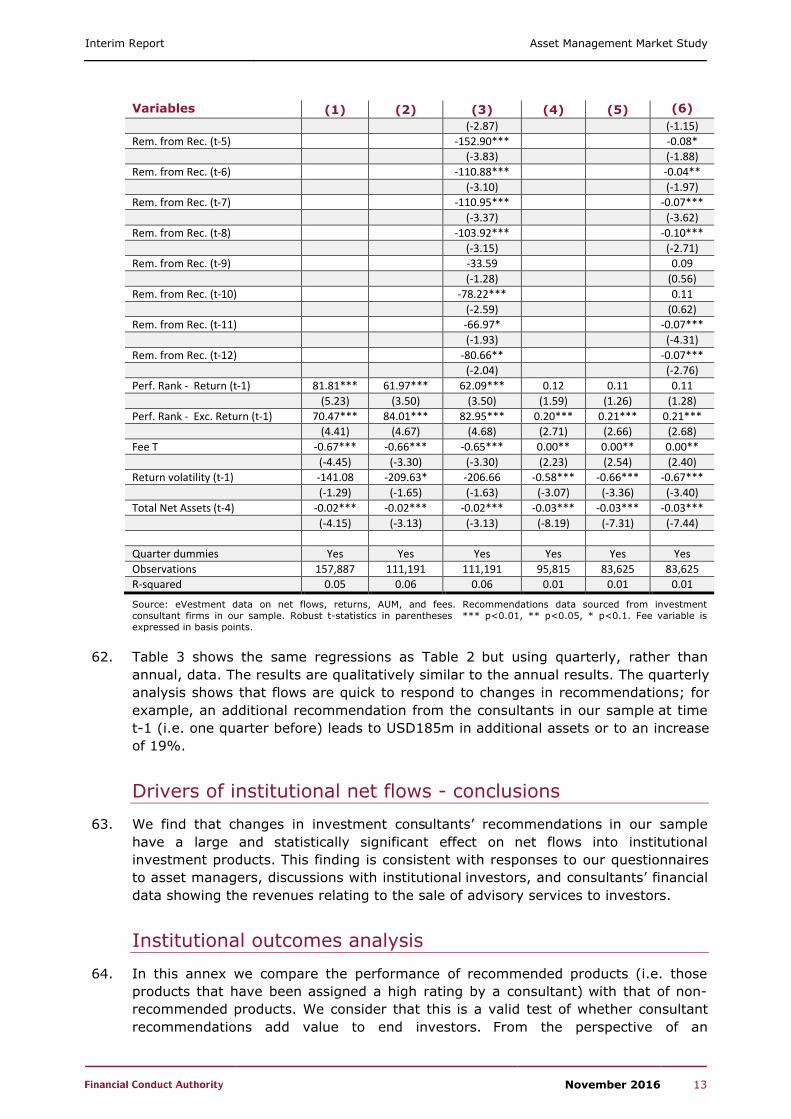
pension funds. These groups access asset management services either directly or
indirectly through intermediaries such as investment consultants.
Investment consultants are important intermediaries in institutional asset 9.
management. Many pension funds, foundations, university and other endowments,
engage these consultants to provide investment-related professional services.
Some investor groups are required by law to obtain specific investment advice from 10.
experts. For example, prior to preparing or revising a statement of investment
principles, the trustees of a UK trust scheme must ‘obtain and consider the written
advice of a person who is reasonably believed by the trustees to be qualified by his
ability in and practical experience of financial matters and to have the appropriate
knowledge and experience of the management of the investments of such schemes’.5
This legally required advice is typically obtained from investment consultants paid to
support the decision making of trustees.
Based on responses by asset managers to our questionnaires, and from meetings 11.
with asset managers, investment consultants are often seen as gatekeepers to the
supply of asset management services to institutional end investors.
Investment consultants provide a range of services to institutional investors which 12.
include asset/liability modelling, supplying benchmarking data, advising pension
funds on their asset allocation strategy, asset manager ratings and
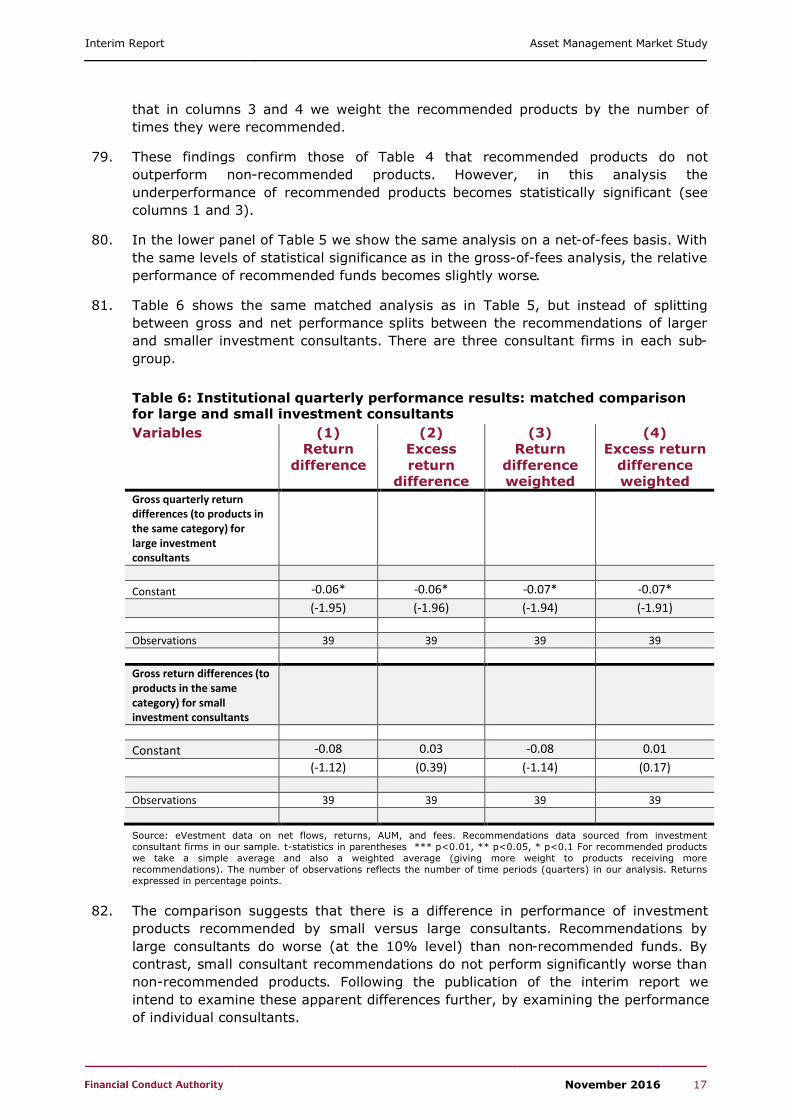
recommendations, investment performance monitoring, and providing delegated
investment (often called fiduciary management) services to investors.
In this annex we are interested in the factors that drive institutional net flows 13.
between investment products. We consider that investment consultants’ advice on (i)
strategic asset allocation; and (ii) ratings and recommendations to investors on
which products to select has the potential to drive flows between asset managers.6
4 Net flows are inflows less outflows of assets into investment products. Performance is therefore not reflected in this measure.
5 The Occupational Pension Schemes (Investment) Regulations 2005, Statement of Investment Principles, Regulation 2(2a)).
6 Under a delegated service investment consultants would select managers themselves, instead of providing recommendations to trustees on which managers to select.

Interim Report Asset Management Market Study
November 2016 3
First, the beliefs of investment consultants regarding optimal asset allocation could 14.
affect asset flows between asset managers. For example, changes in an investment
consultant’s view on strategic asset allocation could lead to clients moving money
from products investing in certain asset classes and/or geographies into different
products. To the extent some asset managers specialise in particular investment
styles, this could also lead to assets moving between asset managers.
Second, the framework and techniques used by investment consultants to research 15.
and rate investment products will determine whether an asset manager’s products
will be recommended to institutional investors, or selected by investment consultants
as part of a delegated (fiduciary management) service. For example, a downgrade in
a rating assigned to a fund manager’s products could lead to existing clients of the
investment consultant moving their funds to a different fund manager.
Academic literature already exists which examines the empirical relationship between 16.
fund flows and various measures of performance. However, there is limited research
in the UK on the effect of consultants’ ratings and recommendations on institutional
fund flows.
Based on 31 meetings with institutional investors we have found that many 17.
institutional investors believe in the value offered by active managers, in particular,
for investment styles other than ‘standard’ UK and US equities. We note that index
tracker products may not exist in certain investment categories. For example, we
understand it is difficult to find a passive manager of a loan or infrastructure
portfolio. Whether this belief in active products is encouraged or not by investment
consultants, consultants potentially play an important role in guiding institutional
investors’ search for ‘winners’ (i.e. those fund managers are most likely to deliver
excess returns in the future) through their manager ratings and recommendations
services.
In the UK there are no performance reporting requirements for investment 18.
consultants. In addition, investment consultants do not disclose their past ratings
publicly in a way that would allow investors and analysts to calculate the relative
ability of consultants to predict ‘winners’. A few investment consultants produce their
own calculations of the ‘value added’ of their manager ratings. These value added
calculations compare the performance of the highest rated managers rated by the
consultancy against a benchmark. However, not all consultants produce these value
added results, the methodology used differs by consultant, and the underlying data
is not made available for scrutiny. Therefore, institutional investors do not have
access to standardised performance data on investment consultants’ ability to (i)
allocate money between asset classes effectively over time; or (ii) pick ‘winning’ fund
managers within a given asset class or strategy. Institutional investors also have
limited non-standardised information on the value added of consultants’ manager
ratings.
Given the potential importance of investment consultants’ manager ratings in 19.
determining which active fund managers are allocated institutional money, we have
sought to understand the following:
whether manager ratings by investment consultants actually drive net flows; and
if manager ratings drive net flows, whether they add value for institutional
investors (see separate annex); and
Interim Report Asset Management Market Study
November 2016 4
Following the publication of the interim report, we intend to examine whether the 20.
importance of ratings has the potential to distort the way in which asset managers
compete with each other.
In this annex we assess whether manager ratings by investment consultants drive 21.
net flows, and whether these recommendations add value.
We have not assessed the value added by strategic asset allocation advice obtained 22.
from consultants. We note that strategic asset allocation plays a crucial role in
determining the overall return of an investment portfolio.
Existing research findings
Investment consultants rate and recommend investment products to institutional, 23.
rather than retail, investors. The products these consultants rate are therefore aimed
at institutional investors.
A large literature already exists which focuses on retail funds, and the value of retail 24.
ratings (for example Del Guercio and Tkac (2008)7). There is also an emerging
literature which examines the value of financial advisers in the retail space (for
example Gennaioli et al. (2013)8) and the merits of using brokerage firms in terms of
fund selection (for example Bergstresser et. al. (2009)9).
We are aware of only two papers that have analysed the effect and added value of 25.
investment consultants’ manager recommendations of institutional investors (such as
pension funds). One of these papers, Jenkinson, Jones, and Martinez (2016)10 ,
examined US actively managed long-only equity funds, and analysed “the factors
that drive consultants’ recommendations, what impact these recommendations have
on flows, and how well the recommended funds perform”. The authors found “that
investment consultants’ recommendations of funds are driven largely by soft factors,
rather than the funds’ past performance, and that their recommendations have a
very significant effect on fund flows”. Jenkinson, Jones, and Martinez found “no
evidence that these recommendations add value, suggesting that the search for
winners, encouraged and guided by investment consultants, is fruitless”.
The second paper, Jones and Martinez (2015)11 , explores whether institutional 26.
investors follow investment consultants’ recommendations because they find them
helpful in forming expectations of manager performance or because consultants’
recommendations provide a justification for their selection of managers. Using the
same data set as Jenkinson, Jones, and Martinez (2016), the authors find that “fund
flows…are driven significantly by…investment consultants’ recommendations, far
beyond the effect that these have on expectations” and that “[institutional investors
follow] consultants’ recommendations because they feel that, as a rationale for
selecting asset managers, these indicators are more defensible to their superiors,
stakeholders and, possibly, the courts than their own expectations are.”
7 Del Guercio, Diane, and Paula Tkac, 2002, The determinants of the flow of funds of managed portfolios: Mutual funds versus pension funds, Journal of Financial and Quantitative Analysis 37, 523–557.
8 Gennaioli, Nicola, Andrei Shleifer and Robert Vishny, 2013, Money Doctors. NBER Working Paper No. 18174.9 Bergstresser, Daniel, John M. R. Chalmers, and Peter Tufano, 2009, Assessing the Costs and Benefits of Brokers in the
Mutual Fund Industry, Review of Financial Studies 22, 4129 – 4156.10 Tim Jenkinson, Howard Jones and Jose Vicente Martinez, 2016, Picking Winners? Investment Consultants'
Recommendations of Fund Managers , The Journal of Finance, 71 (5) pp. 2333-2370.11 Howard Jones and Jose Vicente Martinez, 2016, Institutional Investor Expectations, Manager Performance, and Fund
Flows, The Journal of Financial and Quantitative Analysis (Forthcoming).
Interim Report Asset Management Market Study
November 2016 5
We have applied the same analytical framework of Jenkinson, Jones, and Martinez27.
(2016) to assess whether UK investment consultants’ manager ratings and
recommendations drive net flows, but our data set is far broader in terms of both
geography and asset class.
Role of investment consultants in driving fund flows
Institutional investors use investment consultants’ recommendations of fund 28.
managers both when they first hire managers in an asset class, and when they
replace managers within an asset class. When institutional investors are hiring a
manager, investment consultants typically produce a shortlist of the highest rated
fund managers. Under an advisory relationship the investor makes the decision on
which fund manager(s) to select.
Investment consultants’ ratings may also be used when investors have delegated 29.
some responsibility to investment consultants as part of a fiduciary arrangement.
Investment consultants informed us that when selecting managers as part of a
fiduciary service they will typically only choose from a list of managers to which they
have assigned a high rating.
Institutional investors employ investment consultants for a variety of reasons, with 30.
overall demand for consultants’ services exceeding the minimum legal requirement
for UK trustees (see above).
By hiring consultants, the main activities of institutional investors are reduced to the 31.
hiring, monitoring and firing of the hired investment consultants and fund managers
employed by the plan. Regardless of whether investors hire consultants, they are
ultimately responsible for deciding on strategic asset allocation whether or not they
have taken advice.
The amount of advice purchased by investors will depend on the sophistication of the 32.
investor, and the chosen complexity of the investment strategy. This can be seen by
comparing the amount of advice required for following an equity index-tracker
strategy with a strategy involving active managers. In the former case little time and
judgement is required to select the best tracker product for a given investment
category. However, in the latter case investment consultants may be asked by the
investor to produce a shortlist of recommended managers. This shortlist would be
drawn up by the consultant from a larger list of highly rated managers. Consultants
create ratings of asset managers by performing detailed due diligence exercises.12
Investment consultants employ teams of analysts to carry out these due diligence 33.
exercises. The outcome of due diligence exercises is that investment products
offered by asset managers are assigned ratings according to their expected future
performance. Investment consultants use different ratings systems, with some using
an ‘Approved’ or ‘Buy’ list, and others a graded system such as 1-5 or A/B/C
ratings.13
In contrast to ratings for retail funds such as the Morningstar Rating, investment 34.
consultants charge investors for their manager recommendation and rating service.
12 Due diligence exercises typically comprise both a qualitative and quantitative assessment. Qualitative factors often include idea generation, the ability to implement these ideas, quality of staff, incentive arrangements, and staff turnover. Quantitative assessments are also undertaken which examine portfolio construction and performance.
13 In order to combine ratings received from different investment consultants based on different scales, we requested that each consultant in our sample provide information only on those products which they deemed to have been ‘highly rated’ in the past. Highly rated products are those which a consultant would have considered recommending to clients for investment.
Interim Report Asset Management Market Study
November 2016 6
Access to these ratings, and/or a shortlist of recommended managers, is therefore
restricted to those that pay for the service.
Data
We have used two sources of data for our analysis of the drivers of net flows. 35.
The first source of data is a monthly history over ten years of those investment 36.
products that were highly rated by each investment consultancy in our sample of
firms. In this context an investment product is defined as an investment
style/category in which a fund manager offers asset management services. A product
would be offered to investors in different vehicles, such as in a pooled fund, or in a
segregated account.
Information on the historical ratings of investment consultants was provided to the 37.
FCA as part of an information request sent to six consulting firms.14 This source
allows us to identify, for each consultancy, when an investment product was first
rated highly, the period over which it remained highly rated, and (if applicable) the
period when the product was downgraded to a rating that was not highly rated. A
highly rated product here equates to a Buy/Approved rating. The consultancies in our
sample have provided us with data across a range of asset classes, and for products
covering multiple geographies.
The second source of data is eVestment, a third party data provider for the 38.
institutional fund management industry. Data are voluntarily submitted by
institutional asset managers to this database. eVestment is a leading data repository
for the institutional asset management industry, containing data on more than $37
trillion in institutional investment funds that are managed by traditional and
alternative external investment managers. The data provides one of the most
complete pictures available of traditional and alternative institutional investor and
asset management trends. There are several smaller institutional investment
vehicles on which eVestment currently does not collect data and these would include
real estate and infrastructure investments.15 eVestment data also does not include
any funds that may be self-managed by institutional investors.
We have sourced data for the same ten year period from eVestment on the following 39.
variables:
returns of institutional investment products;
manager-specified benchmarks of these products;
assets under management for these products;
net flows of assets for these products; and
charges for 2015 (eVestment does not hold historical charges data).
We have obtained eVestment data on returns and assets under management at a 40.
monthly and quarterly level, and data on net flows at a quarterly level.
The returns data are composite returns; individual returns earned by each client 41.
invested in that product may deviate from the composite returns, but we have been
informed that deviations are typically small.
14 We estimate that these firms collectively have a share ranging between 66-87 per cent (by revenue) of UK pension funds (see Chapter 8).
15 These illiquid asset classes have become important components of pension and insurance portfolios in recent years.

Interim Report Asset Management Market Study
November 2016 7
Composite returns are net of trading costs, but gross of investment management 42.
fees. Data on investment products (which includes pooled funds as well as
segregated accounts) are self-reported to eVestment by fund managers, and data on
products which are closed to investors or discontinued are retained in the database
by eVestment. The widespread use of the database, and scrutiny by its users,
suggests the data are accurate. We have been informed by eVestment that the
database is free from survivorship bias (see later in this Annex).
In order to assess whether consultant ratings drive fund flows it was necessary to 43.
match the products rated by consultants with the equivalent products in the
eVestment database. This allowed us to identify which of the products in the
eVestment database were highly rated, for each investment consultant, over time.
We include in our analysis all institutional products in eVestment in any asset 44.
category as long as consultants issue recommendations in that category; this
corresponds to approximately 230 out of the 250 eVestment categories.
In contrast to retail mutual funds that are rated by firms such as Morningstar and FE 45.
Trustnet, the products that are rated by investment consultants do not have unique
and widely-used identifying codes such as an ISIN or Sedol. Therefore, matching the
data provided by consultants into the eVestment database requires matching on the
name of the product. An examination of these product names showed a large
amount of variability across consultants in their naming conventions, to such an
extent that matching would need to have been manual. We therefore asked
investment consultants to identify the product in the eVestment database that each
highly rated product corresponded to. We took this step to ensure that the data on
highly rated products was accurately matched into the eVestment database.
We have provided a summary for Q4 2015 of the number of highly rated products in 46.
the eVestment database in the table below. Since there were six consulting firms in
our sample, for a given point in time the maximum number of recommendations for
an investment product is six. The table shows that where a product was highly rated
at a point in time, it was typically only rated highly by one consultant.
Table 1: Number of highly rated products in eVestment in Q4 2015
Number of ratings by consulting firms Frequency Percentage
0 27,480 92.5%
1 1,887 6.4%
2 250 0.8%
3 60 0.2%
4 15 0.1%
5 3 0.0%
6 2 0.0%
Total 29,697 100%
Source: Recommendations data sourced from investment consultant firms in our sample.
Methodology
Henceforth we use the term ‘recommendation’ to describe a product that has been 47.
highly rated by an investment consultant.
In this annex we explore the impact of investment consultants’ recommendations 48.
(and changes in those recommendations) on flows into and out of investment
products. We examine this by taking a standard flow-performance regression (see,
Interim Report Asset Management Market Study
November 2016 8
for instance, Ippolito (1992)16, Chevalier and Ellison (1997)17, and Sirri and Tufano
(1998) 18 ) and include additional variables that capture changes in ratings by
consultants.
We therefore examine the relationship between asset flows at the investment 49.
product level on the one hand, and consultants’ recommendations on the other,
controlling for the past performance of the product and a set of other attributes of
the product which could affect flows and recommendations.
We define net flows in two ways. First, we define them as the change in the USD 50.
amount of assets flowing into and out of a product, minus appreciation:
�����,� = ����,� − ����,��� ∗ (1 + ��,�)
In the expression above ����,� is the total net assets for product i at time period t,
and r�,� is the return on product i between time periods t-1 and t. Therefore, this
measure of net flows reflects the change in size of an investment product in excess
of the amount of growth that would have occurred had no new assets flowed in, but
dividends had been reinvested.
Second, we measure the percentage flow relative to the total net assets invested in 51.
the product three years previously:
%�����,� =$�����,�
����,���.�
In the expression above we have divided by TNA at t-3 owing to the persistence of 52.
the recommendation effect (see Results section below).
We estimate the response of flows to consultants’ recommendations with yearly data 53.
using the following regression:
�����,� = �� + �1�(��������������,��������) + �2���������,��� + ����������,��� + ��,�
The variables in the regression above are as follows.54.
�����,� is the USD or percentage net flow of product i between period t-1 and
period t. A single currency was used to make comparison clear, and USD was
chosen because this was the most widespread currency in which products were
denominated in eVestment.
�(��������������,��������)is a function (or a number of alternative functions) of the
number of recommendations product i received between time period t-1 and t-5.
The functions we use include the number of recommendations received by
consultants in our sample at the end of the previous year (t-1), the number of
additions and deletions from the consultants’ recommendations lists in any of the
five previous years (captured by 10 different dummy variables), or the net
number of additions and deletions to consultants’ recommendations lists over the
previous five years (captured by 5 different dummy variables).
In particular, we have examined the following variables. Recommendations
captures the level of the number of recommendations received by a product from
consultants. Chg in Rec captures the change in the number of recommendations
received by a product from consultants. Add to Rec captures additions to the
16 Ippolito, R., 1992, Consumer reaction to measures of poor quality, Journal of Law and Economics 35, 45–70.17 Chevalier, Judith, and Glenn Ellison, 1997, Risk taking by mutual funds as a response to incentives, Journal of Political
Economy 105, 1167–1200.18 Sirri, Erik, and Peter Tufano, 1998, Costly search and mutual fund flows, Journal of Finance 53, 1589–1622.

Interim Report Asset Management Market Study
November 2016 9
number of recommendations received by a product from consultants, while Rem
from Rec captures reductions to the number of recommendations received by a
product from consultants.
The consultants’ recommendation variable represents the number of consultants
at a point in time that have highly rated a given investment product. There are
six consultants in our sample for the analysis of flows, and therefore the
maximum number of recommendations that an investment product can receive at
a point in time is six. Investment consultants use different ratings systems, with
some using an ‘Approved’ or ‘Buy’ list, and others a graded system such as 1-5 or
A/B/C ratings. In order to combine ratings received from different investment
consultants based on different scales, we requested that each consultant in our
sample provide information only on those products which they deemed to have
been ‘highly rated’ in the past.19 Highly rated products are those which a
consultant would have considered recommending to clients for investment.
The control variables are as follows: the performance percentile rank compared to
other funds in the same eVestment classification between t-1 and t; the excess
performance (i.e. excess over the eVestment benchmark for that product)
percentile rank compared to other funds in the same eVestment classification
between t-1 and t; fees at the end of the sample; return volatility between t-3
and t-1; the total net assets at t-1 (for the relative flow regressions we use the
log of this number instead); and a full set of time (year or quarter depending on
the model) dummies. For the relative flow regressions we impose the additional
restriction that funds/products should have TNA at time t-3 > 10 USD million.
We estimate separate regressions using annual and quarterly data.55.
Results
Tables 2 and 3 report the results from estimating the above regressions, using a 56.
pooled time-series of cross-sectional data. Each column in this table represents the
results from a separate regression. The table presents the magnitude and sign of the
coefficients of the variables in each regression.
Column 1 of Table 2 shows the impact of investment consultants’ recommendations 57.
in year t-1 on total net assets in year t. The coefficient associated with
Recommendations (t-1) shows the yearly impact of being in one of the
recommendation list of one of the consultants in our sample. This impact is an
average impact of different consultants and products in different asset classes.
Column 4 shows the impact of consultants’ recommendations as the percentage
change in total net assets between year t-3 and year t.20
Columns 2 and 5 include a recommendation level variable (as in columns 1 and 4) 58.
plus the change in the number of recommendations. Thus the row Chg in Rec (t-1)
shows the change in total net assets at time t for one extra recommendation from
the consultants in our sample at time t-1. In this case the change leads to a change
of USD460m in assets or to an increase of 53%. We also run regressions for the
effect of recommendation changes from t-2 to t-5. The coefficients up to and
including t-4 are statistically significant and economically important; for example, the
effect of an additional recommendation in year t-4 is an increase of USD194m or
19 We intend to perform sensitivities on the rating grades used following the publication of the interim report.20 In each regression t-statistics are based on clustered standard errors, which are White heteroskedastic-consistent
standard errors corrected for possible correlation across observations of a given investment product (White, 1980; and Rogers, 1993). This method seems sensible given the size of the data panel (see Petersen, 2009).

Interim Report Asset Management Market Study
November 2016 10
12% of total net assets in year t. To understand the full impact of a recommendation
on flows it is necessary to include the impact of all the lags.
Columns 3 and 6 break down the changes in recommendations into additions to and 59.
deletions from the list of recommendations. The signs of the coefficients show that
flows (where statistically significant) are in the direction of the recommendation
change. In USD terms the additions and deletions have effects which are in a similar
order of magnitude, e.g. an increase of USD419m at year t for a single addition to
the number of recommendations in year t-1 and a decrease of USD601m for a single
deletion from the number of recommendations. However, these amounts correspond
to markedly different percentages: an 80% increase in total net assets versus a
decrease of 13%, showing that additions to recommendations are made more to
small funds than large funds relative to deletions from recommendations.
The lag of up to four years in the effect of recommendation changes on flows could 60.
be explained by a delay in the response of asset owners to such changes. It may also
reflect the fact that the investment consultants in our sample, while they have a high
combined share of the UK investment consulting market, are not the only
consultants to provide recommendations of investment products on a global basis.
The net flows variable that we have analysed in the regression above represents
flows from UK and non-UK investors. Therefore, for product categories in which UK
asset owners are relatively small players, the consultants in our sample may
represent a minority of the total number of consultants issuing recommendations. If
the recommendations of the consultants in our sample are correlated with those of
consultants not included (not just contemporaneously but also in lead-lag
relationships), our flow analysis may reflect the impact of recommendations and
changes which are not in the sample. Therefore, while it remains the case that a
positive coefficient for our recommendation variables means that recommendations
affect flows, the impact may show up as more long-lived and greater than it actually
is. Following the interim report, we will explore this question by comparing the effect
of recommendations on flows in fund categories in which our sample of consultants
has a high market share (notably UK categories) with the effect in fund categories in
which their market share is relatively low.

Interim Report Asset Management Market Study
November 2016 11
Table 2: Institutional net flows regression results: annual
Variables (1) (2) (3) (4) (5) (6)
Net flows Relative net flows
Recommendations (t-1) 133.51** 99.08 67.48 0.20*** -0.09* -0.11*
(1.98) (0.66) (0.49) (3.50) (-1.76) (-1.76)
Chg in Rec (t-1) 460.12*** 0.53***
(5.22) (5.10)
Chg in Rec (t-2) 293.81*** 0.22***
(4.46) (2.80)
Chg in Rec (t-3) 267.74*** 0.19***
(3.86) (3.93)
Chg in Rec (t-4) 194.88** 0.12***
(2.41) (2.84)
Chg in Rec (t-5) 15.16 0.07
(0.17) (1.60)
Add to Rec (t-1) 419.08*** 0.80***
(3.69) (4.52)
Add to Rec (t-2) 373.33*** 0.24*
(3.47) (1.69)
Add to Rec (t-3) 324.22*** 0.14*
(2.59) (1.80)
Add to Rec (t-4) 305.94** 0.09
(2.39) (1.34)
Add to Rec (t-5) 35.68 0.01
(0.34) (0.15)
Rem. from Rec. (t-1) -601.43*** -0.13**
(-3.57) (-1.99)
Rem. from Rec. (t-2) -242.32*** -0.20***
(-3.24) (-4.24)
Rem. from Rec. (t-3) -238.69*** -0.26***
(-2.69) (-5.30)
Rem. from Rec. (t-4) 32.24 -0.18***
(0.22) (-3.86)
Rem. from Rec. (t-5) 16.00 -0.25***
(0.09) (-4.53)
Perf. Rank - Return (t-1) 238.86*** 144.82 148.78 0.58*** 0.39 0.38
(3.95) (1.54) (1.58) (2.92) (1.25) (1.25)
Perf. Rank - Exc. Return (t-1) 288.61*** 366.55*** 363.99*** 0.62*** 0.80*** 0.80***
(4.92) (3.89) (3.89) (3.14) (2.64) (2.65)
Fee T -2.55*** -3.45* -3.45*0.00287
***0.00311
**0.00314
**
(-3.99) (-1.84) (-1.84) (2.75) (2.50) (2.53)
Return volatility (t-1) -300.50 -1,542.96*** -1,556.29*** -2.12*** -2.22*** -2.26***
(-0.77) (-3.02) (-3.05) (-3.09) (-2.83) (-2.87)
Total Net Assets (t-4) -0.05*** -0.09** -0.09** -0.09*** -0.05*** -0.05***
(-3.66) (-2.36) (-2.37) (-7.52) (-3.41) (-3.41)
Year dummies Yes Yes Yes Yes Yes Yes
Observations 38,226 16,869 16,869 26,214 13,576 13,576
R-squared 0.08 0.22 0.22 0.01 0.02 0.02
Source: eVestment data on net flows, returns, AUM, and fees. Recommendations data sourced from investment consultant firms in our sample. Robust t-statistics in parentheses *** p<0.01, ** p<0.05, * p<0.1. Fee variable is expressed in basis points.

Interim Report Asset Management Market Study
November 2016 12
Table 3: Institutional net flows regression results: quarterly
Variables (1) (2) (3) (4) (5) (6)
Net flows Relative net flows
Recommendations (t-1) 61.47*** 20.12 31.88 0.09*** 0.04** 0.01
(3.04) (0.79) (1.07) (4.43) (2.30) (0.67)
Chg in Rec (t-1) 185.34*** 0.19***
(5.51) (3.51)
Chg in Rec (t-2) 150.98*** 0.26**
(5.70) (2.48)
Chg in Rec (t-3) 159.05*** 0.16***
(2.90) (3.69)
Chg in Rec (t-4) 101.19*** 0.19***
(4.08) (2.75)
Chg in Rec (t-5) 93.79*** 0.18***
(4.46) (2.89)
Chg in Rec (t-6) 66.25*** 0.08**
(3.42) (2.29)
Chg in Rec (t-7) 87.84*** 0.16**
(4.25) (2.30)
Chg in Rec (t-8) 93.84*** 0.13*
(4.60) (1.91)
Chg in Rec (t-9) 57.80*** 0.03
(3.12) (0.37)
Chg in Rec (t-10) 48.89*** 0.02
(2.66) (0.26)
Chg in Rec (t-11) 75.26*** 0.08***
(3.22) (2.94)
Chg in Rec (t-12) 85.89*** 0.04**
(2.98) (2.31)
Add to Rec (t-1) 159.35*** 0.30***
(3.28) (3.13)
Add to Rec (t-2) 113.89*** 0.43**
(3.24) (2.46)
Add to Rec (t-3) 79.89*** 0.26***
(2.66) (3.43)
Add to Rec (t-4) 44.15 0.33***
(1.49) (2.79)
Add to Rec (t-5) 50.85* 0.27***
(1.80) (2.68)
Add to Rec (t-6) 33.45 0.13**
(1.25) (2.33)
Add to Rec (t-7) 68.18*** 0.24**
(2.68) (2.06)
Add to Rec (t-8) 81.80*** 0.18*
(3.48) (1.75)
Add to Rec (t-9) 63.64*** 0.11
(2.86) (1.29)
Add to Rec (t-10) 31.50 0.09**
(1.43) (2.04)
Add to Rec (t-11) 74.19** 0.09**
(2.49) (2.36)
Add to Rec (t-12) 84.42** 0.04*
(2.18) (1.65)
Rem. from Rec. (t-1) -203.19*** -0.11***
(-4.97) (-3.82)
Rem. from Rec. (t-2) -188.30*** -0.06
(-4.55) (-1.41)
Rem. from Rec. (t-3) -265.55* -0.07***
(-1.70) (-4.00)
Rem. from Rec. (t-4) -176.69*** -0.03
Interim Report Asset Management Market Study
November 2016 13
Variables (1) (2) (3) (4) (5) (6)
(-2.87) (-1.15)
Rem. from Rec. (t-5) -152.90*** -0.08*
(-3.83) (-1.88)
Rem. from Rec. (t-6) -110.88*** -0.04**
(-3.10) (-1.97)
Rem. from Rec. (t-7) -110.95*** -0.07***
(-3.37) (-3.62)
Rem. from Rec. (t-8) -103.92*** -0.10***
(-3.15) (-2.71)
Rem. from Rec. (t-9) -33.59 0.09
(-1.28) (0.56)
Rem. from Rec. (t-10) -78.22*** 0.11
(-2.59) (0.62)
Rem. from Rec. (t-11) -66.97* -0.07***
(-1.93) (-4.31)
Rem. from Rec. (t-12) -80.66** -0.07***
(-2.04) (-2.76)
Perf. Rank - Return (t-1) 81.81*** 61.97*** 62.09*** 0.12 0.11 0.11
(5.23) (3.50) (3.50) (1.59) (1.26) (1.28)
Perf. Rank - Exc. Return (t-1) 70.47*** 84.01*** 82.95*** 0.20*** 0.21*** 0.21***
(4.41) (4.67) (4.68) (2.71) (2.66) (2.68)
Fee T -0.67*** -0.66*** -0.65*** 0.00** 0.00** 0.00**
(-4.45) (-3.30) (-3.30) (2.23) (2.54) (2.40)
Return volatility (t-1) -141.08 -209.63* -206.66 -0.58*** -0.66*** -0.67***
(-1.29) (-1.65) (-1.63) (-3.07) (-3.36) (-3.40)
Total Net Assets (t-4) -0.02*** -0.02*** -0.02*** -0.03*** -0.03*** -0.03***
(-4.15) (-3.13) (-3.13) (-8.19) (-7.31) (-7.44)
Quarter dummies Yes Yes Yes Yes Yes Yes
Observations 157,887 111,191 111,191 95,815 83,625 83,625
R-squared 0.05 0.06 0.06 0.01 0.01 0.01
Source: eVestment data on net flows, returns, AUM, and fees. Recommendations data sourced from investment consultant firms in our sample. Robust t-statistics in parentheses *** p<0.01, ** p<0.05, * p<0.1. Fee variable is expressed in basis points.
Table 3 shows the same regressions as Table 2 but using quarterly, rather than 62.
annual, data. The results are qualitatively similar to the annual results. The quarterly
analysis shows that flows are quick to respond to changes in recommendations; for
example, an additional recommendation from the consultants in our sample at time
t-1 (i.e. one quarter before) leads to USD185m in additional assets or to an increase
of 19%.
Drivers of institutional net flows - conclusions
We find that changes in investment consultants’ recommendations in our sample63.
have a large and statistically significant effect on net flows into institutional
investment products. This finding is consistent with responses to our questionnaires
to asset managers, discussions with institutional investors, and consultants’ financial
data showing the revenues relating to the sale of advisory services to investors.
Institutional outcomes analysis
In this annex we compare the performance of recommended products (i.e. those 64.
products that have been assigned a high rating by a consultant) with that of non-
recommended products. We consider that this is a valid test of whether consultant
recommendations add value to end investors. From the perspective of an

Interim Report Asset Management Market Study
November 2016 14
institutional investor paying a consultant to provide a shortlist of recommended
managers in a given asset class/style, the investor is asking the consultant to pick
the expected ‘winners’ relative to other managers in that asset class/style. We
consider it reasonable for that end investor to expect that on average consultants
would be able to identify these winners, and that the benefits from the service
exceed the fees of the consultants’ service.
This annex does not seek to assess whether investment consultants’ overall services 65.
are adding value to investors, and focuses on one aspect of a consultant’s offering.
In particular, we have not assessed the value to investors from asset allocation
advice provided by consultants.
In addition, we have not assessed the possibility that the due diligence processes of 66.
consultants raise the overall quality of institutional asset managers. To the extent
this occurs consultants could be adding substantial value to end institutional
investors. Furthermore, we would expect this added value to spill over to those retail
investors that are invested in investment products offered by fund managers to both
retail and institutional investors.
Methodology
We assess the outcome of following investment consultants’ recommendations by 67.
comparing the performance of the products which they recommend with the
performance of non-recommended products and against benchmarks.
We start with a time series analysis of the gross returns of recommended and non-68.
recommended products in excess of manager selected benchmarks (as reported by
eVestment). We also present results on a net basis, i.e. after asset manager charges,
which arguably represent a more meaningful assessment of performance from the
perspective of an institutional investor. eVestment does not retain historical charges
information in its database, but does present information on ‘current’ composite
fees. When presenting results net of charges we have used the ‘current’ fee
information and applied it backwards to earlier periods. To the extent that fees in
prior years were higher than they were in 2015, our methodology would overstate
net performance.
Our net returns do not take into account the impact of the fees of the investment 69.
consultants themselves.
We then conduct a similar analysis, but this time comparing the performance of 70.
recommended funds with non-recommended funds in the same eVestment category;
again we conduct the analysis separately on a gross and net basis. We also break
down the recommendations between those issued by larger or smaller investment
consultants in our sample, to investigate whether there is any difference in ability to
pick ‘winners’ that is correlated with size.
Results
Table 4 assesses the performance of recommended products based on gross excess 71.
returns (top panel) and net excess returns (lower panel).21
Table 4: Institutional quarterly performance results: simple comparison
21 The results for recommended products assume that investors invest only in those products that are recommended, and update their portfolios in accordance with changes to those recommendations.

Interim Report Asset Management Market Study
November 2016 15
Variables(1) (2) (3)
(2)less (1)
(3)less (1)
Notrecommended
Recommended Recommended weighted
Gross quarterlyexcess returns over benchmarks
Constant 0.23*** 0.20*** 0.19*** -0.03 -0.04
(3.32) (2.91) (2.89) (-0.84) (-0.80)
Observations 39 39 39 39 39
Net quarterlyexcess returns over benchmarks
Constant 0.06 0.01 0.00 -0.05 -0.06
(0.85) (0.12) (-0.02) (-1.08) (-1.11)
Observations 39 39 39 39 39
Source: eVestment data on net flows, returns, AUM, and fees. Recommendations data sourced from investment consultant firms in our sample. t-statistics in parentheses *** p<0.01, ** p<0.05, * p<0.1 For recommended products we take a simple average and also a weighted average (giving more weight to products receiving more recommendations). The number of observations reflects the number of time periods (quarters) in our analysis. Returns expressed in percentage points.
Column 1 of Table 4 shows the average excess quarterly return in terms of quarterly 72.
percentage points of all non-recommended products in the sample over their
respective benchmarks and column 2 shows a simple average of the excess returns
over benchmark of recommended products. For example, a quarterly figure of 0.2 in
the table equates to an excess return of approximately 80 basis points on an
annualized basis. Column 3 shows a weighted average of the performance of
recommended products, in which each product is weighted by the number of
recommendations received.22
Both recommended and non-recommended products outperform their benchmark by 73.
between 80 and 100 basis points per annum (we multiply the quarterly figures by
four), and in both cases the results are statistically significant. However, as we see in
columns 4 and 5, there is no significant difference between the performance of
recommended and non-recommended products.
Turning to the net-of-fees analysis in the lower panel, the difference between 74.
recommended and non-recommended products remains insignificant. We also find
that the outperformance by both groups on a gross basis disappears on a net basis,
and the net-of-fees excess returns are statistically indistinguishable from zero.
The outperformance of both recommended and non-recommended products on a 75.
gross basis is consistent with the findings of other papers (e.g. Jenkinson, Jones, and
Martinez (2016)). As well as the possibility that institutional products in general
outperform benchmarks on a gross basis, we set out in the Conclusion section below
a number of other explanations for this result which we will explore following the
interim report.
22 We adopt a simple comparison in this table in which we do not condition on recommended and non-recommended products being in the same investment category. We perform a matched comparison in Table 5.

Interim Report Asset Management Market Study
November 2016 16
Nonetheless, according to our findings, any gross outperformance is eliminated by 76.
asset manager charges, so that the average effect of investing in recommended or
non-recommended products is a performance with little or no significant excess
return over benchmark. These net returns do not reflect advisor fees. Based on
information provided by investment consultants we estimate that fees for advisory
services for clients with assets under £50bn range from 5-15bps on an annualized
basis (see Chapter 8).23
Table 5 presents the results of an analysis in which, for each recommended product 77.
and quarter, we compute the average return (or excess return over benchmark) of
all non-recommended products in the same eVestment category.24 We then calculate
a time series of the difference in returns (or excess returns over benchmarks)
between recommended products and all non-recommended products in the same
eVestment category, and report the average of this time series together with t-stats
based on Newey-West standard errors. The top panel of Table 5 shows the analysis
on a gross basis, and the lower panel on a net-of fees basis.
Table 5: Institutional quarterly performance results: matched comparison
Variables (1) (2) (3) (4)Return
differenceExcess return
difference
Return difference weighted
Excess return difference weighted
Gross quarterly return differences (to products in the same category)
Constant -0.07** -0.06* -0.07** -0.07*
(-2.05) (-1.96) (-2.02) (-1.96)
Observations 39 39 39 39
Net quarterly return differences (to products in the same category)
Constant -0.10** -0.08* -0.11** -0.09*
(-2.36) (-1.73) (-2.26) (-1.73)
Observations 39 39 39 39
Source: eVestment data on net flows, returns, AUM, and fees. Recommendations data sourced from investment consultant firms in our sample. t-statistics in parentheses *** p<0.01, ** p<0.05, * p<0.1 For recommended products we take a simple average and also a weighted average (giving more weight to products receiving more recommendations). The number of observations reflects the number of time periods (quarters) in our analysis. Returns expressed in percentage points.
Column 1 of Table 5 shows the difference in returns between recommended and non-78.
recommended products, while column 2 shows the difference in excess returns in the
performance of these categories (the result of -0.06 per quarter in column 2 can be
compared with the relative performance of -0.03 in column 4 of Table 4; the
divergence is explained by the fact that, in Table 5, recommended products are
being compared only with other products in the same eVestment category. Columns
3 and 4 of Table 5 show the same analysis as columns 1 and 2, respectively, except
23 To compare these annual advisor fees with Table 4 the returns in Table 4 should be annualized and converted into basis points by multiplying them by 400.
24 There are approximately 250 eVestment categories in the database. Categories include, for example, “eVestment Europe ex-UK All Cap Core Eq”, “eVestment US Enhanced Mid Cap Equity”, and “eVestment Global Tactical Asset Alloca”.
Interim Report Asset Management Market Study
November 2016 17
that in columns 3 and 4 we weight the recommended products by the number of
times they were recommended.
These findings confirm those of Table 4 that recommended products do not 79.
outperform non-recommended products. However, in this analysis the
underperformance of recommended products becomes statistically significant (see
columns 1 and 3).
In the lower panel of Table 5 we show the same analysis on a net-of-fees basis. With 80.
the same levels of statistical significance as in the gross-of-fees analysis, the relative
performance of recommended funds becomes slightly worse.
Table 6 shows the same matched analysis as in Table 5, but instead of splitting 81.
between gross and net performance splits between the recommendations of larger
and smaller investment consultants. There are three consultant firms in each sub-
group.
Table 6: Institutional quarterly performance results: matched comparisonfor large and small investment consultants
Variables (1) (2) (3) (4)Return
differenceExcess return
difference
Return difference weighted
Excess return difference weighted
Gross quarterly return differences (to products in the same category) for large investment consultants
Constant -0.06* -0.06* -0.07* -0.07*
(-1.95) (-1.96) (-1.94) (-1.91)
Observations 39 39 39 39
Gross return differences (to products in the same category) for small investment consultants
Constant -0.08 0.03 -0.08 0.01
(-1.12) (0.39) (-1.14) (0.17)
Observations 39 39 39 39
Source: eVestment data on net flows, returns, AUM, and fees. Recommendations data sourced from investment consultant firms in our sample. t-statistics in parentheses *** p<0.01, ** p<0.05, * p<0.1 For recommended products we take a simple average and also a weighted average (giving more weight to products receiving more recommendations). The number of observations reflects the number of time periods (quarters) in our analysis. Returns expressed in percentage points.
The comparison suggests that there is a difference in performance of investment 82.
products recommended by small versus large consultants. Recommendations by
large consultants do worse (at the 10% level) than non-recommended funds. By
contrast, small consultant recommendations do not perform significantly worse than
non-recommended products. Following the publication of the interim report we
intend to examine these apparent differences further, by examining the performance
of individual consultants.

Interim Report Asset Management Market Study
November 2016 18
Institutional outcomes analysis - conclusions
Our analysis of the performance of investment products recommended by investment 83.
consultants shows that, across all product categories taken together, they do not
perform better than non-recommended products. In further work which we will carry
out after the interim report we will explore this finding by breaking down the sample
in various ways, notably by product category.
However, we found that both recommended and not-recommended products 84.
outperform their benchmarks on a gross basis by between 80 and 100 basis points
on average on an annualized basis. Nonetheless, according to our findings, any gross
outperformance is eliminated by asset manager charges, so that the average effect
of investing in recommended or non-recommended products is a net performance
with little or no significant excess return over benchmark.
The finding that on a gross basis both recommended and not-recommended products 85.
outperform their benchmarks requires further investigation as it suggests that on
average institutional products outperformed their manager-specified benchmarks.
This could reflect genuine outperformance by institutional products, in which case
(given that there is a zero sum game across fund and non-fund investors) other
investors must collectively have been underperforming. In order to establish whether
this is a genuine finding, we have considered four other possible explanations set out
below.
Third party databases could be subject to survivorship bias
Third party databases could in theory be subject to survivorship bias, in that only 86.
surviving products are present and therefore returns are overstated compared to
actual returns. eVestment has informed us that their database is survivorship bias
free, and firms cannot remove data that has been submitted to eVestment; it
remains there forever. We have therefore ruled out this potential explanation.
Fund managers potentially cease reporting poor performance data to third party databases
In theory it is possible that fund managers that perform poorly cease reporting 87.
returns data, and may cease reporting altogether or only start reporting returns data
again when their performance improves. Since third party databases rely on data
that is self-reported by fund managers it is in theory possible that managers cease
reporting returns data when they perform poorly.
We have been informed by eVestment that it is not possible for a manager to cease 88.
reporting performance data and then resume reporting. In this case eVestment
requires the manager fill in the missing historical data. We have investigated
whether this policy is consistent with the actual eVestment database and found very
few instances where managers report information, stop reporting it for a period, and
then start again. Out of the 43,098 products we have examined in eVestment’s
database, this feature occurs for just 124 of them (0.29%). We have therefore ruled
out the possibility that institutional fund managers temporarily cease reporting bad
performance.
We have also considered whether managers may cease reporting data forever once 89.
an institutional product performs poorly. We consider that there are incentives which
work against fund managers stopping reporting returns data: investment consultants

Interim Report Asset Management Market Study
November 2016 19
may decide not to rate or recommend a product that has missing returns data, and
end investors also may not invest in such products. Investment consultants may
decide not to rate/recommend a product because we have been informed that
several consultants use the eVestment database for their due diligence work. If
consultants and investors respond in this fashion then the fund manager’s product
could experience negative net flows and potentially close. For this reason we
consider that a large institutional product would be unlikely to cease reporting poor
performance data. However, a small product with little to lose other than the
reputation of its manager(s) may be more inclined to cease reporting poor
performance data. If the return was very poor then the product may be very likely to
close anyway, so there may be little downside to stopping reporting. The upside from
the fund manager’s perspective is that their name would not be forever attached to a
very poor return, which may allow the manager to have a second life at another
product or firm. We recognise that this possibility is speculative and we do not have
evidence that supports or rejects this possibility. We have therefore provisionally
decided to rule out the possibility that institutional managers cease reporting data
forever on poor performing products. We welcome views from third parties on this
point.
Manager-specified benchmarks could be gamed by fund managers
In theory the benchmarks which institutional fund managers report to third party 90.
databases could be chosen to artificially inflate their performance. If this occurred
then one might expect to see that on average institutional asset managers delivered
returns greater than the benchmark. However, institutional asset managers may face
a greater incentive to ensure that their chosen benchmarks are recognised by
investment consultants and potential investors.
Following the publication of the interim report we intend to investigate this possibility 91.
further. We are considering two analyses. First, we may re-calculate the average
excess returns of institutional asset managers using alternative benchmarks chosen
by the FCA, to understand whether we obtain a different result. A significant risk with
such an analysis is that the results are driven by a subjective assessment of the
‘correct’ benchmark. We are therefore considering an alternative analysis: calculating
abnormal returns for institutional investors by using academic factor models.
Tax assumptions used in calculating the returns of benchmark indicescould overstate excess performance
A further possible explanation for a finding that on average performance exceeds the 92.
benchmark is the tax assumption used in calculating the return of benchmark
indices. We understand that the returns of certain indices assume withholding tax
applies on dividends, when in practice many funds can avoid withholding tax through
their choice of domicile. For example, analysis by Morningstar of ETFs tracking the
EURO STOXX 50 shows that these ETFs typically achieved around 50 basis points of
outperformance because their benchmark assumes withholding tax (i.e. the index
was net of tax, not gross of tax). 25 To the extent that the version (and the
implications) of the benchmark declared by institutional managers is not transparent
to consultants and investors, this could partly explain an average outperformance
finding. In addition, this could be distorting investors’ asset placement decisions.
25
http://media.morningstar.com/uk/MEDIA/Research_Paper/Morningstar_Report_Measuring_Tracking_Efficiency_in_ETFs_February_2013.pdf

Interim Report Asset Management Market Study
November 2016 20
Following the publication of the interim report we intend to investigate further the 93.
extent to which the tax assumptions used in calculating the returns of benchmark
indices could explain outperformance.
If none of the above explanations apply, then we must conclude that institutional 94.
products on average perform ‘better’ (in that they genuinely outperform their
benchmarks) than other products in the same market. Given that there is a zero sum
game across fund and non-fund investors, collectively other investors must be
underperforming.

Interim Report Asset Management Market Study
November 2016 21
© Financial Conduct Authority 2015
25 The North Colonnade Canary Wharf
London E14 5HS
Telephone: +44 (0)20 7066 1000
Website: www.fca.org.uk
All rights reserved