asset management industry market sizing: 2017–2022€“2022, provides a comprehensive perspective...
TRANSCRIPT

December 2017
Asset Management Industry Market Sizing: 2017–2022

2
An
alys
is o
f E
xter
nal
Fu
nd
Dis
trib
uti
on
Co
sts—
U.S
. For questions or further information regarding this report, please contact Jeff Strange ([email protected]) or [email protected].
For information on any SI product, please call +1-212-217-6884 or email [email protected]
For sales inquiries, please contact: Americas: [email protected] / +1 212 217 6884 EMEA: [email protected] / +44 800 074 057
Asset Management Industry Market Sizing: 2017–2022
DISCLAIMER: The information, data, analyses and opinions contained herein (a) include confidential and proprietary information of the aforementioned companies, (b) may not be copied or redistributed for any purpose, (c) are provided solely for information purposes, and (d) are not warranted or represented to be correct, complete, accurate, or timely. Past performance is no guarantee of future results. Reproduction in whole or in part prohibited except by permission. Any data or commentary in this report is for the internal use of the client only and is not to be disseminated to the general public and sales intermediaries in the form of regulatory or other reports, promotional material, or advertising without the prior written consent of SI.
This report has been prepared using information and sources we believe to be reliable; however, we make no representation as to its accuracy, adequacy or completeness, nor do we assume responsibility for any errors or omissions or for any results obtained from the use of this report, including any action taken with respect to securities referred to in this report. Our employees may from time to time acquire, hold or sell a position in securities mentioned herein. We may from time to time perform services for any company mentioned in this report. This report is not a prospectus or representation intended for use in the purchase or sale of any securities mentioned in this report.
SI research is available by subscription and by single copy upon request to the publisher.
Strategic Insight (SI) 805 Third Avenue, 21st Floor New York, NY 10022 USA
Copyright 2017. Strategic Insight. All rights reserved.

3
Jeff Strange serves as a Managing Director of U.S. Research at SI, where he covers asset management and distribution trends. In his role, he helps to lead SI’s research and advisory services focused on the U.S. fund industry, with specialized coverage of the subadvisory market. Prior to joining SI, he was the Director of Research at DST kasina and was responsible for setting research direction and managing the research team. For nearly seven years, Jeff focused on managed accounts research, including extensive research on advisory platform design, at
Cerulli Associates. He has also worked at Cole Real Estate, State Street Research, and FleetBoston Financial. Jeff earned a BS from Georgetown University and is a CAIA charterholder.
Report Author: Jeffrey Strange Contributions by Dennis Bowden, Matt Cirillo, Paul Curley, Anthony Disanzo, Alan Hess, Julie Martin
his Strategic Insight (SI) Research report, Asset Management Industry Market Sizing: 2017–2022, provides a comprehensive perspective on the size and growth of the fund market in the U.S. and internationally. The report combines Strategic Insight’s best thinking on market dynamics with its proprietary model to forecast growth. This is the only industry research that provides five-year projections of fund assets and flows
at the asset class level.
The report offers insight on formative trends that will impact various segments of the industry, including analysis of the retirement market, the broker-dealer landscape, and global wealth management developments. It is based on a foundation of historical data from Simfund and third party sources, including: company filings, Discovery Data, Federal Reserve Board (FRB), Internal Revenue Service (IRS) Statistics of Income Division, Investment Company Institute (ICI), Money Management Institute (MMI), Morningstar, National Association of Government Defined Contribution Administrators, U.S. Department of Labor (DOL), Zephyr Associates, and Access Data, a Broadridge Company.
T
About This Report
Ass
et M
anag
emen
t In
du
stry
Mar
ket
Sizi
ng
: 20
17–
202
2
About the Author
4
An
alys
is o
f E
xter
nal
Fu
nd
Dis
trib
uti
on
Co
sts—
U.S
.
Table of Contents
Contents
Executive Summary 8
Methodology 11
Channel Overview 11
2017 Methodology Enhancement 11
Sales and Asset Estimates and Projections 11
Firm Rankings 12
Section 1: 2016 Investment Year in Review 13
Key Takeaways 13
Market Summary 13
Review of Assets and Flows 13
Conclusion 16
Section 2: The Household Balance Sheet and Forces Shaping the Retail Market 17
Key Takeaways 17
U.S. Household Balance Sheet 17
Forces Shaping the Retail Market 19
Demographics 19
Technology 22
Regulation 23
Lower Market Returns 23
Conclusion 23
Section 3: Projections by Asset Class 24
Key Takeaways 24
Projections Overview 24
Capital Markets Returns Assumptions 25
Equity and Multi-asset Fund Projections 25
Domestic Equity 27
International/Global Equity 28
Multi-Asset and Liquid Alternatives 30
Commodities 32
Bond Fund Projections 33
Corporate Bond 33
International/Global Bond 35
Government Bond 35
Tax-free Bond 36
Conclusion 36

5
TOCTable of Contents
Ass
et M
anag
emen
t In
du
stry
Mar
ket
Sizi
ng
: 20
17–
202
2
Contents (continued)
Section 4: Retail Investment Market Product Projections, 2017–2022 37
Key Takeaways 37
Retail Products by Segment 37
Mutual Funds and ETFs 39
Separately Managed Accounts (SMA) 40
Variable Annuities 41
529 College Savings Plans 41
Closed-end Funds 42
Conclusion 42
Section 5: Distribution Channels 43
Key Takeaways 43
U.S. Subadvisory Market 45
Section 6: The Intermediary Channel—Assets, Sales and Adviser Counts 47
Key Takeaways 47
Projected Growth by Intermediary Channel 48
Adviser Headcount 49
Wirehouse Channel 49
Regional Broker-Dealer Channel 51
Independent Broker-Dealer Channel 53
Bank Broker-Dealer Channel 54
Insurance Broker-Dealer Channel 55
Independent RIA Channel 56
Section 7: Retirement Markets 57
Key Takeaways 57
Defined Contribution Market Overview 57
Target-date funds 59
Conclusion 60
Section 8: Global Asset Management 61
Key Takeaways 61
Global Snapshot 61
Dominant Global Themes and Opportunities 65
Global ETFs, Index and Active Funds Trends 65
Socially Responsible Investing 68
Consequences of Fees Unbundling under MiFID II 70
Global Growth Outlook 72

6
An
alys
is o
f E
xter
nal
Fu
nd
Dis
trib
uti
on
Co
sts—
U.S
.
Directory of Exhibits
Exhibit 1-1 Summary of Growth and Projections by Asset Class ..................................................................................................... 8
Exhibit 1-2 Summary of Mutual Fund Growth and Projections for Major Intermediary Channels.......................................... 9
Exhibit 1-3 Market Performance as Measured by Leading Indexes, 2011–YTD Sept 2017 ...................................................... 13
Exhibit 1-4 Mutual Funds and ETFs: 5-Year Summary by Asset Class, 2011–2016 ..................................................................... 14
Exhibit 1-5 Mutual Funds and ETFs: Net Flows by Asset Class, 2011–3Q 2017 ........................................................................... 14
Exhibit 1-6 Mutual Funds and ETFs: Asset and Net Flows by Product and Asset Class, 2013–3Q 2017 .............................. 15
Exhibit 2-7 The U.S. Household Balance Sheet—Key Components .............................................................................................. 18
Exhibit 2-8 Forces Shaping the Market ................................................................................................................................................... 19
Exhibit 2-9 Historical Student Loan Debt and Average Increase in Debt ($ billions), 2003–2016..........................................20
Exhibit 2-10 Evolution of Household Lifecycle: Debt for Life, Wealth Accumulation Delayed, Later and Longer Payout Phase ...........................................................................................................................................21
Exhibit 2-11 U.S. Personal Savings Rate as a Percent of Disposable Annual Income, 1959–2016............................................21
Exhibit 2-12 The Transition of Focus and Influence has Moved Up the Value Chain, Landing on the Consumer and their Objectives in the Digital Age .......................................................................................................................22
Exhibit 2-13 Annual Total Investment Advisory Solutions Assets and UMA Programs as a Percentage of Total Assets, 2011–2Q 2017 ............................................................................................................................................22
Exhibit 2-14 Median Pre-Tax Operating Margin for Publicly Traded Asset Managers, 1997–2016 ..........................................23
Exhibit 3-15 Summary of Projected Growth Rates for Mutual Funds and ETFs ............................................................................24
Exhibit 3-16 Total Net New Flows for Mutual Funds and ETFs, 2011–2022P .................................................................................25
Exhibit 3-17 Investment Markets, Fund Average Annual Return Assumptions, 2017–2022 .......................................................25
Exhibit 3-18 Equity/Multi-Asset Mutual Funds and ETFs: Asset Growth, 2011–2016 ...................................................................26
Exhibit 3-19 Domestic Equity: Asset and Net Flows Projections, 3Q’17–2022P ........................................................................... 27
Exhibit 3-20 International/Global Equity: Asset and Net Flows Projections, 3Q’17–2022P .......................................................28
Exhibit 3-21 Annual Net New Flows in Intermediary Channels to U.S. Equity and International Equity Morningstar Categories Compared to Index Returns, 2013–YTD 3Q’17 ................................................................28
Exhibit 3-22 Net New Flows in Intermediary Channels to Four and Five Star Funds in U.S. Equity and International Equity Morningstar Categories, 2013–YTD 3Q’17 ................................................................................29
Exhibit 3-23 Multi-Asset: Asset and Net Flows Projections, 3Q’17–2022P .....................................................................................30
Exhibit 3-24 Liquid Alts: Asset and Net Flows Projections, 3Q’17–2022P ........................................................................................31
Exhibit 3-25 Asset Concentration among Alternative Mutual Funds and Managers, 2008–3Q’17 .......................................... 32
Exhibit 3-26 Commodities: Asset and Net Flows Projections, 3Q’17–2022P ................................................................................ 32
Exhibit 3-27 Bond Mutual Funds and ETFs: Asset Growth, 2011–2016 ...........................................................................................33
Exhibit 3-28 Corporate Bond: Asset and Net Flows Projections, 3Q’17–2022P ...........................................................................34
Exhibit 3-29 International/Global Bond: Asset and Net Flows Projections, 3Q’17–2022P .........................................................34
Exhibit 3-30 Government Bond: Asset and Net Flows Projections, 3Q’17–2022P .......................................................................35
Exhibit 3-31 Tax-Free Bond: Asset and Net Flows Projections, 3Q’17–2022P ...............................................................................36
Exhibit 4-32 Growth of Retail Investment Product Assets, 2011–2016 ........................................................................................... 37
Exhibit 4-33 Retail Investment Product Asset, Appreciation, and Net Flows Projections, 2016–2022P ................................38
Exhibit 4-34 Retail Investment Product Asset Market Share, 2011–2022P .....................................................................................39
Table of Contents
7
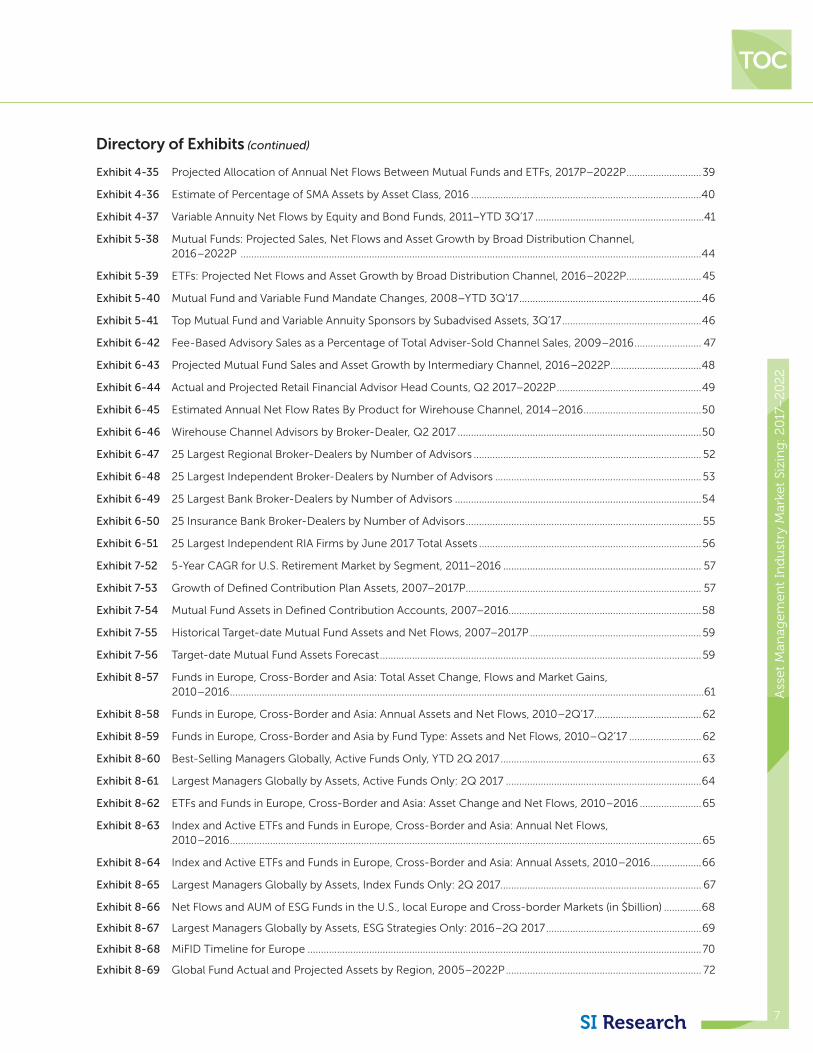
Directory of Exhibits (continued)
Exhibit 4-35 Projected Allocation of Annual Net Flows Between Mutual Funds and ETFs, 2017P–2022P ............................39
Exhibit 4-36 Estimate of Percentage of SMA Assets by Asset Class, 2016 ......................................................................................40
Exhibit 4-37 Variable Annuity Net Flows by Equity and Bond Funds, 2011–YTD 3Q’17 ...............................................................41
Exhibit 5-38 Mutual Funds: Projected Sales, Net Flows and Asset Growth by Broad Distribution Channel, 2016–2022P ............................................................................................................................................................................44
Exhibit 5-39 ETFs: Projected Net Flows and Asset Growth by Broad Distribution Channel, 2016–2022P ............................45
Exhibit 5-40 Mutual Fund and Variable Fund Mandate Changes, 2008–YTD 3Q’17 ....................................................................46
Exhibit 5-41 Top Mutual Fund and Variable Annuity Sponsors by Subadvised Assets, 3Q’17 ....................................................46
Exhibit 6-42 Fee-Based Advisory Sales as a Percentage of Total Adviser-Sold Channel Sales, 2009–2016 ......................... 47
Exhibit 6-43 Projected Mutual Fund Sales and Asset Growth by Intermediary Channel, 2016–2022P ..................................48
Exhibit 6-44 Actual and Projected Retail Financial Advisor Head Counts, Q2 2017–2022P ......................................................49
Exhibit 6-45 Estimated Annual Net Flow Rates By Product for Wirehouse Channel, 2014–2016 ............................................50
Exhibit 6-46 Wirehouse Channel Advisors by Broker-Dealer, Q2 2017 ...........................................................................................50
Exhibit 6-47 25 Largest Regional Broker-Dealers by Number of Advisors ..................................................................................... 52
Exhibit 6-48 25 Largest Independent Broker-Dealers by Number of Advisors .............................................................................53
Exhibit 6-49 25 Largest Bank Broker-Dealers by Number of Advisors ............................................................................................54
Exhibit 6-50 25 Insurance Bank Broker-Dealers by Number of Advisors ........................................................................................ 55
Exhibit 6-51 25 Largest Independent RIA Firms by June 2017 Total Assets ...................................................................................56
Exhibit 7-52 5-Year CAGR for U.S. Retirement Market by Segment, 2011–2016 .......................................................................... 57
Exhibit 7-53 Growth of Defined Contribution Plan Assets, 2007–2017P ........................................................................................ 57
Exhibit 7-54 Mutual Fund Assets in Defined Contribution Accounts, 2007–2016........................................................................58
Exhibit 7-55 Historical Target-date Mutual Fund Assets and Net Flows, 2007–2017P ................................................................59
Exhibit 7-56 Target-date Mutual Fund Assets Forecast ........................................................................................................................59
Exhibit 8-57 Funds in Europe, Cross-Border and Asia: Total Asset Change, Flows and Market Gains, 2010–2016 .................................................................................................................................................................................61
Exhibit 8-58 Funds in Europe, Cross-Border and Asia: Annual Assets and Net Flows, 2010–2Q’17 ........................................62
Exhibit 8-59 Funds in Europe, Cross-Border and Asia by Fund Type: Assets and Net Flows, 2010–Q2’17 ...........................62
Exhibit 8-60 Best-Selling Managers Globally, Active Funds Only, YTD 2Q 2017 ...........................................................................63
Exhibit 8-61 Largest Managers Globally by Assets, Active Funds Only: 2Q 2017 .........................................................................64
Exhibit 8-62 ETFs and Funds in Europe, Cross-Border and Asia: Asset Change and Net Flows, 2010–2016 .......................65
Exhibit 8-63 Index and Active ETFs and Funds in Europe, Cross-Border and Asia: Annual Net Flows, 2010–2016 ................................................................................................................................................................................65
Exhibit 8-64 Index and Active ETFs and Funds in Europe, Cross-Border and Asia: Annual Assets, 2010–2016 ...................66
Exhibit 8-65 Largest Managers Globally by Assets, Index Funds Only: 2Q 2017........................................................................... 67
Exhibit 8-66 Net Flows and AUM of ESG Funds in the U.S., local Europe and Cross-border Markets (in $billion) ..............68
Exhibit 8-67 Largest Managers Globally by Assets, ESG Strategies Only: 2016–2Q 2017 ..........................................................69
Exhibit 8-68 MiFID Timeline for Europe ...................................................................................................................................................70
Exhibit 8-69 Global Fund Actual and Projected Assets by Region, 2005–2022P ......................................................................... 72
TOC
Ass
et M
anag
emen
t In
du
stry
Mar
ket
Sizi
ng
: 20
17–
202
2
Table of Contents


805 Third Avenue, 21st Floor, New York, NY 10022, USA | P: +1-212-217-6884 | E: [email protected]