asset allocation - modernized
TRANSCRIPT

We make owners and management visualize
the potential with our approach
Asset allocation – modernized approach
ASSET ALLOCATION

We make owners and management visualize
the potential with our approach
ASSET ALLOCATION Introduction
Describing uncertainty in a statistical sound
manner is a requirement for all asset allocation
models. Multiple scenarios improve forecasts,
will be of value in decision making and enables
an investor to assign probabilities for each
scenario. Combined with investors subjective
opinion about future economic events-
expectancy for asset returns can be stuctured in
allocation models.
Scenarios covered in this approach have been
created under the assumption that most of the
time there is a link between economic activity
and the financial markets and therefore certain
scenarios tend to repeat themselves with
predictable consequences in the financial
market.

We make owners and management visualize
the potential with our approach
Allocation models require a macro triggered,
structured and modernized approach
facilitating the following;
✓ Allocation - (tactical) based on a country’s state of
macro economic condition and outlook (classification)
and subsequent asset returns.
✓ Structured – Macro economic data series will be used
and collected to evaluate asset returns for periods
matching classification of economy.
✓ Modernized - in how data is collected, organized and
processed to come up with weighted asset allocation
(machine learning) that periodically is updated.
Approach
ASSET ALLOCATION Copyright © 2017 Beide Forvaltning A/S
Effective use of market information requires a structured approach

Tactical allocation
ASSET ALLOCATION Copyright © 2017 Beide Forvaltning A/S
STATE OF ECONOMY defined into 6 classifications
based on macro economic indicators using monthly /
quarterly data serier. For each period asset returns
are organized in structured time series.
STATE OF ECONOMY
Moderate Recession. The economy is down as measured by the
industrial Production index (IPI) and the stock market is down as well.
Stagnant. The economy is going sideways (0 – 1 %) as measured by
The Industrial Production Index and the stock market is sideways as well.
Deep Recession. The economy is down as measured by the
Industrial Production Index (IPI) and the stock market is down more than 25%.
Chaos. When the financial markets do not behave in accordance with the
cause – effect relationship described above.
Inflationary. The consumer price Index (CPI) is growing much faster
than the industrial Production Index (IPI).
Growth. The economy is growing as measured by the Industrial
Production Index (IPI) and the stock market is up more than 5%.

Structured
ASSET ALLOCATION Copyright © 2017 Beide Forvaltning A/S
Macro economic indicators and asset return
series stored in and organized data bank.
Data retrieved, processes and stored using
prevalent methods and processes.
Tickers and data series retrieved, scrubbed, stored are accessible
utilizing market information systems and format protocols.
Additional data series created to address relationships, principal
components analysis and other descriptive indicators derived from
macro economic indicators or/and asset return series (composite
series). These data series to be used in overall asset allocation
process.
MOIGC87P INDEX RBOBG87P INDEX DIEILAAM INDEX TSUNRCHR INDEX TSUNBRSL INDEX MOINY87P INDEX
Observation Date Price Price Price Price Price Price
23.02.2009 104,60 103,98 116,95 1,345 1,18 107,58
24.02.2009 109,90 109,37 120,82 1,39 1,2 110
25.02.2009 117,07 116,57 126,77 1,47 1,21 117,05
26.02.2009 130,70 130,2 126,9 1,49 1,21 130,42
27.02.2009 128,50 128 125,25 1,52 1,24 128,7
28.02.2009 128,50 128 125,25 1,52 1,24 128,7
01.03.2009 128,50 128 125,25 1,52 1,24 128,7
02.03.2009 120,32 120,32 111,12 1,47 1,1733 122
03.03.2009 123,72 123,72 114,71 1,39 1,12 125,44
04.03.2009 129,46 129,36 117,95 1,415 1,12 131,41
05.03.2009 124,37 124,27 111,48 1,48 1,16 120,77
06.03.2009 125,12 125,37 117,5 1,4 1,12 123,97
07.03.2009 125,12 125,37 117,5 1,4 1,12 123,97
08.03.2009 125,12 125,37 117,5 1,4 1,12 123,97
09.03.2009 124,65 124,5 116,04 1,425 1,1825 123,26
10.03.2009 120,88 120,63 115,37 1,4 1,165 120,22
11.03.2009 115,46 115,33 109,62 1,4 1,165 115,12
12.03.2009 125,06 124,76 118,64 1,37 1,18 125,07
13.03.2009 124,97 124,87 115,72 1,37 1,18 125,54
Modernized
ASSET ALLOCATION Copyright © 2017 Beide Forvaltning A/S
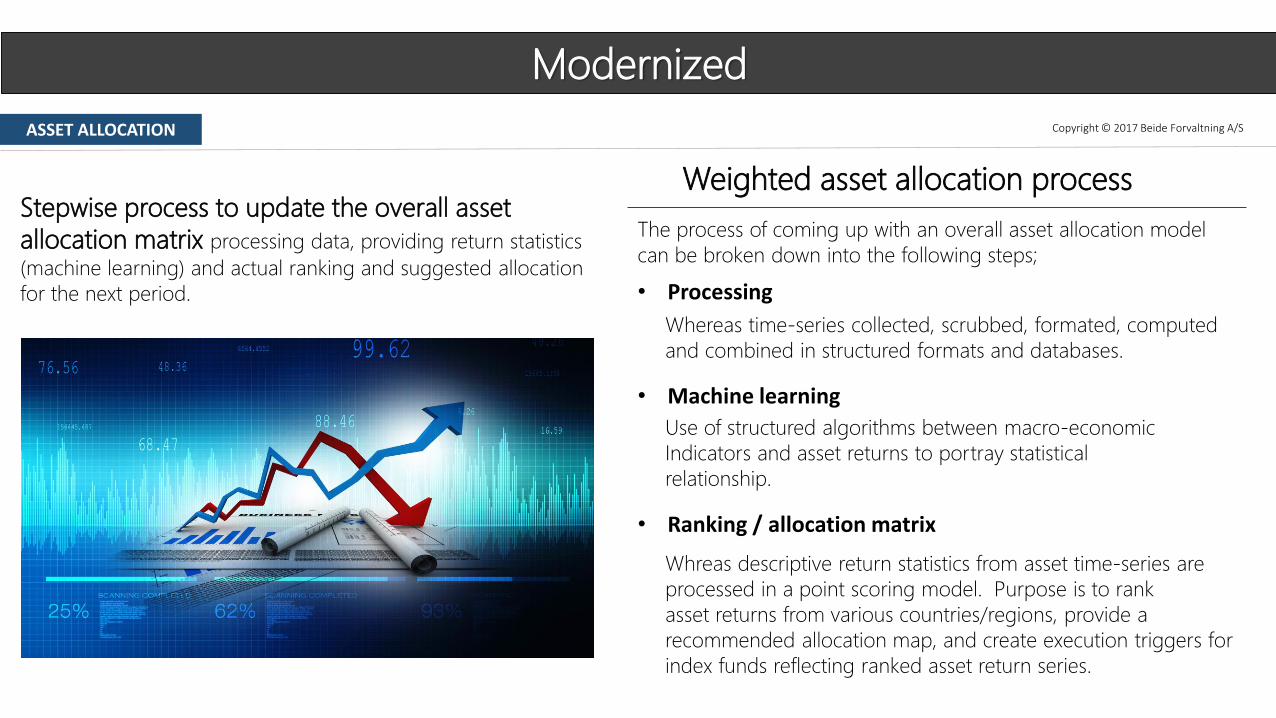
Weighted asset allocation processStepwise process to update the overall asset
allocation matrix processing data, providing return statistics
(machine learning) and actual ranking and suggested allocation
for the next period. • Processing
• Machine learning
• Ranking / allocation matrix
The process of coming up with an overall asset allocation model
can be broken down into the following steps;
Whereas time-series collected, scrubbed, formated, computed
and combined in structured formats and databases.
Use of structured algorithms between macro-economic
Indicators and asset returns to portray statistical
relationship.
Whreas descriptive return statistics from asset time-series are
processed in a point scoring model. Purpose is to rank
asset returns from various countries/regions, provide a
recommended allocation map, and create execution triggers for
index funds reflecting ranked asset return series.

Product & Prices – Asset Allocation
TCopyright © 2017 Beide Forvaltning A/S
Product Description Prices
Process MapAssessment and design of an overall
infrastructure for recommending
mapping of data series, processes and
storage mediums to be used for
countries / regions in overall asset
allocation.
175 USD per hour to develop
assessment, documentation
of recommended
insfrastructure requirement.
Allocation modelDesign of a scoring model with design
of weight categories for the scoring
purpose in question (rank of asset
return series,) including qualitative and
quantitative questions to be
addressed in arriving at an overall
comparable scoring og priotized asset
return serires.
175 USD per hour to develop
overall scoring model,
subcategorizations and
executive reporting.
ASSET ALLOCATION
Analytical depth and data analysis will provide valuable insights to be combined with economic outlook.