asset allocation in health and pension plans— your key decision … · 2016-10-24 · asset...
TRANSCRIPT

The opinions expressed in this presentation are those of the speaker. The International Foundationdisclaims responsibility for views expressed and statements made by the program speakers.
Asset Allocation in Health and Pension Plans—Your Key Decision
Ian W. JonesDirector and Senior ConsultantThe Bogdahn GroupBuffalo, New York
I02-1

Asset Allocation in Health and Pension Plans—
Your Key Decision• Understanding your demographics and fund projections• Estimating future asset class returns and risk
expectations• ls there an optimal asset allocation model?• What are the different and dominant types of risk
associated with various asset allocation models?• Trade-off of risk and return
I02-2
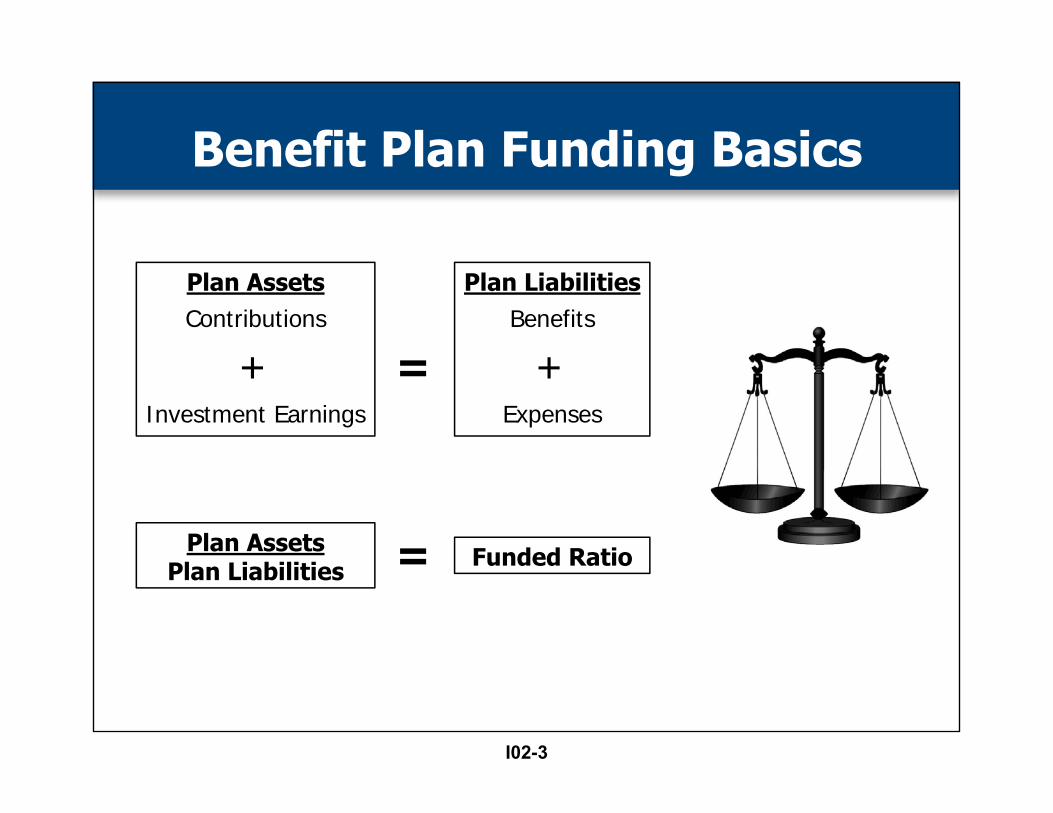
Plan AssetsContributions
+Investment Earnings
Plan LiabilitiesBenefits
+Expenses
=
Plan AssetsPlan Liabilities Funded Ratio=
Benefit Plan Funding Basics
I02-3

Benefit Plan Funding Basics
Plan Funding Level:Actuary assesses plan’s demographics and asset allocation structure to determine current and projected funding levels.Factors considered:• Industry: growing or shrinking
– Manufacturing, building/construction, service, etc.
• Age of participant population and how long they live• Ratio of active vs. inactive participants• Contributions, benefits, expenses• Labor/management negotiations• Rate of return potential
Significant factor that will impact the funding level of a defined benefit pension plan is the assumed and actual
rate of return earned on plans assets.
I02-4
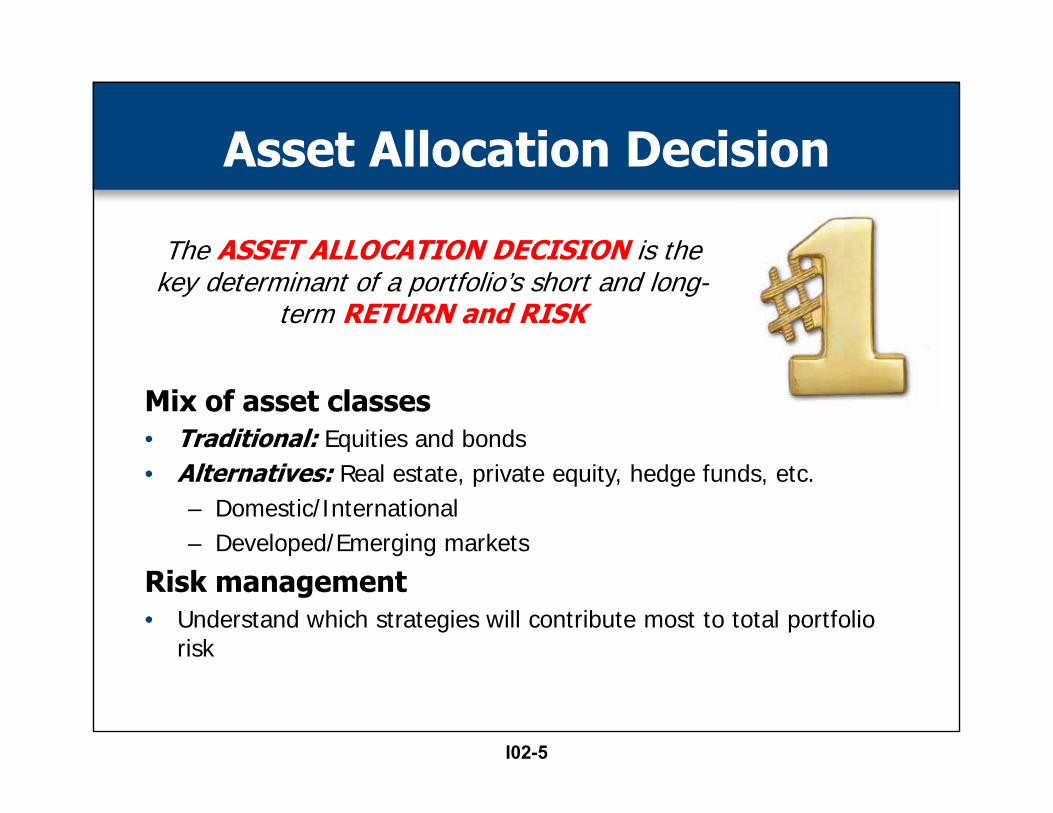
The ASSET ALLOCATION DECISION is the key determinant of a portfolio’s short and long-
term RETURN and RISK
Asset Allocation Decision
Mix of asset classes• Traditional: Equities and bonds• Alternatives: Real estate, private equity, hedge funds, etc.
– Domestic/International– Developed/Emerging markets
Risk management• Understand which strategies will contribute most to total portfolio
risk
I02-5

Building an Investment Program
Three Essential Steps1. Define investor’s
– Goals and objectives– Liquidity needs and investment horizon – Risk tolerance
2. Set asset allocation 3. Set manager structure
I02-6

Building an Investment Program
Define Investor’sa) Goals and objectives
– To be fully funded • What is investor’s current funded status—Green/Yellow/Red?
– Meet/exceed plan’s actuarial interest rate assumption– Achieving the above with acceptable risk (volatility)– Other?
I02-7

Building an Investment Program
Define Investor’sb) Liquidity needs and investment horizon
– Does the plan have net positive or negative cash flow? • If negative, to what extent?
– Will liquidity needs be changing over time?• Industry outlook (growing or shrinking?)• Ratio of active vs. inactive participants• Labor/management negotiations
Liquidity/cash flow needs impact a plan’s time horizonLonger time horizon allows for inclusion of riskier/less liquid
asset classes with higher return potentialTime helps smooth returns
I02-8

Employer Contributions – Benefit PaymentsTotal Benefit Plan Assets
= Positive or Negative Cash Flow as a Percentage
$7,000,000 – $10,000,000$100,000,000
= 3% Net NegativeCash Flow
$2,000,000 – $12,000,000$100,000,000
10% Net NegativeCash Flow
VS.
NET CASH FLOW
Benefit Plan #1:
Benefit Plan #2: =
Building an Investment Program
I02-9

Building an Investment Program
Define Investor’sc) Risk Tolerance
– Risk/Reward trade off—willingness to take on greater risk in hope of greater return
– Most common risk discussed: Variability of Return • Measured by Standard Deviation
I02-10

‐4 ‐3 ‐2 ‐1 0 1 2 3 4
Risk: Variability of return around it’s average.
7.0% +24.0%-10.0%
-27.0% +41.0%
-2σ -1σ +1σ +2σµ-3σ +3σ
Two Standard Deviations - 95.5%
Three Standard Deviations - 99.7%
One Standard Deviation—68.3%
-44.0% 58.0%
Average/Mean
Two Standard Deviations - 95.5%
Three Standard Deviations - 99.7%
One Standard Deviation—68.3%
“Risk” = “Variability” = “Standard Deviation”
Large Cap Equity Average Expected Return of 7.0% with a “RISK” of 17.0%
I02-11
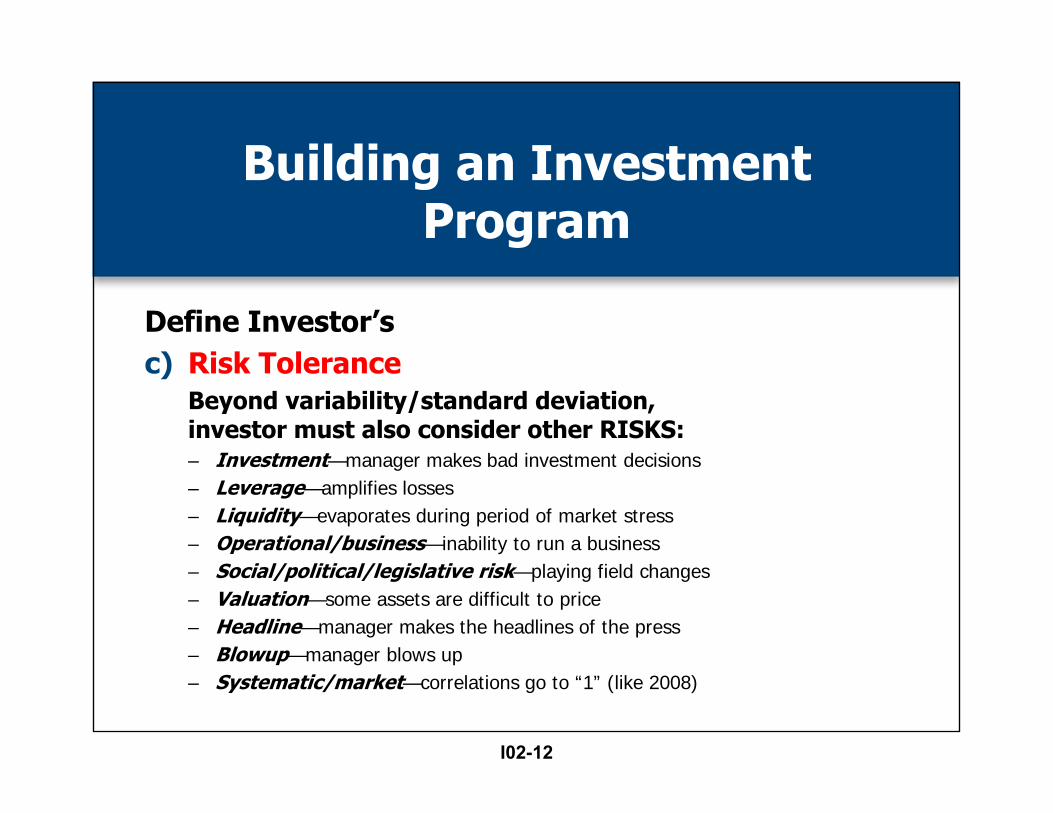
Building an Investment Program
Define Investor’sc) Risk Tolerance
Beyond variability/standard deviation, investor must also consider other RISKS:– Investment—manager makes bad investment decisions– Leverage—amplifies losses– Liquidity—evaporates during period of market stress– Operational/business—inability to run a business– Social/political/legislative risk—playing field changes– Valuation—some assets are difficult to price– Headline—manager makes the headlines of the press– Blowup—manager blows up– Systematic/market—correlations go to “1” (like 2008)
I02-12

Building an Investment Program
1. Define investor’s– Goals and objectives– Liquidity needs and investment horizon – Risk tolerance
2. Set asset allocation 3. Set manager structure
I02-13
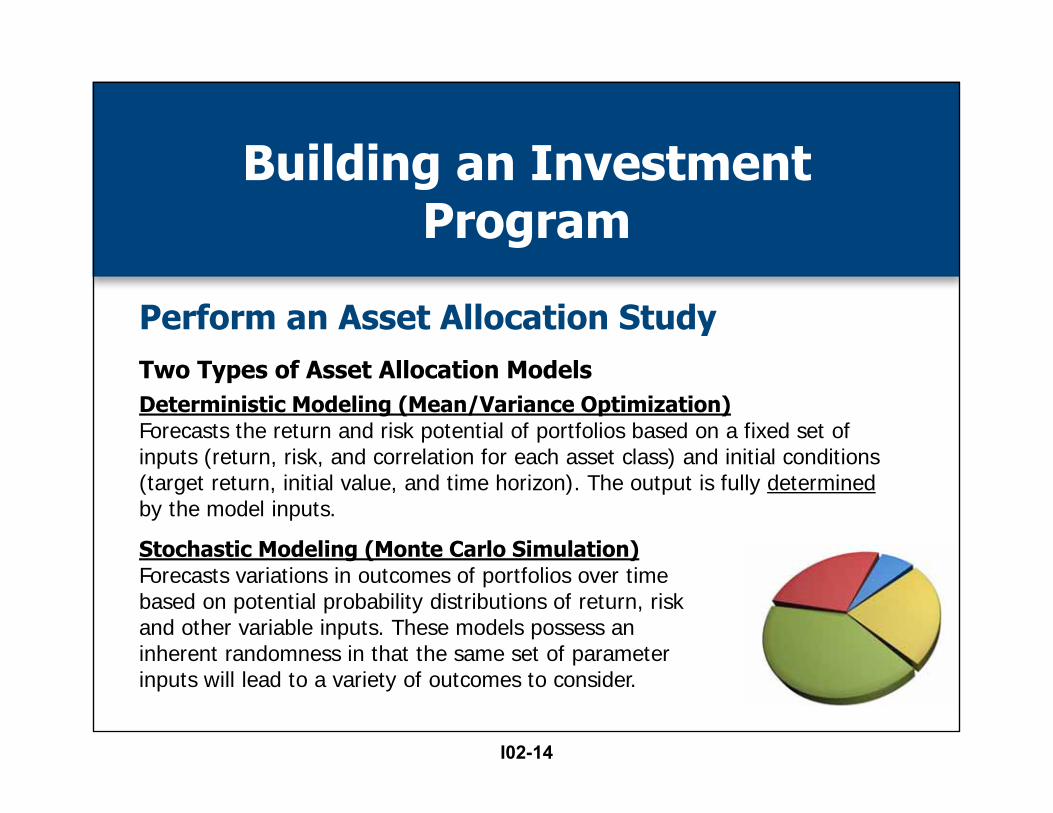
Two Types of Asset Allocation ModelsDeterministic Modeling (Mean/Variance Optimization)Forecasts the return and risk potential of portfolios based on a fixed set of inputs (return, risk, and correlation for each asset class) and initial conditions (target return, initial value, and time horizon). The output is fully determinedby the model inputs.
Stochastic Modeling (Monte Carlo Simulation)Forecasts variations in outcomes of portfolios over time based on potential probability distributions of return, risk and other variable inputs. These models possess an inherent randomness in that the same set of parameter inputs will lead to a variety of outcomes to consider.
Building an Investment Program
Perform an Asset Allocation Study
I02-14

Must make assumptions for each asset class:1. Returns How will asset classes perform
2. Risk (Standard Deviation) Variability of return around its average
3. Correlation How asset classes move relative to each other
Goal: Generate highest rate of returnwith acceptable level of risk
Building an Investment Program
Perform an Asset Allocation Study
I02-15
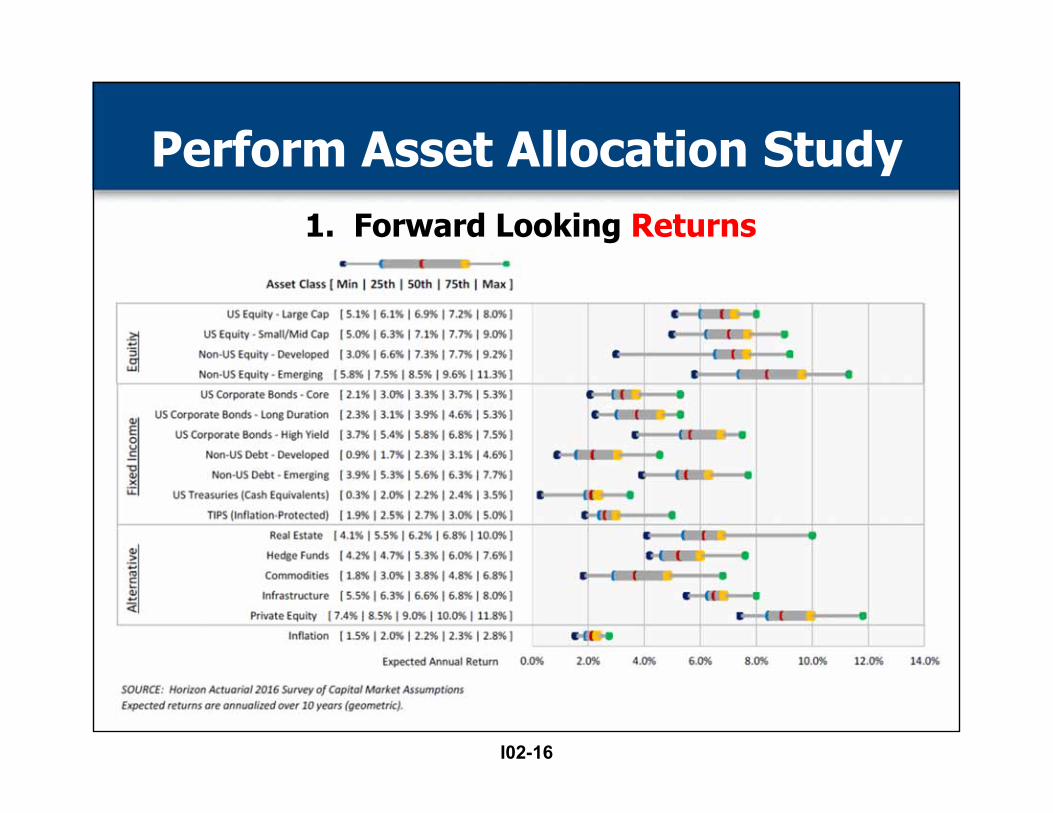
1. Forward Looking Returns
Perform Asset Allocation Study
I02-16

2. Forward Looking Returns and Risk
Perform Asset Allocation Study
I02-17

They are a forecast into the future
They are an estimate
They vary from one firm to the next
They will be wrong
But, they provide a framework to make educated decisions
2. Forward Looking Returns and Risk
Perform Asset Allocation Study
I02-18

Perform Asset Allocation Study
3. CorrelationsHow asset classes move relative to each other:
Statistical measure between +1 and -1
+1 = assets classes perfectly correlated.
• Both go up and down at the same time.
-1 = asset classes inversely correlated
• One goes up, the other goes down and vice versa.
0 = no distinguishable pattern, more random
I02-19
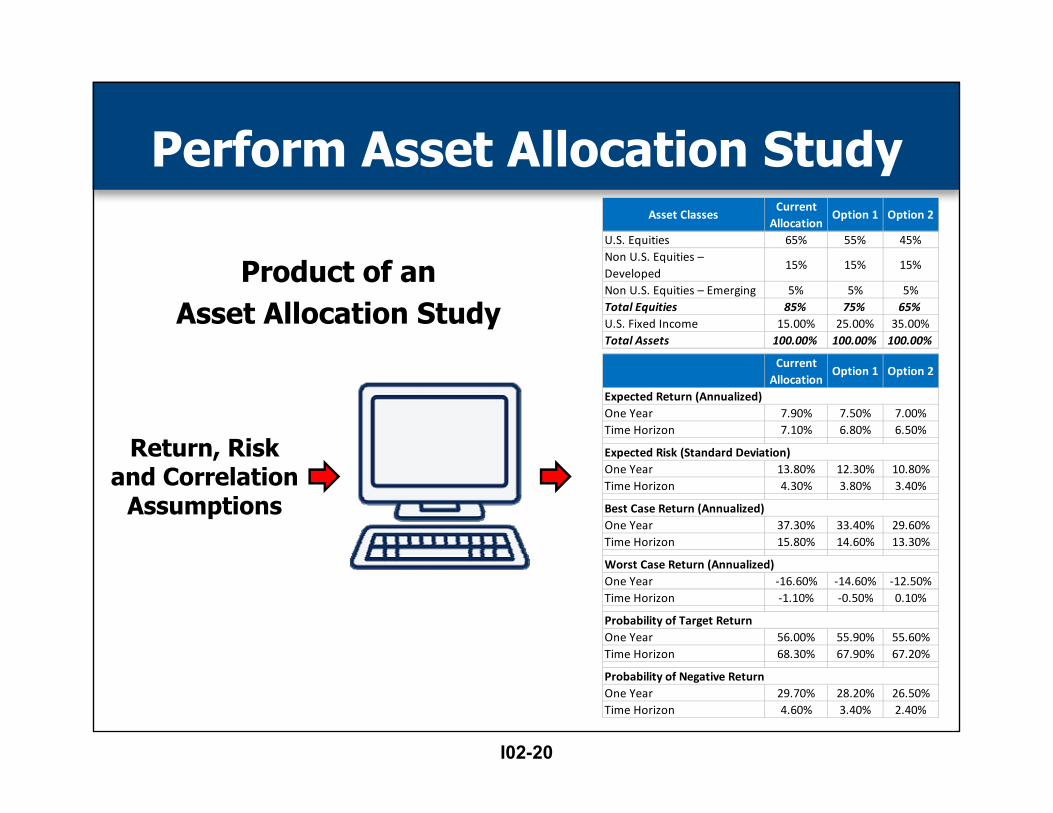
Asset ClassesCurrent Allocation
Option 1 Option 2
U.S. Equities 65% 55% 45%Non U.S. Equities – Developed
15% 15% 15%
Non U.S. Equities – Emerging 5% 5% 5%Total Equities 85% 75% 65%U.S. Fixed Income 15.00% 25.00% 35.00%Total Assets 100.00% 100.00% 100.00%
Current Allocation
Option 1 Option 2
One Year 7.90% 7.50% 7.00%Time Horizon 7.10% 6.80% 6.50%
One Year 13.80% 12.30% 10.80%Time Horizon 4.30% 3.80% 3.40%
One Year 37.30% 33.40% 29.60%Time Horizon 15.80% 14.60% 13.30%
One Year ‐16.60% ‐14.60% ‐12.50%Time Horizon ‐1.10% ‐0.50% 0.10%
One Year 56.00% 55.90% 55.60%Time Horizon 68.30% 67.90% 67.20%
One Year 29.70% 28.20% 26.50%Time Horizon 4.60% 3.40% 2.40%
Probability of Negative Return
Expected Return (Annualized)
Expected Risk (Standard Deviation)
Best Case Return (Annualized)
Worst Case Return (Annualized)
Probability of Target Return
Product of an Asset Allocation Study
Return, Risk and Correlation
Assumptions
Perform Asset Allocation Study
I02-20

Perform Asset Allocation Study
Asset Allocation Studies• Is there an optimal model?• Part science, part art.• Output only as good as the inputs.• Inputs vary from one advisor to the next and will be
wrong.• Still a good tool to help understand inter-relationship
of asset classes and that provides a framework to make educated decisions.
I02-21

Building an Investment Program
1. Define investor’s– Goals and objectives– Liquidity needs and investment horizon – Risk tolerance
2. Set asset allocation 3. Set manager structure
I02-22
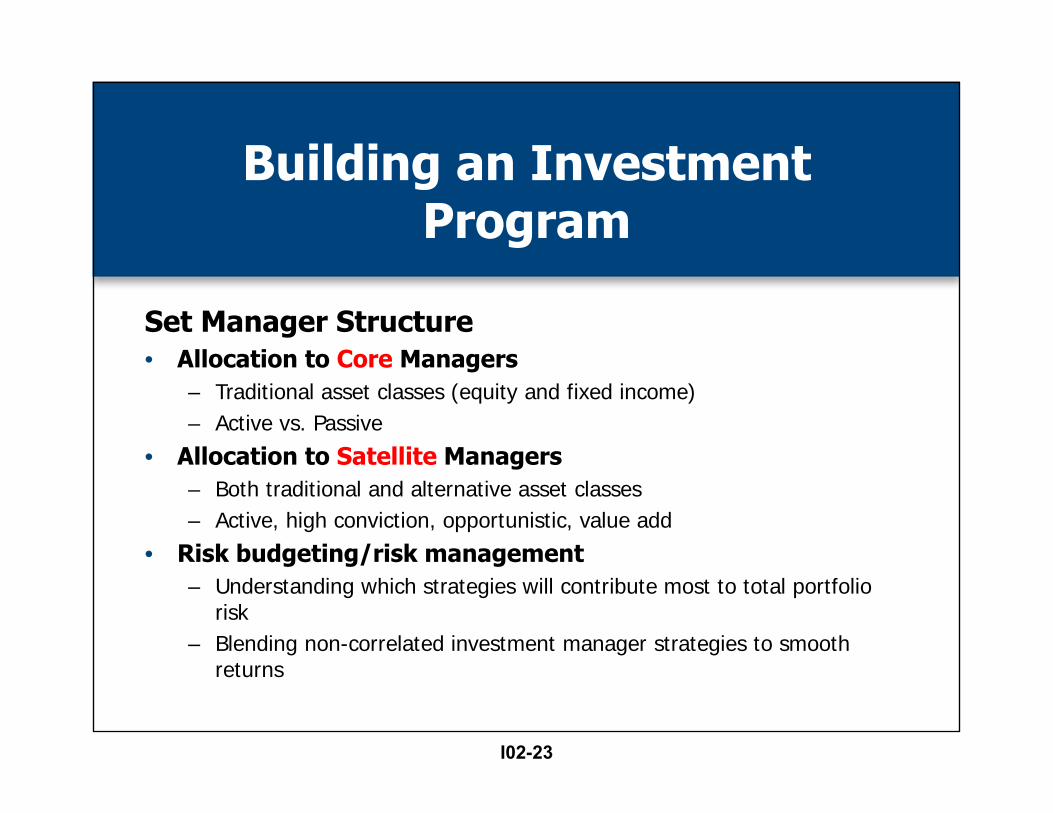
Building an Investment Program
Set Manager Structure• Allocation to Core Managers
– Traditional asset classes (equity and fixed income)– Active vs. Passive
• Allocation to Satellite Managers– Both traditional and alternative asset classes– Active, high conviction, opportunistic, value add
• Risk budgeting/risk management– Understanding which strategies will contribute most to total portfolio
risk– Blending non-correlated investment manager strategies to smooth
returns
I02-23

Selecting an Optimal Mix
Looking BackwardsOver the past 30 + years what has been the
optimal asset allocation mix?
Options to consider:• Domestic equity • Domestic fixed income• Domestic equity and fixed income• Domestic + international equity and fixed income• Domestic + international equity, fixed income and real estate• Domestic + international equity, fixed income, real estate and
hedge funds
I02-24

Asset Allocation Mixes
Looking Backwards
Mix 1 Mix 2 Mix 3 Mix 4 Mix 5 Mix 6
U.S. Equities (S&P 500) 100.0% 60.0% 50.0% 45.0% 45.0%
U.S. Fixed Income (Barclays Aggregate) 100.0% 40.0% 40.0% 35.0% 25.0%
International Equity (MSCI ACW ex US) 10.0% 10.0% 10.0%
Real Estate Equity (NCREIF ODCE) 10.0% 10.0%
Hedge Fund of Funds (HFRI) 10.0%
Since 1/1/78 Since 1/1/78 Since 1/1/78 Since 1/1/78
Mix 4 with Real Estate
allocation made on January 1, 2000
Mix 5 with Hedge Fund
allocation made on January 1, 2006.
Selecting an Optimal Mix
I02-25

Looking Backwards—Returns
1 year 2 years 3 years 4 years 5 years 10 years 15 years 20 years 25 years 30 years 35 years Since Inception*
Mix 1: US Equity 3.99% 5.69% 11.66% 13.83% 12.10% 7.42% 5.75% 7.87% 9.40% 9.82% 11.13% 11.31%
Mix 2: Domestic fixed income 6.00% 3.91% 4.06% 2.85% 3.76% 5.13% 5.08% 5.67% 6.19% 6.62% 8.25% 7.71%
Mix 3: US Equity and Fixed income 4.79% 5.00% 8.86% 9.63% 8.97% 7.05% 6.02% 7.50% 8.54% 8.91% 10.32% 10.20%
Mix 4: US + International Equity and Fixed Income 3.32% 3.63% 7.69% 8.51% 7.63% 6.59% 6.06% 7.28% 8.27% 8.70% 10.21% 10.13%
Mix 5: US + International Equity, Fixed Income and Real Estate Equity
4.07% 4.48% 8.20% 8.96% 8.11% 6.62% 6.33% 7.42% 8.31% 8.71% 10.21% 10.08%
Mix 6: US + International Equity, Fixed Income, Real Estate Equity and Hedge Funds
2.90% 4.03% 8.07% 9.12% 8.02% 6.19% 6.07% 7.09% 8.04% 8.49% 10.02% 9.91%
*January 1978
Annualized Returns
January 1978 - June 2016
Selecting an Optimal Mix
I02-26

Looking Backwards—Risk Statistics
Return (%)
Standard Deviation
(%)
Sharpe Ratio
Beta vs. Market
Maximum Drawdown
# of Up Quarters
# of Down
Quarters
Average Up
Return (%)
Average Down
Return (%)
Best Quarter
(%)
Worst Quarter
(%)
Best 1-Year (%)
Worst 1-Year (%)
Mix 1: US Equity 11.31% 15.79 0.4215 1 -45.80% 111 43 6.8 -6.55 21.35 -22.53 61.18 -38.09
Mix 2: Domestic fixed income 7.71% 6.42 0.4318 0.0533 -12.63% 119 35 2.93 -1.56 18.79 -8.71 35.22 -9.21
Mix 3: US Equity and Fixed income 10.20% 10.13 0.5371 0.6205 -26.00% 114 40 4.86 -3.81 15.55 -13.38 48.17 -21.58
Mix 4: US + International Equity and Fixed Income 10.13% 10.09 0.5301 0.6121 -26.61% 115 39 4.75 -3.81 16.34 -12.03 45.29 -22.44
Mix 5: US + International Equity, Fixed Income and Real Estate Equity
10.08% 9.54 0.5545 0.5718 -26.50% 118 36 4.49 -3.76 16.6 -10.96 43.76 -22.96
Mix 6: US + International Equity, Fixed Income, Real Estate Equity and Hedge Funds
9.91% 9.74 0.5249 0.586 -28.92% 118 36 4.51 -3.98 16.6 -11.96 43.76 -24.93
*Since January 1978
Annualized Risk Statistics
January 1978 - June 2016
Selecting an Optimal Mix
I02-27

Looking Backwards—Asset Class Returns
1 year 2 years 3 years 4 years 5 years 10 years 15 years 20 years 25 years 30 years 35 yearsSince
Inception Return
Since Inception
Risk
Inception Date
Large Cap US Equity: S&P 500 Index 3.99% 5.69% 11.66% 13.83% 12.10% 7.42% 5.75% 7.87% 9.40% 9.82% 11.13% 10.01% 22.13% 01/01/1926
Investment Grade US Bonds: Barclays U.S. Aggregate 6.00% 3.91% 4.06% 2.85% 3.76% 5.13% 5.08% 5.67% 6.19% 6.62% 8.25% 7.72% 6.31% 01/01/1976
Developed/EM International Equity: MSCI AC World ex USA -9.80% -7.36% 1.62% 4.61% 0.56% 2.33% 5.41% 4.73% 5.84% N/A N/A 5.59% 18.61% 01/01/1988
Real Estate Equity: NCREIF Fund Index-ODCE 12.19% 13.35% 13.00% 12.71% 12.67% 5.90% 7.66% 8.95% 7.79% 6.90% 7.61% 8.32% 5.23% 01/01/1978
Hedge Funds: HFRI Fund of Funds Composite Index -5.40% -0.83% 1.92% 3.23% 1.63% 1.58% 3.13% 4.66% 6.17% N/A N/A 6.66% 7.01% 01/01/1990
Annualized Returns as of June 2016
Selecting an Optimal Mix
I02-28

Selecting an Optimal Mix
Flaws of the analysis• All passive management• Dates on which allocation changes were made are
arbitrary• Target allocations could have been different• Additional asset classes could have been used
Key ConsiderationMust take into consideration the
impact of cash flows
I02-29

Selecting an Optimal MixLooking Forward
Where will returns come from?
I02-30

‐45
‐35
‐25
‐15
‐5
5
15
25
35
45
55
1926 1930s 1940s 1950s 1960s 1970s 1980s 1990s 2000s 2010s
Return
S&P 500 IndexCalendar Year Returns 1926-2015
S&P 500 Index Annualized Total Return
1/1/1926-9/30/2016
10.03%
1/1/2000-9/30/2016
4.34%
Source: Investment Metrics
24 Negative Years
65 Positive Years
Historic Return Perspective: Equities
I02-31

Where Will Returns Come From—Equities?
• Domestic equity returns for the last 90+ years have been solid• Last 16 years have been challenging (S&P 500 @ 4.34%) • Consensus is that equity returns for the next 10+ years will
continue to be below their historic average
SOURCE: Horizon Actuarial 2016 Survey of Capital Market Assumptions
Average Expected Return
Average Expected Risk
US Equity - Large Cap 6.6% 16.9%US Equity - Small/Mid Cap 7.0% 21.0%Non-US Equity - Developed 7.1% 19.5%Non-US Equity - Emerging 8.5% 26.3%
Forward Looking Equity Returns
Equi
ties
I02-32
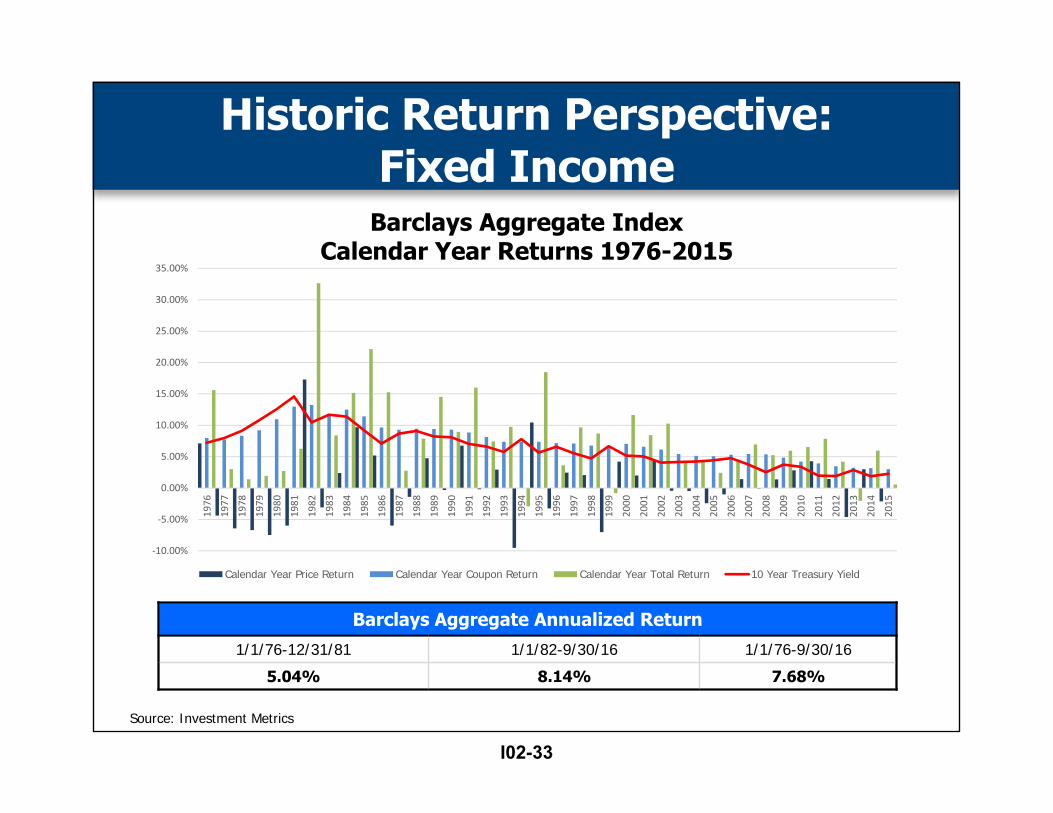
Barclays Aggregate Annualized Return
1/1/76-12/31/81 1/1/82-9/30/16 1/1/76-9/30/16
5.04% 8.14% 7.68%
Source: Investment Metrics
‐10.00%
‐5.00%
0.00%
5.00%
10.00%
15.00%
20.00%
25.00%
30.00%
35.00%
1976
1977
1978
1979
1980
1981
1982
1983
1984
1985
1986
1987
1988
1989
1990
1991
1992
1993
1994
1995
1996
1997
1998
1999
2000
2001
2002
2003
2004
2005
2006
2007
2008
2009
2010
2011
2012
2013
2014
2015
Calendar Year Price Return Calendar Year Coupon Return Calendar Year Total Return 10 Year Treasury Yield
Barclays Aggregate IndexCalendar Year Returns 1976-2015
Historic Return Perspective: Fixed Income
I02-33

*As of 9/30/16
0
2
4
6
8
10
12
14
16
1976
1977
1978
1979
1980
1981
1982
1983
1984
1985
1986
1987
1988
1989
1990
1991
1992
1993
1994
1995
1996
1997
1998
1999
2000
2001
2002
2003
2004
2005
2006
2007
2008
2009
2010
2011
2012
2013
2014
2015
Yield
US 10 YR Mid‐Yield Barclays Agg YTW Barclays US Credit YTW Barclays US Mortgage YTW
Since 1976 Barclays Aggregate has
produced an average annual return of 7.68%*
Benchmark Yields: 1976-2016
Barclays Aggregate (09/30/16)
Yield to Maturity: 1.97%Average Maturity: 7.82 Years
Historic Return Perspective: Fixed Income
I02-34

Where Will Returns Come From—Fixed Income?
• Domestic fixed income returns for the last 40+ years have been fantastic• Returns for the next 10+ years will not be as robust due to the current low
interest rate environment
Average Expected Return
Average Expected Risk
US Corporate Bonds - Core 3.4% 6.0%US Corporate Bonds - Long Duration 3.8% 10.5%US Corporate Bonds - High Yield 5.9% 11.0%Non-US Debt - Developed 2.4% 7.6%Non-US Debt - Emerging 5.8% 11.6%US Treasuries (Cash Equivalents) 2.1% 2.8%TIPS (Inflation-Protected) 2.8% 6.5%
Forward Looking Fixed Income Returns
Fixe
d In
com
e
SOURCE: Horizon Actuarial 2016 Survey of Capital Market Assumptions
I02-35

-55.0-35.0-15.0
5.025.045.065.085.0
1988 1989 1990 1991 1992 1993 1994 1995 1996 1997 1998 1999 2000 2001 2002 2003 2004 2005 2006 2007 2008 2009 2010 2011 2012 2013 2014 2015
Ret
urn
(%)
Calendar YearsMSCI Emerging Markets Index
As of 12/13/2015 1Year
3Years
5Years
7Years
10Years
15Years
20Years
25Years
Since Inception
Return
Since Inception
Risk
InceptionDate
MSCI EM -14.6% -6.4% -4.5% 7.9% 3.9% 8.9% 5.5% 8.6% 10.5% 23.2% 1/1/1988
Selling Features
• Will grow faster than developed markets• Favorable demographics• Increasing domestic consumption
• Relatively low debt levels/healthier balance sheets• Higher savings rates • Room for productivity gains
-20.00
-10.00
0.00
10.00
20.00
30.00
40.00
50.00
Dec
-92
Jun-
93
Dec
-93
Jun-
94
Dec
-94
Jun-
95
Dec
-95
Jun-
96
Dec
-96
Jun-
97
Dec
-97
Jun-
98
Dec
-98
Jun-
99
Dec
-99
Jun-
00
Dec
-00
Jun-
01
Dec
-01
Jun-
02
Dec
-02
Jun-
03
Dec
-03
Jun-
04
Dec
-04
Jun-
05
Dec
-05
Jun-
06
Dec
-06
Jun-
07
Dec
-07
Jun-
08
Dec
-08
Jun-
09
Dec
-09
Jun-
10
Dec
-10
Jun-
11
Dec
-11
Jun-
12
Dec
-12
Jun-
13
Dec
-13
Jun-
14
Dec
-14
Jun-
15
Dec
-15
Ret
urns
(%)
5 Year Performance Rolling QuarterlySince Inception (January 1988-December 2015)
MSCI Emerging Markets S&P 500 Blmbg. Barc. U.S. AggregateSource: Investment Metrics
Historic Return Perspective: Emerging Market Equity
I02-36

-10.00-5.000.005.00
10.0015.0020.0025.0030.0035.00
Dec
-82
Jun-
83D
ec-8
3Ju
n-84
Dec
-84
Jun-
85D
ec-8
5Ju
n-86
Dec
-86
Jun-
87D
ec-8
7Ju
n-88
Dec
-88
Jun-
89D
ec-8
9Ju
n-90
Dec
-90
Jun-
91D
ec-9
1Ju
n-92
Dec
-92
Jun-
93D
ec-9
3Ju
n-94
Dec
-94
Jun-
95D
ec-9
5Ju
n-96
Dec
-96
Jun-
97D
ec-9
7Ju
n-98
Dec
-98
Jun-
99D
ec-9
9Ju
n-00
Dec
-00
Jun-
01D
ec-0
1Ju
n-02
Dec
-02
Jun-
03D
ec-0
3Ju
n-04
Dec
-04
Jun-
05D
ec-0
5Ju
n-06
Dec
-06
Jun-
07D
ec-0
7Ju
n-08
Dec
-08
Jun-
09D
ec-0
9Ju
n-10
Dec
-10
Jun-
11D
ec-1
1Ju
n-12
Dec
-12
Jun-
13D
ec-1
3Ju
n-14
Dec
-14
Jun-
15D
ec-1
5
Ret
urns
(%)
5 Year Performance Rolling QuarterlySince Inception (March 1978-December 2015)
NCREIF ODCE S&P 500 Blmbg. Barc. U.S. Aggregate
As of 12/13/2015 1Year
3Years
5Years
7Years
10Years
15Years
20Years
25Years
Since Inception
Return
Since Inception
Risk
InceptionDate
NCREIF ODCE 15.2% 13.6% 13.5% 6.2% 6.3% 7.7% 9.0% 7.5% 8.3% 5.3% 1/1/1978
-40.0
-20.0
0.0
20.0
40.0
Ret
urn
(%)
Calendar YearsNCREIF ODCE Index
NCREIF Fund Index-ODCE Value Weighted Income Index (Net) NCREIF Fund Index-ODCE Appreciation Idx (VW) (Net)Appreciation Return
NCREIF Fund Index-Open End Diversified Core (EW)
Selling Features
• High level of current income (5 to 6%)• 7 to 9% total return objective (core)
• Not closely correlated with equity/fixed income markets• Good inflation hedge (rents rise with inflation)
Source: Investment Metrics
Historic Return Perspective: Real Estate Equity
I02-37

As of 12/13/2015 1Year
3Years
5Years
7Years
10Years
15Years
20Years
Since Inception
Return
Since Inception
Risk
InceptionDate
HFRI Fund of Funds -0.3% 4.0% 2.1% 3.9% 2.3% 3.5% 5.2% 6.9% 5.6% 1/1/1990
-25.0
-15.0
-5.0
5.0
15.0
25.0
1990 1991 1992 1993 1994 1995 1996 1997 1998 1999 2000 2001 2002 2003 2004 2005 2006 2007 2008 2009 2010 2011 2012 2013 2014 2015
Ret
urn
(%)
Calendar YearsHFRI FOF Index
Selling Features
• Absolute return objective—6 to 8% net returns• Libor plus 3 to 5%• Equity like returns with bond like volatility
• Not closely correlated with equity/fixed income markets• Protect on the downside
-10.00-5.000.005.00
10.0015.0020.0025.0030.0035.00
Ret
urns
(%)
5 Year Performance Rolling QuarterlySince Inception (January 1990-December 2015)
HFRI Fund of Funds S&P 500 Blmbg. Barc. U.S. AggregateSource: Investment Metrics
Historic Return Perspective: Hedge Fund of Funds
I02-38

As of 12/13/2015 1Year
3Years
5Years
7Years
10Years
15Years
20Years
Since Inception
Return
Since Inception
Risk
InceptionDate
DJ – UBS Commodity -24.7% -17.3% -13.5% -5.5% -6.4% -1.0% 1.0% 2.1% 14.9% 2/1/1991
-40.0-30.0-20.0-10.0
0.010.020.030.0
Stub1991
1992 1993 1994 1995 1996 1997 1998 1999 2000 2001 2002 2003 2004 2005 2006 2007 2008 2009 2010 2011 2012 2013 2014 2015
Ret
urn
(%)
Calendar YearsDJ–UBS Commodity Index
Selling Features
• Emerging market growth and demand• Inflation hedge (material prices rise w/ inflation) • Protection during periods of crisis (gold/silver)
• Not closely correlated with equity/fixed income markets• Protect on the downside
-20.00-15.00-10.00-5.000.005.00
10.0015.0020.0025.0030.0035.00
Ret
urns
(%)
5 Year Performance Rolling QuarterlySince Inception (February 1991-December 2015)
Bloomberg Commodity Index Total Return S&P 500 Blmbg. Barc. U.S. AggregateSource: Investment Metrics
Historic Return Perspective: Commodities
I02-39
-30.0-20.0-10.0
0.010.020.030.0
2000 2001 2002 2003 2004 2005 2006 2007 2008 2009 2010 2011 2012 2013 2014 2015
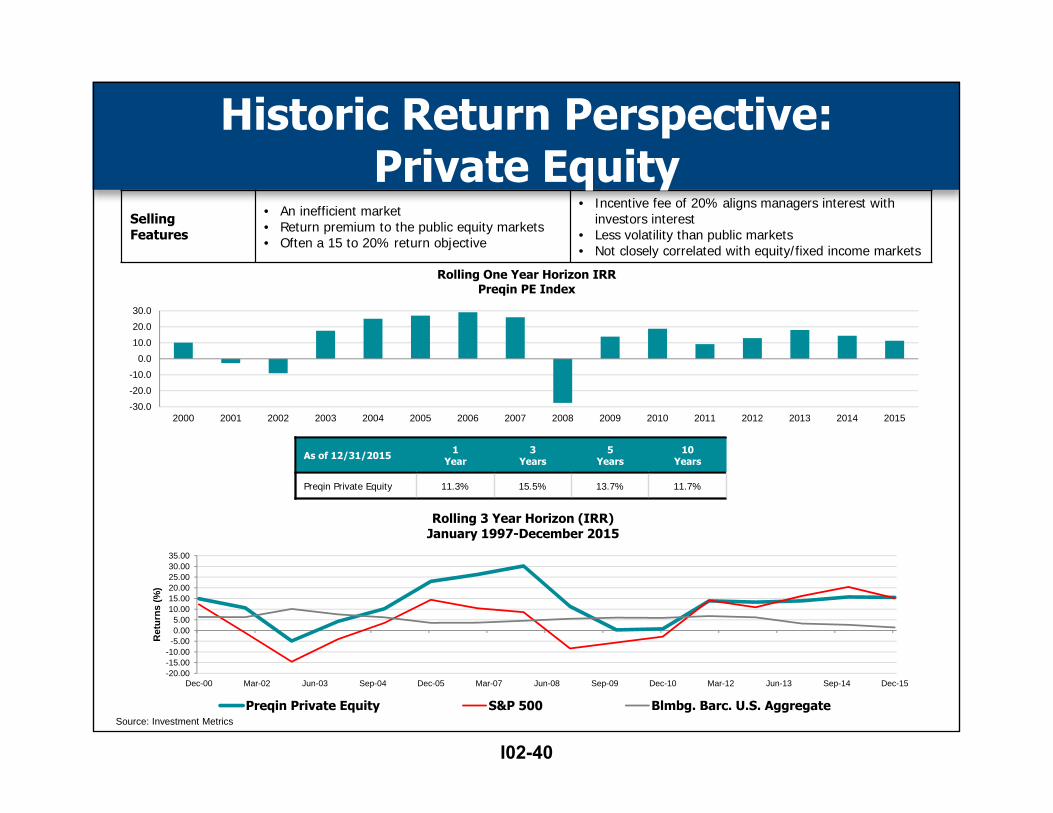
Rolling One Year Horizon IRRPreqin PE Index
As of 12/31/2015 1Year
3Years
5Years
10Years
Preqin Private Equity 11.3% 15.5% 13.7% 11.7%
Selling Features
• An inefficient market• Return premium to the public equity markets• Often a 15 to 20% return objective
• Incentive fee of 20% aligns managers interest with investors interest
• Less volatility than public markets• Not closely correlated with equity/fixed income markets
-20.00-15.00-10.00-5.000.005.00
10.0015.0020.0025.0030.0035.00
Dec-00 Mar-02 Jun-03 Sep-04 Dec-05 Mar-07 Jun-08 Sep-09 Dec-10 Mar-12 Jun-13 Sep-14 Dec-15
Ret
urns
(%)
Rolling 3 Year Horizon (IRR)January 1997-December 2015
Preqin Private Equity S&P 500 Blmbg. Barc. U.S. AggregateSource: Investment Metrics
Historic Return Perspective: Private Equity
I02-40

Where Will Returns Come From—Alternatives?
Selective use of alternatives will likely continue as a point of diversification away from equity and fixed income
Average Expected Return
Average Expected Risk
Real Estate 6.4% 14.7%Hedge Funds 5.4% 8.4%Commodities 4.0% 18.5%Infrastructure 6.6% 13.8%Private Equity 9.2% 23.1%A
lter
nati
ves
Forward Looking Alternative Returns*
*SOURCE: Horizon Actuarial 2016 Survey of Capital Market Assumptions
Alternative investments provide diversification potential but are more complex and have different risk and liquidity profiles
I02-41

Mix 1 Mix 2 Mix 3 Mix 4 Mix 5 Mix 6
U.S. Equities 100.0% 60.0% 50.0% 45.0% 45.0%
U.S. and Intl Fixed Income 100.0% 40.0% 40.0% 35.0% 25.0%
Developed and Emerging Market Equity
10.0% 10.0% 10.0%
Real Estate Equity 10.0% 10.0%
Hedge Fund of Funds 10.0%
Forward Looking Return Potential 6.60% 3.70% 5.44% 5.50% 5.63% 5.80%
What if the AVERAGE Capital Market Return Assumptions
Are Accurate?
I02-42

Asset Allocation Observations
• Benefit plans have needed and will continue to need equity market returns to achieve their actuarial interest rate assumption.
• Fixed income returns have been fantastic since 1981, but will be challenged in years to come.
• Many points of diversification over the past 16 years have not added value over a 60% equity/40% fixed income portfolio
• Diversification success driven by:– Timing of new allocations.– Performance of managers selected—range of returns in alternative
asset classes is wide.– Degree of diversification—be careful not to diversify too much.
• Must consider risks beyond returns and standard deviation.
I02-43

Optimism
Excitement
ThrillEuphoria
AnxietyDenial
FearDesperation
PanicCapitulation
Despondency
Depression
HopeRelief
Optimism
Point of Maximum Financial Risk:When the average investor buys.
Point of Maximum Financial Opportunity:When the average investor sells
Source: InvestmentCenter.com
Buy High
Sell Low
Timing: Human Emotion—Cycle of Investor Emotions
I02-44
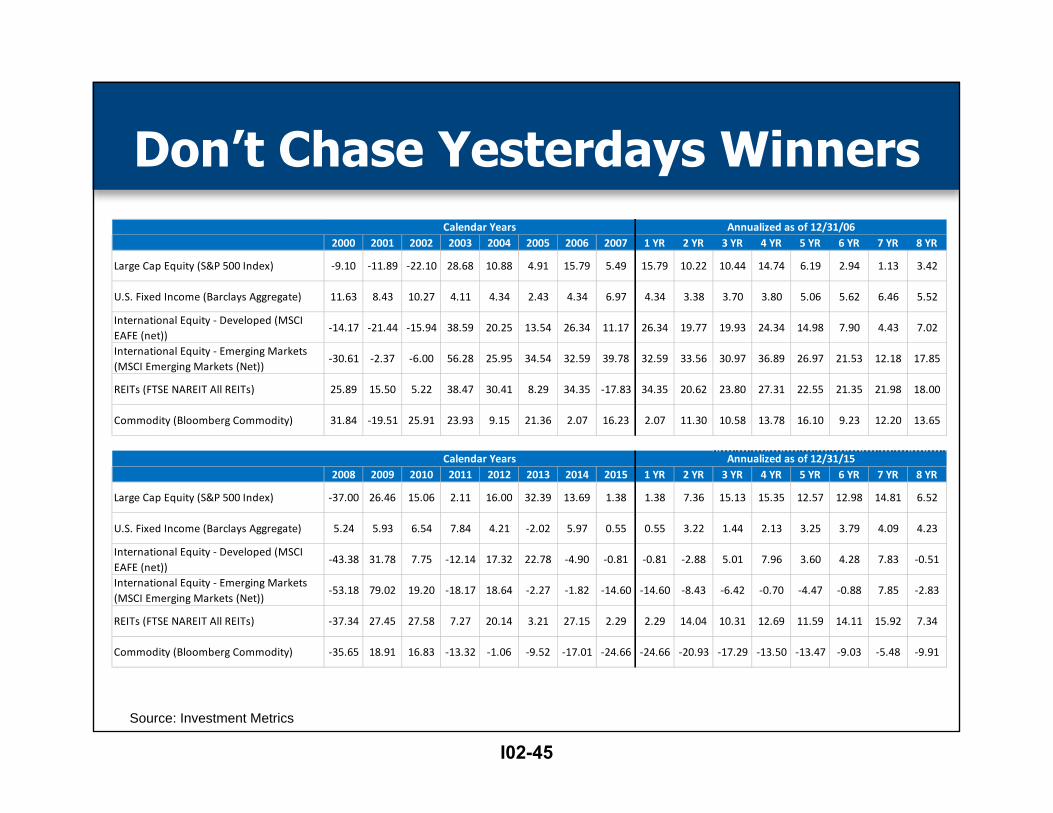
Source: Investment Metrics
2000 2001 2002 2003 2004 2005 2006 2007 1 YR 2 YR 3 YR 4 YR 5 YR 6 YR 7 YR 8 YR
Large Cap Equity (S&P 500 Index) ‐9.10 ‐11.89 ‐22.10 28.68 10.88 4.91 15.79 5.49 15.79 10.22 10.44 14.74 6.19 2.94 1.13 3.42
U.S. Fixed Income (Barclays Aggregate) 11.63 8.43 10.27 4.11 4.34 2.43 4.34 6.97 4.34 3.38 3.70 3.80 5.06 5.62 6.46 5.52
International Equity ‐ Developed (MSCI EAFE (net))
‐14.17 ‐21.44 ‐15.94 38.59 20.25 13.54 26.34 11.17 26.34 19.77 19.93 24.34 14.98 7.90 4.43 7.02
International Equity ‐ Emerging Markets (MSCI Emerging Markets (Net))
‐30.61 ‐2.37 ‐6.00 56.28 25.95 34.54 32.59 39.78 32.59 33.56 30.97 36.89 26.97 21.53 12.18 17.85
REITs (FTSE NAREIT All REITs) 25.89 15.50 5.22 38.47 30.41 8.29 34.35 ‐17.83 34.35 20.62 23.80 27.31 22.55 21.35 21.98 18.00
Commodity (Bloomberg Commodity) 31.84 ‐19.51 25.91 23.93 9.15 21.36 2.07 16.23 2.07 11.30 10.58 13.78 16.10 9.23 12.20 13.65
2008 2009 2010 2011 2012 2013 2014 2015 1 YR 2 YR 3 YR 4 YR 5 YR 6 YR 7 YR 8 YR
Large Cap Equity (S&P 500 Index) ‐37.00 26.46 15.06 2.11 16.00 32.39 13.69 1.38 1.38 7.36 15.13 15.35 12.57 12.98 14.81 6.52
U.S. Fixed Income (Barclays Aggregate) 5.24 5.93 6.54 7.84 4.21 ‐2.02 5.97 0.55 0.55 3.22 1.44 2.13 3.25 3.79 4.09 4.23
International Equity ‐ Developed (MSCI EAFE (net))
‐43.38 31.78 7.75 ‐12.14 17.32 22.78 ‐4.90 ‐0.81 ‐0.81 ‐2.88 5.01 7.96 3.60 4.28 7.83 ‐0.51
International Equity ‐ Emerging Markets (MSCI Emerging Markets (Net))
‐53.18 79.02 19.20 ‐18.17 18.64 ‐2.27 ‐1.82 ‐14.60 ‐14.60 ‐8.43 ‐6.42 ‐0.70 ‐4.47 ‐0.88 7.85 ‐2.83
REITs (FTSE NAREIT All REITs) ‐37.34 27.45 27.58 7.27 20.14 3.21 27.15 2.29 2.29 14.04 10.31 12.69 11.59 14.11 15.92 7.34
Commodity (Bloomberg Commodity) ‐35.65 18.91 16.83 ‐13.32 ‐1.06 ‐9.52 ‐17.01 ‐24.66 ‐24.66 ‐20.93 ‐17.29 ‐13.50 ‐13.47 ‐9.03 ‐5.48 ‐9.91
Annualized as of 12/31/15Calendar Years
Calendar Years Annualized as of 12/31/06
Don’t Chase Yesterdays Winners
I02-45

Session #I02
Asset Allocation in Health and Pension Plans—Your Key Decision
Live by Good Investment Principles:• Allocate sufficient time to focus on the
allocation decision.• Adopt a long-term view. Defined benefit
plan’s have long-term time horizons, but trustees tend to have short-term perspectives.
• Avoid the human emotion related to making investment decisions—don’t chase yesterdays winners.
• Have patience with your asset allocation decisions and active managers.
• Rebalance—trim your winners, add to your out of favor manager.
Website Resourceshttps://www.ifebp.org/inforequest/ifebp/0167444.pdf
62nd Annual Employee Benefits ConferenceNovember 13-16, 2016Orlando, Florida
I02-46
2017 Educational ProgramsInvestments
63rd Annual Employee Benefits Conference October 22-25, 2017 Las Vegas, Nevadawww.ifebp.org/usannual
Investments InstituteMarch 13-15, 2017 Phoenix, Arizonawww.ifebp.org/investments
Portfolio Concepts and ManagementMay 1-4, 2017 Philadelphia, Pennsylvaniawww.ifebp.org/wharton
Related ReadingVisit one of the on-site Bookstore locations or see www.ifebp.org/bookstore for more books.
The Tools & Techniques of Investment Planning, 3rd EditionItem #9029www.ifebp.org/books.asp?9029
816
I02-47