assessments of atmospheric interchanges of green house gas ... · assessments of atmospheric...
TRANSCRIPT
Assessments of Atmospheric Interchanges of Green House Gas Emissions from the Cultivated Land: Study Based on Edaphic Gradients of Plantations in Semi Arid Region of Gujarat, India
Dhruti Patel1, Chitresh Saraswat2, Pankaj Kumar1,2*, Nirmal Kumar JI1 1Institute of Science and Technology for Advance Studies and Research (ISTAR), Vallabh Vidyanagar, Gujarat
388120, India 2United Nations University, Institute for the Advanced Study of Sustainability (UNU-IAS), 5-53-70, Shibuya-Ku,
Tokyo, 150-8925, Japan * Email: [email protected]
Abstract. The study of the magnitude of temporal and spatial patterns of Greenhouse Gases (GHG) fluxes from the cultivated land of subtropical regions of India is still an uncharted territory. The paper contributes towards the improvement of actual estimate and investigates the seasonal variation of greenhouse gases (GHGs) emissions (N2O, CH4 and CO2). For the purpose three mono specific plantation viz. Manilkara zapota, Mangifera indica, Dendrocalumus stictus, and Mixed plantation are studied in semi arid region of central Gujarat, India to assess the extent of GHG fluxes in response to their soils and the comparative analysis presented to understand the atmospheric interchanges. The research contributes in building a framework for plantation approach for carbon sequestration by analyzing the patterns of GHGs emission under different ecosystem.
Keywords: GHG flux, carbon sequestration, carbon dioxide, climate change, soil temperature, Dendrocalumus stictus, Manilkara zapota; Mangifera indica, mixed plantation
1 Introduction
Global warming and global climate change have become significant terms during the past decade [1,2,3,4]. Greenhouse gases (GHG) such as CO2, N2O and CH4 are continuing to increase at an unprecedented rate in the atmosphere [5,6,7]. The Intergovernmental Panel on Climate Change (IPCC), leading international scientific body on climate change [8], that the GHG emission will peak by year 2015 and maintaining the average global temperatures between 2 and 2.4 degrees over pre industrial levels requires a global emission cuts between 50% and 85% by year 2050 [9]. During the period the global average atmospheric concentration of CO2 has been increasing at an alarming rate of 0.5% per year. The atmospheric interchanges of fluxes are an important contributing factor to global change due to increasing concentration of atmospheric greenhouse gas (GHGs) in many understood forms [10,11], results climate change may increase the intensity and frequency of weather related events and the impacts include indirect effects on health, water and food availability and overall human well being [12]. The Carbon dioxide (CO2), methane (CH4), and nitrous oxide (N2O) are three major greenhouse gases (GHG) and responsible for the global warming [13]. Few authors identified the forest soils as significant sinks for CH4 [14], CO2 and N2O [15, 16]. The global warming potential (GWP) ratio of Carbon dioxide (CO2), Methane (CH4) and Nitrous oxide (N2O) is analyzed as N2O > CH4 > CO2 [17]. The enhanced production and reduced consumption of naturally occurring greenhouse gases (GHGs) are responsible for approximately 90% of the global warming and climate change phenomenon [18] and soil processes are responsible for production and consumption of significant amount of atmospheric GHGs In 100 years of time period the unit masses of N2O and CH4 reached almost 21 times of the global warming potential [19]. Furthermore, N2O has even been identified as “the Dominant Ozone-Depleting Substance Emitted in the 21st Century”, which is responsible for the stratospheric ozone depletion [20]. There are other important gases present in atmosphere. They are water vapor and halocarbon compounds but their emissions are not associated with anthropogenic activities [21].
Environmental Pollution and Protection, Vol. 1, No. 2, December 2016 https://dx.doi.org/10.22606/epp.2016.12005 97
Copyright © 2016 Isaac Scientific Publishing EPP
The seasonal variation patterns of GHG's fluxes are important for better estimations of soil parameters. The studies showed that CO2, CH4, and N2O exchanges are more dependent on number of soil parameters such as soil temperature, soil moisture, bulk density, litter layer characteristics, and substrate supply and quality [22, 23, 24], which may affect gas diffusivity and soil aeration. The seasonal weather patterns are followed by the changes in soil GHG fluxes and it is calculated that in wet season the GHG emission rates are higher than dry season [25]. The CO2 efflux is dependent on the specific conditions of selected sites, such as forest type and type of soil [26]. In the study, [16] found that removal of surface litter reduced the soil respiration rates by eliminating CO2 efflux and slowing down the below ground biological activities of the soil. The soil are abundant source of N2O, which is around 60% and released through the microbial processes in the soil [27, 28]. Relatively small amounts of N2O is released in the atmosphere via microbial soil processes like denitrification, nitrification [29], which is dependent of Oxygen (O2), concentrations, temperature and moisture, texture, amount of nitrate (NO3
-) in the soil available for denitrification and amount of ammonium (NH4
+) available for nitrification [30]. The methane formed under anaerobic conditions by methanogens as increasing precipitation and population of methanogenic organisms in soil initiates the methanogenesis. The methanogenesis requires strict anaerobic conditions [31].
The differences in forest types, and human activities such as deforestation and reforestation showed the effects on the GHG fluxes [14, 16, 32, 33, 34, 35]. To a great extent the afforestation and reforestation can affect the GHG fluxes by altering the key physical and chemical properties of the soil nutrient [36, 37]. The tree species is an important determinant of GHG fluxes [32, 38, 39], as they are responsible for alteration of chemical, physical and biological processes of soil through crown and leaf structure, root system, foliage and litter quality around [39, 40, 41]. Due the reasons selection of tree species are closely related to the GHG benefit of afforestation.
The study analyzed the measurements of soil-atmosphere exchanges of N2O, CH4 and CO2 in four adjacent monospecific plantations in semi-arid part of central Gujarat. The research’s objectives are to investigate the seasonal variation of GHG fluxes from soils of Manilkara zapota, Mangifera indica, Dendorcalumus strictus, and the mixed plantation. The evaluation of the different plantation species conducted based on the edaphic properties such as soil temperature, soil WFPS, SOC, soil bulk density, and soil pH and correlated with the temporal and spatial variance.
2 Study Area
2.1 Site Description
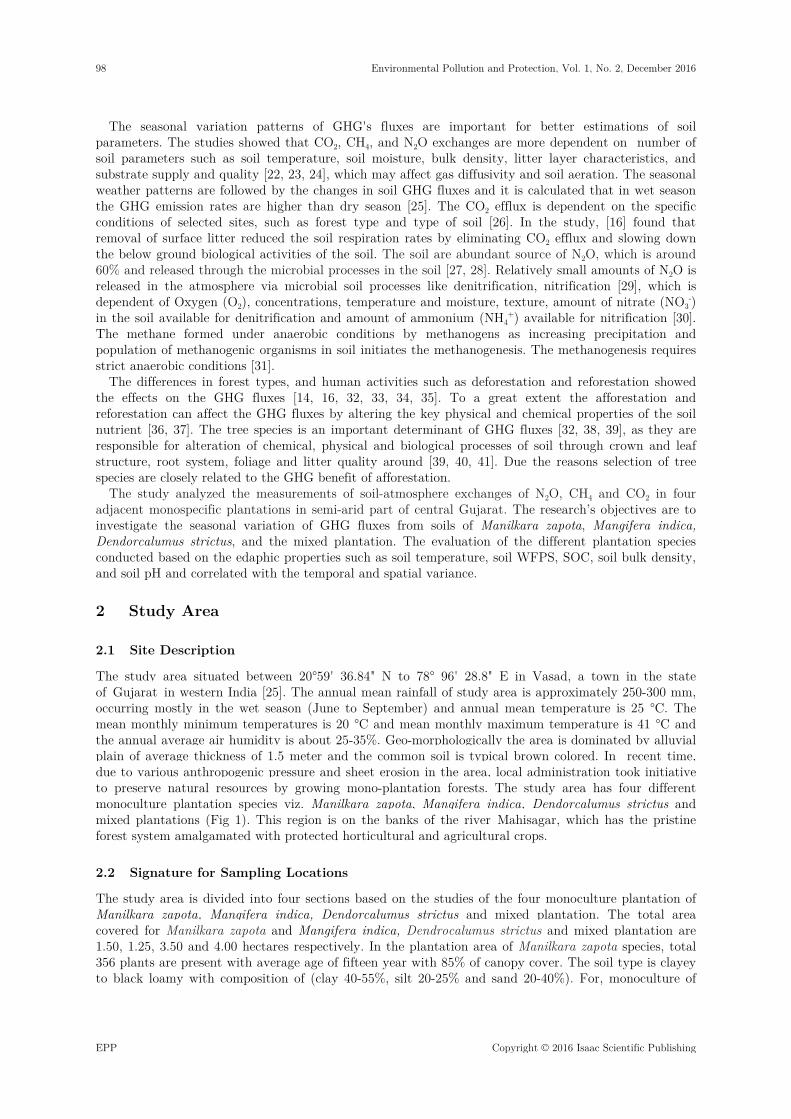
The study area situated between 20°59' 36.84" N to 78° 96' 28.8" E in Vasad, a town in the state of Gujarat in western India [25]. The annual mean rainfall of study area is approximately 250-300 mm, occurring mostly in the wet season (June to September) and annual mean temperature is 25 °C. The mean monthly minimum temperatures is 20 °C and mean monthly maximum temperature is 41 °C and the annual average air humidity is about 25-35%. Geo-morphologically the area is dominated by alluvial plain of average thickness of 1.5 meter and the common soil is typical brown colored. In recent time, due to various anthropogenic pressure and sheet erosion in the area, local administration took initiative to preserve natural resources by growing mono-plantation forests. The study area has four different monoculture plantation species viz. Manilkara zapota, Mangifera indica, Dendorcalumus strictus and mixed plantations (Fig 1). This region is on the banks of the river Mahisagar, which has the pristine forest system amalgamated with protected horticultural and agricultural crops.
2.2 Signature for Sampling Locations
The study area is divided into four sections based on the studies of the four monoculture plantation of Manilkara zapota, Mangifera indica, Dendorcalumus strictus and mixed plantation. The total area covered for Manilkara zapota and Mangifera indica, Dendrocalumus strictus and mixed plantation are 1.50, 1.25, 3.50 and 4.00 hectares respectively. In the plantation area of Manilkara zapota species, total 356 plants are present with average age of fifteen year with 85% of canopy cover. The soil type is clayey to black loamy with composition of (clay 40-55%, silt 20-25% and sand 20-40%). For, monoculture of
98 Environmental Pollution and Protection, Vol. 1, No. 2, December 2016
EPP Copyright © 2016 Isaac Scientific Publishing
Mangifera indica species, the plantation area is covered by 229 plants of average twenty year of age with 70% of canopy cover. The soil type is silty sand with composition marginally different (clay 30-40%, silt 30-35% and sand 30-45%). In the Dendrocalumus strictus plantation area, a total number of 250 plants are present with average age of 25 years with 82% of canopy cover and the soil type is clayey to sand (silt 15-20%, clay14-16% and sand 64-71%). In the case of mixed plantation, the soil is sandy with gravel in nature (silt 16-17%, clay 17-24% and sand 49-67%) and the total number of 318 different tree species at the age of 25 years covered the area. Few of the mixed plantations are Eucalyptus species, Azadirecta indica, Tectona grandis, Acacia nilotica and others.
Figure 1. Field site map of the four adjacent monoculture plantations and the approximate positions of plots for soil atmosphere GHGs exchanges sampling. Small squares are the plots for gas sampling (Manilkara zapota- Mz; Mangifera indica- Mi; Dandrocalumus strictus- Ds; Mixed plantation- MP)
3 Materials and Methods
3.1 Soil CO2, CH4 and N2O Sampling and Measurement
GHGs gas exchange chambers were installed in each site of the Manilkara zapota, Mangifera indica, Dendrocalumus strictus, and mixed plantation in year 2012. The CO2, CH4 and N2O emissions of soil were measured using the static chamber and gas chromatography techniques [42]. Each area was furnished with fixed static chamber of 100 cm diameter, prepared from non-reactive PVC (Poly Vinyl Chloride) material. The base less chamber was permanently fixed in to the soil by inserting about 5 cm of its length into the soil. The exposed part of chamber is approximately 20 cm high and was covered with a top roof and a small fan of about 8 cm diameter, to properly mix the air. The gas samples were collected every month from June 2012 to May 2013 on different time slots on three hours intervals ranging from 8:00 till 18:00 hrs. The fluxes of CO2, CH4 and N2O of the soil were measured at monthly interval during the experiment during June 2012 to May 2013. The samples collected at similar time from the four study areas in order to compare the differences in GHG flux between four types of plantations.
The gas samples were collected using 40 ml plastic syringes and stored in a sealed gas sampling vials. The CO2, CH4 and N2O concentrations from gas samples are analyzed within 24 to 48 hrs after collection using Gas Chromatography (Perkin Elmer- Gas Chromatography, USA), which is equipped with an electron capture detector (ECD) for N2O analysis, a flame ionization detector (FID) for CH4. To analyze the CO2, procedure used was described by [43]. The samples were analyzed at Sophisticated Instrumentation Centre for Applied Research & Testing (SICART), Vallabh Vidyanagar, Gujarat, India and average of six values are considered in analysis.
The gas fluxes are calculated from linear regressions of concentrations inside the chambers against the closure time [44] according to the following equation [45].
0
0
tT dCV PFA P T dt
ρ= .
Here, F is CH4, N2O, CO2 gas flux (mg/(m2·h)), ρ is gas density at the test temperature (mg/m3), V is chamber volume available (m3), A is bottom area of the chamber (m2), P is atmospheric pressure in
Environmental Pollution and Protection, Vol. 1, No. 2, December 2016 99
Copyright © 2016 Isaac Scientific Publishing EPP
the field (hPa), P0 is atmospheric pressure under standard conditions (hPa), T0 is absolute air temperature under standard conditions (25°C), T is absolute air temperature in chamber at the time of sampling (°C), Ct is concentration of mixed volume ratios of gases in chamber at time t (10−6).
3.2 Micro-environmental Data Measurements
The atmospheric pressure and air temperature of the chamber headspace at 1.5 m above the ground are measured. The soil temperature and moisture at 5 cm below soil surface were monitored at each chamber, while the gas samples were collected and measured using a digital thermometer. The content of soil moisture was determined by collecting soil samples close to the chambers at 0 to 10cm depth by gravimetric method. Fresh soil samples were weighed and transported to the laboratory, where they were oven dried at 105 ̊C for 24 hr, weighed again, and soil moisture content was determined. Volumetric soil moisture values were converted into values of water filled pore space (WFPS) by the following formula:
( ) ( )( )( )
3
3
%%
12.65
volWFPS
bd gcm
gcm
−
−
=
−
Where, bd is bulk density, vol is volumetric water content and 2.65 is the density of quartz. Statistical analysis (R2 and p-value) was performed using Statistical Package for Social Sciences
(SPSS) software package (Version 22.0).
3.3 Soil Sampling and Determination of Physico-Chemical Analysis:
The soil samples were collected at the depth of 0-10 cm below ground level at plantation sites with being air dried at room temperature of 25 °C. Followed collection, soil samples then passed through a sieve of 2 mm mesh size to remove coarse living roots and gravel, and afterwards grind into powder form in a mill before the chemical analysis. The samples were analyzed for soil parameters such as pH, nitrate, sulphate, phosphate and organic carbon etc using standard protocol [46]. The statistical analysis and linear regression (R2 and p-value) performed using Statistical Package for Social Sciences (SPSS) software package (Version 22.0).
4 Results and Discussion
4.1 Climatic Conditions
In the year 2013, May was recorded as the hottest month with the maximum temperature of 40 ̊C while January as the coldest month with minimum temperature recorded was 10 ̊C. The highest precipitation was 318 mm which is recorded in month of September and annual average air humidity was about 25-35% (Fig 2).The mean relative humidity was highest (85.8%) during the month of September and lowest (50.7%) during month of March (Table 1). The reasons of fluctuation in readings are different factors including monsoon dependent climate, soil temperature and WFPS as shown in Figure 2. The sampling period in November, 2012 is characterized by a brief wet episode in the cool-dry season. Considering the historical climatic characteristics in this study area, November 2008 was also included in the cool-dry season in this study.
4.2 Seasonality of Soil GHG Fluxes
The soil N2O and CO2 emission displayed the seasonal trends with the highest value in months between August to September in the hot-humid season and lowest in April in the cool-dry season and the emissions were positively correlated with WFPS. The rise in soil temperature decreased the N2O flux for all monoculture plantations while in the case of mixed plantation, estimated soil CH4 fluxes is significantly correlated to WFPS, which indicates that the magnitude of soil CH4 uptake reduced with
100 Environmental Pollution and Protection, Vol. 1, No. 2, December 2016
EPP Copyright © 2016 Isaac Scientific Publishing

the increased WFPS in all plantations. The considerable emission of CH4 flux was found in the case of mixed plantation (Fig.3) and seasonal changes in CO2 emission were positively related to changes in WFPS and soil temperature in each plantation, but in the case of Dendrocalumus strictus plantation the CO2 flux is inhibited. (Fig. 4 and Table 2)
(a)
(b)
Figure 2. Seasonal patterns of soil temperature (a), and soil temperature b) soil water filled pore space, WFPS, precipitation measured in the four subtropical monoculture plantation.. Error bars indicate standard error (n=6). (Manilkara zapota- Mz; Mangifera indica- Mi; Dandrocalumus strictus- Ds; Mixed plantation- MP)
Table 1. Soil characteristics (mean value ± standard deviation) in Manilkara zapota, Mangifera indica, Dendrocalumus strictus, mixed plantation at the four adjacent monoculture plantations in Central Gujarat, India.
Properties Manilkarazapota (Mz)
Mangifera indica (Mi)
Dendrocalumus strictus(Ds)
Mixed plantation (mp)
Soil texture Clayey to black loamy
Silty sand Silty to sandy Silty to loamy
pH 7.91±0.22 8.01±0.39 7.96 ± 0.18 7.92±0.20 Litter Fall (g m-2 yr-1) 111.50± 8.87 98.54±5.98 101 ± 5.24 121.54 ± 8.47 Litter (C:N) 29.45±6.87 44.54±4.98 32.90 ± 2.54 27.56±5.67 Particle Density(gm/cm3)
2.70±0.28 3.04±0.07 2.89 ± 0.08 2.97± 0.08
Bulk Density (gm/cm3) 11.06±1.66 4.89±0.45 7.27 ± 0.47 4.58±0.50 Porosity (%) 94.05±3.39 98.71±0.61 104.02 ±.26 101.25 ± 0.65 Moisture Content (%) 14.80±1.87 11.69±3.79 8.36 ± 4.77 6.27 ± 3.14 Calcium Hardness (mg/g)
11.72±2.39 15.23±0.74 17.72 ± 1.97 14.19±0.829
Magnesium Hardness(mg/g)
109.86±3.61 118.06±5.84 125.12 ± 3.04 113.59 ±13.72
Total Hardness (mg/g) 122.5±6.83 132.22±6.64 142.15 ± 4.56 119.30±2.306 Sulphate (mg/g) 0.15±0.05 0.17±0.06 0.14 ± 0.07 0.155±0.038 Available Phosphorous(mg/g)
0.01±0.01 0.02±0.01 0.01 ± 0.01 0.08±0.01
Nitrate (mg/g) 0.09±0.01 0.02±0.01 0.04 ± 0.02 0.02±0.01 Organic matter (%) 0.04±0.01 0.05±0.01 0.05 ± 0.02 0.06 ±0.02 Organic Carbon (%) 0.02±0.01 0.03±0.01 0.03±0.01 0.04±0.02
Environmental Pollution and Protection, Vol. 1, No. 2, December 2016 101
Copyright © 2016 Isaac Scientific Publishing EPP
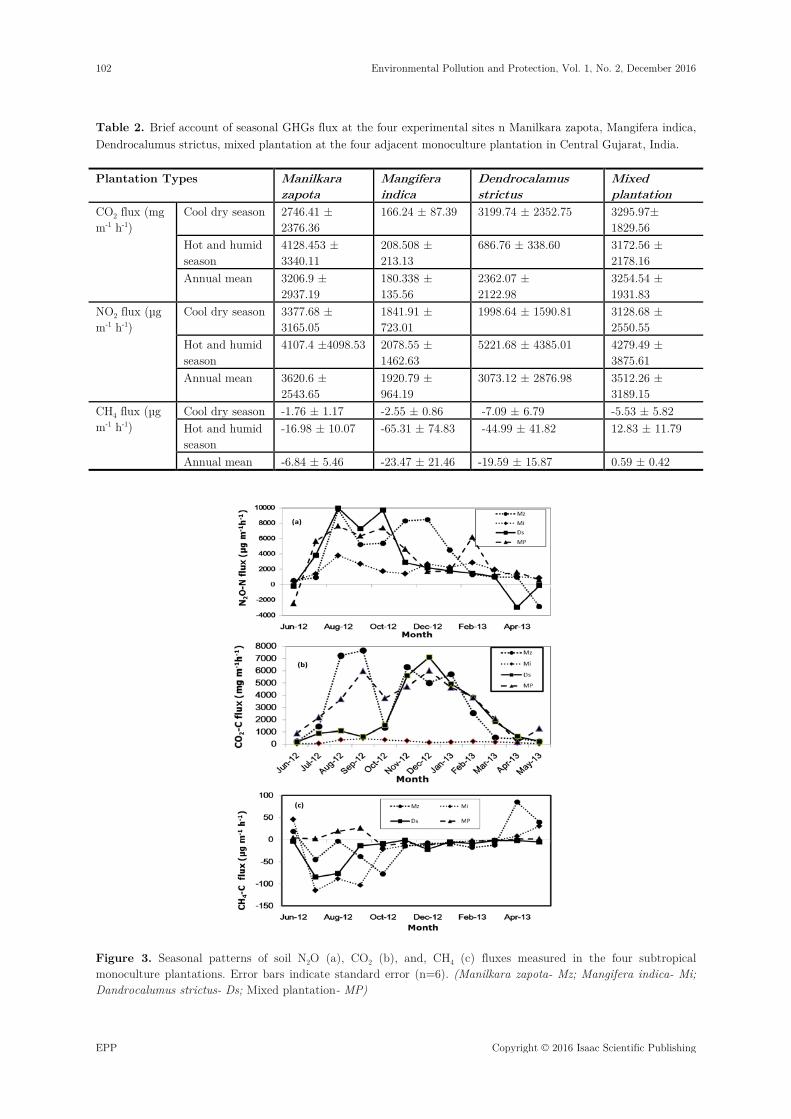
Table 2. Brief account of seasonal GHGs flux at the four experimental sites n Manilkara zapota, Mangifera indica, Dendrocalumus strictus, mixed plantation at the four adjacent monoculture plantation in Central Gujarat, India.
Plantation Types Manilkara zapota
Mangifera indica
Dendrocalamus strictus
Mixed plantation
CO2 flux (mg m-1 h-1)
Cool dry season 2746.41 ± 2376.36
166.24 ± 87.39 3199.74 ± 2352.75 3295.97± 1829.56
Hot and humid season
4128.453 ± 3340.11
208.508 ± 213.13
686.76 ± 338.60 3172.56 ± 2178.16
Annual mean 3206.9 ± 2937.19
180.338 ± 135.56
2362.07 ± 2122.98
3254.54 ± 1931.83
NO2 flux (µg m-1 h-1)
Cool dry season 3377.68 ± 3165.05
1841.91 ± 723.01
1998.64 ± 1590.81 3128.68 ± 2550.55
Hot and humid season
4107.4 ±4098.53 2078.55 ± 1462.63
5221.68 ± 4385.01 4279.49 ± 3875.61
Annual mean 3620.6 ± 2543.65
1920.79 ± 964.19
3073.12 ± 2876.98 3512.26 ± 3189.15
CH4 flux (µg m-1 h-1)
Cool dry season -1.76 ± 1.17 -2.55 ± 0.86 -7.09 ± 6.79 -5.53 ± 5.82 Hot and humid season
-16.98 ± 10.07 -65.31 ± 74.83 -44.99 ± 41.82 12.83 ± 11.79
Annual mean -6.84 ± 5.46 -23.47 ± 21.46 -19.59 ± 15.87 0.59 ± 0.42
(a)
(b)
(c)
Figure 3. Seasonal patterns of soil N2O (a), CO2 (b), and, CH4 (c) fluxes measured in the four subtropical monoculture plantations. Error bars indicate standard error (n=6). (Manilkara zapota- Mz; Mangifera indica- Mi; Dandrocalumus strictus- Ds; Mixed plantation- MP)
102 Environmental Pollution and Protection, Vol. 1, No. 2, December 2016
EPP Copyright © 2016 Isaac Scientific Publishing
(a)
(b)
(c)
(d)
(e)
(f)
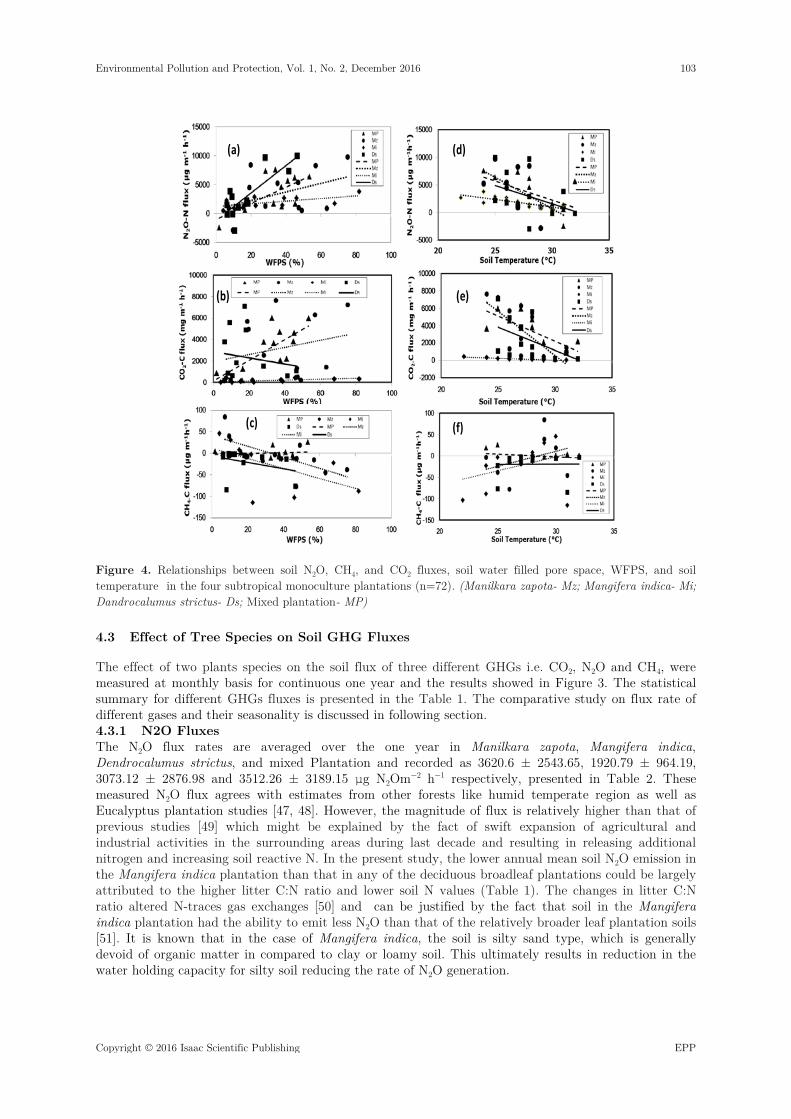
Figure 4. Relationships between soil N2O, CH4, and CO2 fluxes, soil water filled pore space, WFPS, and soil temperature in the four subtropical monoculture plantations (n=72). (Manilkara zapota- Mz; Mangifera indica- Mi; Dandrocalumus strictus- Ds; Mixed plantation- MP)
4.3 Effect of Tree Species on Soil GHG Fluxes
The effect of two plants species on the soil flux of three different GHGs i.e. CO2, N2O and CH4, were measured at monthly basis for continuous one year and the results showed in Figure 3. The statistical summary for different GHGs fluxes is presented in the Table 1. The comparative study on flux rate of different gases and their seasonality is discussed in following section. 4.3.1 N2O Fluxes The N2O flux rates are averaged over the one year in Manilkara zapota, Mangifera indica, Dendrocalumus strictus, and mixed Plantation and recorded as 3620.6 ± 2543.65, 1920.79 ± 964.19, 3073.12 ± 2876.98 and 3512.26 ± 3189.15 μg N2Om−2 h−1 respectively, presented in Table 2. These measured N2O flux agrees with estimates from other forests like humid temperate region as well as Eucalyptus plantation studies [47, 48]. However, the magnitude of flux is relatively higher than that of previous studies [49] which might be explained by the fact of swift expansion of agricultural and industrial activities in the surrounding areas during last decade and resulting in releasing additional nitrogen and increasing soil reactive N. In the present study, the lower annual mean soil N2O emission in the Mangifera indica plantation than that in any of the deciduous broadleaf plantations could be largely attributed to the higher litter C:N ratio and lower soil N values (Table 1). The changes in litter C:N ratio altered N-traces gas exchanges [50] and can be justified by the fact that soil in the Mangifera indica plantation had the ability to emit less N2O than that of the relatively broader leaf plantation soils [51]. It is known that in the case of Mangifera indica, the soil is silty sand type, which is generally devoid of organic matter in compared to clay or loamy soil. This ultimately results in reduction in the water holding capacity for silty soil reducing the rate of N2O generation.
Environmental Pollution and Protection, Vol. 1, No. 2, December 2016 103
Copyright © 2016 Isaac Scientific Publishing EPP
The highest N2O flux, which was found during hot-humid season in the case of Dandrocalumus strictus plantation, might be explained by extensive rhizome-root system accumulation of leaf mulch, and good moisture conservation efficiency. The seasonal changes in soil N2O emissions were significantly positive correlated to changes in WFPS in the case of Dendroalumus Stricus plantation, as showed in Figure 2 and 4.
In the case of Mixed plantation, high and significant correlation was found between N2O flux and organic matter (R2 = 0.601, P = 0.009) of soils (Table 3). It is well supported by the fact that N2O production by nitrification and denitrification will strongly increase with increasing WFPS and soil temperature in temperate forest as well as subtropical forest, as presented in Figure 2 [14]. Apart from this, [52] reported increased N2O fluxes are proportional to increased temperature. The N2O fluxes were significantly correlated with soil pH (as supported with R2 = 0.615, P =0.089) and bulk density in the case of Dandrocalumus strictus (Table 3). The results showed that N2O fluxes showed no significant correlation with soil temperature (Table 3) except in the case of mixed plantation (Figure 4), which was confirmed by similar studies for different type of plantation in subtropical forests by [53].
In this study, the significant variation is observed in seasonal shifts of N2O flux (Figure 3b). Soil N2O fluxes were affected by the factors such as precipitation [54], temperature [55], Soil organic matter [56], N availability [57], water-filled pore space and aeration. The average N2O emission rates and the total annual emissions recorded among four plantation sites were similar to previous reports for semi-arid zones [58].The research from [59] found that the soil served as N2O sink during the drought period and concluded that soil water status and soil nitrate availability were important driving factors for N2O sink. The long drought led to drastic decreases of soils N2O fluxes or may even turn forest soils temporarily to N2O sinks, presented in Fig 3b. 4.3.2 CO2 Flux One year averaged CO2 flux rates from Manilkara zapota, Mangifera indica, Dendrocalumus strictus and mixed plantation suggested large increase in CO2 fluxes from the soils. These are resulted because of weeding, mineral fertilization like calcium and phosphate with N:P:K and manure application, the mineral fertilization and manure application. The lowest annual mean CO2 flux recorded in the Mangifera indica plantation because of the litter C:N ratio was higher to led to the lowest decomposition rate than any of the broadleaved plantation (Table1). Earlier studies emphasized that litter C:N ratio is an important factor in regulating microbial activity and inducing litter decomposition [60]. In the case of the Mangifera indica plantations, the litter C:N ratio was higher than in the mixed plantation (Table 2). The microbial activity and lower heterotrophic respiration in the Mangifera indica plantation leads to relatively lower CO2 flux in mixed plantation than in the Manilkara zapota plantation site. The Manilkara zapota type contains in the undergrowth, which led to a longer period of active photosynthesis and more root biomass in this type [61] Looking in to seasonal variations, the soil moisture is one of the most important controlling factors for biological reactions, including heterotrophic microorganisms and plant roots, which produce CO2. The highest CO2 flux, was found during hot-humid season in case monoculture plantation with different tree species (Table 2) (Figure 3(a)). The results may be due to the effects of the rainfall, soil temperature (Figure 2(a)). The soil pores in the upper soil layers were filled with water during rainfall and soil diffusibility dramatically decreased when consecutive rain events occurred, resulting in decrease in soil diffusivity and increase in CO2 accumulation in soil [14]. In the case of Dendrocalumus strictus the negative correlation was found between CO2 flux and WFPS in between June to September (Fig. 2, 3 and 4). A possible reason behind this is sandy soil which is generally devoid of organic matter and organic carbon ultimately results in the reduction in the moisture holding capacity which limits CO2 emission from the soil.
In the case of Mangifera indica plantation, there was high and significant correlation that is found between soil CO2 flux and soil temperature (R2=0.521, p=0.021), organic matter (R2=0.618, p=0.004), as well as negative significant association with soil pH (R2=-0.689, p=0.108). On the other hand, for Manilkara zapota plantations, CO2 flux is significantly correlated with soil moisture (R2=0.528, p=0.021) and bulk density (R2=0.678, p=0.010) along with inverse association with pH (R2=-0.535, p=0.121). The results extracted from analysis are well supported by earlier scientific finding [62, 63], which analyzed that the soil CO2 flux rates has strong agreement with seasonal changes in soil temperature, soil microbial carbon, dissolved organic carbon, bulk density and dissolved organic nitrogen.
104 Environmental Pollution and Protection, Vol. 1, No. 2, December 2016
EPP Copyright © 2016 Isaac Scientific Publishing
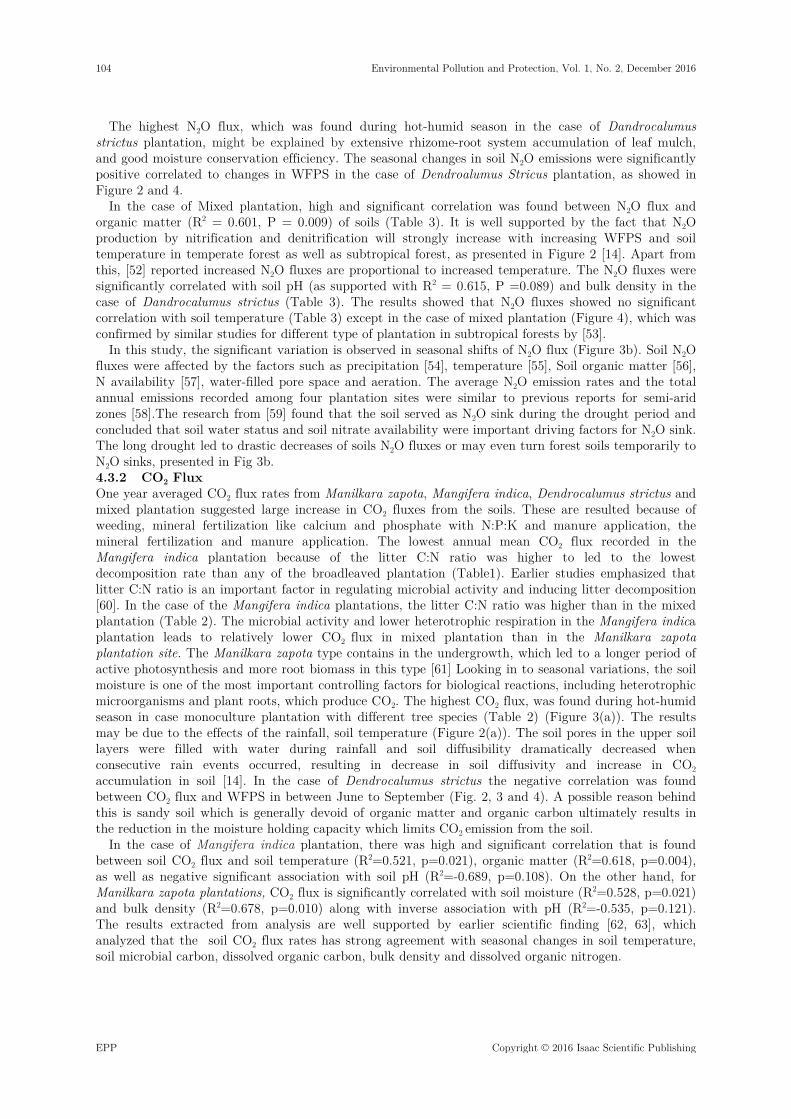
Table 3. Multiple linear regressions for annual mean for different soil properties and GHGs in Manilkarazapota, Mangifera indica, Dendrocalumus strictus and mixed plantationat the four adjacent monoculture plantation in Central Gujarat, India.
Plant type CO2 flux(mg CO2 m−2
h−1)
CH4 flux(μ g N2O m−2h−1)
N2O flux(μ gN2O m−2h−1)
Mangifera indica Soil temp R2 = 0.521, P = 0.021 R2 = -0.674, P = 0.105
R2 = -0.289, P = 0.204
Soil org matter R2 = 0.618, P = 0.0041 R2 = 0.522, P = .036 R2 = 0 75, P = 0.044
Soil pH R2 = -0.689, P = 0.108 R2 = 0.343, P = 0.241
R2 = 0.584, P = 0.117
Soil Moisture R2 = 0.336, P = 0.243 R2 = -0.286, P = 0.013
R2 = 0.195, P = 0.051
Soil bulk density
R2 = 0.237, P = 0.169 R2 = 0.516, P = 0.011
R2 = 0.265, P = 0.189
Manilkara zapota Soil temp R2 = 0.363, P = 0.032 R2 = -0.544, P = 0.027
R2 = -0.390, P = 0.105
Soil org matter R2 = 0.439, P = 0.055 R2 = 0.578, P = 0.071
R2 = 0.516, P = 0.045
Soil pH R2 = -0.535, P = 0.121 R2 = -0.157, P = 0.029
R2 = 0.436, P = 0.013
Soil Moisture R2 = 0.520, P = 0.021 R2 = -0.657, P = 0.053
R2 = 0.322, P = 0.037
Soil bulk density
R2 = 0.678, P = 0.0104 R2 = -0.502, P = 0.034
R2 = 0.376, P = 0.025
Dendrocalamus strictus
Soil temp R2 = -0.578, P = 0.018 R2 = -0.433, P = 0.271
R2 = -0.184, P = 0.111
Soil org matter R2 = 0.362, P = 0.023 R2 = 0.182, P = 0.103
R2 = 0.497, P = 0.005
Soil pH R2 = -0.523, P = 0.004 R2 = 0.316, P = 0.310
R2 = 0.615, P = 0.089
Soil Moisture R2 = 0.431, P = 0.532 R2 = -0.532, P = 0.027
R2 = 0.366, P = 0.105
Soil bulk density
R2 = 0.472, P = 0.153 R2 = 0.507, P = 0.032
R2 = 0.262, P = 0.152
Mixed plantation Soil temp R2 = 0.732, P = 0.007 R2 = -0.211, P = 0.090
R2 = -0.276, P = 0.103
Soil org matter R2 = 0.442, P = 0.219 R2 = 0.490, P = 0.082
R2 = 0.601, P = 0.009
Soil pH R2 = -0.513, P = 0.003 R2 = 0.348, P = 0.312
R2 = 0.470, P = 0.027
Soil Moisture R2 = 0.419, P = 0.025 R2 = -0.627, P = 0.042
R2 = 0.252, P = 0.114
Soil bulk density
R2 = 0.335, P = 0.027 R2 = 0.225, P = 0.170
R2 = 0.313, P = 0.103
The temporal variations in soil CO2 emission in all plantations coincide with soil temperature and soil
WFPS (Figure 2, 3, 4 and Table 2) [53]. The data indicates that the increased soil CO2 efflux in the broad-leaf plantations is largely attributed to the enhanced heterotrophic respirations in the broadleaf plantations in this study. Also the high to moderate CO2 flux between June to September was observed
Environmental Pollution and Protection, Vol. 1, No. 2, December 2016 105
Copyright © 2016 Isaac Scientific Publishing EPP

when soil WFPS were high. Similarly, low to negligible CO2 fluxes were observed in month of May and June, when soil WFPS content were low [64]. Lower emission of CO2 during winter season may be because the soil biological activities are minimal due to low soil temperature [65, 66]. 4.3.3 CH4 Flux The one year averaged CH4 flux rates from Manilkara zapota, Mangifera indica, Dendrocalumus stricus and mixed plantation are recorded as (mean ± S.E.) -6.84 ± 5.46, -23.47 ± 21.46, -19.59 ± 15.87 and 0.59±0.42 μgCH4 m−2 h−1, respectively (Table 3). As shown in Table 2, for all tree species, soils acted as sinks for atmospheric CH4 with exception of mixed plantation. Furthermore, it has been suggested that for the soil with higher litter fall in the case of mixed plantation, litter decomposed slowly because of relatively lower moisture and higher temperature of air in dry season, which limit the activity of methanogens (Figure 3). With increase in the rainfall in dry soil, the methanogenic bacteria activity increased. Based on the findings, it is clear that the CH4 production is switched on and off in relatively dry soils (Angle et al. 2012). The high soil respiration rates can create anaerobic microsites as O2 is consumed, which results in production of CH4 in soil [53, 67]. Therefore, soil should consume less CH4, when CO2 production by root and microbial respiration is higher. The greater annual mean soil uptake in the Mangifera indica plantation than that any of the broadleaf plantations could largely be attributed to the lower mean soil CO2 flux in the Mangifera indica plantation (Table 1 and Figure 2(a)).
There were no significant seasonal differences in CH4 fluxes over the one year for any Broad-leaf Plantation species (Figure 4, Tables 3 and 4). With the exception of Mangifera indica plantation, the CH4 flux rates from all tree species showed no significant correlation with the soil temperature (as supported with R2 = -0.674, P = 0.105) (Table 3). The CH4 flux rates showed significant correlation with soil moisture in the case of Manilkara zapota and Mixed Plantation (well depicted with R2 =-0.657, P= 0.053 and R2 = -0.627, P = 0.042). However in the study, the effects of soil moisture changes on CH4 uptake rates, were less pronounced than those in the previous studies by [50]. When WFPS is obliviously and soil moisture are higher than O2 reduced dispersion in to such soil profile effect on the CH4 emission from the soil. The soil CH4 flux was significantly correlated with WFPS in the case of Mixed Plantation as shown in Fig.4. This is in contrast to finding of [68], that the soil moisture strongly control the uptake of atmospheric CH4 by limiting the diffusion of CH4 into the soil, resulting in a negative correlation between soil moisture and CH4 uptake rates under most non-drought conditions. There was high and significant correlation which is found between soil CH4 flux and soil temperature (R2 = -0.674, P = 0.105), organic matter (R2 = 0.522, P = 0.036), as well as negative significant association with soil bulk density (R2 = -0.516, P = 0.011) in the case of Manilkara zapota plantation [69] (Figure 4). However, if soil temperature is continually rising to the optimal level, the reproduction and activity of methanotrophs in soil will gradually decrease because methanotrophs fail to compete with nitrifiers and other microbes for limited oxygen in soil air. Rest of the other associations are of less significance and shown in Table 3.
In the case of temporal variations, The CH4 flux in the mixed plantation depended on soil WFPS (Figure 4). The soil fluxes were positively correlated with soil WFPS, in the case of Mixed plantation (Figure 4) [53].These results are similar with other studies in tropical and temperate forests, where soil CH4 uptake rates were negatively related to soil moisture in all plantations.
5 Conclusion
The annual mean soil flux for three major GHGs were quantified to be higher in the mixed plantation than in any of the three broad leaf plantations, categorized as Manilkara zapota, Mangifera indica, and Dendrocalumus strictus in the study. The CO2 and N2O fluxes of soil were affected by soil moisture except in the case of Dendrocalumus strictus plantation. However, soil CO2 and N2O fluxes were not significantly correlated with soil temperature, CO2 emissions and N2O emission. On the other hand N2O flux is affected by WFPS, Organic Carbon and mainly affected by anthropogenic activity like excess use of the fertilizers. Moreover, soil CH4 fluxes were not significantly correlated with soil temperature, and soil WFPS. Therefore, Dendrocalumus strictus is the best candidate of selection for afforestation for the potential plantation wastelands and in the industrial areas in future course of time.
106 Environmental Pollution and Protection, Vol. 1, No. 2, December 2016
EPP Copyright © 2016 Isaac Scientific Publishing
References
1. Stocker, T.F., Qin, D., Plattner, G.K., Tignor, M., Allen, S.K., Boschung, J., Nauels, A., Xia, Y., Bex, V., Midgley, P.M., 2014. IPCC 2013: Climate change 2013: The physical science basis. Cambridge University Press, Cambridge, United Kingdom and Ney York, NY, USA, pp. 1535.
2. Tang, J., Baldocchi, D.D., Qi, Y., Xu, L., 2003. Assessing soil CO2 efflux using continuous measurements of CO2 profiles in soils with small solid-state sensors. Agr Forest Meteorol., 118: 207–220.
3. Cox, P.M., Betts, R.A., Jones, C.D., Spall, S.A.,Totterdell, I.J., 2000. Acceleration of global warming due to carbon-cycle feedbacks in a coupled climate model. Nature, 409: 184-187.
4. Giardina, C.P., Ryan, M.G., 2000. Evidence that decomposition rates of organic carbon in mineral soil do not vary with temperature. Nature, 404: 858–861.
5. Hall, B.D., Dutton, G.S., Mondeel, D.J., Nance, J.D., Rigby, M., Butler, J.H., Moore, F.L., Hurst, D.F., Elkins, J.W., 2011. Improving measurements of SF 6 for the study of atmospheric transport and emissions. Atmospheric Measurement Techniques, 4(11):2441-2451.
6. Baggs, E.M., Blum, H., 2004. CH4 oxidation and emissions of CH4 and N2O from Loliumperenne swards under elevated atmospheric CO2. Soil Biol Biochem., 36: 713–723.
7. Mosier, A.R., Delgado, J.A., Keller, M., 1998. Methane and nitrous oxide fluxes in an acid Oxisol in western Puerto Rico: effects of tillage, liming and fertilization. Soil Biol Biochem., 30: 2087–2098.
8. IPCC, 2001: Climate change 2001: impacts, adaptation and vulnerability, Contribution of Working Group II to the Third Assessment Report of the Intergovernmental Panel on Climate Change, edited by J. J. McCarthy, O. F. Canziani, N. A. Leary, D. J. Dokken and K. S. White (eds). Cambridge University Press, Cambridge, UK, and New York, USA, 2001. No. of pages: 1032.
9. Saraswat, C., Kumar, P., 2016. Climate justice in lieu of climate change: a sustainable approach to respond to the climate change injustice and an awakening of the environmental movement. Energy, Ecology and Environment, 1(2):67-74.
10. Jarvie, H.P., Jickells, T.D., Skeffington, R.A., Withers, P.J.A., 2012. Climate change and coupling of macronutrient cycles along the atmospheric, terrestrial, freshwater and estuarine continuum. Science of the total environment, 434: 252-258.
11.Bouwman, A.F., 1990. Exchange of Greenhouse gases between terrestrial ecosystem and the atmosphere. In Bowman, A.F., (eds ) Soils and the Greenhouse Effect, Chichester, Wiley, pp. 61–127.
12. Saraswat, C., Kumar, P., Mishra, B.K., 2016. Assessment of stormwater runoff management practices and governance under climate change and urbanization: An analysis of Bangkok, Hanoi and Tokyo. Environmental Science and Policy, 64:101-117.
13. Lang, M., Cai, Z.C., Mary, B., Hao, X.Y., Chang, S.X., 2010. Land use type and temperature affect gross nitrogen transformation rates in Chinese and Canadian soils. Plant Soil, 334: 377–389.
14. Tang, X.L., Liu, S.G., Zhou, G.Y., Zhang, D.Q., Zhou, C.Y., 2006. Soil atmospheric exchange of CO2, CH4, and N2O in three subtropical forest ecosystems in southern China. Glob change biol., 12: 546–560.
15. Christiansen, J.R., Vesterdal, L., Gundersen, P., 2012. Nitrous oxide and methane exchange in 30 two small temperate forest catchments-effects of hydrological gradients and implications for global warming potentials of forest soils. Biogeochemistry, 107: 437–454.
16. Peichl, M., Arain, M.A., Ullah, S., Moore, T.R., 2010. Carbon dioxide, methane, and nitrous oxide exchanges in an age-sequence of temperate pine forests. Global Change Biology, 16: 2198– 2212.
17.WMO., 2007. World Climate News. June 31, 2007. World Metrological Organization, Geneva Switzerland. 18. Kaygusuz, K., 2009. Energy and environmental issues relating to greenhouse gas emissions for sustainable
development in Turkey. Renewable and Sustainable Energy Reviews, 13(1):253-270. 19. IPCC., 2007. Climate Chang: The Physical Science Basis. Contribution of Working Group I to the Fourth
Assessment Report of the Intergovernmental Panel on Climate Change. Cambridge University Press, Cambridge, UK and New York, NY, USA, 996.
20. Ravishankara, A.R., Daniel, J.S., Portmann, R.W., 2009. Nitrous Oxide (N2O), The Dominant Ozone-Depleting Substance Emitted in the 21st Century. Science, 326: 123-125.
21. Snyder, C.S., Bruulsema, T.W., Jensen, T.L, Fixen, P.E., 2009. Review of greenhouse gas emissions from crop production systems and fertilizer management effects. Agric Ecosyst Environ., 133: 247-266.
Environmental Pollution and Protection, Vol. 1, No. 2, December 2016 107
Copyright © 2016 Isaac Scientific Publishing EPP
22. Davidson, E.A., Janssens, I.A., Luo, Y.Q., 2006. On the variability of respiration in terrestrial ecosystems: moving beyond Q (10). Glob Change Biol.,12: 154–164.
23. Kumar, N.,Patel, K., Kumar, R.N., Gupta, P., 2012.Assessment of soil-atmosphere exchange of greenhouse gases and their environmental factors in tropical dry deciduous forest and eucalyptus plantation at central Gujarat, Western India. Int. J. Environ. Sci., 2(4): 1873-1888.
24. Patel, D., Kumar, P., Herath, S., Kumar, N., Avtar, R., 2015. Assessment of Factors for Soil-Atmosphere Exchange of Greenhouse Gases in Manilkara Zapota Plantation and Mangifera Indica Plantation in Western India. Int. Jou. Res. and Inno. Earth Sci.,2(3): 2394-1375.
25. Liu, H., Zhao, P., Lu, P., Wang, Y.S., Lin, Y.B., Rao X.Q., 2008. Greenhouse gas fluxes from 15 soils of different land-use types in a hilly area of South China. Agric Ecosyst Environ., 124: 125–135.
26.Churkina, G., Tenhunen, J., Thornton, P., Falge, E.M., Elbers, J.A., Erhard, M., Grunwald, T., Kowalski, A.S, Rannik, U, Sprinz, D., 2003. Analyzing the ecosystem carbon dynamics of four European coniferous forests using a biogeochemistry model. Ecosystems, 6: 168–184.
27. Butterbach-Bahl, K., Baggs, E.M., Dannenmann, M., Kiese, R., Zechmeister-Boltenstern, S., 2013. Nitrous oxide emissions from soils: how well do we understand the processes and their controls?. Phil. Trans. R. Soc. B, 368: 20130122.
28. Firestone, M.K., Davidson, E.A., 1989. Microbiological basis on NO and N2O production and consumption in soils. In: Andreae MO, Schimel D (eds) Exchange of Trace Gases between Terrestrial Ecosystems and the Atmosphere. John Wiley and Sons, Chichester. UK, 7–21.
29. Kool, D.M., Dolfing, J., Wrage, N., Van, Groenigen, J.W., 2011. Nitrifier denitrification as a distinct and significant source of nitrous oxide from soil. Soil Biol Biochem., 43:174–178.
30. Ullah, B., Shaaban, M., Hu, R.G., Zhao, J.S., Lin, S., 2016. Assessing soil nitrous oxide emission as affected by phosphorous and nitrogen addition under two moisture levels. Journal of Integrative Agriculture, 15 (0): 60345-7.
31.LeMer, J., Roger, P., 2001. Production, oxidation, emission and consumption of methane by soils a review. European Journal of soil science, 37:25–50.
32. Zheng, H., Ouyang, Z.Y., Xu, W.H., Wang, X.K., Miao, H., Li, X.Q., Tian, Y.X., 2008. Variation of carbon storage by different reforestation types in the hilly red soil region of southern China. For Ecol Manage., 255:1113–1121.
33. Law, B.E., Thornton, P.E., Irvine, J., Anthoni, P.M., Van Tuyl, S., 2001. Carbon storage and fluxes in ponderosa pine forests at different developmental stages, 7: 755–777.
34. Sharma, C.M., Gairola, S., Baduni, N.P., Ghildiyal, S.K., Suyal, S.,2011. Variation in carbon stocks on different slope aspects in seven major forest types of temperate region of Garhwal Himalaya. India. J. Biosci., 36: 701–708.
35. Yang, Y.S., Guo, J.F., Chen, G.S., Xie, J.S., Gao, R., Li, Z., Jin, Z., 2005. Carbon and nitrogen pools in Chinese fir and evergreen broadleaved forests and changes associated with felling and burning in mid-subtropical China. For Ecol Manage, 216: 216–226.
36. Merino, A., Perez-Batallon, P., Macias, F., 2004. Responses of soil organic matter and greenhouse gas fluxes to soil management and land use changes in a humid temperate region of southern Europe. Soil Biol Biochem., 36: 917–925.
37. Kelliher, F.M., Clark, H., Zheng, L., Newton, P.C.D., Parsons, A.J., Rys. G., 2006. A comment on scaling methane emissions from vegetation and grazing ruminants in New Zealand. Function Plant Biology, 33: 613–615.
38. Borken W., Xu, Y.J., Beese, F., 2003. Conversion of hardwood forests to spruce and pine plantations strongly reduced soil methane sink in Germany. Glob Change Biol., 9: 956–966.
39.Borken, W., Beese, F., 2005. Control of nitrous oxide emissions in European beech, Norway spruce and Scots pine forests. Biogeochemistry, 76: 141–159.
40. Jonard, M., Andre, F., Jonard, F., Mouton, N., Proces, P., Ponette, Q., 2007. Soil carbondioxide efflux in pure and mixed stands of oak and beech. 64: 141-150.
41. Ullah, S., Frasier, R., King, L., Picotte-Anderson, N.P., Moore, T.R., 2008. Potential fluxes of N2O and CH4 from soils of three forest types in Eastern Canada. Soil Biol Biochem., 40: 986–994.
42. Bréchet, L., Ponton, S., Roy, J., Freycon, V., Coûteaux, M., Bona, D., Epron, D., 2009. Do tree species characteristics influence soil respiration in tropical forests? A test based on 16 tree species planted in monospecific plots. Plant Soil., 319: 235–246.
108 Environmental Pollution and Protection, Vol. 1, No. 2, December 2016
EPP Copyright © 2016 Isaac Scientific Publishing
43. Hartmann, A., Buchmamm, N., Niklaus, P., 2011. A Study of soil methanesink regulation in two grasslands exposed to drought and N fertilization. Plant Soil, 342:265-275.
44. Hari, P., Nikinmaa, E., Pohja, T., Siivola, E., Bäck, J., Vesala, T., Kulmala, M., 2013. Station for Measuring Ecosystem-Atmosphere Relations: SMEAR. In Physical and Physiological Forest Ecology. Springer Netherlands, pp. 471-487.
45.Wang, Y. S., Wang, Y.H., 2003. Quick measurement of CH4, CO2 and N2O emissions from a short-plant ecosystem. Adv. Atmos. Sci., 20:842- 844.
46. Trivedy, R.K., Goel, P.K., 1986. Chemical and biological methods for water pollution studies, Environmental Publication, Karad, Maharashtra. Pp. 128.
47. Rosenkranz, P., Bruggemann N., Papen, H., Xu, Z., Horvath, L., Butterbach-Bahl, K., 2006. Soil N and C trace gas fluxes and microbial soil N turnover in a sessile oak (Quercuspetraea (Matt.) Liebl. forest in Hungary. Plant Soil, 286: 301–322.
48. Livesley, S.J., Kiese, R., Miehle, P., Weston, C.J., Butterbach-Bahl, K., Arndt, S.K., 2009. Soil-atmosphere exchange of greenhouse gases in a Eucalyptus marginata woodland, a clover-grass pasture, and Pinusradiata and Eucalyptus globulus plantations. Glob Change Biol., 15: 425–440.
49.Ventere, R.T., Groffman, P.M., Verchot, L.V., Magill, A.H., Aber, J.D., Steudler, P.A.,2003. Nitrogen oxide gas emissions from temperate forest soils receiving long-term nitrogen inputs. Glob Change Biol., 9: 346–357.
50. Werner, C., Kiese, R., Butterbach-Bahl, K.,2007. N2O, CH4 and CO2 flux measurements from tropical rain forest soils in western Kenya, J. Geophys. Res., 112: D03308.
51. Pilegaard, K., Skiba, U., Ambus, P., 2006. Factors controlling regional differences in forest soil emission of nitrogen oxides (NO and N2O). Biogeosciences, 3: 651–661.
52. Sitaula, B.K., Bakken, L.R., 1993. Nitrous oxide release from Spruce forest soil-relationships with nitrification, methane uptake, temperature, moisture and fertilization. Soil biol biochem., 25: 1415- 1421.
53. Hui, W., Liu, S., Wang, J., Shi, Z., Lu, L., Zeng, J., Ming, A., Tang, J., Yu, H., 2013. Effects of tree species mixture on soil organic carbon stocks and greenhouse gas fluxes in subtropical plantations in China. Forest Ecol Manag., 300: 4–13.
54. Inubushi, K., Furukawa, Y., Hadi, A., Purnomo, E., Tsuruta, H., 2003. Seasonal changes of CO2, CH4 and N2O fluxes in relation to land-use change in tropical peatlands located in coastal area of South Kalimantan. Chemosphere, 52: 603–608.
55. Keeney, D.R., Fillery, I.R., Marx, G.P., 1979. Effect of temperature on the gaseous nitrogen products of denitrification in a silty loam soil. Soil Science society of America, 43: 1124–1128.
56. Beauchamp, E.G., 1997. Nitrous oxide emission from agriculture soils. Can. J. Soil Sci.,77: 113–123. 57. Dobbie, K.E., McTaggart, I.P., Smith, K.A., 1999. Nitrous oxide emissions from intensive agricultural systems:
variations between crops and seasons, key driving variables, and mean emission factors. J. Geophys. Res., 104 D21: 26891–26899.
58. Shrestha, R.K., Lal, R., Penrose, C., 2009. Greenhouse gas emissions and global warming potential of reclaimed forest and grassland soils. J. Environ. Qual., 38: 426–436.
59. Goldberg, S.D., Gebauer, G., 2009. Drought turns a Central European Norway spruce forest soil 25 from an N2O source to a transient N2O sink. Glob Change Biol., 15: 850–860.
60. Manzoni, S., Trofymow, J.A., Jackson, R.B., Porporato, A., 2010. Stoichiometric controls on carbon, nitrogen, and phosphorus dynamics in decomposing litter. Ecological Monographs, 80(1):89-106.
61. Camara-Cabrales, L., Devall, M.S., Fajvan, M.A., Briseno, M.M., Mize, C.W., Navarro-Martinez, A., 2014. Silviculture of the mahogany forest of Quintana Roo, Mexico: criteria and recommendations.
62. Lou, Y.S., Li, Z.P., Zhang, T.L., Liang, Y.C., 2004. CO2 emissions from subtropical arable soils of china. Soil Biol Biochem., 36: 1835–1842.
63. Iqbal, J., Hu, R.G., Feng, M.L., Lin, S., Malghani, S., Ali, I.M., 2010. Microbial biomass, and dissolved organic carbon and nitrogen strongly affect soil respiration in different land uses. A case study at Three Gorges Reservoir Area, South China. Agric Ecosyst Environ, 137(15): 294–307.
64. Drewer, J., Finch, J.W., Lloyd, C.R., Baggs, E.M., Skiba, U., 2012. How do soil emissions of N2O, CH4 and CO2 from perennial bioenergy crops differ from arable annual crops?. GCB Bioenergy, 4(4):408-419.
65.Follett, R.F., 1997. CRP and microbial biomass dynamics in temperate climates. In R. Lal (ed.) Management of carbon sequestration in soil. Boca Raton, FL. CRC Press. pp 305-322.
Environmental Pollution and Protection, Vol. 1, No. 2, December 2016 109
Copyright © 2016 Isaac Scientific Publishing EPP
66. Baijracharya, R. M., Lal, R., Kimble, J.M., 2000. Diurnal and seasonal CO2-C flux form soil as related to erosion phases in central Ohio. Soil Sci Soc Am J., 64: 286–293.
67. Verchot, L.V., Davidson, E.A., Cattani, J.H., Ackerman, I.L., 2000. Land-use change and biogeochemical controls of methane fluxes in soils of eastern Amazonia. Ecosystem, 3: 41–56.
68. Borken, W., Beese, F., 2006. Methane and nitrous oxide fluxes of soils in pure and mixed stands of European beech and Norway spruce. Eur J Soil Sci., 57: 617–625.
69.Nedwell, D.B., Watson, A., 1995. CH4 production, oxidation and emission in a UK ombrotrophic peat bog Influence of SO42− from acid-rain. Soil Biol Biochem., 27: 893–903.
70. Degelmann, D.M., Broken, W., Drake, H.L., Kolb S., 2010. Different Atmospheric Methane-Oxidizing Communities in European Beech and Norway spruce Soils. Appl. Environ. Microbiol.,76: 3228–3235.
71. Derrick, Y.F.L.,2009. Methane Dynamics in Northern Peatlands: A Review. Pedosphere, 19(4): 409–421. 72. Hosaka, Y., Saraswat, C., Moe, A.T., Kumar, P., Ramanathan, A.L., 2016. Enhancing Resilience for Sustainable
Development in Lake Baikal and Baikal Basin: Fresh Water Paradise. Journal of Climate Change, 2(1):61-67. 73. Saraswat, C., Kumar, P., Kem, D., Avtar, R., Ramanathan, A.L., 2015. Payment of Ecosystem Service to
Alleviate Poverty from Kyrgyz Republic in Central Asia Considering Climate Change and Extreme Weather Condition. Journal of Climate Change, 1(1, 2):119-128.
74. Angel, R., Claus, P., Conrad, R., 2012. Methanogenic archaea are globally ubiquitous in aerated soils and become active under wet anoxic conditions. ISME J., 6: 847–862.
110 Environmental Pollution and Protection, Vol. 1, No. 2, December 2016
EPP Copyright © 2016 Isaac Scientific Publishing