assessment of working capital management rajastan spining & weaving mills ltd
TRANSCRIPT

A Project Report On;
“Commodity Futures”For Prabodh Pvt. Ltd.
SUBMITTED TO,
Dr. B.A.M.U. UNIVERSITY, AURANGABAD
IN PARTIAL FULFILLMENT OF 3 YEARS FULL TIME COURSE OF-
BACHELOR OF BUSINESS ADMINISTRATION
Submitted By:
xrf
A report submitted in partial fulfillment of
The requirement of
Bachelor of Business Administration
{BBA}
DEOGIRI COLLEGE AURANGADAD
Acknowledgement
I have great pleasure to present the project report on “Commodity Futures” for Prabodh, in
partial fulfillment of Master’s Degree in Business Administration, University of Aurrangabad, at
Deogiri Institute of Management & Research,.
I would like to place on records deepest sense of gratitude to Mr. Mohan Chimanlal Gujarathi,
Director of Prabodh, for his inspiring and able guidance which made it possible to bring the best
of my efforts on the project.
I am desirous of placing on record profound indebtedness to Mr. Balachandran, project guide, for
valuable advice, guidance and support he offered.
I also acknowledge the gratitude to Director of Deogiri Institute of Management & Research,.
who motivated us a lot in carrying out this project.

CONTENTS
INTRODUCTION AND SCOPE OF THE PROJECT…………………….…………1
INTRODUCTION TO FUTURES…………………………………………..………... 3
FUTURES TERMINOLOGY
COMMODITY DERIVATIVES
DEFINITION OF COMMODITY FUTURES
PRICING OF COMMODITY FUTURES
INVESTMENT ASSETS VERSUS CONSUMPTION ASSET
PRICING
BASIC PAYOFFS
TRADING IN COMMODITY FUTURES / TRADING SYSTEM
CLEARING AND SETTLEMENT
REGULATORY FRAMEWORK
THE ‘COMMODITY EXCHANGE’ PLATFORM…………………….…………... 18
PROMOTERS & GOVERNANCE
THE NCDEX SYSTEM: HOW TRANSACTION HAPPENS ON THE NCDEX
CLEARING
SETTLEMENT

COMMODITY ANALYSIS…………………….…………………….……………… 20
BULLION (PRECIOUS METALS): GOLD & SILVER
ENERGY: CRUDE OIL
CONCLUSION…………………….…………………….………………………… 105
ECONOMIC FUNCTIONS: LIQUIDITY, RISK TRANSFER, PRICE DISCOVERY
BENEFICIARIES
INVESTMENT IN COMMODITY FUTURES
BIBLIOGRAPHY…………………….…………………….……………………….. 111
ANNEXURE-I…………………….…………………….…………………………… 112
ANNEXURE-II…………………….…………………….…………………………... 119

CONTENTS
INTRODUCTION AND SCOPE OF THE PROJECT…………………….…………1
INTRODUCTION TO FUTURES…………………………………………..………... 3
FUTURES TERMINOLOGY
COMMODITY DERIVATIVES
DEFINITION OF COMMODITY FUTURES
PRICING OF COMMODITY FUTURES
INVESTMENT ASSETS VERSUS CONSUMPTION ASSET
PRICING
BASIC PAYOFFS
TRADING IN COMMODITY FUTURES / TRADING SYSTEM
CLEARING AND SETTLEMENT
REGULATORY FRAMEWORK
THE ‘COMMODITY EXCHANGE’ PLATFORM…………………….…………... 18
PROMOTERS & GOVERNANCE
THE NCDEX SYSTEM: HOW TRANSACTION HAPPENS ON THE NCDEX
CLEARING
SETTLEMENT

COMMODITY ANALYSIS…………………….…………………….……………… 20
BULLION (PRECIOUS METALS): GOLD & SILVER
ENERGY: CRUDE OIL
CONCLUSION…………………….…………………….………………………… 105
ECONOMIC FUNCTIONS: LIQUIDITY, RISK TRANSFER, PRICE DISCOVERY
BENEFICIARIES
INVESTMENT IN COMMODITY FUTURES
BIBLIOGRAPHY…………………….…………………….……………………….. 111
ANNEXURE-I
ANNEXURE-II

CONTENTS
INTRODUCTION AND SCOPE OF THE PROJECT……………………. 1
COMMODITY FUTURES……………………. 3FUTURES TERMINOLOGYCOMMODITY DERIVATIVESDEFINITION OF COMMODITY FUTURESPRICING OF COMMODITY FUTURESINVESTMENT ASSETS VERSUS CONSUMPTION ASSETPRICINGBASIC PAYOFFSTRADING IN COMMODITY FUTURES FUTURES TRADING SYSTEM CLEARING AND SETTLEMENT REGULATORY FRAMEWORK
THE ‘COMMODITY EXCHANGE’ PLATFORM……………………. 18 PROMOTERS & GOVERNANCE THE NCDEX SYSTEM: HOW TRANSACTION HAPPEN ON THE NCDEX CLEARING SETTLEMENT
COMMODITY ANALYSIS……………………. 20BULLION (PRECIOUS METALS): GOLD & SILVERENERGY: CRUDE OIL CONCLUSION……………………. 105 ECONOMIC FUNCTIONS: LIQUIDITY, RISK TRANSFER, PRICE DISCOVERY BENEFICIARIESINVESTMENT IN COMMODITY FUTURES:
ANNEXURE-I
ANNEXURE-II

INTRODUCTION AND SCOPE OF THE PROJECT:
The origin of derivatives can be traced back to the need of farmers to protect themselves against fluctuations in the price of their crop. From the time it was sown to the time it was ready for harvest, farmers would face price uncertainty. Through the use of simple derivative products, it was possible for the farmer to partially or fully transfer price risks by locking in asset prices. These were simple contacts developed to meet the needs of farmers and were basically a means or reducing risk.
A farmer who sowed his crop in June faced uncertainty over the price he would receive for his harvest in September. In years of scarcity, he would probably obtain attractive prices. However during times of oversupply, he would have to dispose off his harvest at a very low price. Clearly this meant that the farmer and his family were exposed to a high risk of price uncertainty.
On the other hand, a merchant with and ongoing requirement of grains too would face a price risk that of having to pay exorbitant prices during dearth, although favorable prices could be obtained during periods of oversupply. Under such circumstances, it clearly made sense for the farmer and the merchant to come together and enter into a contract whereby the price of the grain to be delivered in September could be decided earlier. What they would then negotiate happened to be a futures type contract, which would enable both parties to eliminate the price risk.
In 1848, the Chicago board of trade, or CBOT was established to bring farmers and merchants together. A group of traders got together and created the to arrive contract at proved useful as a device for hedging and speculation on price changes. These were eventually standardized, and in 1925 the first futures clearing house came into existence.
Today, derivative contracts exist on a variety of commodities such as corn, cotton etc. Besides commodities, derivatives contracts also exist on a lot of financial underlying like stocks, exchange rate, interest rate, etc.
Derivatives products today which play an important role in finance world came out as ‘hedging tool’. Volatility in prices of products in cash market has lead to trading in forward or futures markets. Derivatives products include forward, futures and options, swaps etc. The underlying instruments could be financial instruments or commodities. In agricultural dominated country like India trading in commodities is deeply rooted. The price movements in agricultural products have always been a major concern of farmers, manufacturers as well as consumers. Due to development of well organized and more technically advanced market place the Exchanges were evolved where people enter into futures contracts. MCX and NCDEX provide the facility of online trading in commodity futures the same as NSE in case of financial instruments such as shares. Right now options are not available.
The reason behind evolution of commodity futures was hedging against prices movements in commodities such as cotton, sugar, gold, silver, crude oil, etc. Commodity futures play vital role in Price discovery, Liquidity (leverage), and Risk transfer.

This project is carried out to understand the concept and trading of commodity futures and analysis of commodities. In his project commodities taken for analysis are Gold, Silver and Crude oil.
The scope of commodity futures is very wide and so project is carried out on 3 commodities: GOLD, SILVER (BULLION FUTURES) and CRUDE OIL (CRUDE OIL FUTURES) as the volume in these futures are more than other commodities on MCX and NCDEX.
The project work includes:1) Study the evolution of commodity markets in India2) Study the trading system3) Study of commodities (study limited to 3 commodities GOLD, SILVER AND CRUDE
OIL) and commodity analysis for investment purpose4) Finding trading tool for making profit5) Finding investment strategies
The above work is done with help of data collected from ‘PRABODH’ where the project is carried, different web sites (MCX and NCDEX) and material available at ‘PRABODH’.

COMMODITY FUTURES:
Futures markets were designed to solve the problems that exist in forward markets. A futures contract is an agreement between two parties to buy or sell an asset at a certain time in the future at a certain price. But unlike forward contracts, the futures contracts are standardized and exchange traded. To facilitate liquidity in the futures contracts, the exchange specifies certain standard features of the contract. It is standardized contract with standard underlying instrument, a standard quantity and quality of the underlying instrument that can be delivered, and a standard living of such settlement. A futures contract may he offset prior to maturity by entering into an equal and opposite transaction. More than 99% of futures transactions are offset this way.
Definition: “ It is an agreement to buy or sell a specified quantity of commodity in a designated future month at a price agreed upon by the buyer and seller. “
The standardize items in futures contracts are:1) Quantity of the underlying 2) Quality of the underlying3) The date and the month of delivery 4) The units of price quotation and minimum price change 5) Location of settlement
Futures terminology:
1) Spot Price: The price at which an asset trades in the spot market
2) Futures Price: The price at which the futures contract trades in futures market.
3) Contract cycle: The period over which a contract trades. The commodity futures contracts on the NCDEX have one-month, two-months and three months expiry cycles which expire on the 20th day of the delivery month. Thus a Jan expiration contract expires on the 20thjan and a Feb expiration contract ceases trading on the 20th Feb. On the next trading day following the 20th, a new contract having a three-month expiry is introduced for trading.
4) Expiry date: It is the date specified in the futures contract. This is the last day on which the contract will be traded, at the end of which it will cease to exist.
5) Delivery Unit: The amount of asset that has to be delivered under one contract. For instance, the delivery unit for futures on Long Staple Cotton on the NCDEX is 55 bales. The delivery unit of the Gold futures contract is 1 kg.
6) Basis: Basis can be defined as the futures price minus the spot price. There will be a different basis for each delivery month for each contract. In a normal market, basis will be positive. This reflects that futures prices normally exceed spot prices.

7) Cost of Carry: The relationship between futures prices and spot prices can be summarized in terms of what is known as the cost of carry. This measures the storage cost plus the interest that is paid to finance the asset less the income earned on the asset.
8) Initial Margin: The amount that must be deposited in the margin account at the time a futures contract is first entered into is known as initial margin.
9) Marking to market (MTM): In the futures market, at the end of each trading day, the margin account is adjusted to reflect the investors gain or loss depending upon the futures closing price. This is called marking to market.
10) Maintenance Margin: This is somewhat lower than the initial margin. This is set to ensure that the balance in the margin account never becomes negative. If the balance in the margin account falls below the maintenance margin, the investor receives a margin call and is expected to top up the margin account to the initial margin level before trading commences on the next day.
COMMODITY DERIVATIVES:
Derivatives as a tool for managing risk first originated in the commodities markets. They were then found useful as a hedging tool in financial markets as well. In India, trading is commodity futures has been in existence from the 19th century with organized trading in cotton through the establishment of cotton treade4 association in 1875. Over a period of time, other commodities were permitted to be traded in futures exchanges. Regulatory constraints in 1960s resulted in virtual dismantling of the commodities futures markets. It is only in the last decade that commodity future exchanges have been activelyu encouraged. However, the markets have been thin with poor liquidity and have not grown to any significant level.
COMMODITY FUTURES:It is an agreement between two parties to buy or sell the underlying commodity at a future date at today’s future price. Futures contracts differ from forward contracts in the sense that they are standardized and exchange traded.
PRICING OF COMMODITY FUTURES:
The process of arriving at a figure at which a person buys and another sell a futures contract for a specific expiration date is called price discovery. In an active futures market, the process of price discovery continues from the markets opening until its close. The prices are freely and competitively derived. Futures prices are therefore considered to be superior to the administered prices or the prices that are determined privately. Further, the low transaction costs and frequent trading encourages wide participation in futures markets lessening the opportunity for control by a few buyers and sellers.
INVESTMENT ASSETS VERSUS CONSUMPTION ASSET:
While studying futures contracts, it is essential to distinguish between investment assets and consumption assets. An investment asset is an asset that is held for investment purpose by most investors. Stocks and bonds are examples of investment assets. Gold and sliver are also examples of investment assets. Note however that investment assets do no always have to be held exclusively for investment. As we saw earlier, silver, for example have a number of industrial uses. However, to classify as investment assets, these assets do have to satisfy the requirement that they are held by a large number of investors solely for investment. A consumption asset is an asset that is held primarily for consumption. At is not usually held for investment. Examples of consumption assets are commodities such as copper, oil, and pork bellies.
PRICING
Financial Instruments Futures:
There is no cost of carry, but the holding cost is cost of financing (less) Dividend Returns. Therefore the fair value of Future contract can be defined as under: F = Sert
Where, F = Future PriceS = Spot Pricer = Cost of Financing (using continuous compounded interest rate)t = Time till expiratione = 2.71828
Commodities Futures: In commodities you have to carry till it is sold as there is physical delivery. Here the seller so insures ‘holding cost’ which is equal to cost of finance + Storage cost + Insurance. Fair value of Future contract here is defined as under: F = (S + U)ert Where,F = Future PriceS = Spot PriceU = Present Value of Storage r = Cost of Financing (using continuous compounded interest rate) t = Time till expiration e = 2.71828

BASIC PAYOFFS:
PAYOFF FOR COMMODITY FUTURES:Futures contract have linear payoff, just like the payoff of the underlying asset. If the price of the underlying rises, the buyer makes profits. If the price of the underlying falls, the buyer makes losses. The magnitude of profits or losses for a give upward or downward movement is the same. The profits as well as losses for the buyer and the seller for a futures contract are unlimited. These linear payoffs are fascinating as they can be combined with options and the underlying to generate various complex various complex payoffs.
PAYOFF FOR BUYER OF FUTURES: LONG FUTURES:The payoff for a person who buys a futures contract is similar to the payoff for a person who holds an asset. He has a potentially unlimited upside as well as a potentially unlimited downside.
Payoff For A Buyer Of Bold:The figure shows the pro9fits/losses from long position of gold. The investor bought gold at Rs 6000 per 10 grams. If the price of gold rises, he is in profit and if prices of gold fall he is in losses.
+500
0 5500 6000 6500GOLD
-500
Payoff for a Seller of Cotton:
The figure shows the profits/ losses from a short position on cotton. The investopr sold long staple cottonm at Rs. 6500 per Quintal. If the price of cotton falls, he profits. If the price of cotton rises, he looses.
+500

0 6000 6500 7000Long Staple Cotton
-500
Payoff for a Buyer of Gold Futures:
The figure shows the profits/losses for a long futures position. The investor bought futures when gold futures were trading at Rs. 6000 per 10 grams. If the price of the underlying gold goes up, the gold futures price too would go up and his futures position starts making profit. If the price of gold falls, the futures price falls too and his futures position starts making profit. If price of gold falls, the futures price falls too and his futures position starts showing losses.
Profit
0 6000 GOLD future price
Loss
Payoff for seller of futures: Short futures
The payoff for a person who sells a futures contract is similar to the payoff for a person who shorts an sset. He has a potentially unlimited upside as well as a potentially unlimited downside. Take the case of a speculator who sells a two – month cotton futures contract when the contract sells Rs 6500 per quintal. The underlying asset in this is long staple cotton. When the prices of long stale cotton moves down, the cotton futures prices also move down and the short futures position starts making profits. When the prices of long staple cotton move up, the cotton futures price also moves up and the short futures position starts making loses. The following figure shows the pay off diagram for the seller of a futures contract:
The figure shows the profits/ losses for a short futures position. The investor sold cotton futures at Rs 6500 per quintal. If the price of the underlying long staple cotton goes down, the future

price also falls, and the short futures position starts making profit. If the price of underlying long staple cotton rises, the futures too rise, and the short futures position starts showing losses.
Profit
0 6500 Cotton Futures Price
Loss
TRADING IN COMMODITY FUTURES
Futures Trading System:
The trading system on the “exchange” provides a fully automated screen based trading for futures on commodities on a nationwide basis as well as an online monitoring and surveillance mechanism.Here we take NCEDX Platform. It supports an order driven market and provides complete transparency of trading operations.
The NCDEX system supports an order driven market, where orders match automatically. Order matching is essentially on the basis of commodity, its price, time and quantity. All quantity fields are in units and price in rupees. The exchange specifies the unit of trading and the delivery unit for future contracts on various commodities. The exchange notifies the regular lot size and tick size for each of the contracts traded for time to time. When any order enters the trading system, it is an active order. It tires to find a match on the other side of the book. If it finds a match, a trade is generated. It does not find a match; the ordr4 becomes passive and gets queued in the respective outstanding order book in the system. Time stamping is done for each trade and provides the possibility for a complete audit trail if required.
Entities in the Trading System:

There are two entities in the trading system of NCDEX- trading cum clearing members and professional Clearing members:
1) Trading cum clearing members (TCMs):Trading cum clearing members are members of NCDEX. They can trade and clear either on their own account or on behalf of their clients including participants. The exchange assigns an ID to each TCM. Each TCM can have more than on user. The number of user allowed for each trading member is notified by the exchange from time to time.Each user of TCM must be registered with the exchange and is assigned an unique user ID. The unique TCM ID functions as a reference for all orders/trades of different users. This ID is common for all users of a particular TCM. It is the responsibility of the TCM to maintain adequate control over persons having access to the firm’s User IDs.
2) Professional clearing members:
Professional clearing members are members of NSCCL. The PCM membership entitles the members to clear trades executed through Trading cum Clearing Members (TCMs), both for themselves and or on behalf of their clients. They carry out risk management activities and confirmation inquiry of trades through the trading system.
Some important Commodity Futures Contract and their Symbols:Pure Gold Mumbai GLDPURMUMPure Silver New Delhi SLVPURDELSoybean Indore SYBEANIDRRefined Soya Oil Indore SYOREFIDRRapeseed Mustard Seed Jaipur RMSEEDJPRCrude Palm Oil Kandla KRDPOLKDL
Contracts Specification for Commodity Futures:
NCDEX in the first phase under the category of bullion, it has already started trading in gold and silver, and in agri commodities, trading has commenced in cotton (long and medium staple), soybean, soy oil, rape/mustard seed, rape/mustard oil, crude palm oil an RBD palmolein. In the second phase NCDEX plans to offer the following commodities for trading: Rice, wheat, coffee, tea, edible oil products like groundnut, sunflower, castor, base metals, and commodity indices like agri commodity index and metal commodity index.
Commodity Futures Trading Cycle:
NCDEX trades commodity futures contracts having one- month, two- month, three- month expiry cycles. All contracts expire on the 20th of the expiry month. Thus a Jan expiration contract would expire on the 20the of January and a Feb expiry contract would cease trading on 20th Feb. If the 20th of expiry month is a trading holiday, the contract shall expire on previous trading day.

New contracts will be introduced on the trading day following the expiry of the near month contract. The following figure show contract cycle for futures contracts on NCDEX:As can be seen, at any given point of time, three contracts are available for trading a near month a middle month and far month. As the Jan contract expires on the 20th of the month, a new three-month contract starts trading from the following day, once more making available three index futures contracts for trading
JAN FEB MAR APR
JAN 20 contract
FEB 20 contract
MAR 20 contract
APRIL 20 contract
MAY 20 contract
JUN 20 contract
Order Types and Trading Paramaters:
An electronic trading system allows the trading members t enter ordrs with various conditions attached to them as per their requirements. These conditions are broadly divided into the following categories:1) Time Conditions2) Price Conditions3) Others ConditionsSeveral combinations of the above are possible thereby providing enormous flexibility to users. The order types and conditions are summarized below. Of these, the order types available on the NCDEX system are regular lot order, stop loss order, immediate or cancel order, good till day order, good till cancelled order, good till date order and spread order.

1) Time Conditions:
- Good till day order: Aday order, as the name suggests is an order which is valid for the day on which it is entered. Ifr the order is not executed during the day, the system cancels the ordr automatically at the end of the day. Example: A trader wantsto go long on March 1, 2004 in refined palm oil on the commodity exchange. A day order is placed at Rs 340/ 10kg. If the market does not reach this price the order does not get filled even if thje market toucjhes Rs 341 and closes. In other words day order is for a specific price and if thje order does not get filled that day, one hase to place the order again the next day.
- Good till cancelled (GTC): A GTC order remains in the system until the user cancels it. Consequently, it spans terading days, if not traded on the day the order is entered. The maximum number of days an order can remain in the system is notified by the exchange from time to time after which the order is automatically cancelled by the system. Each day counted is a calendar day inclusive of holidays. The days counted are inclusive of the day on which the order is placed and the order is cancelled from the system at the end of the day of the expiry period.
-Good till date (GTD): A GTD allows the user to specify the date till which the order hould remain in the system if not executed. The maximum days allowed by the system are the same as in GTCorder. At the end of this day/ date, the order is cancelled from the system. Each day /date counted are inclusive of the day/date on which the order is placed and the order is cancelled from the system at the end of the day/date of the expiry period.
-Immediate or Cancel (IOC): An IOC order allows the user to buy or sell a contract as soon as the order is released into the system, failing which the order is cancelled from the system. Partial match is possible for the order, and the unmatched portion of the order is cancelled immediately.
- All or None Order:AON is as limit order, which is to be executed in its entirety, or not all. Unlike a fill or kill order, an all or none order is not cancelled if it is not executed as soon as it is represented in the exchange. An all ore none order position can be closed out with another AON order.
- Fill or Kill Order:FOK is a limit order that is placed to be executed immediately and if the order is unable to be filled immediately, it gets cancelled.
2) Price Condition
- Limit Order:An order to buy or sell a stated amount of a commodity at a specified price, or at a better price, if obtainanle at the time of execution. The disadvantage is that the order may not get filled at all if the price for that day does not reach the specified price.

- Stop-Loss:A stop-loss order is an order, placed with the broker, to buy or sell a particular futures contract at the market price if and whern the pice reaches a specified levelk. Futures traders often use sto-p orders in an effort to limit the amount they might lose if the futures price moves agaist their position. Stop orders are not executed until the price reaches the specifies moves agaist their position. Stop orders are not executed until the price reaches the specified point. When the price reaches that point the stop order bv becomes a market order. Most of the time, stop orders are used to exit trade. But, stop orders can be excuted for buying/selling positions too. A buy stop order is initiated when one wants to buy a contract r go long and a sell stop order when one wants to sell or go short. The order gets filled at the suggested stop order price or at a better price. Example: A trader has purchased crude oil futures at Rs 750 per barrel. He wishes to limit his loss to Rs.50 a barrel. Astop order would then be plac3d to sell an offsetting contract if the price falls to Rs 700 per barrel. When the market touchjes this price, stop order gets executed and the terader would exit the market. For the stop-lss sell order, the trigger price has to be reater than the limit price.
3) Other conditions:
-Market price:Market orders are orders for which no pride is specfified at the time the order is entered (i.e. price ius markert price). For such orders, the system determines the price. Only the position to be taken long/short is stated. When this kind of order is placed, it gets executed irrespective of the current market price of thjat particular asset.
- Market on open: The order will be executed on the market open within the oening range. This trade is used to enter a new trade, or exit an open trade.
- MNarket on close: The order will be executed on the market close. The fill price will be within the closing range, which may, in some markets, be sbutstantially different from the settlement price. This trade ios also used to enter a new trade, or exit an open trade.
- Trigger price: Price at which an order gets triggered fro the stop-loss book.
- Limnit price: Price of the orders after triggering from stop-loss book.
- Spread order: A simple spread order involves two positions, one long and one short. They are taken in the same commodity with different months (calendar spread) or in closely related commodities. Prices of the two futures contract therefore tenn to go up and down together, and gains on one side of the spread are offset by losses on the other. The spreaders

goal I sto profit from a change in the difference between the tow futures prices. The trader is virtually unconcerned whether the entire price structure mmoves up or down, juist so long as the futures contract he bought goes up more (or down less) than the futures contract he sold.
- One cnanels the other order: It is called one cancels the other order (0oco). An order placed so as to take advantage of price movement, which consists of both a stop and a limit price. Once one level is reached, one half of the order will be executed (either stop or limit) and the remaining order cancelled (either limit or stop). This typoe or foder would close the position if the market moved to either the stop rate or the limit rate, thereby closing the trade and at the same timem canceling them othner entry order. Example: A trader has a buy position at Rs 14000/ tonne on Soyabean. He wishes to have both stop and limit orders in order ato fill the order in a particular price range. A stop order is placed at Rs 14100/tonne and a limit order at Rs 13900/tonne. If the markdt trades at Rs 13900/tonne, the limnit order gets filled and the stop order is immeditately gets cancelled. The trader exits the market at Rs 13900/ tonne.
PERMITTED LOT SIZE:The permitted trading lot size for the futures contracts on individual commodities is stipulated by the exchange for time to time. The lot size currently applicable on individual commodity contracts is given below:Commodity futures: Lot Size and other parameters
INSTRUMENTTYPE ASSET
ASSET SYMBOL
MARKET LOT
QUANTITYUNIT
PRICEUNIT
DELIVERYLOT
DELIVERYUNIT
FUTCOM GLDPURMUM
100 GM Rs/10GM 1 KG
FUTCOM SLVPURDEL 5 Kg Rs/Kg 30 KGFUTCOM SYBEANIDR 1 MT Rs/
Quintal10 MT
FUTCOM SYOREFIDR 1 MT Rs/10 Kg 10 MTFUTCOM RMSEEDJPR 1 MT Rs/20 Kg 10 MTFUTCOM RMOEXPJPR 1 MT Rs/10 Kg 10 MTFUTCOM RBDPLNKA
K1 MT Rs/10 Kg 10 MT
FUTCOM CRDPOLKDL
1 MT Rs/10 Kg 10 MT
FUTCOM COTJ34BTD 11 BALES Rs/Quintal
55 BALES
FUTCOM COTS06ABD 11 BALES Rs/Quintal
55 BALES
TICK SIZE FOR CONTRACT:
The tick size is the smallest price change that can occur for the trades on the exchange. The tick size in respect of all futures contracts admitted to dealings on the NCDEX is 5 paise.

QUANTITY FREEZE:
All orders placed by members have to be within the quantity specified by the exchange is this regard. Any order exceeding this specified quantity will not be executed but will lie pending with the exchange as a quantity freeze. The following table gives the quantity freeze for each commodity contract. In respect of orders which have come under quantity freeze, the member is required to confirm to the exchange that there is no inadvertent error in the order entry and that the order is genuine. On such confirmation, the exchange can approve such order. However, in exceptional cases, the exchange may, at its discretion, not allow the orders that have come under quantity freeze for execution for any reason whatsoever including non-availability of exposure limits
INSTRUMENT TYPE ASSET
ASSETSYMBOL
QUANTITYFREEZE UNIT
FUTCOM GLDPURMUM 30000 Grams (gm)FUTCOM SLVPURDEL 1500 kilograms (Kgs)FUTCOM SYBEANIDR 300 Metric Tonnes (MT)FUTCOM SYOREFIDR 300 Metric Tonnes (MT)FUTCOM RMSEEDJPR 300 Metric Tonnes (MT)FUTCOM RMOEXPJPR 300 Metric Tonnes (MT)FUTCOM RBDPLNKAK 300 Metric Tonnes (MT)FUTCOM CRDPOLKDL 300 Metric Tonnes (MT)FUTCOM COTJ34BTD 3300 BalesFUTCOM COTS06ABD 3300 Bales
BASE PRICE:
On introduction of new contracts, the base price is the prvious day’s closing price of thje underlying commodity in the prevailing spot markets. These spot prices are polled across multiple centers and a single spot price is determined by the bootstrapping method. The base price of the contractrs on all subsequent trading days is the dai9ly settlement price of the futures contracts on the previous trading day.
PRICE RANGES OF CONTRACTS:
In order to prevent erroneous order entry by trading members, operating price ranges on the NCDEXZ are dept at =/- 10% from the base price. Orders exceeding the range specified are not executed and lie pending with the exchange as a price freeze. In respect of orders which have come under price freeze, the members are required to confirm to the exchange that there is no inadvertent error in the order entry and that the order is genuine. The exchange can approve or disapprove such orders solely at its own discretion. Unless specifically notified by the exchange, there will be no price ranges applicable I the last half hour of normal market trading.

ORDER ENTRY ON THE TRADING SYSTEM:
The NCDEX trading system has a set of function keys built into the trading front-end. These keys have been provided to facilitate faster operation of the system and enable quicker trading on the system. The function keys can be operated from the keyboard of the user. The set of function keys enable the following:
- Buy open- Sell open - Order cancellation- Order modification - Exercise/Position liquidation - Outstanding orders- Quick order cancel - Spread order entry- Trade modify- trade Cancel- Client master maintenance- Market by order- Market by price- Activity log- Security list/ portfolio steup- portfolio offline order entry - spread market by price- previous trades- contract description- alphabetical sorting of contracts- spread order status- spread activity log- Snap quote- online offline order entry- message log - market movement - full message display- market inquiry- spread outstanding orders- net position upload- order status- liquidity schedule- buy close - sell close
MARGINS FOR TRADING IN FUTURES:

Margin is the deposit money that needs to be paid to buy or sell each contract. The margin required for a futures contract is better described as performance bond or good faith money. The margin levels are set by the exchanges based on volatility (market conditions) and can be changed at any time. The margin requirements for most futures contracts range fr0om 2% to 15% of the value of the contract.In the futures market, there are different types of margins that a trader has to maintain/. We will discuss them in more details when we talk about risk management in the next chapter. At this stage we look at the types of margins as they apply on most futures exchanges.
- Initial margin- Maintenance margin- Additional margin- Mark-to-market margin
Just as a trader is required to maintain a margin account with a broker, a clearing house member is required to maintain a margin account with the clearing house. This is known as clearing margin. In the case of clearing house member, there is only an original margin and no maintenance margin. Clearing house and clearing house margins have been discussed further in detail under the chapter on clearing and settlement.
CHANGERS:Members are liable to pay transaction charges for the trade done through the exchange during rthe previous month. The important provisions are listed below: The billing for athe all trades done during the previous month will be raised in the succeeding month.
- Rate of Charges- Due date- collection process- Registration with BJPL and their services- Adjustment against advances transaction charges- penalty for delayed payments
Finally futures market is zero sum game i.e., the total number of long in any contract always equals the total number of short in any contract. The total number of outstanding contracts (long/short) at any point in time is called the Open interest”. This Open interest figure is a good indicator of the liquidity in every contract. Based on studies carried out in international exchanges, it is found that open interest is maximum in near month expiry contracts.
CLEARING AND SETTLEMENT

Most futures contracts do not lead to the actual physical delivery of the underlying asset. The settlement is done by closing out open positions, physical delivery or cash settlement. All these settlement functions are takes care of by and entity called clearing house or clearing corporation.
CLEARING:Clearing if the trades that take place on an exchange happens through the exchange clearing house. A clearing house is a system by which exchanges grantee the faithful compliance of all trade commitments undertaken on the trading floor or electronically over the electronic trading systems. The main task of the clearing house is to keep track to all the transactions that take place during a day so that the net positions of each of its members can be calculated. It guarantees the performance of the parties to each transaction. Typically it is responsible for the following;1) Effecting timely settlement.2) Trade registration and follow up. 3) Control of the evolution of open interest4) Financial clearing of the payment flow.5) Physical settlement (by delivery) or financial settlement (by price difference) of contracts. 6) Administration of financial guarantees demanded by the participants.
The clearing house has a number of members, who are mostly financial institutions responsible for the clearing and settlement of commodities traded on the exchange. The margin accounts for the clearing house members are adjusted of r gains and losses at the end of each day (in the same way as the individual traders keep margin accounts with the broker) The brokers who are not clearing members need to maintain a margin account with the clearing house member through who they trade in the clearing house.
CLEARING MECHANISM:
Only clearing members including professional clearing members (PCMs) are entitled t clear and settle contracts through the clearing house.The clearing mechanism essentially involves working out open positions and obligations of clearing members. This position is considered for exposure and daily margin purposes. Open positions of PCMs are arrived at by aggregating the open positions of all the TCMs clearing through him, in which they have traded. A TCMs open position is arrived at by the summation of this clients’ open positions, in the contracts in which they have traded. Client positions are netted at the level of individual client and grossed across all clients, at the member level without any set-offs between clients. Proprietary positions are netted at member level without any set=-offs between client and proprietary positions.
CLEARING BANKS:
Every clearing member is required to maintain and operate a clearing account with any one of the designated clearing bank branches. The clearing account is to be user exclusively for clearing operations ie., for settling funds and together obligations to “Exchange” including payments of margins and penal charges. A clearing member can deposit funds into this account, but can withdraw funds from this account only is his self-name. A clearing member having funds

obligation to pay is required to have clear balance is his clearing account on or before the stipulated pay-in day and the stipulated time. Clearing members must authorize their clearing bank to access their clearing account for debiting and crediting their accounts as per the instructions of “exchange”, reporting of balances and other operations as may be required by “exchange” for time to time. The following banks have been designated as clearing banks- ICICI Bank Limited, Canara Bank, UTI Bank Limited and HDFC Bank Limited.
DEPOSITORY PARTICIPANTS:
Every clearing member is reuired to maintain and operate a CM pool account with any of the empanelled depository participants. The CM pool account is to be used exclusively for clearing operations i.e., for effecting and receiving deliveries from “exchange”.
SETTLEMENT:
Futures contracts have two types of settlements, the MTM settleiment which happens on a continuous basis at the end of each day, and the final settlement which happens on the last trading day of the futures contract. On the “exchange” daily MTM settlement fand final MTM settlement in respect of admitted deals in futurex contracts are cash settle dby debiting/creditring athe clearing accounts of CCMs, with the respectigve clearing bank. All positions of a CM, either brought forward, created during the day or closed out during the day are market to market at the daily settlement price or the final settlement price a the close of trading hours on a day.
- Daily mark to market settlement Daily mark to market settlement is done till the date of the contract expiry. This is done to take care of daily \price fluctuations of all traders. All the open positions of the members are marked to market at the end of the day and the profit/loss is determined as below:
1) On the day of entering into the contract, it is the difference between the entry vale and daily settlement price for that day.2) On any intervening days. When the member holds an open position, it is the difference between the daily settlement price for that day and the previous day’s settlement price.
3) On the expiry date if the member has an open position, it is the difference between the final settlement price and the previous day’s settlement price.
- Final Settlement:On the date of expiry, the final settlement price is the spot price on the expiry day. The spot prices are collected from members across the country through polling. The polled bid/ ask prices are bootstrapped and the mid of the two bootstrapped prices is taken as the final settlement price. The responsibility of settlement is on a trading cum blearing member for all trades doing on his own account and his client’s trades. A professional clearing member is responsible for settling all the participants’ trades which he has confirmed to the exchange.

Non fulfillment of either the whole or part of the settlement obligations is treated as a violation of the rules, bye laws and regulations of “exchange” and attracts penal charges as stipulated by “exchange” from time to time.
REGULATORY FRAMEWORK:
At present, there are three tiers of regulations of forward/futures trading system in India, namely, government of India, Forward Markets Commission (FMC) and commodity exchanges. The need for regulation arises on account of the fact that the benefits of futures markets accrue in competitive conditions. Proper regulation is needed to create competitive conditions.
RULES:
It prescribes the following regulatory measures:1) Limit on net open position a son the close of the trading hours. Some times limit is also impoised on intra-day net open position. The limit is imposed operator-wise, and in some cases, also member wise.2) Circuit filter or limit on price fluctuations to allow cooling of market in the event of abrupt upswing or downswing in prices. 3) Special margin deposit to be collected on outstanding purchases or sales when price moves up or down sharply above or below the previous day closing price. By making further purchases/sales relatively costly, the price rise of fall is sobered down. This measure is imposed only or the request of the exchange.4) Circuit breakers or minimum/maximum prices: These are prescribed to prevent futures prices from falling below ass rising above not warranted by respective supply and demand factors. This measure is also imposed on the request of the exchanges.5) Skipping trading in cer5tain derivatives of the contract, closing the market for a specified period and even closing out the contract: These extreme measures are taken only in emergency situations.
RULES GOVERNING INVESTOR GRIEVANCES, ARBITRATION:
In matters where the exchange is a partly to the dispute, the civil courts at Mumbai have exclusive jurisdiction and in all other matters, proper courts within the area covered under the respective regional arbitration center have jurisdiction in respect of the arbitration proceeding s falling/conducted in that regional arbitration center.If the value of claim, difference or dispute is more than Rs. 25Larks on the date of application, the such claim, difference or dispute is up to Rs.25 Lakh, the they are to be referred to a sole arbitrator. Where any claim, difference or dispute arises between agent of the member and client of the agent of the member, in such claim, difference or dispute, the member, to who such agent of the member is affiliated, is impeded as a party. In case the warehouse refuses or fails to communicate to the constituent the transfer of commodities, the date dispute is deemed to have arisen oTHE COMMODITY EXCHANGE PLATFORM:THE NCDEX PLATFORM:

National Commodity and Derivatives Exchange Ltd (NCDEX) is a technology driven commodity exchange. It is public limited company registered under the Companies Act, 1956 with the Registrar of Companies, Maharashtra in Mumbai on April 23, 2003. NCDEX is regulated by Forward Markets Commission is respect of futures trading in commodities. NCDEX currently facilitates trading of 10 commodities.
PROMOTERS:NCDEXis promoted by a consortium of institutions. These include the ICICI Bank Limited (ICICI Bank). LIC, NABARD, and NSE
GOVERNANCE:NCDEX is run by an independent Board of Directors. Promoters do not participate in the day today activities of the exchange. The Directors are appointed in accordance with the provisions of the Articles of Association of the company.
The NCDEX System: How transaction happen on the NCDEX’s market:
TRADING:The Trading system on the NCDEX provides a fully automated Screen-based trading for futures open commodities on a nationwide basis as well as an online monitoring and surveillance mechanism. It supports an order driven market and provides complete transparency of trading operations.
The NCDEX system supports am order driven market, where orders match automatically. Order matching is essentially on the bases of commodity, its price, time and quantity. All quantity fields are in units and price in rupees. The exchange specifies the unit of trading and the delivery unit for futures contracts on various commodities. The exchange notifies the regular lot size and tick size for each of the contracts traded from time to time. When any order enters the trading system, it is an active order. It tries to find a match on the other side of the tool. It finds a match, a trade is generated. If it does not find a match, the order becomes passive and gets queued in the respective outstanding order book in the system.
CLEARING:National Securities Clearing Corporation Limited (NSCCL) undertakes clearing of trades executed on the NNCDWEX. The settlement guarantee fund is maintained and managed by NCCDEX. Only clearing members including professional clearing members (PCMs) only are entitled to clear an dsettle contracts through the clearing house. At NCDEX after the trading hours on the expiry date, based on the available information, the matching for deliveries takes place firstly on the basis of locations and then randomly, keeping in view the factors such as available capacity of the value/ warehouse, commodities already deposited and dematerialized and offered for delivery etc. Matching done by this process is binding on the clearing members. After completion matching process, clearing members are informed of the deliverable/receivable posi9tions and the unmatched positions. Unmatched positions have to be settled in cash. The

cash settlement is only for the incremental gain/loss as determined on the basis of final settlement price.
SETTLEMENT:Futures contracts have two types of settlements, the MTM settlement which happens on a continuous basis at the end of each day, and the final settlement which happens on the last trading day of the futures contract. On the NCDEX, daily MTM settlement and final MTM settlement is respect of admitted deals in futures contracts are cash settle by debiting/ crediting the clearing accounts of CMs with the respective clearing bank. All p9ositions of a CM, either brought forward, created during the day or closed out during the day, are market to market at the daily settlement price or the final settlement price at the close of trading hours on a day.On the date of expiry the final settlement price is the spot price on the expiry day. The responsibility of settlement is on a trading cum clearing member for all trades done on his own account and his client’s trades. A professional clearing member is responsible for settling all the participants trades which he has confirmed to the exchange. On the expiry date of a futures contract, members submit delivery information through delivery request window on the trader workstations provided by NCDEX for all open positions for a commodity for all constituents individually. NCDEX on receipt of such information matches the information and arrives at a delivery position for a member for a commodity.The seller intending to make delivery takes the commodities to the designated warehouse. These commodities have to be assayed by the exchange specified assayer. The commodities have to meet the contract specifications with allowed variances. If the commodities meet the specifications, the warehouse accepts them. Warehouse then ensures that the receipts get updated in the depository system giving a credit in the depositor’s electronic account. The seller the gives the invoice to his clearing member, who would courier the same to the buyer’s clearing member. On an appointed date, the buyer goes to the warehouse and takes physical possession of the commodities.

COMMODITY ANALYSIS:
1) GOLD:
1. Introduction
Gold is a unique asset based on few basic characteristics. First, it is primarily a monetary asset,and partly a commodity. As much as two thirds of gold’s total accumulated holdings relate to“store of value” considerations. Holdings in this category include the central bank reserves,private investments, and high-caratage jewelry bought primarily in developing countries as avehicle for savings. Thus, gold is primarily a monetary asset. Less than one third of gold’s totalaccumulated holdings can be considered a commodity, the jewelry bought in Western markets foradornment, and gold used in industry.
The distinction between gold and commodities is important. Gold has maintained its value inafter-inflation terms over the long run, while commodities have declined.
Some analysts like to think of gold as a “currency without a country’. It is an internationallyrecognized asset that is not dependent upon any government’s promise to pay. This is animportant feature when comparing gold to conventional diversifiers like T-bills or bonds, whichunlike gold, do have counter-party risk.
2. What makes Gold Special?

Timeless and Very Timely Investment: For thousands of years, gold has been prized for itsrarity, its beauty, and above all, for its unique characteristics as a store of value. Nations mayrise and fall, currencies come and go, but gold endures. In today’s uncertain climate, manyinvestors turn to gold because it is an important and secure asset that can be tapped at anytime, under virtually any circumstances. But there is another side to gold that is equallyimportant, and that is its day-to-day performance as a stabilizing influence for investmentportfolios. These advantages are currently attracting considerable attention from financialprofessionals and sophisticated investors worldwide.
Gold is an effective diversifier: Diversification helps protect your portfolio againstfluctuations in the value of any one-asset class. Gold is an ideal diversifier, because theeconomic forces that determine the price of gold are different from, and in many casesopposed to, the forces that influence most financial assets.
Gold is the ideal gift: In many cultures, gold serves as a family treasure or a wealth transfervehicle that is passed on from generation to generation. Gold bullion coins make excellentgifts for birthdays, graduations, weddings, holidays and other occasions. They areappreciated as much for their intrinsic value as for their mystical appeal and beauty. Andbecause gold is available in a wide range of sizes and denominations, you don’t need to bewealthy to give the gift of gold.
Gold is highly liquid: Gold can be readily bought or sold 24 hours a day, in largedenominations and at narrow spreads. This cannot be said of most other investments,including stocks of the world’s largest corporations. Gold is also more liquid than manyalternative assets such as venture capital, real estate, and timberland. Gold proved to be themost effective means of raising cash during the 1987 stock market crash, and again duringthe 1997/98 Asian debt crisis. So holding a portion of your portfolio in gold can be invaluablein moments when cash is essential, whether for margin calls or other needs.
Gold responds when you need it most: Recent independent studies have revealed thattraditional diversifiers often fall during times of market stress or instability. On theseoccasions, most asset classes (including traditional diversifiers such as bonds and alternativeassets) all move together in the same direction. There is no “cushioning” effect of adiversified portfolio — leaving investors disappointed. However, a small allocation of gold hasbeen proven to significantly improve the consistency of portfolio performance, during bothstable and unstable financial periods. Greater consistency of performance leads to adesirable outcome — an investor whose expectations are met.
3. What makes Gold different from other commodities?
The flow demand of commodities is driven primarily by exogenous variables that are subject tothe business cycle, such as GDP or absorption. Consequently, one would expect that a suddenunanticipated increase in the demand for a given commodity that is not met by an immediateincrease in supply should, all else being equal, drive the price of the commodity upwards.However, it is our contention that, in the case of gold, buffer stocks can be supplied with perfect

elasticity. If this argument holds true, no such upward price pressure will be observed in the goldmarket in the presence of a positive demand shock.
The existence of a sophisticated liquid market in gold has, over the past 15 years, provided amechanism for gold held by central banks and other major institutions to come back to themarket. Although the demand for gold as an industrial input or as a final product (jewellery) differsacross regions, it is argued that the core driver of the real price of gold is stock equilibrium ratherthan flow equilibrium. This is not to say that exogenous shifts in flow demand will have noinfluence at all on the price of gold, but rather that the large supply of inventory is likely todampen any resultant spikes in price. The extent of this dampening effect depends on thegestation lag within which liquid inventories can be converted in industrial inputs. In the goldindustry such time lags are typically very short.
Gold has three crucial attributes that, combined, set it apart from other commodities: firstly,assayed gold is homogeneous; secondly, gold is indestructible and fungible; and thirdly, theinventory of aboveground stocks is astronomically large relative to changes in flow demand. Oneconsequence of these attributes is a dramatic reduction in gestation lags, given low search costsand the well-developed leasing market. One would expect that the time required to convert bullioninto producer inventory is short, relative to other commodities which may be less liquid and lesshomogenous than gold and may require longer time scales to extract and be converted intousable producer inventory, making them more vulnerable to cyclical price volatility. Of course,because of the variability of demand, the price responsiveness of each commodity will depend inpart on precautionary inventory holdings.
There is low to negative correlation between returns on gold and those on stock markets,whereas it is well known that stock and bond market returns are highly correlated with GDP. Thisis because, generally speaking, GDP is a leading indicator of productivity: during a boom,dividends can be expected to rise. On the other hand, the increased demand for credit, countercyclical monetary policy and higher expected inflation that characterize booms typically depress bond prices.
The fundamental differences between gold and other financial assets and commodities give riseto the following “hard line” hypothesis: the impact of cyclical demand using as proxies GDP,inflation, nominal and real interest rates, and the term structure of interest rates on returns ongold, is negligible, in contrast to the impact of cyclical demand on other commodities and financialassets.
Using the gold price and US macroeconomic and financial market quarterly data from January1975 to December 2001, the following conclusions may be drawn:
There is no statistically significant correlation between returns on gold and changes inmacroeconomic variables, such as GDP, inflation and interest rates; whereas returns on

other financial assets, such as the Dow Jones Industrial Average, Standard & Poor’s 500index and 10-year government bonds, are highly correlated with changes inmacroeconomic variables.
Macroeconomic variables have a much stronger impact on other commodities (such asaluminum, oil and zinc) than they do on gold.
Returns on gold are less correlated with equity and bond indices than are returns onother commodities.
Assets that are not correlated with mainstream financial assets are valuable when it comes tomanaging portfolio risk. This research establishes a theoretical underpinning for the absence of arelationship that has been demonstrated empirically for a number of years; namely, that betweenreturns on gold and those on other financial assets.
4. International Scenario:
World SupplyAccording to Gold Field Mineral Services, world gold output in 2001 was 2,604 tons, moderatelyhigher than 2,584 ton in 2000. By comparison, it was only 1,311 tons, including estimatedcommunist output, in 1980. Effectively it has doubled. Western world output, excluding the oldcommunist block, increased even faster, from 959 tons in 1980 to 2,112 tons in 2001. Totalproduction throughout history topped 142,500 metric tons by the end of 2001.

Graph 1:
Graph 2:
South Africa is the world's largest gold producer, with 393.7 tons in 2001, according to the

Chamber of Mines. From 1884 through 2001 it has produced nearly 49,000 tons, which is around35% of all gold ever mined. No challenger is in sight – or likely to be in the foreseeable future.
The United States is the second-largest gold-producing nation in the world. Most of this gold isproduced in western states such as Nevada, which produces more gold than any other state.Australia is the world's third largest producer of gold with output of 285.0 tons in 2001 a decline of4% from 296.4 tons in 2000. Western Australia alone provides almost 70% of the production.Gold Fields Mineral Services Ltd estimate the above-ground stocks of gold to have been some145,200 tons at the end of 2001, a figure that dwarfs annual new mined supply of around 2,600tons. Much of this is held in a form that can readily come back to the market under the rightconditions. This is obviously true for investment forms of gold but it is also true for much jewelleryin Asia and the Middle East. In these regions jewellery traditionally fulfills a dual role, both as ameans of adornment and as a means of savings. Notably, it is particularly important for women inMuslim and Hindu cultures where traditionally a woman’s jewellery was often in practice her onlyfinancial asset. Such jewellery is of high caratage (21 or 22 carats), and is traded by weight andsold at the current gold price plus a moderate mark-up to allow for dealing and making costs. It isalso fairly common for jewellery to be bought or part-bought by the trading in of another piece ofequivalent weight; the traded-in piece will either be resold by the jeweller or melted down tocreate a new piece.
In Asia and the Middle East both gold investments and gold jewellery are considered as financialor semi-financial assets. It is not known how much of the total stocks of gold lie in these regionsbut in recent years they have accounted for approximately 60% of total demand; while the long held cultural affinity to gold would suggest that the majority of stocks in private hands lie in thisarea. Consumers are very aware of price movements and very sensitive to them. Gold will besold in times of financial need but holders will frequently take profits and sell gold back to themarket if the price rises. Thus the supply of scrap gold will normally automatically rise if the goldprice rises. Even gold used for industrial purposes such as electrical contacts in electronicequipment is frequently recovered as scrap and a rise in the gold price will increase the incentivefor such recovery.

World Gold Fabrication and ConsumptionFabrication statistics measure the amount of gold used in various countries to manufacture endproducts. Consumption figures measure where these gold products were consumed.

World Markets
Today's gold market is a round-the-world, round-the-clock business, played out largely ondealers' trading screens. The core of the business, however, remains in the key markets ofLondon, as the great clearing house, New York as the home of futures trading, Zurich as aphysical turntable, Istanbul, Dubai, Singapore and Hong Kong as doorways to importantconsuming regions and Tokyo where the Commodity Exchange (TOCOM) sets the mood ofJapan. Even Paris still has a small market, a reminder of the days when the French were greathoarders, while Mumbai has increasing importance under India's liberalised gold regime thatpermits official imports through local markets.

5. Domestic Scenario:
India is the world's largest consumer of gold. According to Gold Field Minerals Service, in 2001 itabsorbed around 700 tons from the world market, compared to just 320 tons in 1994; that iswithout taking into account the recycling of scrap from the immense stock of close to 10,000 tonsbuilt up on the sub-continent in the last few hundred years, or gold imported for jewellerymanufacture and re-export.
Background
An historical perspective is useful in understanding why India has been for so long, and still is, agreat market for gold – and also for silver. India, the saying goes, has always been 'a sink forprecious metals'. Both metals are closely woven into the social fabric, especially in the rural areaswhere they are the basic form of saving. Ever since Roman times the 'east' has been a source of silk and spices, and later diamonds, tea and cotton, sought by Mediterranean and European merchants. The first gold ducats struck by the mint in Venice in 1285, which became a staple form of international payment for over three hundred years, went to the Levant and on to India. The gold and silver from the Americas, after Columbus discoveries, mostly just passed through Spain on its way to the east. In the 17th century the Dutch and English East India companies sent

gold and silver to India and Java to pay for goods. The English East India Company shipped 20 tons, almost three years' world output then, to India between 1660 and 1690. Mocatta, the oldest member of the London gold market, first sent gold to India in 1676 to pay for diamonds, the beginning of a long relationship between London and Bombay (now Mumbai) merchants. During the American Civil War in the 1860s India imported almost 420 tons in payment for cotton exports because of disrupted American cotton crops.
Only once has India been a significant dishoarder, when 1,244 tons was shipped out in the 1930sdue to distress selling from famine and the new high price for gold (up from $20.67 to $35).In recent times India has remained faithful to gold. While demand has increased substantiallysince the early 1980s due to general economic growth, annual consumption is dictated both bythe monsoon, with its effect on the harvest, and the marriage season. In an auspicious year thereare upwards of ten million marriages, at which between 20 and 200 grams may be worn by thebride. The status of a family in its community is still often judged by the gold exchanged as thebride's dowry.
The official import of gold into India, however, was banned from 1947. The Gold Control Act of1962 also forbade private holding of gold bars. With local production of less than two tons fromtwo small mines, Bharat and Hutti, together with recycling, the main demand was met bysmuggling from the regional markets of Dubai, Singapore, and Hong Kong, usually as ten tolabars, uniquely preferred in India. The smuggling was a highly professional business, involving upto 200 tons, encouraged by a premium of 30 per cent over the London price. Over 3,000 tons hasentered India unofficially since 1947.
Until 1990, the Gold Control Act forbade the private holding of gold bars in India. There wasphysical investment in smuggled ten tola bars, but it was limited and often amounted to keeping afew bars ready to be made into jewellery for a family wedding. Gold investment essentially was in22 carat jewellery.
In the 1990s, however, deregulation of the market has finally taken place, ushering in the modernmarket of today. Since 1990, investment in small bars, both imported ten tolas and locally-madesmall bars, which have proliferated from local refineries, has increased substantially. GFMSestimate that investment has exceeded 100 tons in some years, although it is hard to segregatetrue investment from stocks held by the 16,000 or more gold dealers spread across India.Certainly gold has been used to conceal wealth, especially during the mid-1990s, when the localrupee price increased steadily. It was also augmented in 1998 when over 40 tons of gold frombonds originally issued by the Reserve Bank of India were restituted to the public.
Graph 5:
India and Global Gold Economy
Estimates vary, but it is believed that at least 13,000 tons of gold rest in India – or approximatelynine per cent of the world’s cumulative mine production. This should be viewed against our sharein land area at 2.4 per cent, in population at 16.4 per cent and in GDP at 1.2 per cent.Mining and production of gold in India is negligible, now placed around 2 tons as against a totalworld production of about 2,272 tons in 1995.
During 1990-95, India’s share in global gold demand is placed at about 402 tons (16.4 per cent) ayear, including imports into India. This should be viewed against its share of 0.6 per cent in worldtrade. On the other hand, India exported about 23 tons in 1995 accounting for a negligible part ofworld trade.
The world gold trading is concentrated in the U.K., Switzerland, Dubai, Hong Kong, etc. and Indiadoes not figure among them.
Facilities for refining, assaying, making them into standard bars in India, as compared to the restof the world, are insignificant, both qualitatively and quantitatively.Of the total gold reserves estimated to be on the books of the Central Banks (subject to someBanks not declaring them) of 28,225.4 tons, the holdings of Reserve Bank of India are only amodest 397.5 tons. Government of India has in its possession some amount of gold mainly out ofconfiscation of smuggled gold remaining after transferring it to the Reserve Bank of India fromtime to time. RBI is neither a speaking purchaser nor a seller of gold reserves, unlike many other

countries including some developing economies, especially in Asia. A part of gold was used byRBI (in parallel with gold with Government) for raising foreign currency resources during thebalance of payments crisis in the early 'nineties. These overseas gold holdings are being used aspart of reserve management to yield a return.
Use of gold as a financial product is virtually non-existent in India except to a limited extent ofissuing ‘Gold Bonds’ by Government of India from time to time coupled with occasional taxamnesty. Commercial banks, however, accept gold as security, but no advances are permitted forpurchase of gold by their customers for non-productive use.
Gold as Investment Vehicle
Gold is valued in India as a savings and investment vehicle and is the second preferredinvestment behind bank deposits. India is the world’s largest consumer of gold in jewellery (muchof which is purchased as investment).The hoarding tendency is well ingrained in Indian society, not least because inheritance laws inthe middle of the twentieth century lent a great desirability to anonymity. Indian people arerenowned for saving for the future and the financial savings ratio is strong, with a ratio of financialassets-to-GDP of 93%.
Gold’s circulates within the system and roughly 30% of gold jewellery fabrication is from recycledpieces. India is typically also the largest purchaser of coins and bars for investment (>80tpa),although last year it had to concede first place to Japan in the wake of the heavy buying in thefirst quarter due to fears for the stability of the Japanese banking system.In 1998-2001 inclusive, annual Indian demand for gold in jewellery exceeded 600 tons; in 2002,however, due to rising and volatile prices and a poor monsoon season, this dropped back to 490tons, and coin and bar demand dropped to 67 tons. Indian jewellery offtake is sensitive to priceincreases and even more so to volatility, although this decline in tonnage since 1998 is also duein part to increasing competition from white and brown goods and alternative investment vehicles,but is also a reflection of the increase in price. The Indian bride’s “Streedhan”, the wealth shetakes with her when she marries and which remains hers, is still gold, however (thus giving goldan important role in the “empowerment” of women in India).
Local expenditure, in terms of the value of the gold content purchased, peaked at Rs 302 billion(Rs 311 per capita) in 1998, when total Indian demand was almost 775 tons, and since then hasdropped to Rs 279 Bn in 2002 (Rs 284 per capita), a decline of almost 9%. This peak in 1998came in the wake of the main liberalisation step, which was the freeing of imports in November1997.
Typically, India accounts for 20% of global gold offtake in any one year. Its GDP (as measured bythe World Bank) in 2001 was 1.5% of the world’s total, ranking twelfth – although if this is

measured on Purchasing Power Parity, then India ranks fourth with 6.4% of the world total. Whilechanges in total demand per capita, in terms both of tonnage and expenditure show how Indianjewellery demand in 2002 compared with the rest of the world in terms of offtake per capita andagainst GDP. Offtake per capita is still very low, reflecting the widespread distribution of the ruralpopulation and the social infrastructure of the country (the rural population accounts forapproximately 70% of national gold demand), but offtake in terms of GDP is high. At just over onegramme of demand per thousand dollars of GDP, India stands third in the world, behind only theUAE (just over two grammes) and Bahrain (almost 1.5g) – although these two are both enhancedby tourist purchases.
It was not always thus. As recently as 1991, Indian gold demand was a little over 230 tons, oronly 8% of world offtake. The deregulation of the market during the 1990s brought about adramatic change. Jewellery demand increased from 208 tons in 1991 to peak at 658 tons in 1998,while demand for investment bars grew from ten tons in 1991 to 116 tons in 1998, and registered85 tons in 2002. These figures reflect average growth rates of 16% and 30% per annumrespectively between 1991 and 1998. While both have eased since 1998, there is still afascination in India for gold and there is significant scope for the development of further demandin the country. In the cities, however, gold is having to compete with the stock market, investment in internet industries, and a wide range of consumer goods. In the rural areas 22 carat jewellery remains the basic investment.
The World Gold Council, which was involved in the deregulation of the market in the 1990s,continues to work closely with Indian gold market stakeholders to foster increased demand, partlythrough the development of new gold instruments that can be bought through banks, as anadditional set of distribution channels, although the rural community does still tend to prefer touse jewelers.
Jewellery
India is the world's foremost gold jewellery fabricator and consumer with fabricator andconsumption annually of over 600 tons according to GFMS. Measures of consumption andfabrication are made more difficult because Indian jewellery often involves the re-making bygoldsmiths of old family ornaments into lighter or fashionable designs and the amount of goldthus recycled is impossible to gauge. Estimates for this recycled jewellery vary between 80 tonsand 300 tons a year. GFMS estimates are that official gold bullion imports in 2001 were 654 tons.

Graph 6:
Exports have increased dramatically since 1996, and in 2001 stood at over 60 tons. The USaccounted for about one third of total official exports. Manufacturers located in Special ExportZones can import gold tax-free through various registered banks under an Export Replenishmentscheme.
Recent Developments in India
World Gold Council (WGC) has estimated that the annual Indian demand for the precious metalin recent years has been in excess of 800 tons. Most of it appears to be meant for jewelleryfabrication, and the rest, estimated at 10 to 15 percent, is possibly meant to meet demand onaccount of investment and industrial processes. A major step in the development of gold marketsin India was the authorization in July 1997 by the RBI to commercial banks to import gold for saleor loan to jewellers and exporters. Initially, 7 banks were selected for this purpose on the basis ofcertain specified criteria like minimum capital adequacy, profitability, risk management expertise,previous experience in this area, etc. The number of banks later went upto 18. On a review,since five banks had not evinced adequate interest in this business in terms of activity, the RBIdid not find it appropriate to renew their licences for this purpose. At present, 13 banks are activein the import of gold. The quantum of gold imported through these banks has been in the rangeof 500 tons per year.
Import of gold by banks authorised by the RBI has succeeded to a large extent in curbing illegaloperations in gold and in foreign exchange markets. It has also resulted in reducing the disparitybetween international and domestic prices of gold from 57 per cent during 1986 to 1991 to 8.5 percent in 2001.
The import duty on gold, which was Rs.220 per ten grams upto January 1999, was increased toRs.400 per ten grams, and with effect from April 2001 has been reduced to Rs.250 per tengrams. The estimates of duty realised from gold imports indicate an annual amount varying fromabout Rs. 1,000 to Rs. 2,000 crore per annum since 1997.

Even though the country consumes more than 800 tons of the metal every year, the system ofassaying and hallmarking has not gained the desired importance. The low quality of goldjewellery being sold in the country and the resultant losses being incurred by the consumers arebeing recognized now. Recent surveys conducted by the Bureau of Indian Standards (BIS) jointlywith Central Consumer Protection Council in 5 major cities reveal that more than 80 per cent ofthe jewellery being sold in the market was of lower purity than claimed and charged for. In somecases, the gold articles sold were 38.6 per cent short in purity in monetary terms. The low purityresults in a loss of around 16 per cent to gold jewellery.
In the recent past, RBI has been actively pursuing the issue of upgrading the quality of trade andproducts through a system of assaying and hallmarking with Government of India and BIS. Themajor objectives of introducing a proper assaying and hallmarking system in the country areenabling consumer protection, developing export competitiveness of the gold jewellery industry,introducing gold based financial products, which will help in mopping up the vast dormant goldresources with the domestic sector and developing India into a leading gold market centre in theworld.
The Government of India announced the Gold Deposit Scheme in 1999 and RBI issuedguidelines to the banks intending to launch the scheme in October 1999. Five banks havelaunched their schemes under the guidelines and the quantum of gold mobilised so far has beenabout 7 tonnes. Unfortunately, the scheme has not evoked the expected response. A number ofreasons can be cited for the low response, prominent among them being depositors’ losing themaking charges spent on jewellery (as the banks would convert them into primary form beforeaccepting as deposits), the low caratage of jewellery, low rate of return on deposit (as seen by thedepositors) and the absence of any amnesty.
6. Role Played by International Authorities:
The authorities of different countries, have on the other hand, played significant roles in furtheringthe development of gold markets. Here one could see three patterns:Producer nations like South Africa, Australia and Brazil have shown keen interest in thedevelopment of spot and forward market in their respective countries mainly with the intention ofproviding financial products to the producers. Also, since a liquid forward market in gold (forenabling the producers to sell their product forward) presupposes the existence of a leasingmarket, these authorities have promoted this market also.Financial centers like the U.K., the USA, Switzerland, Hong Kong and Singapore have activelypromoted gold related products to be traded at these Centers. While in the UK and the USA, themarket is designed to be used by residents and non-residents alike the focus in Singapore is onproviding service to off-shore entities in Singapore and non-residents. There are direct benefits tothe countries concerned in the form of value-addition in the products, employment etc.

In Turkey, the gold market has recently been liberalised. Turkey has quite a few parallels withIndia in respect of gold i.e. no significant domestic output; and large private sector holding. InTurkey, the private sector holding is estimated at 5,000 tones, while in India the same is placed at7,500-10,000 tons. Further, like India, Turkey seems to have high income elasticity of demand forgold. In early 1995, Turkey liberalised its gold control regime by throwing open imports. TheIstanbul Gold Exchange was set up in July 1995 to help bring into the economic mainstream thehuge quantity of gold held by the private sector. Gold-based paper is sought to be introducedthere as also the setting up of a gold refinery with international accreditation for providing refiningservices to the gold producing countries in Central Asia.
While in India the concerned authorities are still yet to play an active role in developing goldmarket domestically on sound lines and linking such markets with the financial sector. Afterliberalization of gold imports, now the right step forward would be to develop a forward market ofgold in the country and thus integrate the same with the mainstream financial sector.
7. A Success Story:
Istanbul Gold Exchange"Istanbul Gold Exchange became an important step in canalizing the gold to financial system,developing gold based investment vehicles and international integration of gold sector in Turkey."As a prominent gold importer, Turkey owes its physical gold demand (reaching to 200 tons(6.430.148 ounces) per year) to the popularity of gold in the eyes' of the Turkish people. Gold haspreserved its importance throughout the ages, first as a means of exchange and more recently asa commodity for investment and saving. Despite the recent proliferation and developments in theTurkish financial markets, gold retains its traditional role for the Turkish society. Turkey is withinthe top five countries with the highest demand for gold in the world. Since there is no domesticproduction of gold yet the demand is met through imports.
The restructuring model for gold aimed converting the existing idle gold savings into an activeresource for the Turkish economy and canalising them into investments. Developing a gold-basedfinancial system, establishing Istanbul Gold Exchange, developing gold-banking, supportingjewellery sector and finally establishing Gold Refinery are the main steps of this model.On July 26, 1995 the Istanbul Gold Exchange was opened with the objectives of liberalizing theTurkish gold sector and integrating it with the international markets, rationalizing the gold importsand introduce gold-based financial instruments. The opening of the spot gold market provided thegold sector a regulated and reliable market and the gold sector's acceptance of the spot gold

market is shown in the trading volumes of the precious metals market gold market.By launching of the Istanbul Gold Exchange local gold prices have closed to world gold prices,imported gold bars have met the purity and the standard accepted worldwide, gold trading hasbeen taken into record and the system have gained a transparent structure.On August 15, 1997, the Istanbul Gold Exchange Gold Futures and Options Market was launchedto meet the demand for future products of gold in Turkey, which is the first derivatives market inTurkey.
New amendments about silver and platinum have been made on the Decree No. 32 concerningthe Protection of the Value of Turkish Currency. These latest amendments published on theOfficial Gazette dated on December 31, 1998 made the silver and platinum trading possible inIstanbul Gold Exchange as well as gold.Lastly Precious Metals Lending Market was started its operations in Istanbul Gold Exchange onMarch 24, 2000 for the purpose of bringing supply and demand into an organized market,lowering the production costs of the jewellery sector and securitization of gold.The success of derivatives instrument of Gold in Turkey (a predominant Gold consuming countrylike India) is best illustrated in the following table.

Treatment of Foreign Currency in Turkey
In-flow and out-flow of foreign currency to Turkey is permitted. Persons settled in Turkey arepermitted to carry foreign currency as well as buy foreign currency from banks, private financecompanies, authorized institutions and precious metal brokerage companies. It is also permittedto invest the foreign currency nationally or abroad via banks and private finance companies or toopen foreign savings accounts or to use as effective without any restrictions.Persons settled abroad are permitted to buy foreign exchange from banks, private financecompanies, authorized institutions and precious metal brokerage companies.
Once all obligations to the Central Bank concerning foreign currencies are met by theaforementioned establishments, they may then proceed in activities within the currency andeffective market embodied and regulated by the Central Bank.Banks, private finance companies, authorized institutions and precious metal brokeragecompanies are unconstrained to use their existent currencies provided that the means of use arein accordance to fore ordained principles of the Central Bank and the Decree No.32.The Central Bank and banks may open foreign currency and gold deposit accounts on behalf ofpersons settled within Turkey or abroad. There are no constraints on savings. The interestapplied to these accounts may mutually be agreed upon by the account holder and the respectivebanks. Banks may use their own resources to transfer principal amounts, interests as well asreturn of gold. The fluctuations in the rate of exchange which may arise due to these accounts arethe responsibility of the concerned parties.
Gold Banking in Turkey
The Turkish lira is convertible and transactions between foreign exchange, gold and Turkish Liraare free, as are remittances in and out of Turkey.Banks have been authorized to open gold storage accounts and gold credits since March 21,1993. In 1995, it was stabilised that the basis for gold storage accounts and also provokedarrangements to be made for the use of credit within the country by obtaining gold credits fromabroad.There are specialists in bank branches who are authorized in gold transactions. Their first duty iscontrolling and testing for fineness of the gold, which physically delivered to the bank orcustomer. Also they calculate the value of gold which is recorded in the registration book.Turkish regulations have permitted following gold banking activities; gold storage accounts, goldcredits, consumer credit by mortgaged gold and gold gift cheques.Only gold storage accounts are used as an investment instrument in banks, for now. However,"Gold Backed Securities" may be issued soon, when its legal structure is completed.Regulations regarding the restructuring model for gold aims to convert the existing idle goldsavings into an active resource for the Turkish economy and to channel them into investments viagold banking activities.

8. International Gold Market Review 1997 – 2002:
The apparently inexorable decline in the gold price during 1997 was the clearest sign of anoversupplied market. A substantial increase in supply was absorbed only thanks to the pricefalling to a level which produced the required price-elastic reaction in the form of increasedjewelry offtake and bar hoarding investment.A statistical description of the year includes many records, both for the absolute levels of many ofthe principal market components and also for year-on-year rates of change. The average USdollar gold price of $331.29 was an 18-year low in nominal terms and a 26-year low in real,inflation-adjusted terms. The fall in the average price compared with the 1996 level, at 14.6%,was the sharpest decline since 1984. By the middle of December, the price had reached theyear's low of $283.00, just below the 1985 low of $284.25, though the depths to which the markethad sunk by then can be appreciated when converting the latter figure into constant 1997 dollars,namely $424.
In attempting to understand the combination of market fundamentals and sentiment whichresulted in this dramatic weakening of the price, two questions stand out. Firstly, how and wherewas the large volume of incremental supply generated and secondly, why did the price have tofall so much to produce the required response from the demand side?
On the supply side apart from old gold scrap, every component showed an increase last year,ranging from a perhaps surprising 4.6% rise in mine production, to the order-of-magnitude jump insupply from forward sales. Between these extremes, there were very large increases in suppliesfrom official sector sales, option hedging and implied disinvestment.
That mine production increased so substantially, especially after a similar increase the previousyear and in a two-year period of weakening prices, requires its own explanation. In brief, the risein output was the result of the start-up of substantial new capacity which had been in the pipelineduring the previous two to three years. The increase in mine production over the past two yearsmay not have helped investor sentiment towards gold but neither was it a key factor in explainingthe price weakness.
Nor could it be claimed that the recycling of scrap was responsible. Although the market crises inEast Asia resulted in a massive dishoarding of old jewelry, as local gold prices exploded in thesecond half, this effect was more than offset, at least in terms of the 1997 statistics, by a pricerelateddecline in scrap supply elsewhere. Nevertheless, towards the end of year, the perceptionof a surge of old scrap from the region did not help sentiment. This was reinforced by the publicitygiven to the highly successful semi-official campaign in South Korea to mobilize scrap during the
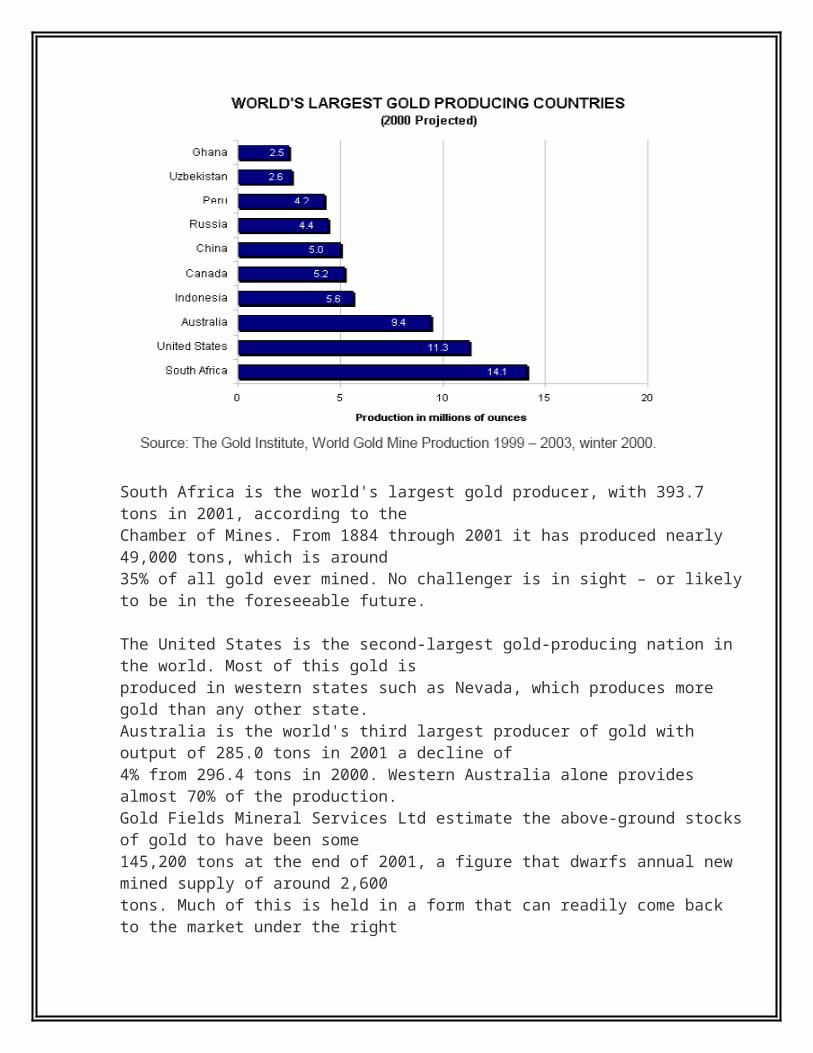
first quarter of 1998.
The average London PM fix in 1997, at $331.29, was the lowest since 1985's $317.26, while theyear-on-year fall of 14.6% was the sharpest drop since 1984. The price fell steadily but notdramatically during the first three quarters of the year, but the rate of decline then accelerated,taking the price down in almost a straight line to a series of new 12-year lows and ultimately to an18-year low of $283 on 12th December.
The price was driven down primarily by a potent combination of central bank selling and marketfears about the level of future official sales, though the strengthening of the US dollar exacerbated the fall in the dollar gold price. Western investors showed little inclination to return to the gold market but speculators continued to exert a large and negative influence by selling gold short. Producer hedging was also a major factor, particularly in the fourth quarter.
In 1999 and 2000 price started to improve on the back of strong physical regional demand andspeculative short-covering. The former stabilised the price in mid-1999 just above $250/ounceand then took it slowly higher; the latter developed because of stable gold prices and fallingmoney market interest rates. The fact that this was happening in a period of relative political andfinancial calm, when there was no perceived need for substantial risk management, did bring goldto the attention of some money managers and other investors in the "professional" arena. If therewas no perceived need for the professional to be hedging against risk, then why was the goldprice rising? Consequently, when global economic political and financial conditions did start todeteriorate, gold had already to some extent made its case for fresh attention. A solidfundamental backdrop was already in place.
Investment in the latter part of 2002 and at the start of 2003 has been driven by geo-politicalconcerns but the underlying background is more complex, and reflects currency concerns, alongwith the desire to hedge against risks in the equity and bond markets and, notably in the case ofArgentina and Japan, risks in the banking sector. Corporate governance problems also played astrong part during the first part of 2002, as a deepening mistrust of corporate reports andaccounts augmented some investors' desire to hedge against equity exposure. Gold thusreasserted itself as an alternative asset class, enabling the professional investor to diversify hisrisk. With concerns also swirling in the markets about the destiny of the dollar, the euro and theyen, gold and the Swiss franc came into play as reserve currencies.
As a consequence, the professional investor is once again looking at gold as a hedge against risk- something that many individuals in developing nations have never ceased to do. Theseindividual investors in the Middle East, Indian sub-continent and the Far East have remained loyalto gold as a safe haven, or an "ultimate investment" as a portable anonymous form of money andit is this sustained activity which has formed the foundation of the change in sentiment in the restof the world. The "retail" investor in the so-called first world is also aware of gold's resurgenceand there has been a noticeable rekindling of interest in coins and bars from this quarter as wellinterest in gold in other forms from other investment pools.
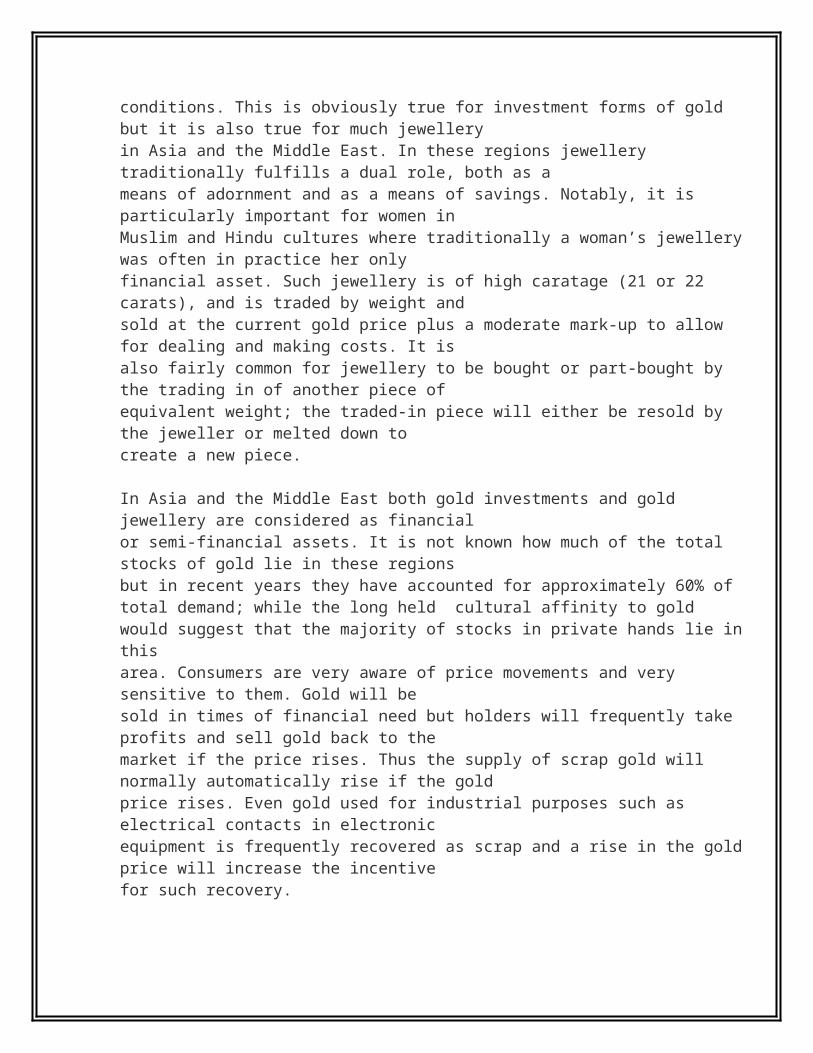
Offsetting this fresh demand to some extent is the fact that the slowing global economy had anegative effect on purchases of gold in the jewellery sector, and the poor Indian monsoon meantthat Indian offtake, the world's largest, was particularly badly hampered. This is one of theanswers to the question "why didn't the price rise further, given all the other uncertainties in theworld?" One of the important features of gold is that more often than not, a reason for one man tobuy it is the same reason for another man to sell it. It is this that helps to make it an attractivealternative asset class as it has characteristics all of its own and a negative, if any, correlationwith many of the other major asset classes. In this case the slowing economy hindered jewellerypurchases, but prompted purchases from investors concerned that stock market valuations weretoo high given the deteriorating outlook for earnings.
It is worth pointing out also that if the price had rocketed, the integrity of the demand side wouldhave been severely undermined and such a rally would have proved unsustainable, as well asgenerating considerable resale of secondary metal and damaging new demand for the longerterm.
Intermittent periods of volatility in gold's price last year generated the usual reaction from theregional buying centres - i.e. in times of volatility they moved to the sidelines. What wassignificant, however, was that there was little resistance on the part of these purchasers to returnto the market at higher price levels once conditions had stabilised and the support lent from thephysical market has thus been at steadily rising prices.
The market has therefore benefited from a solid underlying fundamental base, combined with acocktail of influences that have led to steady investment activity from hitherto absent friends. Therecent moves, in the last few weeks of 2002 and early 2003, have been predominantly concernedwith increasing tension in parts of the Middle East and north Korea and the recent rapid upwardmoves have choked off physical demand in the near term. As we go to press the price is lookingto consolidate between $345/ounce and $355/ounce.
There is clear evidence of speculators in the market as well as investors looking for value and forrisk management and this is currently generating a degree of caution in the expectation of profittaking. The panoply of uncertainties in the external environment, however, is underpinning thetone in the market as gold is once again sought out as an insurance policy. There may be thosein the market who will either wish or need in future to cash in their insurance; others will wish tohold on in case of further rainy days.Gold has been seen as a currency and as an investment for thousands of years. During 2002,while other, younger, sectors showed signs of fear, gold offered the sheltering arm of a reliableelder brother.
9. Gold’s Relative Performance in 2002:

The large-scale chart that accompanies this piece is annotated with events that were relevant tothe market and which may have contributed to price movements or trends. These smaller chartsshow gold's performance in different currencies and against the major stock markets.

Over the course of the year, gold outperformed the dollar by 25%, the yen by 14%, sterling by13%, the euro by 9% and the Swiss franc, the other major recipient of "safe haven" funds (notablyfrom the Middle East), by 7%.
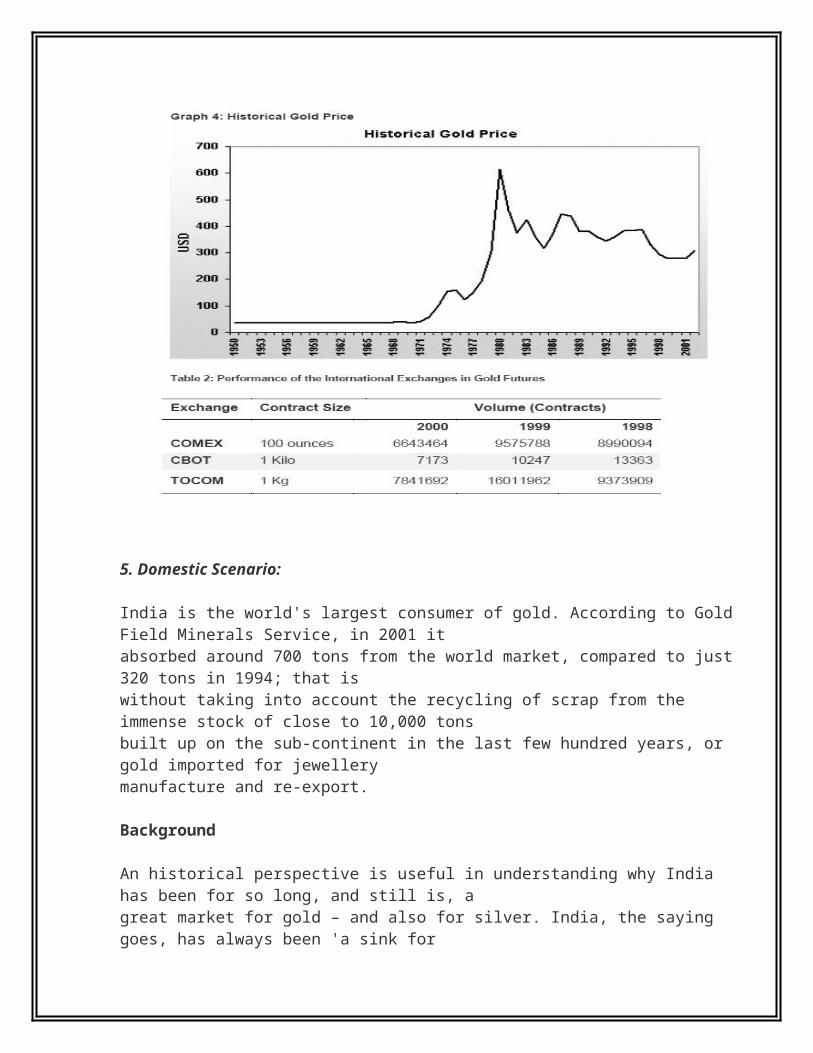
The search for alternative assets is reflected in the relative performance against the major equitymarkets. The chart above shows gold in US terms divided by the Dow, in sterling divided by theFTSE, in Euro divided by the FT Europe index and in yen divided by the Nikkei. Over the yeargold outperformed the FTSE by 52%, the Dow by 47%, the Nikkei by 44% and the Europeanindex by
10. Gold Futures in India:
Why Gold Futures in India?
The Indian gold market has always been linked to international gold market in view of largerequirements of imported gold. Given the inevitable integration between the global and local goldmarkets, there is considerable merit in following the global practice of integration of gold marketswith financial markets and introducing forward trading.
Suitability of Gold Futures
Uncontrolled and uncertain supply
Besides new mining supply, the available supply of gold in the market is made up of three major‘above-ground sources’. In recent years, the growth in gold supply has come from these ‘aboveground’ sources.
a. reclaimed scrap, or gold reclaimed from jewelry and other industries such as electronicsand dentistry;
b. official, or central-bank, sales
c. gold loans made to the market from official gold reserves for borrowing and lendingpurposes.
Following the growing pattern of liberalisation of the gold trade since the early 1990's the localmarkets and exchanges of countries like India and Turkey can flourish legitimately. Consequentlythe pattern of gold flows from mine to end-user, whether in jewellery, industry or investment, ismore direct. This pattern has also been influenced by growing gold production, particularly inAustralia and the United States, which are now major sources of supply for Asian markets. Worldgold output rose from only 1,311 tons in 1980 to 2,604 tons in 2001, i.e almost double.In 1993 the Indian government permitted non-resident Indians to bring 5kg of gold into thecountry twice yearly on the payment of import tax of Rs. 250 per 10 grammes (at current ratesthis equates to US$14.56/ounce or 4.2%). The allowance was raised to 10 kg per trip in January

1997.
1997 Open General Licence (OGL) was introduced in India, paving the way for substantial directimports by local banks from the international market for sale or loan to jewelers and exporters,thus partly eliminating the regional supplies from Dubai, Singapore and Hong Kong. At present,13 banks are active in the import of gold. The quantum of gold imported through these banks hasbeen in the range of 500 tons per year.Gold consumers are very aware of its price movements and very sensitive to them. Gold is sold intimes of financial need but holders frequently take profits and sell gold back to the market if theprice rises. Thus the supply of scrap gold normally automatically rise if the gold price rises. Evengold used for industrial purposes such as electrical contacts in electronic equipment is frequentlyrecovered as scrap and a rise in the gold price increases the incentive for such recovery.
Fluctuating and uncertain demandThe deregulation of the Indian gold market during the 1990s brought about a dramatic change.Jewellery demand increased from 208 tons in 1991 to peak at 658 tons in 1998, while demand forinvestment bars grew from 10 tons in 1991 to 116 tons in 1998, and registered 85 tons in 2002.India in 2001 it absorbed around 700 tons from the world market compared to just 320 tons in1994; that is without taking into account the recycling of scrap.In India the rural population accounts for approximately 70% of national gold demand. ThusIndia’s annual gold consumption is dictated both by the monsoon, with its effect on the harvest,and the marriage season. Between 1998-2001 annual Indian demand for gold in jewelleryexceeded 600 tons, however in 2002, due to rising and volatile prices and a poor monsoonseason, this dropped back to 490 tons, and coin and bar demand dropped to 67 tons. Indianjewellery off-take is sensitive to price increases and even more so to volatility, although thisdecline in tonnage since 1998 is also due in part to increasing competition from white and browngoods and alternative investment vehicles, but is also a reflection of the increase in price.In the cities, however, gold is having to compete with the stock market, investment in internetindustries, and a wide range of consumer goods. In the rural areas 22 carat jewellery remains thebasic investment. Indian gold jewellery exports have increased dramatically since 1996, and in 2001 stood at over 60 tons.
The major factors influencing demand for gold in India are, a. generation of large market surplus in rural areas as a result of all round increase in agricultural productionb. unaccounted income/wealth generated mainly in the service sectorc. domestic gold prices relative to those of ordinary shares and international gold prices
Wide and unforeseen price variationEconomic forces that determine the price of gold are different from, and in many cases opposedto, the forces that influence most financial assets.Econometric studies indicate that the price of gold is determined by two sets of factors: ‘supply’

and ‘macro-economic factors’.Supply and the gold price are inversely related. In the case of ‘macro-economic factors’, the U.S.dollar tends to be inversely related to gold, while inflation and gold tend to move in tandem witheach other. Also, high low-interest rates are generally a positive factor for gold. Overall, theimpact of all of these determinants on the gold price is judged to be neutral-to-positive at thistime. Also there is low to negative correlation between returns on gold and those on stockmarkets
Variation in Indian and International Gold Ready Prices
Homogenous nature with well-defined grades
Assayed gold is homogeneous and it is indestructible and fungible. Refer Annexure.
Likely Benefits from Gold Futures
Development of gold futures would help in efficient price discovery and emergence of healthy andtransparent practices in the market. The basic framework for such an exchange already existswith 13 banks active in import of precious metals. Five of them have launched the Gold DepositScheme also. They can also enter into forward contracts in a limited way. To begin with thebanks can start trading among themselves and then with MMTC, STC and also with big tradersaccording to the demand/supply dynamics.

The demand driven gold market of India may well become the dictator of gold prices over aperiod of a few years displacing the supplier driven international market.Futures trading will facilitate to bring down hoarding demand and help in bringing the idle goldinto the market/official pool (mobilize domestic gold) or permit their use as a financial asset in thebanking sector.
Futures in gold apart from offering jewellery manufacturers and exporters the chance of hedgingtheir inventories would provide many other investors or speculators with a cheap and highlyefficient way of getting into gold.
Studies show in India the consumers on an average would be paying Rs. 8,000 crores extra eachyear by virtue of the questionable quality of gold sold to them. In particular, the rural and middleclass and women are especially vulnerable to the low quality of gold. (Refer Annexure)Development of futures market would make a positive contribution to the protection of consumerand improvement of the industry by setting the benchmark quality for trading.
Properties of Gold
Out of the earth comes a remarkable metal with an unparalleled combination of chemical andphysical properties that make this metal invaluable to a wide range of everyday applicationsessential to our modern life. Thousands of common, everyday appliances require gold to ensureperfect performance over a long period of time. This indestructible metal is completely recyclableand virtually immune to the effects of air, water, and oxygen. Gold will not tarnish, rust, orcorrode. This unique combination of properties makes gold a vital component in many medical,industrial, and electrical applications. These properties include:Gold is a rare metallic element with a melting point of 1064 degrees centigrade and a boiling pointof 2808 degrees centigrade. Its chemical symbol, Au, is short for the Latin word for gold, 'Aurum',which literally means 'Glowing Dawn'. It has several properties that have made it very useful tomankind over the years, notably its excellent conductive properties and its inability to react withwater or oxygen.
Resistance to Corrosion: Gold is the most non-reactive of all metals. It is benign in all naturaland industrial environments. Gold never reacts with oxygen (one of the most active elements),which means it will not rust or tarnish. The gold death-mask in the tomb of Tutankhamun lookedas brilliant when it was unearthed in 1922 as when it was entombed in 1352 BC.
Electrical Conductivity: Gold is among the most electrically conductive of all metals. Sinceelectricity is essentially the flow of charged particles in a current, metals that are conductive allowthis current to flow unimpeded. Gold is able to convey even a tiny electrical current intemperatures varying from -55° to +200° centigrade. This makes gold a vital component for

electrical connectors in computers and telecommunications equipment.
Ductility and Malleability: Gold is the most ductile of all metals, allowing it to be drawn out intotiny wires or threads without breaking. As a result, a single ounce of gold can be drawn into a wirefive miles long. Gold's malleability is also unparalleled. It can be shaped or extended intoextraordinarily thin sheets. For example, one ounce of gold can be hammered into a 100 squarefootsheet.
Infrared (Heat) Reflectivity: Gold is the most reflective and least absorptive material of infrared(or heat) energy. High purity gold reflects up to 99% of infrared rays. This makes gold ideal forheat and radiation reflection, as in life-saving face shields for astronauts and firefighters.
Thermal Conductivity: Gold is also an excellent conductor of thermal energy or heat. Sincemany electronic processes create heat, gold is necessary to transfer heat away from delicateinstruments. For example, a 35% gold alloy is used in the main engine nozzle of the SpaceShuttle, where temperatures can reach 3300° centigrade. Gold alloy is the most tenacious andlong-performing material available for protection at these temperatures.
Uses of Gold
1. Electronics and Telecommunications
(a) Computers/Semiconductors: Millions of computers are manufactured worldwide eachyear and gold plays an active role in their many components. The most important use ofgold is as a fine wire that connects circuits to the semiconductors, or the "brains" of thecomputer. This "bonding wire" is specially refined (up to "five nines" or 99.999-percentpure gold) and has an average diameter of one hundredth of a millimeter - smaller thanthe diameter of a human hair. Gold is also used as a paste with which a circuit is printedon a ceramic base to produce a printed circuit board. In other areas, each key on thecomputer keyboard strikes gold circuits that relay the data to the microprocessor.Computer games also use printed circuit boards that have gold circuitry to connect thelogic units in the game package. Computer peripherals, where there is frequent pluggingand unplugging, use gold-coated contacts to assure consistently clean, corrosion-freecontacts and reliable signals. Gold is essential in computer circuitry because of itselectrical conductivity and because it does not degrade over time.
(b) Powerchairs: Computerized wheelchairs, called powerchairs, allow disabled patientsfurther control over their movements and a renewed sense of independence. At the heartof the computerized controls is a tiny, but powerful, Motorola microprocessor connected tothe wheelchair's controls by gold wire and gold-coated connector pads. Gold is used inthis application because of its high electrical conductivity and its resistance to corrosion.The powerchair, which is exposed to many climates and temperatures, could not operateproperly without its gold corrosion-resistant components.

(c) Spacecraft: To protect the onboard computers in the Galileo space probe from shortcircuiting as a result of heavy bombardment, NASA developed a Heavy Ion Counter (HIC).The HIC contains silicon wafers with gold electrodes that detect the heavy ions as theypenetrate the wafers. Use of the HIC allows NASA engineers to monitor the functioning ofonboard computers and make adjustments when necessary.The Pathfinder "robotic geologist" that took close-up color pictures of rocks and soil onMars and analyzed the planet's chemical makeup, relied on sophisticated electronics todirect its landing and movement. In addition, intricate gold circuitry enabled sophisticatedcomputer technology to transmit the Pathfinder's information back to Earth.
(d) Telephones: Behind the protective cover of every telephone mouthpiece is a miniaturetransmitter that contains gold in one of its central components, the diaphragm. A goldplateddome in the diaphragm works with the other mouthpiece components to transcribevoice vibrations into an electrical current. Gold is used in this application because of itspermanence, particularly in public phones that are exposed to outdoor weather conditions.
(e) Telephone Wall Jacks: Because gold conveys a superior signal, and does not corrode ortarnish, it is used to coat billions of contacts for phone jacks and connecting cordsthroughout our nationwide telephone system. The phone wall jacks are goldcoated toassure the customer of the convenience of moving the phone from one wall jack toanother while maintaining clear static-free conversation.
(f) TVs and VCRs: The microcircuitry in televisions is composed of fine lines of gold circuitsconnected by hair-thin gold wires to the micro-electronic circuit chips that processbroadcast signals into a TV picture. Cables connecting television sets to videocassetterecorders are goldcoated to assure clear relay of the television signal.
2. Lasers and Optics
(a) Astronomy: The world's largest telescope, located at the Keck Observatory, uses gold inits internal workings. Located atop the 13,796-foot-high Mauna Kea volcano in Hawaii, theobservatory is composed of twin telescopes, Keck I and Keck II, and each is equippedwith a 2l-inch secondary mirror that is coated with 99.9-percent pure gold. Keck I, inoperation since 1993, has opened the door to astronomers with its light-gathering ability tosee and measure very faint light sources -- mainly from the infrared spectrum -- on theouter edge on the universe. Keck II began astronomical observations in 1996. Thetelescopes are so powerful that they could detect a single burning candle on the surfaceof the moon.
Gold is used to coat the telescope's secondary mirrors because of its high reflectivity ofinfrared light. Developed by Epner Technology, the gold coating process is known as"Laser Gold" (so named because of its frequent use in the pump cavities of lasers). LaserGold has been accepted as a Standard Reference Material (SRM) by the NationalInstitute for Standards and Technology.

Astronomers using the twin Keck telescopes, with their gold-coated mirrors, announced inOctober 2000 that they have produced the most detailed, precise images of Neptune andUranus ever captured. Scientists are currently poring over the images, learning factsabout the plants' surfaces and atmospheres that were previously unknown.
(b) Copy Machines: Copy machines use very high temperatures to affix the copy image ontothe paper. These machines use gold-coated mirrors to reflect the heat efficiently, andproduce copies for millions of businesses every day.
(c) Photo CDs: Eastman Kodak Company has developed a Photo CD System that uses goldas the reflective surface. Photofinishers can transfer, in a digitized format, 35mmnegatives or slides to compact discs holding up to 100 images on a disc. Once on disc,images can be viewed on television or computer screens. An interesting example of howthis system can be used is demonstrated in a project for the National Park Service inwhich all items left at the Vietnam Veterans Memorial are photographed, catalogued, andcompiled onto gold-coated photo CDs.
(d) Satellites: Military and commercial communications satellites circling the Earth use goldin many important ways. Circuitry and chemically clean gold wires provide permanentlystatic-free signals in rebroadcasting signals back to Earth.Electronic circuitry boxes are gold coated to protect the electronic devices from cosmic raydegradation and solar bursts.Gold-coated Mylar sheets are wrapped around the main body of satellites to reflect awaythe intense solar heat that would otherwise degrade the satellites' performance.Gold is essential in satellites because of its reflectivity, conductivity, and resistance tocorrosion.
(e) Security Systems: Security systems require long-term unattended reliability. The infraredreflective properties of gold are used in infrared viewing equipment for home and officesecurity systems. These nighttime security cameras can view areas at night without theneed for visible light.
Medicine and HealthGold is valuable to modern medicine because it is non-toxic and biologically benign, one of themost efficient conductors of electricity, and its density enables it to be seen under electronmicroscopes. And although gold is virtually indestructible, it is a soft metal, easy to work with,shape, flatten or draw out into microscopic strands
(a) DentistryMost gold used in dentistry is in the form of alloys, which are mixtures of gold and othermetals, such as platinum, palladium, silver, copper and zinc. Gold is non-toxic andbiologically inert, which makes gold ideal for use in dental procedures. It is easy for thedentist to manipulate, but strong, stiff, durable and tough -- it never wears or tarnishes. Itis also very resistant to chemical attack and does not corrode.

(b) Eye SurgeryAccidents, disease or surgery may cause a condition called Lagophthalmos, which is theinability to close the eyelids fully. In order to keep the eyelids moist, doctors previouslyresorted to sewing the eyelid half shut, but a new gold eyelid implant is now the currentform of treatment. These gold "eyelid load implants" are surgically inserted into the upperlid and allows the eye to blink normally. The muscle that opens the eyelid works to holdthe eyelid open; then, when the muscle relaxes, gravity exerted on the gold causes theeyelid to drop. Gold is the best choice for this device as it does not corrode and will notreact with tears.
(c) Lasers: One of the most promising new areas of medical treatment is in the use of ionlasers, the interior surfaces of which are coated with gold to control the focus of the beam.In one development, gold vapor lasers create a high intensity red light with the requiredwavelength to seek out and selectively destroy cancerous cells without harming healthyneighboring cells. A new lightweight laser, designed by the military and using gold platedcontacts, enables medics to seal battlefield wounds in the field, thereby reducing bloodloss and improving survival chances for the seriously wounded. In hospitals, this newdesign will allow lasers to be brought to critically injured emergency patients withoutmoving them, saving minutes and lives.
Surgeons use gold instruments to clear clogged coronary arteries. Injection of microscopicgold pellets helps retard prostate cancer in men. Some forms of cancer are treated withcolloidal gold. Lasers with gold-coated parts literally give new life to patients with onceinoperableheart conditions and tumors.
These gold-reliant lasers are revolutionizing medicine - from pinpoint destruction ofcancerous cells to rapid emergency surgical procedures, to delicate surgery on eyes andbrain tissue that was previously not possible. Most recently, gold-coated lasers are beingused to rejuvenate skin tissue damaged by burns and injuries, while leaving thesurrounding healthy tissue unaffected. Because of its inert and benign nature, gold can beused inside the human body without fear of corrosion or harmful physical reactions inmost cases.
(d) Rheumatoid Arthritis Treatment: Rheumatoid arthritis is an autoimmune disease thatafflicts approximately millions of Americans, mostly women. Gold has been used in thetreatment of rheumatoid arthritis since the 1920s, and has been a standard treatmentsince the 1960s. Gold treatment includes different forms of gold salts, an effectivemedicine for controlling some types of arthritis. For many, but not all patients, it helpsrelieve joint pain and stiffness, reduces swelling and bone damage, and lessens thechance of joint deformity and disability. Gold can be taken either by injection or in pill form.While the reasons for the effectiveness of gold are not completely understood, accordingto the Arthritis Foundation, it appears that gold affects the process that causes joint painand swelling.
(e) Thermometer: Gold is a key component of modern thermometers that can read human

body temperature in two seconds, just by holding the thermometer against the outer ear.The readings are accurate because the eardrum shares the same blood vessel system asthe hypothalamus, the organ that controls the core body temperature. The thermometerscontain a gold coated tube -- known as a "waveguide" -- that directs heat from the ear tothe temperature sensing element in the device. Waveguides have been essentialcomponents of electronic systems such as radar and microwave telecommunications.Since gold is the most heat-reflective metal, none of the heat radiated from the ear will belost warming up the tube of the thermometer. A result, gold is the metal of choice in theFirstTemp Genius® for providing a non-invasive method of monitoring body temperature --especially invaluable when monitoring babies or unconscious patients.
(f) Research: Laboratory coupling of tiny gold particles with DNA has produced newmicroscopic structures that are opening a range of research, treatment and diagnosticpossibilities in fields such as biochemistry, genetics and medicine.Soon doctors will be able to test patients for infections, cancer, AIDS, and other diseasesand get immediate results by using genetic probes affixed with clusters of gold moleculesthat adhere to targeted DNA material.
Scientists at the Massachusetts Institute of Technology (MIT) developed a microchip, thesize of a human thumbnail, with more than 1000 separate tiny compartments that can holdmedications in solid, liquid, or gel form, and dispenses them from under the patient's skin.The silicon chip is covered with thin gold foil. Medicine is released when a tiny electricalcharge is applied between the gold cover and a gold electrode, opening the desiredcompartment.
Industry and Aviation(a) Airbags: Gold is used in automobile airbag deployment systems, where a sensor deviceis placed inside the car near the front bumper. This sensor contains gold-plated electricalcontacts that, when activated, send the signal for the airbag to deploy. Because of itsdependable electrical conductivity and its resistance to corrosion and tarnish, gold is theonly metal that meets the quality requirements for this life-saving feature.(b) Aircraft Engines: Gold plays a vital role in the engines of military and civilian aircraft.Gold is a major constituent of a brazing alloy used in the manufacture of two assemblies --stators and tubes. These two assemblies are integral to maintaining airflow and aircompression necessary for combustion engine operation. Gold also plays a key role inaircraft electronics and guidance systems.(c) Aircraft Windows: Many domestic and military aircraft use gold-coated acrylic windows inthe cockpit. In cold weather, these windows, carrying an electric current, help eliminatefrost that might diminish the vision of the pilots. These thin coatings of gold also help avertfogging as the plane ascends through moisture-laden clouds.During warmer weather, gold's reflectivity helps maintain cool cockpit temperatures on hotrunways. In flight at high, cold altitudes, gold's thermal conductivity helps retain the heat ofthe cabin, keeping the crew warm.(d) Engine Systems: Gold-plated connectors in the sensors for ignition and exhaustmonitoring ensure long-term efficiency of automobile engine operation. Gold is integral in

maintaining car efficiency. Gold plated connectors and contacts that operate in a car'sengine require materials that can withstand the high-temperature and corrosiveenvironment.(e) Fire Bunker Gear: When a disaster occurs, such as an airplane crash or hazardouschemical fire, firefighters must wear protective "bunker gear" so they can get close enoughto the fire to control it. In close proximity to intense heat, firefighters need to protect theireyes while maintaining the ability to see the fire scene clearly. Bunker gear headcoverings have protective face heat shields that are coated with a thin layer of gold. Goldhas been used for several years in this safety-related application because of its heat andinfrared reflectivity.(f) Food- Freshness Sensors: Gold-coated sensors provide the food industry with a systemfor measuring carbon dioxide gas, which is necessary to prevent spoilage of fruits andvegetables. Gold sensors are also important in maintaining carbon dioxide levels requiredto extend the shelf life of packaged and stored foods. The sensors containing gold areunaffected by high humidity, an environment that is needed for growing mushrooms, forexample. Gold is inert, so it will not react with other elements(g) Gold Catalysis: One of the exciting new applications for gold in industry is as a catalyst.New developments in catalysis may allow gold to replace or augment traditional catalysts,resulting in a wide range of potential industrial applications, including catalytic convertersfor automobiles. Gold has always been thought to be relatively inactive as a catalyst,compared to others such as platinum and palladium. This seems to be changing.Recent innovations and research have shown that when properly prepared, gold canactually be preferable to other, more conventional catalytic materials. For instance,platinum and palladium require very high temperatures for catalysis to occur. But underproper conditions gold catalysis can occur at ambient temperatures, making catalysismore effective across the thermal spectrum. Gold catalysts can help keep our air cleaner.Gold catalysts are also being researched for fuel cells, powerful devices that couldgenerate electricity for automotive and industrial motors without creating pollution.(h) Protection of Air Force One: Air Force One, the airplane used by the President of theUnited States, is equipped with gold-plated reflectors. These reflectors confuse anincoming missile's heat-seeking signal, making it difficult for missile's guidance systems tofocus on their target.
Gold JewelleryFrom the first discoveries of gold in ancient times, its beauty and the ease with which it could beworked inspired craftsmen to create it into ornaments, not just for adornment, but as symbols ofwealth and power. The skills of the goldsmith from ancient Egypt to Benvenuto Cellini or CarlFaberge still amaze us. As Pihder wrote nearly 2,500 years ago, "Gold is the child of Zeus,neither moth nor rust devoureth it". Today, gold jewellery is more a mass- market product,although in many countries still treasured as a basic form of saving. Jewellery fabrication is thecrucial cornerstone of the gold market, annually consuming all gold that is newly mined.Pure gold is used in those parts of the world where jewellery is purchased as much for investmentas it is for adornment, but it tends to be vulnerable to scratching. Elsewhere, it is usuallymixed, or alloyed, with other metals. Not only do they harden it, but influence the colour; white

shades are achieved by alloying gold with silver, nickel or palladium; red alloys contain mainlycopper. A harder alloy is made by adding nickel or a tiny percentage of titanium.
The earliest known gold jewellery dates from the Sumer civilisation, which inhabited what is nowsouthern Iraq around 3000 BC. Articles displaying various techniques such as repousse, chainmaking,alloying and casting have been found in ancient Egyptian tombs, with the best knownexamples coming from the treasures of King Tutankhamun who died in 1352 BC. The Minoans onCrete produced the first known cable chain, still very popular today, and the Etruscans in Italy haddeveloped granulation, whereby items are decorated with tiny granules of gold, by the 7th centuryBC.
Italy has remained at the forefront of the gold jewellery industry. The Italian Renaissancecoincided with the discoveries of the New World sources of gold, and wealthy Italian patronsencouraged goldsmiths as they did painters and sculptors. The Spanish acquisition of SouthAmerican gold, however, was achieved at the expense of the ancient heritage of Pre-Columbiangoldsmiths. These craftsmen were producing exquisite items as early as 1200 BC and their artreached its zenith during the Chimu civilisation from the 12th to the I5th centuries AD, halted onlyby the mass looting and slaughter by the "conquistadors".
Historically, gold was a rare metal, afforded only by the wealthy. But the gold rushes to Californiaand Australia in the mid- 19th century ushered in a new dimension of gold supply. Theycoincided, too, with the development of machinery for making chain and other articles and of amuch wider consumer market. In the 20th century gold jewellery has come within the pocket ofmost people.
The way ahead was pointed by Italy, which has become jewellery manufacturer to the world,using over 400 tonnes of gold annually, more than two- thirds of it for export. Factories oftenhousing several hundred ma- chines that "knit" gold wire into chain flourish in the towns of Aires,Bassoon del Grape and Vicenza. Important new centres emerged in the early 1990s, notably inHong Kong, Singapore, Malaysia and Thailand, catering particularly for the rapidly growingmarket for chukka am (pure gold) jewellery in China, which requires several hundred tonnes ayear. In Japan jewellery fabrication for the domestic market has become a major industry, usingaround 100 tonnes a year.
Attitudes to jewellery still vary. In the industrial countries gold jewellery is primarily a fashion item.But in the Middle East and much of Asia gold ornaments are seen equally as investment; 22 caratarticles are bought on a low mark-up of only 10-20 per cent over the gold price of the day, and

may be traded in at a profit if the price rises or, more often, for new articles.The importance of jewellery to the gold mining industry cannot be under-estimated. Between1970 and 1992 around 65 per cent of all gold available to the market was used in jewellery, andfrom the late 1980's into the 1990's, it absorbed much of the rise in production. Since 1991 over2,000 tonnes of gold has been used annually. The continuing success of the mining industry isinextricably linked with the fortunes of the jewellery trade.
Indian Standard
Gold and Gold Alloys, Jewellery/ Artefacts-Fineness and Marking-Specification as per Bureau of Indian Standards(Third Revision)
Scope
This standard specifies eight grades of gold, used in the manufacture of jewellery/artifacts of gold,based on their gold content. This standard also specifies the guidelines for marking of purity and other details on tested jewellery/artifacts.
References
The following standards contain provisions which, through reference in this text, constituteprovisions of this standard. At the time of publication, the editions indicated were valid. Allstandards are subject to revision, and parties to agreements based on this standard areencouraged to investigate the possibility of applying the most recent edition of the standardindicated below:
Terminology
For the purpose of this standard, the following definitions shall apply:
Assaying: The method of accurate determination of the gold content of the sample

expressed in parts per thousand (%).Carat: One-twenty fourth part by mass of the metallic element gold.Fineness: The ratio between the mass of gold content and the total mass expressed inparts per thousand (%).Find Gold: It is gold having fineness 999 parts per thousand (5) and above without anynegative tolerance.Gold: The metallic element gold, free from any other element.
Standard Gold: Gold having fineness 995 parts per thousand (%) and above without anynegative tolerance.
Bureau of Indian StandardsBIS is a statutory institution established under the Bureau of Indian Standards Act, 1986 topromote harmonious development of the activities of standardization, marking and qualitycertification of goods and attending to connected matters in the country.
CaratThis stems back to ancient times in the Mediterranean/Middle East, when a carat became usedas a measure of the purity of gold alloys. The purity of gold is now measured also in terms offineness, i.e., parts per thousand. Thus 18 carats is 18/24th of 1000 parts = 750 fineness.A Carat (Karat in USA and Germany) was originally a unit of mass (weight) based on the Carobseed or bean used by ancient merchants in the Middle East. The Carob seed is from the Carob orlocust bean tree. The carat is still used as such for the weight of gem stones (1 carat is about 200mg). For gold, it has come to be used for measuring the purity of gold where pure gold is definedas 24 carats.How and when this change occurred is not clear. It does involve the Romans who also used thename Siliqua Graeca (Keration in Greek, Qirat in Arabic, now Carat in modern times) for the beanof the Carob tree. The Romans also used the name Siliqua for a small silver coin which was onetwentyfourthof the golden solidus of Constantine. This latter had a mass of about 4.54 grammes,so the Siliqua was approximately equivalent in value to the mass of 1 Keration or Siliqua Graecaof gold, i.e the value of 1/24th of a Solidus is about 1 Keration of gold, i.e 1 carat.If we take national gold reserves, then most gold is owned by the USA followed by Germany andthe IMF. If we include jewellery ownership, then India is the largest repository of gold in terms oftotal gold within the national boundaries. In terms of personal ownership, it is not known whoowns the most, but is possibly a member of a ruling royal family in the East.Pure gold is designated 24 carat, which compares with the "fineness" by which bar gold isdefined, as detailed below:

The most widely used alloys for jewellery in Europe are 18 and 14 carat, although 9 carat ispopular in Britain. Portugal has a unique designation of 19.2 carats. In the United States 14 caratpredominates, with some 10 carat. In the Middle East, India and South East Asia, jewellery istraditionally 22 carat (sometimes even 23 carat). In China, Hong Kong and some other parts ofAsia, "chuk kam" or pure gold jewellery of 990 fineness (almost 24 carat) is popular. In many countries the law requires that every item of gold jewellery is clearly stamped with itscaratage. This is often controlled through hallmarking, a system which originated in London atGoldsmiths' Hall in the 14th century. Today it is compulsory in such countries as Britain, France,the Netherlands, Morocco, Egypt, and Bahrain. Where there is no compulsory markingmanufacturers themselves usually stamp the jewellery both with their own individual identifyingmark and the caratage or fineness.
Hallmarking
Bureau of Indian Standards (BIS), national standards body in India, formulated a scheme of hallmarking in 1998, as a Voluntary Certification Scheme, with a combination of quality certificationand BIS Laboratory recognition schemes. The BIS-recognised laboratories would affix/stamp/hallmark jewellery manufactured by BIS certified jewellers. BIS launched the scheme of hallmarkingin April 2000 under the BIS Act, 1986. Under the Scheme, 12 firms of jewellers (MMTC Ltd.,New Delhi; Bharat Assayers, Chennai; Calicut Assay and Hallmarking Centre Pvt Ltd., Chennai;Chemmanur Gold Refinery (P) Ltd., Cochin; VIMTA Labs, Hyderabad; Emerald Testing (India)Pvt. Ltd., Coimbatore; Geekay Exim (India) Ltd., Mumbai; Gujarat Gold Centre, Ahmedabad; J. J.Hallmarking Centre, Kolkata; Jalan and Co., New Delhi; Jewel Metallochem Laboratory, Mumbai;MICRO Assaying & Hallmarking Centre, New Delhi) have been certified as assaying andhallmarking centres so far. Consumer awareness campaign highlighting the advantages of goingin for hallmarking jewellery is being conducted by BIS.

The major objectives of introducing a proper assaying and hallmarking system in the country areenabling consumer protection, developing export competitiveness of the gold jewellery industry,introducing gold based financial products, which will help in mopping up the vast dormant goldresources with the domestic sector and developing India into a leading gold market centre in theworld. The objectives behind instituting a credible system of Assaying and Hallmarking can beenumerated as under:To protect consumer against victimization of irregular gold quality.To develop export competitiveness of gold jewellery industry and thus provide strong impetusfor gold jewellery exportsTo develop gold based financial products which will help in mopping up of the vast dormantgold resources lying with the household sector.To develop India as a leading gold market centre in the world commensurate with its statusas the topmost consumer
Weighing
Gold is made into a large number of different bars of different weights. The most well known arethe large 'London Good Delivery Bars' which are traded internationally. These weigh about 400Troy Ounces, i.e. 12.5 kg/ 27 lbs. Each. Others are denominated in kilogrammes, grammes, troyounces, etc. In grammes, bars range from 1 g up to 10 kg. In troy oz, from 1/10 tr.oz. up to 400tr.oz.. Other bars include tola bars and Tael bars. Gold is traditionally weighed in Troy Ounces(31.1035 grammes). With the density of gold at 19.32 g/cm3, a troy ounce of gold would have avolume of 1.64 cm3. A tonne of gold would therefore have a volume of 51, 760 cm3, which wouldbe equivalent to a cube of side 37.27cm (approx. 1' 3'').
Recent Research in Gold Markets
A DRG study (Gold Mobilisation Instrument as an External Adjustment) prepared in the RBI in1992, tested five factors for their influence on demand for gold. These five factors are1. generation of large market surplus in rural areas as a result of all round increase inagricultural production,2. unaccounted income/wealth generated mainly in the service sector,3. comparative rate of return available on alternative financial assets like bank deposits, units ofUTI, small saving schemes etc.,4. price variation in gold and5. price of other commodities.
The study led to the conclusion that the first two factors i.e. rural surplus and unaccountedincome in the service sector have far more influence on gold demand than the other factors.In another analysis made by Shri Vaidyanathan in 1999, (Economic and Political Weekly,February 20, 1999) the factors determining the demand for gold were studied. The parameterstaken into account were GDP, ratio of household financial savings to national product, domestic

price of gold, GDP deflator, index of ordinary share prices and the difference between domesticand foreign price of gold as percentage of international prices. The study established that goldimports tend to be higher when domestic gold prices rise relative to those of ordinary shares andinternational gold prices; but, the effect of these two variables was pronounced during 1991-96 ascompared to 1970-90.
Dr. Saumitra Chaudhuri (Financial Express, November 26, 2001) made an analysis of thepossible choices for a saver between interest bearing financial instruments and gold. Headvocates that in Indian conditions, a return of less than 6 per cent for a saving instrument wouldinduce the saver to invest in gold.
Mr. N.A. Mazumdar, in many of his articles, has been holding the view that a capital starvedcountry like India cannot afford to utilize foreign exchange on a commodity like gold. He holdsthe opinion that the consequences of the gold liberalization policy could be alarming, especially inview of the fact that such imports of gold are unrelated to India’s exports of jewellery.2) SILVER:
1. Background
For what is often called as ‘Industrial Commodity’, silver’s unique properties include its strength,malleability and ductility, its electrical and thermal conductivity, its sensitivity to and high
reflectance of light and, despite it being classed as a precious metal, its reactivity which is thebasis for its use in catalysts and photography. This versatility means that there are few substitutemetals for silver in most applications, particularly in high-tech uses in which reliability, precisionand safety are paramount.
Demand for silver is built on three main pillars; industrial uses, photography and jewelry &silverware. Together, these three categories represent more than 95 percent of annual silverconsumption. In 2002, 342 million ounces of silver were used for industrial applications, whileover 205 million ounces of silver were committed to the photographic sector, and 259 millionounces were consumed in the jewelry and silverware markets.Today, the demands of modern technology have revealed the remarkable range of electrical,mechanical, optical, and medicinal properties that have placed silver as the key metal in manyapplications.
Basic Information
Symbol: AgMass: 107.868Density @ 293 K: 10.5 g/cm3Melting Point: 961.93 C (1235.1 K)Boiling Point: 2212 C (2428 K)Classification: Transition MetalCrystal Structure: Face-centered CubicColor: silverCharacteristics: soft, ductile, tarnishes
Abundance
Silver occurs in the metallic state, commonly associated with gold, copper, lead, and zinc. It isalso found in some 60 minerals including: argentite (a sulfide), cerargyrite (a chloride), manyother sulfides and tellurides. Relative abundance in solar system is -0.313 log and abundanceearth's crust is -1.2 log.
2. International Scenario
Table 1: World Silver Supply & Demand

3. Silver Supply
Silver supply is derived from two sources- new mine production and existing above-ground stocksof bullion and fabricated products. In 2002, some 30% of the market’s requirements – equivalentto around 7,840 tons – were met by recycled above-ground stocks, the balance being provided bynewly mined silver.The Figure below shows the contribution made by each of the components of above-groundstocks supply in 2001 and 2002.

Silver Supply Components
Mine production is unsurprisingly the largest component of silver supply. It normally accounts fora little under two-thirds of the total (last year was slightly higher at 68%). But mine production isnot the sole source - the others being scrap, disinvestment, government sales and producer hedging. Scrap, or more properly, “old scrap”, is the silver that returns to the market when recovered from existing manufactured goods or waste. This could include old jewelry, photographic chemicals, even discarded computers (but it excludes silver that is returned untransformed by the manufacturing process - so called “process scrap”). Old scrap normally makes up around a fifth of supply.
Disinvestment and government sales are similar in that both comprise the return to the market of old coins or bars respectively by the private sector or governments. It is worth bearing in mind that these sources may not add to supply every year on a net basis. In some years, individuals have been net investors (as appears to have been the case in 2001) and governments net buyers (as occurred most recently in 1997). The final, though normally minor, component of supply is producer hedging or the early sale by mining companies of future production, a form of “acceleratedsupply”. Hedging may also not appear every year as an element of supply on a net basis as it cancontribute to demand (the case in 2002).
Mine Production
Geographically, just over half of mined silver comes from the Americas with Mexico, Peru and theUnited States, respectively, the first, second and fourth largest producing countries. The third

largest is Australia. Of greater market relevance, however, is the type of mine that silver comesfrom - most silver emerges as a by-product of the mining of other metals. Only a little over aquarter of output comes from mines where the main source of revenue is silver, a so-calledprimary silver mine. A much more comes from lead/zinc mines. Primary mines produce about 27percent of world silver, while around 73 percent comes as a by-product of gold, copper, lead, and zinc mining. This is important, as the price of silver will only have a direct impact on primaryoutput, which means the amount of silver mined is more a function of the price of other metals.Silver from recycled materials accounts for about 20 percent of world silver supply, comingprimarily from used photographic materials. Today, silver bullion stocks make up anothersignificant component of silver supply. Robust silver demand in the 1990s outpaced conventionalsupply - mine production and recycled scrap - leading to a substantial drawdown of silver stocksheld by governments and investors. From 1990 to 2000, silver inventories declined by more than1.2 billion ounces.
2002 Supply
Global silver production edged slightly lower in 2002, slipping from the record levels set in 2001 tofinish the year at 585.9 Moz, a decline of around 1 percent. Europe was the only region in theWestern World to record an increase in production with gains posted in Russia and Kazakhstan.The Americas, Asia, and the African regions all reported output reductions.
In 2002, the major source of silver mine production was generated as a by-product of othermetals. This is, in part, a consequence of the scarcity of large silver deposits, which can be

economically exploited at prevailing silver prices. However, the dominance of by-product or coproduct silver in total mine supply testifies to the fact that silver often occurs naturally with avariety of other metals. Silver is typically found in the oxidized zones of ore deposits, or in thehydrothermal veins associated with sulfide ores. This natural association with lead and zinc(which often occur together), gold and copper, results in significant quantities of silver beingproduced at operations where it is not the primary target nor the principal earner of revenue - infact, in many cases silver is regarded as a "bonus" of base metal or gold mining.
In 2002, Mexico, Peru, Australia and the United States were the top four silver producingcountries. Mexico remained at the head of the ranking, and for the third consecutive yearrecording higher output. Nevertheless, strong growth in Peru left only 2.9 Moz between the two.Australia, the world's third largest silver producer, saw a noteworthy 5 percent increase in production in 2002. The United States held its fourth place ranking despite a sharp drop inproduction, meanwhile, Canada and Poland moved up the table as Chile slipped from 2001'ssixth to 2002's eighth largest producer.
4. Silver Demand
Total industrial demand rose by 1.3% in 2002 to 10,651 tons though this remains substantially
lower than 2000’s 11,705 tons. There were sizeable gains in Japanese and US demand, in partdue to restocking, but this was countered by heavy losses in India.
Silver Demand Components
Demand is dominated by three main categories: jewelry and silverware; industrial andphotographic fabrication. These accounted respectively for 30%, 40% and 24% of demand in2002. These shares have been broadly stable though photographic’s share has slipped a littleover the last decade. Coin demand, the final part of fabrication offtake, has also seen a slight fallin its share of the total. The remaining elements of demand, government purchases, producerhedging and investment, are alike in that, on a net basis, they may not feature every year on thedemand side. The official sector, for example, has not generated significant net purchases since1992, whilst investment’s appearance on the demand side in 2001 was the first in a decade. Nethedging contributed to demand last year though it added to supply in 2001.
Fabrication demand
Total fabrication demand fell by 3.5% to 26,071 tons in 2002. Total offtake has now declinedfor consecutive years, mostly reversing the gains recorded in 1999 and 2000.Surprisingly the biggest contributor to the 942 tons fall in fabrication demand was not sluggisheconomic growth impacting on industrial and photographic demand for silver. In fact thesingle biggest factor a 900 tons fall in jewelry demand in India. Total Indian offtake fell by1,104 tons year-on-year.Industrial demand for silver rose slightly by 1.3% to 10,651 tons, representing 41% of totalfabrication demand. Increases in North America, Asia and the Middle East more than offsetfalls in India and Europe.Photographic demand fell for the third year running. The 4% drop was a result of softerdemand, in particular the consumer sector, which was affected in part by the soft economyand the weakness of the tourist industry.Jewelry and silverware demand fell by 9.4% to 8,061 tons. Much of the loss was in Indiathough European offtake also fell. In contrast, fabrication rose in East Asia, North America,

the CIS and Middle East.The tie between silver and economic activity is strong, given that around two-thirds of total silverfabrication is in the industrial and photographic sectors. This differentiates silver from gold wherean element of investment is present in the purchase of jewelry and bars (jewelry accounted fornearly 70% of total gold demand last year). Sluggish economic activity in the world’s majoreconomies had a material impact on total fabrication offtake in 2002. This was quite marked inEurope where fabrication on the jewelry side was also hit by market share loss to low labor costproducers. However it was a particular set of economic circumstances in India that accountedmost of the decline in global fabrication offtake. In fact, without India, world fabrication would haverisen.In contrast to India, 2002 fabrication demand grew by 3% in East Asia and by 5% in NorthAmerica. Growth in Japanese industrial demand and Thai jewelry demand accounted for much ofthe former’s increase while higher Mexican jewelry fabrication and US industrial demand explainmuch of the latter change. Photographic offtake was broadly flat year-on- year in North Americabut down significantly in Europe and Japan.
Jewelry and Silverware
Total jewelry and silverware fabrication fell by 9% in 2002 to 8,061 tons.India’s 28% or 900 tons fall accounted for much of this, its drop being due largely to a pooryear for its farmers.European offtake also fell whereas most other regions saw gains with Thailand up 97 tons.Jewelry consumption was robust in many regions whereas silverware saw further majorlosses.
5. Domestic Scenario
Imports
For the third year in a row, flows of silver out of China, primarily to India, continued to affect bothregional global trade patterns. However, shipments from the mainland did fall slightly year-onyearin 2002.Silver imports into India for domestic consumption fell sharply in 2002, down by 25% to a touchunder 3,400 tons as against a record year in 2001 when around over 4,540 tons was imported.Furthermore, imports last year were well up on the average level seen throughout the 1990s, thisin spite of difficult conditions for the metal.According to Gold Fields Minerals Services, London (GFMS) data, Open General Licence (OGL)

imports are the only significant source of supply to the Indian market, with shipments by NonresidentIndians (NRIs) having all but disappeared. Replenishment silver imports (non-duty paidsilver for the export sector) rose sharply in 2002, up by close to 200% year-on-year to 150 tons.Import duties remained unchanged throughout the year, at 500 rupees per kilogram. Significantly,and in sharp contrast to gold, the rate of duty was not changed at the time of the 2003-04 budget.The last few months have shown what a profound impact changes in duty can have on importsand the pattern of shipments. In the case of gold, the reduction of duty on numbered, metricweight bars (in India the market standard has for many years been the unnumbered ten tola barwhich weighs 116.63 grams) has seen an almost complete shift away from tolas to kilobars. Notsurprisingly, the reduction in duty (by 60%) has stimulated gold imports at a time when demandwas particularly weak (it has to be said that the fall in the gold price has also been an importantrecent stimulus). Unfortunately for the silver trade, the white metal is not high on the political oreconomic agenda and it seems unlikely that duty on imports will be changed in the near term.
Importing Centers
The bulk of the silver trade in India is actually still unofficial. For example, in the past, Mumbai inMaharashtra State used to attract around 80-90% of Indian silver imports because it was thepremier bullion trading centre and a predominant fabrication centre as well. However, rising salestax and octroi (a local tax) in the state meant that most of the official imports eventually shifted tolow sales tax centers around the country.
The main beneficiary of this in the early years was Ahmedabad with its low sales tax, and at onetime that city accounted for almost all of the silver (and gold) imports coming into India. However,since it was neither a major consuming nor manufacturing center, most of the bullion importedwas smuggled into other states (for example, a substantial portion of gold and silver imported intoAhmedabad eventually flowed into Mumbai illegally).
Initially, the disparity in sales tax between Ahmedabad and the rest of the country wassubstantial, which is why so much metal was shipped via that city. However, this changeddramatically when Jaipur (in Rajasthan) introduced a new system for bullion imports, the socalled‘green channel’. This system allowed traders or groups of traders to pay a lump sum tax ofRs.2.5 crore against which they could import as much gold as they liked. The incentive was, ofcourse, to import ever-higher quantities to reduce the effective marginal tax rate.
Because of this inter-state tax arbitrage, attempts have been made over the past few years tointroduce uniform VAT (value added tax) throughout India. In the 2003-04 budget, it was

announced that uniform VAT would be introduced from April 1st 2003, but this was postponed yetagain (it is worth remembering that the introduction of uniform VAT had already been postponedtwice before this). In the meantime, some centers continue to attract imports due to lower taxes(in spite of a number of states introducing a uniform sales tax rate of 1% in February of this year).It seems probable that differential tax rates will continue to be the primary determinant of where inIndia silver is imported.
GFMS estimate that around 50% of India’s silver requirements last year were met throughimports of Chinese silver (both directly and indirectly via Hong Kong). This is a continuation of atrend first seen in the latter stages of 1998 and which picked up considerable steam in thefollowing two years. Other important sources of supply include Europe (the United Kingdom beingthe second largest supplier of silver to India after China) the CIS, Australia and Dubai.
Industrial Applications
Indian industrial demand is estimated to have fallen by around 13% in 2002, down from a record1,579 tons the previous year to 1,375 tons. In spite of this fall, India is still one of the largest usersof silver in the world, ranking alongside those Industrial giants, Japan and the United States.By contrast with the United States and Japan, Indian offtake in this category is less “industrial”.Indeed, fabrication in hardcore industrial applications like electronics and brazing alloys accountsfor only a fraction of total offtake in this category. For example, electrical, solders and brazingalloys are estimated to account for only around 205 tons of the total 1,375 tons of industrialofftake, a rather paltry 15% (contrast this with Japan, for example, where the ratio is probably

around 80 plus %). The “real” industrial versus “other” industrial split is an important dichotomy inthe Indian silver market and holds the key to understanding the fluctuations in offtake over theyears.
The “other” category of demand in India covers a multitude of different end use applications,ranging from foils for use in the decorative covering of food to the plating of jewelry andsilverware. One other very significant consumer of silver is jari. Jari is a thread used for saris andmost is produced in Surat, Gujarat. It is a massive industry, utilizing a variety of materials whichinclude gold and silver. “Real” jari is made of silver and electroplated with gold and is a majorstatus symbol.
As might be expected, the consumption of jari is very much a function of how well the economy isdoing and how much people are earning. It will come as no surprise then that GFMS estimate lastyear jari fabrication fell sharply, by around 18%, from 232 tons to 190 tons due essentially to theweakness in the agricultural sector. The agricultural output in 2002 fell by around 3% (official estimates for the fiscal year 2002/ 03are that it fell by 3.1%) due to the poor rains which adversely affected the kharif (summer) crop.The government’s “Economic Survey” has estimated that there was a 13.6% fall in food-grainoutput to 183.2 million metric tons last year, the lowest absolute level since 1996-97.The weakness in the agricultural sector has also had negative implications for all of the “other”industrial uses in India. For example, GFMS estimate that foil fabrication collapsed last year,although this was due to a combination of price, lower incomes and the ban on gukta (a tobaccobased chewing product that contains silver) in certain states.
By contrast, fast growing sectors like telecoms, software and durable goods exports have allcontributed to strong “real” industrial demand (data released at the time of the 2003/04 budgetpointed to industrial production having risen 6.1% (fiscal year on- year) compared to just 3.3% theprevious year). As a result, GFMS estimate that electronics/electrical, solders and brazing alloyofftake increased last year, by around 4 and 5% respectively.
Although “real” industrial offtake in India is still relatively low, there is every indication that this islikely to grow in the future. For example, India already plays host to the third largest optical mediamanufacturer in the world (the company has been an original equipment manufacturer for Sonyand Samsung), which uses a substantial quantity of silver in various recording devices. TheSouth Koreans also have a dominant presence in India and, increasingly, products are beingmade predominantly from locally sourced materials (for example, LG claims that its products haveover 70% localized components and, in color televisions, this rises to 95%).

Jewellery and Silverware
GFMS data shows that Indian jewelry and silverware fabrication fell by close to 30% in 2002. It isimportant to note that this decline seems all the more dramatic because of the record levels ofdemand seen in 2001 [when offtake peaked at 3,200 tons]. Notwithstanding this observation, it isworthwhile pointing out that demand last year is estimated to have fallen to levels last seen in1995. What have been the reasons for this precipitous fall? Probably there are two main reasonsfor this, namely the price and the agricultural/ rural economy.
Looking firstly at the former, there is little doubt that the price did play a role in holding backdemand last year. At first sight this may appear a little surprising. Average rupee prices in 2002rose by “only” 7% year-on-year, hardly sufficient, one would expect a priori, to precipitate such amarked decline in offtake. However, one needs to look further than the average to understandhow the price affected demand. Two elements stand out here, the absolute price level andvolatility.
In the Indian market, the 8,000 rupee/kg price level is a tangible psychological barrier for mostbuyers. It is no coincidence, for example, that when the price breached this level in the middle ofthe year imports and demand fell sharply (the former dropped to below 200 tons in both June andJuly when the price averaged 8,344 and 8,360 rupees/kg). As the price dropped back into the7,000s, imports picked up, and indeed peaked for the year in October at over 620 tons. Price volatility is also an important determinant of silver demand (as it is for gold as well).Consumers are particularly sensitive to changes in the price and the oscillations throughout theyear discouraged demand for extended periods of time. The received wisdom is that Indianconsumers will tend not to buy on an upward trend in prices, expecting them to fall.
However, falling prices are not necessarily a signal to buy either. Instead, potential purchasershold back waiting for the price to reach what is perceived to be the low for the period, which canresult in lengthy periods of slack demand. As most Indians in the industry will attest, as a rule ofthumb, price stability is crucial for demand to return.
Although the price level and volatility were important determinants of demand last year, the verymixed macro and micro-economic backdrop also contributed to weaker offtake. Even though theeconomic data is rather patchy, it is still possible to draw some broad conclusions about theimpact of the economy on silver demand. The statistics available point to the agricultural sectorhaving performed particularly poorly in 2002.
The broad consensus is that agricultural output in 2002 fell by around 3% (official estimates forthe fiscal year 2002/03 are that it fell by 3.1%) due to the poor summer rains which adverselyaffected the kharif crop. The government’s “Economic Survey” has estimated that there was a13.6% fall in food-grain output to 183.2 million tons last year, the lowest absolute level since1996-97, with most of this fall attributed to the decline in kharif production (from 111.5 million

tones in 2001 to 90.3 million tons last year). The jury is still out on the impact the droughts had onthe rabi (winter) crop, although some rain towards the end of the year appears to have liftedoutput.
The situation in the middle of last year was particularly dire on the agricultural front. Figures fromthe India Meteorological Department show that the country as a whole had received a cumulativearea weighted rainfall during the period from June 1st to September 11th which was almost 18%below the historical long period average. Nearly 24 of the 36 meteorological divisions were rain deficient. To compound matters, important silver consuming areas in the east and north east hadexcess rains, with floods in parts of Assam and Bihar.It has been suggested in certain quarters that India actually suffered one of the worst droughts in100 years in 2002 and it seems reasonable to assume that this adversely affected rural incomes,which in turn had an impact on silver offtake (one needs to bear in mind that these difficulteconomic circumstances were taking place against the backdrop of high local silver prices) asfarmers cut back sharply on their purchases of “new” silver (there was also an offsetting rise inscrap, although this was very small compared with the situation in the gold market).Although the agricultural sector has been weak, other sectors of the economy were actually quiterobust last year, as telecoms and software exports have been particularly strong and havecontributed to robust industrial output. Data released at the time of the 2003-04 budget pointed toindustrial production having risen 6.1% (fiscal year-on-year) compared to just 3.3% the previousyear. All other things remaining equal, this should have seen incomes and expenditure in thissector of the economy rising, offsetting, to some extent at least, the fall in spending seen in the

rural areas.
6. World Markets
Silver is predominantly traded on the London Bullion Market and Comex in New York. Theformer, as the global hub of OTC (Over-The-Counter) trading in silver, is the metal’s mainphysical market. Here, a bidding process generates a daily reference price known as the fix.Comex, in contrast, is a futures and options exchange. It is here that most fund activity isfocused. Silver is invariably quoted in US dollars per troy ounce.In COMEX the trading unit is 5,000 troy ounces. Trading is conducted for delivery during thecurrent calendar month, the next two calendar months, any January, March, May, and Septemberthereafter falling within a 23-month period, and any July and December falling within a 60-monthperiod beginning with the current month. In fulfillment of each contract, the seller delivers 5,000troy ounces (±6%) of refined silver, assaying not less than .999 fineness, in cast bars weighing1,000 or 1,100 troy ounces each and bearing a serial number and identifying stamp of a refinerapproved and listed by the Exchange.
7. World Silver Prices

The annual average silver price rose over 5% in 2002 though the $4.60 reached remains lowhistorically. The short-termism of investors, heavy Chinese selling towards $5 and weakfabrication largely explain the market’s inability to hold on to gains achieved through speculativeactivity and supportive gold moves.Silver prices missed out on much of the hefty gains that gold saw in 2002, rising just 5% year-onyear,though they fared better than many base metals which saw price declines. Silver’s gain onan intra-year basis was even smaller at under 2%. This should not be taken as a sign that priceswere stable since average volatilities actually reached a three year high. This also helpedgenerate a quite wide trading range but only within 2002; silver prices over the last three yearshave been quite stable, seeing the smallest trading range of the four main precious metals.Despite the 2002 rise, silver prices remain low historically; excluding 2001, the last time theannual average was lower than 2002’s was in 1993. In real (dollar) terms, the situation is yetmore brutal; (again excepting 2001), the annual average has not been lower this side of WorldWar II.The situation as regards prices in other currencies in 2002 was mixed. On the producer side,Australian dollar prices, for example, only just managed a rise year-on-year and fell intra-yearwhereas silver in Mexican peso terms rose not far off 10% year-on-year. Similarly on theconsumer side, euro and yen prices fell noticeably intra-year but rupee prices rose more thandollar prices both intra-year and year-on-year. Silver lease rates saw two distinct phases lastyear. The first was the volatile collapse that occurred in January 2002 as the squeeze, which hadbegun at end-November 2001, fell apart. This took the 3-month rate, for example, from over 10%to under 1% in less than a fortnight. The second phase, characterizing the remainder of the year,was a generally steady slide with periodic brief spikes. This left rates by year-end at near ‘giveaway’ levels, especially at the short end with 3-month silver only just holding above 10 basis points. The picture, however, was not that rosier further up the curve with 12-month rates down toaround 30 basis points. The fact that it was the short end which had collapsed to levels belowwhich it would be hard to go any lower provided a good pointer to one of the main drivers of theslide in lease rates, weak fabrication demand. It is at the shorter end where fabricator borrowingtends to be heaviest.
Figure 7: Spread between Mumbai and New York Silver Prices

8. Why Silver Futures
Suitability of Silver FuturesUncertain Supply & Demand Factors
World mine production is more a function of the prices of other metals.Often a faster growth in demand against supply leads to drop in stocks with government andinvestors.
Economically viable primary silver mine is a function of the world silver price level.Silver demand stands on three pillers – jewellery & silverware, industrial and photography, whichare in turn factors of monsoon & agricultural output, overall industrial growth and performance ofthe tourism & services industry at large, respectively.In recent years India has seen increased imports from China both in the legal and illegal route viaHong Kong.
In India the inter-state disparity in sales tax and octroi on imported silver gives a huge scope ofleverage to the domestic players.In India the real industrial demand occupies a small share in the total industrial demand of silverin sharp contrast to most developed economy’s like Japan and US.In India like Gold the Silver demand is also determined to a large extent by its price level andvolatility.
Price VariationThe below tables, shows the high instability in silver prices in international and Indian marketduring the past several years. This makes an ideal case for futures trading, so as to enable thesilver importers and fabricators to hedge their price risk.

Annexure – 1
General Information
Sparkling tableware, shining jewelry, and living spaces brightened by silvered mirrors are theobvious contributions of silver to our daily lives. It is, however, the silver behind the scenes thatmakes our modern world function efficiently. Inside switches, silver contacts efficiently and safelyturn on and off the powerful electric current that flows into our homes, our lamps and ourappliances. It is silver under the keys of computer keyboards, behind automobile dashboards,and behind the control panels of washing machines or microwave ovens that switch on or off atthe touch of the finger. And inside the 220-volt line circuit breaker boxes in our homes or insidethe 75,000-volt circuit breakers in power stations, silver performs a safe and steady task ofswitching on or off our most dependable servant, electric power, throughout our lives. Refer to theuses of Silver as detailed in Annexure-I.Silver has been a multifaceted asset throughout history. It was found as a free metal and easilyworked into useful shapes and was widely used by early man. The beauty, weight and lack ofcorrosion made silver a store of value, and hence one of the earliest of metals to be used as amedium of exchange.The early discovery that water, wine, milk and vinegar stayed pure longer in silver vessels, led to

its desirability as a container for long voyages. Herodotus (79 A.D.) wrote that Cyrus the Great,King of Persia (550-529 B.C.), a man of vision who established a board of health and a medicaldispensary for his citizens, had water drawn from a special stream, "boiled, and very many fourwheeled wagons drawn by mules carry it in silver vessels, following the king wheresoever hegoes at any time."In more contemporary times, when the first telegrapher tapped out his code in 1832, silver wasthe electrical contact that made the current flow. Earlier that century, when Joseph NicephoreNiepce created the first photographic image obtained through a camera-like device in 1813, itwas silver nitrate that made it possible. Finally, when the German obstetrician, Dr. F. Crede madehis medical breakthrough in 1884 to halt the disease that caused blindness in generations ofchildren at birth, it was silver that killed the virus.
Annexure - 2
History
A major watershed of silver production was the discovery of the New World in 1492, after whichtime major silver mines in Mexico, Bolivia, and Peru were opened leading to a rapid rise in theannual world production of silver. This rise, coupled with improved techniques for extracting silverfrom ore, broadened both the quality and quantity of ore that could be exploited. Laterimprovements, particularly in the late 19th and early 20th centuries, vastly enhanced the base ofsilver production and accelerated the exploitation of silver as a byproduct of base-metal mining.Only about 25 percent of cumulative world silver production occurred before the 1770s. Recordsremain somewhat incomplete for the periods before 1900, however they play a critical part indetermining cumulative historical production.
Old World Silver (4000 BC - 1500 AD)The area of Anatolia (modern Turkey) is considered the first major source of mined silver, havingprovided the resource to craftsman throughout Asia Minor. Silver from the Anatolian regionlargely served as the source of silver for the Western cultures flourishing in the Near East, Crete,and Greece.Silver craftsmanship was centered largely in Asia Minor and Greek Islands, along with areas ofmainland Greece dominated by the Mycenaean culture. Asia Minor provided most of the supplyfor the flourishing silver market.A concentrated effort to mine silver began sometime after 3000 B.C. The first sophisticatedprocessing of silver ore was attributed to the Chaldeans in about 2500 B.C., who used a"culpellation" process to extract silver from lead-silver ores. The need for traditional silver(particularly for the flourishing Minoan and later Mycenaean civilizations) resulted in the locationand exploitation of silver deposits in what is now Armenia.After the catastrophic destruction of the Minoan (cretan) civilization in 1600 B.C. and the decline

of the Mycenaean culture around 1200 B.C., the focus of silver production changed. The mines ofLaurium (near Athens) became the leading production center and provided silver for theburgeoning Greek civilization. Further, the silver trade throughout Asia Minor and North Africaexpanded significantly after the 8th century B.C.The Laurium mines were highly productive; estimates from historical writings and physicalevidence from old mine dumps indicate silver production to have been about 1 million troy ouncesper year at Laurium during the height if production (600 B.C. to 300 B.C.). In fact, for about 1,000years ending around the 1st century A.D., the Laurium mines were the largest individual source of world silver production. Outside the Laurium mines, production was concentrated mainly in AsiaMinor, Sardinia, other Grecian locations and, to a limited extent, in Asia.The period following the heyday of Greek mining in Laurium included the Carthaginians’exploitation of Spanish silver. After the Punic Wars, the Romans replaced the Carthaginians asthe exploiters of Spanish silver and extended their silver mining to other areas of continentalEurope.Spanish mines became a critically important source of silver for nearly 1,000 years, thought theirexploitation was halted temporarily by the Moorish conquest of Spain in the 8th century A.D. TheSpanish mines not only provided a substantial portion of domestic needs of the Roman Empireuntil 476 A.D. but also served as a critical source of silver for the Asian spice trade. To meet theburgeoning trading requirements, Greece, Asia Minor, and Italy supplemented the Spanishproduction.The Moorish invasion of Spain necessitated that the exploitation of silver move to a broaderspectrum of countries, principally in Central Europe. Several major silver mine discoveriesoccurred between 750 and 1200 A.D., including the classic Schemnitz, Rammelsburg, Goslar,and Saxony regions in Germany. Concurrently, discoveries of silver were made in Austria-Hungary and elsewhere in Eastern Europe.Based on the Analysis of available literature and historical records, the production levels from 300B.C. to 1000 A.D. are not likely to have risen significantly from the estimated 1.5 million troyounces per year levels of the Laurium mine era. Although mine production in Spain dominatedthe first 1,000 years A.D., it was balanced by the decline in production at Laurium and Asia Minor.The real expansion in production occurred in the 500-year period from 1000-1500 A.D., when thenumber of mining locations and, to a lesser extent, the improvements in mining and processingtechnology occurred.
New World (1500 - 1875)More significant improvements in technology and discovery of the "New World" in 1492 led to avast storehouse of mined silver that expanded silver production by nearly an order of magnitude,

most particularly in the development of the mercury amalgamation process. The first majorexploitation of "New World" silver was in the Potosi district of Bolivia. Although the actualproduction from Bolivia from 1500 to 1800 A.D. is difficult to quantify accurately, Spanish recordsindicate that about 1 billion troy ounces were produced in this time-frame. For the same period,about 1.5 billion troy ounces were mined in Mexico with the bulk being mined from 1700 to 1800.Peru’s production has been more consistent – production averaged more than 3 million troyounces annually from 1600 through 1800. Historically, the Cerro de Pasco district has beenamong the leading sources of silver in Peru.The Spanish produced Mexican silver beginning in the early 1500s. Production increasedsignificantly in the 1700s, averaging about 9 million troy ounces annually. From 1500 through 1800, Bolivia, Peru and Mexico accounted for over 85 percent of worldproduction and trade. The remaining production in the period was derived largely from Germany,Hungary, and Russia, with lesser amounts from other European countries, Chile, and Japan.After 1850, several other countries increased production particularly the United States with itsdiscovery of the Comstock Lode in Nevada. Silver production continued worldwide, growing from40 to 80 million troy ounces annually by the 1870s.
The Rise of North America (1876 - 1920)The period from 1876 to 1920 represented an explosion in both technological innovation andexploitation of new regions worldwide. Production over the last quarter of the 19th centuryquadrupled over the average of the first 75 years to a total of nearly 120 million troy ouncesannually.A good deal of the new production was added from major new discoveries in the U.S., mostnotably the Comstock Lode area in Nevada, the Leadville district in Colorado and various districtsin Utah.Similarly, new discoveries in Australia, Central America and Europe greatly augmented totalworld production. The succeeding decades from 1900 to 1920 resulted in another 50 percentexpansion in production to about 190 million troy ounces annually. These increases were spurredby discoveries in Canada, the United States, Africa, Mexico, Chile, Japan, and various othercountries.The explosion of technology that enabled steam-assisted drilling, mining, mine dewatering, andimproved haulage was a major breakthrough. Further improvements in mining techniquesenhanced the ability to handle ore and allowed for exploiting larger volumes of ore that containedsilver. For example, the removal of precious metals from zinc by a technique called "fuming"provided a way to separate economically precious metals from moderate-grade complex ores.
The Modern Era (1921 - 1990s)

A variety of advances in the early part of this century that allowed for the increasing productionworldwide. This was critical, as many of the high-grade ores throughout the world had beenlargely depleted by the end of the 19th century. These advances include:Bulk mining methods, both at the surface and underground, capable of handling largeamounts of lower grade base-metal ores that contained byproduct silver.Refinement of extraction techniques capable of separating various base-metal concentratesfrom ores.Improved techniques in ore separation, notably froth flotation (post 1910) that allowed forconcentration of silver in lead, zinc, and copper concentrates.Improvements in electrorefining techniques allowing for the easy separation of silver andother base metals from refinery slimes, thus providing an increasingly important source ofsilver.Thus, the explosion in the production of these various base-metal sources throughout the 20thcentury led to an increasing output of silver-bearing residue and ultimately, refined silver.
Annexure – 3
Annexure – 4
Uses of Silver

Silver’s unique properties include its strength, malleability and ductility, its electrical and thermalconductivity, its sensitivity to and high reflectance of light and, despite it being classed as aprecious metal, its reactivity which is the basis for its use in catalysts and photography. Thisversatility means that there are few substitute metals in most applications, particularly in high-techuses in which reliability, precision and safety are paramount.
Jewelry and Silverware
Silver possesses working qualities similar to gold, enjoys greater reflectivity and can achieve themost brilliant polish of any metal. Consequently, the silversmith’s objective has always been toenhance the play of light on silver’s already bright surface. Pure silver (999 fineness) does nottarnish easily but to make it durable for jewelry, it is often alloyed with small quantities of copper.It is also widely used with base metals in gold alloys. Sterling silver, at a fineness of 925, hasbeen the standard of silverware since the 14th century, particularly in the manufacture of “hollowware” and “flatware”. Plated silverware usually has a coating of 20-30 microns, while jewelryplating is only 3-5 microns. Silver possesses working qualities similar to gold but enjoys greater reflectivity and can achieve the most brilliant polish of any metal. To make it durable for jewelry, however, pure silver (999 fineness) is often alloyed with small quantities of copper. In many countries, Sterling Silver (92.5% silver, 7.5% copper) is the standard for silverware and has been since the 14th century. The copper toughens the silver and makes it possible to use sterling silver for cutlery, bowls and other decorative items such as picture frames.
Coins
Historically, silver was more widely used in coinage than gold, being in greater supply and of lessvalue, thus being practical for everyday payments. Most nations were on a silver standard untilthe late 19th century with silver coin forming the main circulating currency. But after the goldrushes, the silver standard increasingly gave way to gold. Silver was gradually phased out ofregular coinage, although it is still used in some circulating coins and especially in American,Australian, Canadian and Mexican bullion coins for investors.Silver, being a rare and noble metal, was a more desirable medium of exchange than beads,feathers, shells, and the like. Its use as a medium of exchange is known throughout all recordedhistory. Coins, in the sense of having an authenticating stamp on them, began to appear in theeastern Mediterranean during 550 B.C. By 269 B.C. Rome adopted silver as part of its standardcoinage. Silver became the trading medium for merchants throughout the civilized world. (Goldbeing reserved for governments and the wealthy.) Today silver coins continue to be the mediumof exchange wherever paper is not acceptable, for example, in parts of Africa and the MiddleEast. One example of a trade coin is the Empress Maria Theresia Taler, first minted in Austria in1741. It was standardized in 1780 as 28 grams and 833/1000 silver (the remainder copper).
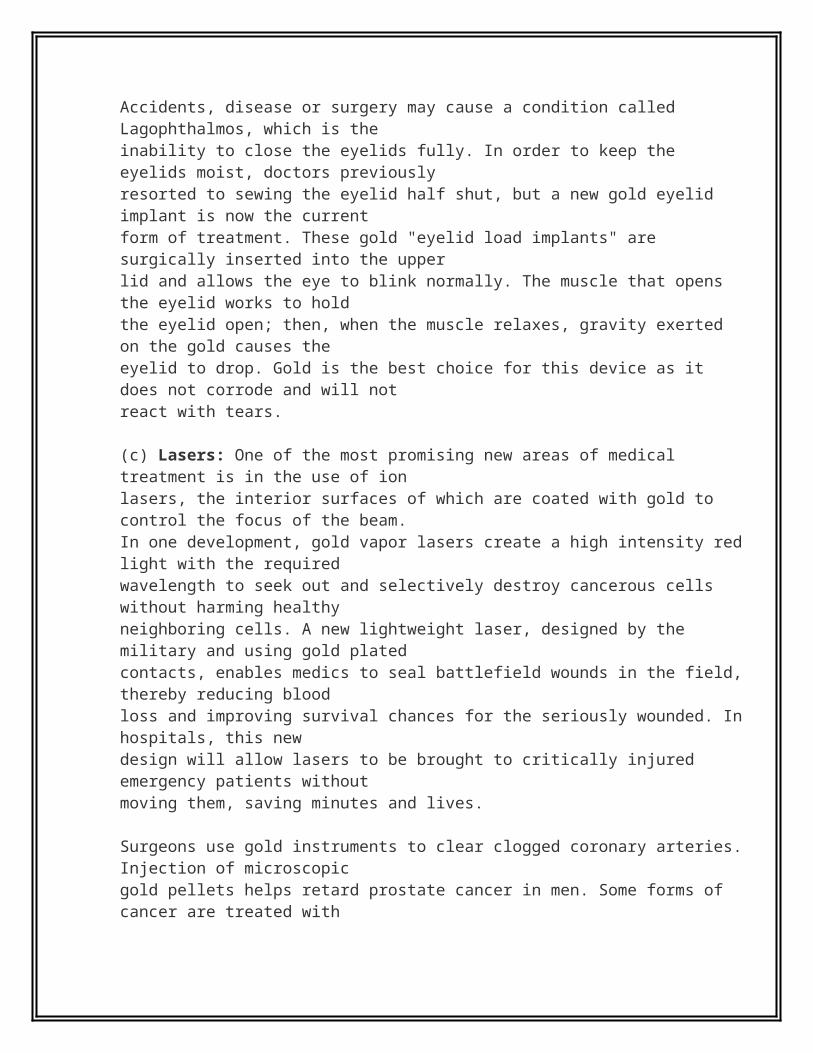
Some 370 million of these 1780 dated coins have been minted up to 1996 and a large proportionremain in circulation today.Until the late 19th century most nations were on a silver standard with silver coins forming themain circulating currency - silver being in greater supply and of less value than gold, thus beingmore practical for everyday payments. As gold became more plentiful, however, silver was slowlyreplaced although it is still used in some circulating coins as well as in bullion coins for investors.In the U.S., silver is used only in bullion, commemorative and proof coins. Mexico is the onlycountry currently using silver in it's circulating coinage. During the past decade, the United States,Canada and Mexico began issuing pure silver bullion coins with nominal face values sold at asmall premium over their bullion value (not their face value).In 1982, Mexico began minting a 999-fine (99.9% pure) silver Libertad ranging in weight from1/20 oz. to 5 ounces; over 16 million coins have been sold. The U.S. Mint issues a 999-fine SilverEagle (a one ounce bullion coin with a face value of $1) bullion coin; over 76 million have beensold since 1986. The Royal Canadian Mint issues a 5 dollar 9999-fine silver bullion coin, the silverMaple Leaf; over 9.8 million have been sold since 1986. Australia has issued a 5-dollar, 1 ounce.999 fine silver bullion coin, the Kookaburra; over 6 million have been sold since 1990.Industrial
Silver is the best electrical and thermal conductor of all metals and is hence used in manyelectrical applications, particularly in conductors, switches, contacts and fuses. Contacts providejunctions between two conductors that can be separated and through which a current can flow,and account for the largest proportion of electrical demand.The most significant uses of silver in electronics are in the preparation of thick-film pastes,typically silver-palladium for use as silk-screened circuit paths, in multi-layer ceramic capacitors,in the manufacture of membrane switches, silvered film in electrically heated automobilewindshields, and in conductive adhesives.The ease of electro-deposition of silver from a double-alkali metal cyanide, such as potassiumsilver cyanide, or by using silver anodes accounts for its widespread use in coating. Silversolutions are made up of a cyanide, a carbonate, silver and a brightener. The silver is usuallyadded as the single salt, silver cyanide, or the double salt, potassium silver cyanide. Variousforms of silver are used as anodes and may be in the form of plates, bars, rods, grain or incustomdesigned shapes. The plating thickness of some items, such as fuse caps, is less thanone micron although the silver then tarnishes more easily, and coatings of two to seven micronsare normal for heavy duty electrical equipment.Silver is used as a coating material for compact disks, whilst in 2002 digital video disks alsoswitched to a silver coating.The unique optical reflectivity of silver, and its property of beingvirtually 100% reflective after polishing, allows it to be used both in mirrors and glass coatings,cellophane or metals.Many batteries, both rechargeable and non-rechargeable, are manufactured with silver alloys as

the cathode. Although expensive, silver cells have superior power-to-weight characteristics than their competitors. The most common of these batteries is the small button shaped silver oxide cell(approximately 35% silver by weight) used in watches, cameras and similar electrical products.Silver, usually in the form of mesh screens but also as crystals, is used as a catalyst in numerouschemical reactions. For example, silver is used in formaldehyde catalysts for the manufacture ofplastics and, to an even greater extent, in ethylene oxide catalysts for the petrochemical industry.Silver is employed as a bactericide and algicide in an ever increasing number of applications,including water purification systems in hospitals, remote communities and domestic households.The joining of materials (called brazing if done at temperatures above 600º Celsius and solderingwhen below) is facilitated by silver’s fluidity and strength. Silver brazing alloys are used widely inapplications ranging from air-conditioning and refrigeration equipment to power distributionequipment in the electrical engineering sector. It is also used in the automobile and aerospaceindustries. Bearings electroplated with high purity silver have greater fatigue strength and loadcarrying capacity than any other type and are hence used in various high-tech and heavy-dutyapplications.
BatteriesMany batteries, both rechargeable and disposable, are manufactured with silver alloys as thecathode. Although expensive, silver cells have superior power-to-weight characteristics than theircompetitors. The most common of these batteries is the small button shaped silver oxide cell(approximately 35% silver by weight).The silver battery provides the higher voltages and long life required for quartz watches. In fact,over 1.4 billion silver oxide-zinc batteries are supplied to world markets yearly, including miniaturesized batteries for watches, cameras, and small electronic devices and larger batteries for toolsand commercial portable TV cameras.
BearingsSteel bearings electroplated with high purity silver have greater fatigue strength and load carryingcapacity than any other type and are hence used in various hi-tech and heavy-duty applications.It was a layer of silver on main shaft bearings of the 9,000 horsepower reciprocating engines ofthe World War II Superfortress that resolved the unacceptable failure rate of its giant engines.Silver, with its superior fatigue resistance, lubricity, corrosion resistance, and thermal conductivitycame to the rescue. Today's commercial and military jet engines deliver 35,000 to 100,000 pound thrusts under hightemperature conditions. Despite the far higher power and a far more rigorous internal environment, silver coated bearings continue to provide the superior performance and criticalmargin of safety for today's jet engines. The fan/compressor/turbine rotating components that push the air through the jet engine are all attached to the main shaft. This main shaft rotates on steel ball bearings that roll within steel retaining rings, called cages. Similar bearings are

required for the connecting gear boxes that drive accessories such as hydraulic pumps and fuel pumps; all rotate at much higher speeds than ground-based machinery. Steel has a poor coefficient of friction, but placing a layer of silverbetween the steel ball and the steel cage reduces the friction between the two to a minimum,increasing the performance of the engine and its accessories.
But silver also plays another critical role. Safety in jet engines is a paramount consideration.Failure of any one of the jet engine bearings would be catastrophic. Rolling contact bearings arelubricated and cooled with synthetic engine oil. In the event of an oil interruption, such as a pumpfailure, the silver plated bearings provide adequate lubricity to allow a safe engine shut-downbefore more serious damage can occur. To prepare for such a possibility, the U.S. FederalAviation Authority (FAA) and airplane manufacturers require fail-safe engine testing for thebearings. The test requires stopping the lubricating oil system for 15 seconds with the enginerunning at full power and then turning on the lubricating system, then turning off lubrication againfor 15 seconds, and repeat for four successive cycles. The dry lubricity of silver always allows jetengines to pass the tests.
The use of silver in high-performance bearings provides the wide margin of safety demanded byPratt & Whitney, General Electric, Rolls Royce, and all other producers of jet engines that powermodern aircraft.
Brazing and SolderingSilver facilitates the joining of materials (called brazing when done at temperatures above600oCelsius and soldering when below) and produces naturally smooth, leak-tight and corrosionresistant joints. Silver brazing alloys are used widely in applications ranging from air-conditioning and refrigeration equipment to power distribution equipment in the electrical engineering sector. It is also used in the automobile and aerospace industries. The unique combination of properties that silver provides has been important to plumbers, the manufacturers of appliances that use water, in electronics, and other manufacturing industries. Silver brazes and solders combine high tensile strength, ductility, thermal conductivity, with unusual wettability to most metals plus the added value of being bactericidal. Silver-tin solders are used for bonding copper pipe in homes not only to eliminate the use of lead-based solders, but to provide the piping with built-in antibacterial action. Major faucet manufacturers use silverbased bonding materials to incorporate all these advantages. Refrigerator manufacturers use silver-based bonding materials to provide the ductility required for constant changes in temperature of the cooling tubes providing the consumer with a long performing product. In combination with other metals, silver-based alloys provide a melting range from 143oC to over 1000oC. Silver alloys provide strong bonds for ceramic-to-ceramic joints (e.g., high-power radartubes), silicon chips to metallic surfaces (computers), and surface mounted electronic components soldered to printed circuit boards (all types of electronic devices). Silver's advantageous alloying and wetting properties are especially useful to hermetically seal together the components of electron power tubes such as the radar tubes now being installed at US

airfields to warn pilots of deadly wind shear, which can cause airplanes to crash. In 2000, 38 million ounces of silver were used for brazing and soldering.
CatalystsA catalyst is a metal or compound that enhances the efficiency of a chemical reaction withoutbecoming part of the reaction itself. The use of silver to act as a catalyst for the production offormaldehyde has been known since at least 1908. Only with the advent of modern analyticalmethods has the unique interaction between silver and oxygen been understood. This activity hasmade silver an essential catalyst for the production of formaldehyde with an estimated worldproduction exceeding 15 billion pounds per year, and ethylene oxide which exceeds 14 billionpounds per year. Both are used in making various plastics. It is the steadily growing demand forplastics, both hard and flexible, that drives the increasing use of silver catalysts.Silver, usually in the form of mesh screens but also as crystals, is used as a catalyst in numerouschemical reactions. Silver catalysts are particularly important in the production of formaldehydewhich is the building block for the production of adhesives, laminating resins for constructionplywood and particle board, finishes for paper and textiles, surface coatings including paints,dinnerware and buttons, casings for appliances, handles and knobs, packaging materials,automotive parts, thermal and electrical insulating materials, toys, Ethylene oxide is the chemicalintermediate for the production of polyester resins used to manufacture all types of clothing and agreat variety of specialty fabrics, molded items (such as insulating handles for stoves, key tops forcomputers, electrical control knobs, domestic appliance components, and electrical connectorhousings), and Mylar recording tape which makes up 100% of all audio, VCR, and other types ofrecording tapes. About 25% of ethylene oxide production is used to produce antifreeze forautomobiles and other types of vehicles. An additional 10% is used to produce cleaning andwetting agents, and the remaining 5% to make cleaning solvents.Silver is second only to gold with the weakest interaction with oxygen: silver cannot exist as anoxide over 200oC. In the production of the chemical intermediate ethylene oxide, silverdissociates molecular oxygen from the air and weakly holds onto the separated oxygen atomsuntil an ethylene gas molecule bumps against it. The free oxygen atom then reacts with theethylene gas to form ethylene oxide. The catalytic oxidation of ethylene to ethylene oxide isunique to silver.For the production of formaldehyde, the catalytic action of silver strips off the hydrogen from themethanol molecule leaving formaldehyde, a simple reaction.A worldwide inventory of some 23 million ounces of silver are in daily use for catalytic oxidation inchemical reactors.
ElectricalSilver is the best electrical conductor of all metals and is hence used in many electricalapplications, particularly in conductors, switches, contacts and fuses. Contacts, a junctionbetween two conductors that can be separated and through which a current can flow, account for

the largest proportion of electrical demand.When Samuel F. B. Morse tapped out, "What hath God wrought," on May 24, 1844, the contactpoints on his telegraph were silver. The high amperage required to push the signal over iron wiresfrom Baltimore to Washington, D.C., demanded a high capacity, non-corroding make/breakcontact; only silver could do he job. Ordinary household wall switches, which normally carry high electric current for electricalappliances from irons to refrigerators, use silver. Silver is the metal of choice for switch contactsbecause it does not corrode, which would result in overheating, which could lead to fire. The U.S.electric switch market is on the order of $1.5 billion per year.Today switch manufacturers play it safe by using high-performance silver for ordinary householdswitch and circuit breaker contacts. Less expensive metal contacts have high resistance whichcan overheat and cause a fire, says a major supplier of switch contacts. It is this consideration ofliability that assures the public of continued preference for silver in switch contacts. With anincreasing concern for quality, warranties become more important, and extended warrantiesmean that industry cannot chance even one failure in a million; that level of performance requiressilver.From the very beginning of electricity, silver has been the metal of choice for switch contactsbecause of its low contact resistance, high thermal conductivity, mechanical wear resistance,chemical stability (it does not corrode), low polymer formation (the build-up of an insulatingcarbon-polymer film over the contact as a consequence of arcing), and cost-effectiveness (itprovides the longest functional life). The US Department of Commerce, Bureau of Census(MA36K(96)-1) report shows 18 billion precious and other metal contacts were shipped in USduring 1996, with a value of $275 million."Silver's tendency to tarnish does not affect its electrical performance," says a report of a 20-yearexposure test of thousands of electrical contacts at 4,000 locations in different environmentsranging from business offices to severe industrial locations such as petroleum refineries. Thetests conducted by the Battelle-Columbus Laboratories, Columbus, OH, show that silver tarnishfilms are soft and readily wiped off with use; therefore in the field they perform well on tarnishbecause they are tough and offer high resistance. Films on other metals like copper, even whenthe corrosion is barely visible, cannot be tolerated.Over 50 categories of electrical components incorporating silver as the contact material are listedby The National Electrical Manufacturers Association, Washington, D.C. These range from silverthick films that are used to make membrane switches which carry 5 volts or less for electronicsystems, to large circuit breaker contacts required to interrupt or close the circuits of 75,000-voltpower distribution lines.The use of silver for motor control switches is universal. In the home, wall switches, timingdevices, thermostats, sump pumps, and virtually all electrical appliances use silver contacts. Atypical washing machine requires 16 silver contacts to control its electric motor, pump, and gearclutch. A fully-equipped automobile may have over 40 silver-tipped switches to start the engine,activate power steering, brakes, windows, mirrors, locks, and other electrical accessories.The household and general use switch market amounted to over 200 million units in 1996, with

automotive types an additional 290 million units (US Bureau of Census). The value of shipmentsof switches made in the USA of all types (except mercury) for 1996 was $1.6 billion (Bureau ofCensus). Relays are another important market for silver contacts. Relays are used when low voltageswitches (such as membrane switches) are used to activate considerably higher voltage oramperage switches. The increasing use of automated appliances has increased the number ofsilver contacts manufactured in the US. In 1996, the US Bureau of Census reported the US relaymarket to be $806 million.Electric motor control switches use the largest amount of silver for each contact. The US Bureauof Census reports this to be a $4 billion market. The range of applications is enormous, covering:washing machines, dryers, automobile accessories, vacuum cleaners, electric drills, elevators,escalators, machine tools, and so on up to railway locomotives and marine diesel engines. Silvercontacts start motors, set them to run forward or reverse, or at partial or full power. The silvercontacts carry electrical power ranging from a fraction of an ampere, for small appliances, to 600-ampere loads required for oil-well drilling motors; their performance is required to be flawless.Nearly half of the 20,000,000 troy ounces of silver consumed in the USA yearly for contacts andconductors is used for motor controls.The circuit breaker is the second major user of silver for contacts. For circuit breakers, silvercombines the highest heat conductivity and the highest electrical conductivity of all metals, withalmost unlimited performance. Circuit breakers are used to interrupt loads ranging from 10amperes (small household lines) to 4000 amperes (high-tension power lines). The USDepartment of Commerce, Bureau of Census reported that for 1996 the dollar value of shipmentsfor all circuit breakers was $1.6 billion.The circuit breaker is the most demanding use of silver contacts because the temperature of thearc generated by the interruption of high electrical power often exceeds the melting point of silver.As a consequence, silver is alloyed or infiltrated into other metals such as Tungsten to providelong-term performance.
ElectronicsIn electronics, silver is also widely used. Uses include silk-screened circuit paths, membraneswitches, electrically heated automobile windows, and conductive adhesives.Every time a home owner turns on a microwave oven, dishwasher, clothes washer, or televisionset, the action activates a switch with silver contacts that completes the required electrical circuit.The majority of the keyboards of desk-top and lap-top computers use silver membrane switches.These are found behind the buttons of control panels for cable television, telephones, microwaveovens, learning toys like touch and tell or speak and spell, and the keyboards of typewriters andcomputers. The low-current capacity of the membrane switch matches the low electrical currentused for digital electronics. In an office environment, membrane switches are normally rated for alife of 20 million cycles. Typically, the membrane switch is made of a conductive ink of silver

flakes in a polyester binder with carbon. This thick film is then silk-screened in an electrical circuitpattern onto each of two Mylar sheets. The two surface patterns of silver face each other closeenough so that gentle touch by a finger will make the electrical contact. A latching transistorcircuit is simultaneously activated to keep the circuit closed after the membrane is released. Today's electrical appliances, such as microwave ovens, are controlled by membrane switchpanels, where the contacts are silver. Membrane switch panels are found in automobiles andunder the keys of personal computers. Due to their reliability and wide use, the silver-contactmembrane switch market in the U.S. has grown to over $35 million.The use of silvered windshields in General Motor's all purpose vehicles reflects away some 70%of the solar energy that would otherwise enter the car, reducing the load on air conditioners insummer.A universal safety feature of every automobile produced in America, and most throughout theworld, is the silver-ceramic lines fired into the rear window. The heat generated by theseconductive paths is sufficient to clear the rear window of frost and ice.Printed circuit boards (PCBs) use silver in two ways: in solders for surface mounted components(see Brazing and Soldering) and for connecting paths of electronic circuitry.Epoxy resin/silver formulations provide very low viscosity (important in filling holes connectingcomponents) and higher silver content than is possible with other resins. Furthermore, silver-filledresins provide higher conductivity than copper systems, allowing smaller volume conductors andas well do not allow silver to migrate under any condition, which is not true of many other resinsystems.Du Pont’s laboratory studies have shown silver-epoxy thick films to provide a conductive networkof extended reliability, higher conductivity, improved solderability, and more rapid assembly overother metal formulations. And silver particulate fillers provide superior long-term performance inpolymer thick films. Copper, for example, is often unstable and deteriorates with age.The critical importance of printed circuitry boards in the electronics industry is shown by the valueof monolithic integrated circuits. The U.S. Bureau of Census reports U.S. shipments for 1999 tobe in excess of $10 billion. Printed circuit boards are essential to the electronics that control theoperation of aircraft, automobile engines, electrical appliances, security systems,telecommunication networks, mobile telephones, television receivers, etc.Giant magnetoresistance is a newly discovered magnetic property of multiple layeredsilver/nickel-iron alloy films, each about a millionth of an inch thick. These films are beingexploited by computer hard drive manufacturers. The films are potential candidates for the nextgeneration of read-out heads for personal computer storage systems.Not only do these new silver alloys exhibit extremely high changes in electrical resistance inresponse to infinitesimally small magnetic signals (hence the term giant magnetoresistance) butimportantly the films maintain their physical dimensions unchanged despite the rapidly changingmagnetic fields.Elsewhere, the combination of giant magnetoresistance with zero changes in dimension inmagnetostriction during recording head operations means that there is no unwanted shift in the

optimal sensing function of the read head held over the spinning magnetic field of a personalcomputer's hard drive. By avoiding dimensional changes during head operations, unwanted magnetic fields generated by the recording head are eliminated. This results in improved fidelityin the playback of data, music, and video recordings, and larger storage capacity. Also eliminatedis the expansion/contraction of the head that would limit its useful life.
ElectroplatingThe ease of electrodeposition of silver accounts for silver’s widespread use in coating. Theplating thickness of some items, such as fuse caps, is less than one micron although the silverthen tarnishes more easily. Coatings of two to seven microns are normal for heavy duty electricalequipment.Silver plating is used in a wide variety of applications from Christmas Tree ornaments to cutleryand hollowware.
Medical ApplicationsWhile silver's importance as a bactericide has been documented only since the late 1800s, itsuse in purification has been known throughout the ages. Early records indicate that thePhoenicians, for example, used silver vessels to keep water, wine and vinegar pure during theirlong voyages. In America, pioneers moving west put silver and copper coins in their water barrelsto keep it clean.In fact, "born with a silver spoon in his mouth" is not a reference to wealth, but to health. In theearly 18th century, babies who were fed with silver spoons were healthier than those fed withspoons made from other metals, and silver pacifiers found wide use in America because of theirbeneficial health effects.Silver also has a variety of uses in pharmaceuticals. In fact, silver sulfadiazine is the mostpowerful compound for burn treatment. It is used by every hospital in North America for burnvictims to kill bacteria and allow the body to naturally restore the burn area. It is used world-wide.It is sold under the trade name of Silvadiene. In another application polyurethane central venuscatheters impregnated with silver sulfadiazine and chlorhexidine to eliminate catheter-relatedbacteriemia are supplied by Arrow International, Reading, PA.In a world concerned with the spreading of virus and disease, silver is increasingly being tappedfor its bactericidal properties and used in treatments for conditions ranging from severe burns toLegionnaires Disease.
Mirrors and Other CoatingsSilver’s unique optical reflectivity, and its property of being virtually 100 % reflective afterpolishing, allows it to be used both in mirrors and in coatings for glass, cellophane or metals.Everyone is accustomed to silvered mirrors. What is new is invisible silver, a transparent coatingof silver on double pane thermal windows. This coating not only rejects the hot summer sun, but

also reflects inward internal house heat. A new double layer of silver on glass marketed as "low Esquared" is sweeping the window market as it reflects away almost 95% of the hot rays of thesun, creating a new level of household energy savings. Over 250 million square feet of silvercoatedglass is used for domestic windows in the U.S. yearly and much more for silver coatedpolyester sheet for retrofitting windows. One out of every seven pairs of prescription eyeglasses sold in the U.S. incorporates silver. Silverhalide crystals, melted into glass can change the light transmission from 96% to 22% in less than60 seconds and block at least 97% of the sun's ultraviolet rays. The change is endlesslyreversible.
PhotographyThe photographic process is based on the presence of lightsensitive silver halide crystals,prepared by mixing a solution of soluble silver, usually silver nitrate, with a soluble alkali metalhalide such as sodium chloride or potassium bromide. These grains are then suspended in theunexposed film. The effect of light on the silver halide disturbs the structure of this compound,rendering it selectively reducible to metallic silver by reducing agents called developers. Theresulting negative image is converted to the positive by repeating the process under specificconditions. Photographic film is used in radiography, the graphic arts and in consumerphotography. Photographic film manufacturers demand very high quality silver.When Joseph Nicephore Niepce created the first photographic image obtained through a cameralikedevice in 1813, it was silver nitrate that made it possible.The photographic process is based on the presence of silver halide crystals suspended on anunexposed film, which, when exposed to light, are set in such a way that they are selectivelyreducible to metallic silver by agents called developers. Approximately 5,000 color photographscan be taken using one ounce of silver.Although a wide variety of other technology is available, silver-based photography will retain itspre-eminence due to its superior definition and low cost. From it's very outset, silver halide hasbeen the material that records what is to be seen in the photograph. As little as 4 photons of lightactivate silver halides which amplify that incident light by a factor of one billion times. In today'sphotography, silver halides are coupled with dyes that bring the color of the world around us intopermanent record. An estimated 230 million troy ounces of silver were used worldwide in 2000 forphotographic purpose.William Conrad Roentgen's discovery of x-rays in 1895, led to his discovery that they activatesilver halide crystals. This revolutionized medical diagnosis. Radiographic use of silver worldwideconsumed 78 million troy ounces in 2000.

Today, X-ray inspection is also essential to ensure integrity of metallic castings from small truckaxles to the huge aircraft-carrier steam valves used to propel airplanes from a flight deck. Of allthe inspection techniques, it is the image on a silver halide x-ray film that provides the clearestindication of flaws deep within metallic components.Non-destructive x-ray testing is a critical element in product approval, ensuring the safety of alltypes of transportation conveyances from ships to aircraft. It remains the most effective way toreveal flaws in metallic components. The continuing requirement for the specially-sensitized silverhalide film in which metallic flaws leave their identifiable signatures that can be compared withstandard photographs will assure silver's continued preeminence for this essential quality controltechnique. Silver plays an additional role in the x-ray tube itself. The x-ray generator is encased in a glassenvelope sealed to its metallic base with a silver-alloy braze. Silver securely wets both the glassand the metallic base, providing a secure hermetic seal which will withstand rapid heating andcooling of the tube during exposures which may range from 30 seconds to 15 minutes.
Solar EnergySilver paste is used in 90 percent of all crystalline silicon photovoltaic cells, which are the mostcommon solar cell, says Jeffrey Mazur, a semiconductor engineer in the Photovoltaic TechnologyDivision of the U.S. Department of Energy. And all silicon cells used in space to power satellitesuse silver in the form of evaporated metal to make the electrical contact.The electricity generated by photovoltaic cells is highly reliable. As soon as sunlight strikes,power begins to flow. Sunlight striking silicon cells generates electrons, which the silverconductors collect to become a useful electric current. The conductive silver, which alsoenhances reflection of the sunlight, is applied in the form of a glass paste with a minimum of 90percent silver along the top and across the bottom of the silicon crystal. When fired, the silverforms a complete circuit collecting solar energy and conducting it to the power supply line. Agroup of roofing-tile solar cells can generate sufficient power to provide a house and also fillbatteries to supply power after dark.Silver plays yet another role in the collection of solar energy: efficient reflection of solar heat.Silver is the best reflector of thermal energy (after gold).Near Barstow, California, 1,926 silver-coated mirrors reflect solar heat onto black-coatedstainless steel tubes atop a 300-foot tower. This heats the tubes and the nitrate salt inside themto over 1050oF. The scalding hot salt is then piped to boilers turning water to steam which drivessteam turbines geared to electric generators. They now generate sufficient electricity to power10,000 homes.Designated Solar Two, it is the most advanced solar power plant in the world. It incorporates theresearch into solar reflective technology conducted since 1982 by the Sandia NationalLaboratories, DOE, Sandia, NM, and the Southern California Edison Company, Irwindale, CA.
Water PurificationSilver is employed as a bactericide and algaecide in an ever increasing number of water

purification systems in hospitals, remote communities and, more recently, domestic households.Silver ions have been used to purify drinking water and swimming pool water for generations.New research into silver compounds is providing physicians with powerful, clinically effectivetreatments against which bacteria cannot develop resistance.An increasing trend is the millions of on-the-counter and under-the-counter water purifiers that aresold each year in the United States to rid drinking water of bacteria, chlorine, trihalomethanes,lead, particulates, and odor. Here silver is used to prevent the buildup of bacteria and algae in thefilters. Of the over $3.5 billion spent yearly in the U.S. for drinking water purification systems, overhalf make advantageous use of the bactericidal properties of silver. New research has shown thatthe catalytic action of silver, in concert with oxygen, provides a powerful sanitizer, virtuallyeliminating the need for the use of corrosive chlorine.
New Uses of Silver
A critical issue for silver moving forward is that it must maintain and, in fact, increase itscompetitive position in industrial applications. At present, one quarter of annual silverconsumption is in photography, and this is of course being threatened by the growth in digitaltechnology.On the industrial front, several potential growth areas exist for silver. They are based on silver’sstrengths as a catalyst, as a biocide and for conducting and storing electricity.Fuel cells offer a medium to long-term option for power generation, particularly in motor vehicles.At present, the fuel cell development path for use in vehicles is centered on proton exchangemembrane (PEM) cells and alkaline-based cells. The latter are of interest because they havevarious technical and cost advantages over PEM cells, including being able to usenon-platinum catalysts such as silver. It should be noted thought that the most promisingresearch is currently focused on platinum based fuel cells. However, the US government hasrecently proposed legislation that provides for a federally funded three year study into the use ofsilver and gold as catalysts for automotive and industrial uses.The anti-bacterial properties of silver are well documented. However, it is only recently thatimprovement in nano-particle research and production techniques have enabled morewidespread use of silver as a biocide and anti-bacterial agent. For instance, Samsung announcedin March this year that it has introduced a “silver sterilization clothes washing machine”, targetedfor domestic use. The machines incorporate nano-silver particles that kill 99.9% of bacteriawithout having to boil the water, thus providing both health and power efficiency benefits. Also,silver biocides may be able to replace arsenic and other chemical based preservatives in wood aswell as being incorporated into marine anti-fouling coatings.Gold use in electronics (bonding wires, plating) has been and is continuing to be replaced ongrounds of cost and silver is often the main candidate to act as a substitute. This will becomemore prevalent as lower cost, mass-produced consumer products Incorporate some sort of logiccontrol and data storage. Of course, other materials such as copper, aluminum and ceramics arealso in competition with silver.

High temperature superconductor wires, combining a ceramic core with a silver sheath, havebeen developed for use in new power generation plants and distribution grids. The wires are veryefficient in carrying electricity and widespread usage could see many millions of ounces used inthis application alone.

Table 14: Million ounces


Table 17: All India Monsoon Rainfall(rainfall % of normal)

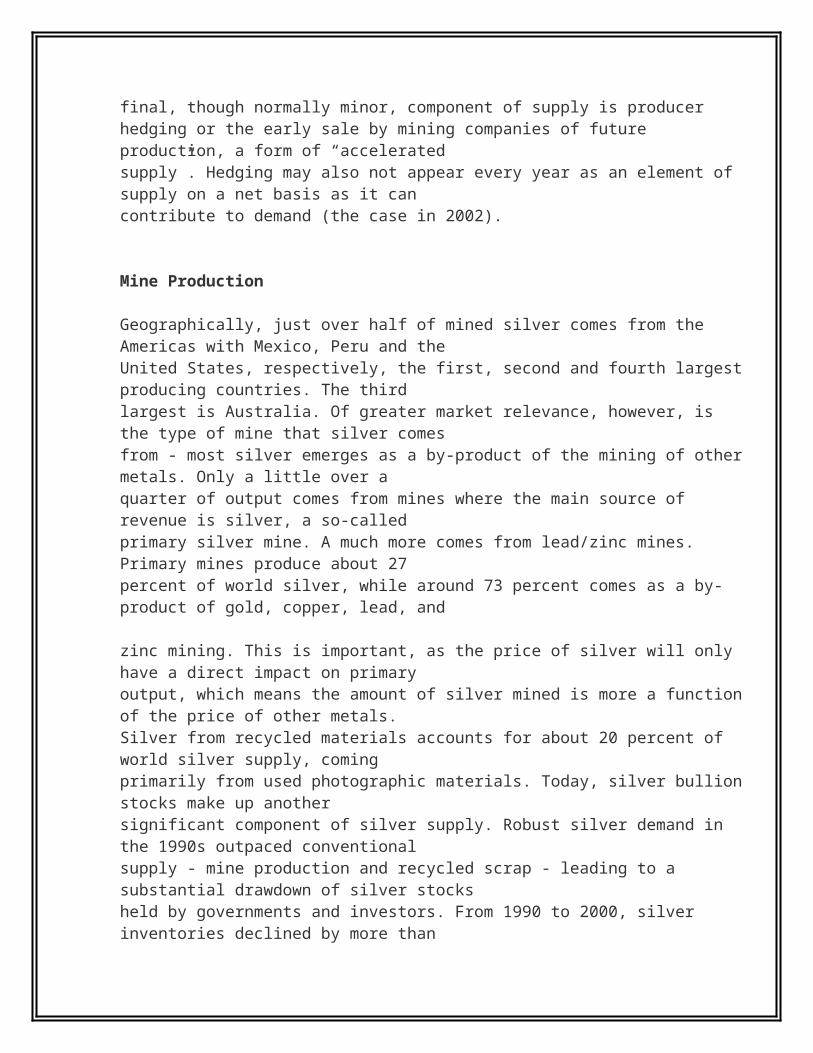

3) CRUDE OIL:
Energy & Economy
Oil and gas are of paramount importance in economies worldwide. There is hardly a nation thatdoes not seek this indispensable natural resource. A country that already possesses oil wantsmore. Nations struggle to explore for oil, and import it at almost any cost. It is also an importantcontributor to the export realisations of many countries. In countries like Russia, nearly half thehard currency earnings come from crude oil exports. The figure rises to about 80% for Venezuelaand 95% for Nigeria and Algeria. Oil has many applications and without it almost nothing in themodern world will move. Transport by rail, road, sea or air is largely dependent on oil. The wheelsof industry need oil, and agriculture cannot progress without sufficient supplies of oil and itsproducts. Without oil or its close associate, natural gas, urban domestic life will becomemiserable. Oil light homes and streets and serves as a fuel for cooking. In cold countries, oil orgas is needed for heating homes. Metals are being progressively replaced by plastic, a product ofoil, and artificial fibres have made inroads into the domain of cotton. Even villagers in developingcountries know that metal pots and pans are getting replaced by plastic ones, and clothes made

from synthetic fibres are more durable. A wide range of chemical fertilizers and pesticides isderived from oil. The indispensable ropes for agriculture and fishing, hitherto made from jute, arenow being made from plastics. A wide range of chemicals, medicines and toiletry items comesfrom oil. In spite of these varied and multiple applications, the common man has a very hazy ideaof where all these products come from and an even hazier idea as to in what all ways theseproducts undergo changes to meet our everyday requirements.
The importance of the oil & gas sector is perhaps best explained in terms of the economic effectsthat oil supply disruptions have. Oil price shocks accompanying supply disruptions have hurt anumber of economies and have been a major cause of inflation and recession, as was the case inthe 1970s. The economic impact of oil supply disruptions in terms of increased inflation andunemployment, and reduced economic growth can be so severe as to result in a loss of grossdomestic product (GDP), mostly because of lost investments. Significantly, the oil shocks in 1973and 1979 had caused significant disruptions to world economies.
The oil price rise in both the earlier crises was large enough to cause a worldwide recession anda significant decline in global economic activity. For instance, during the 1973 oil shock, GDPdeclined for the US, Europe and Japan by 4.7%, 2.5% and 7%, respectively. Similarly, in the1979 oil shock, world GDP declined by 3%. The high oil prices since 2000-01 are expected tohave a negative impact on world economic growth.
However, the impact is not expected to be that severe, as the role of oil in the world economy hasdiminished over the years. Further, the oil price at over US$30/bbl (in September 2000) was onlyhalf the price in 1980, in real terms. Accordingly, the International Monetary Fund (IMF) hadestimated in 2000-2001 that sustained oil prices of US$30/bbl will reduce the world GDP growthrate by 0.3% and increase inflation by 0.6%. However, energy intensive developing countries (likeIndia) with limited oil reserves could be expected to have a tough time.
Similarly, low oil prices also have a negative impact. When oil prices fell to historic lows in 1998—in real terms they were lower than the 1973 level—the revenues of the OPEC members plungedto about US$100 bn., only one-fifth of their 1998 revenues in real terms. Oil price movementshave also had effects on the financial performance of oil companies. The six biggest American oilfirms posted grim fourth quarter results for 1998: their after-tax profits fell by 90%, or US$4.8 bn.,compared with the same quarter a year earlier.
There are two ways in which oil shocks weaken a nation’s economy: through direct (or wealthtransfer) costs and indirect (or adjustment) costs. The economy bears direct costs when the risingprices of imported oil cause a transfer of income from the consuming to the producing nations.

The indirect costs are caused by the rise in the price of oil relative to other production input (sinceoil is primarily a raw material used to produce other higher value added products). Supplydisruptions raise oil costs, reducing the profit- maximising output of oil-using firms and thereby lowering GDP. As GDP shrinks the demand for labour and non-energy inputs declines, furtherincreasing unemployment.
There is a strong linkage between GDP and energy consumption (of which oil and gas are majorcomponents), and with the exception of only two periods—1974-1975 (after the 1973 crisis) and1980-1982 (after the 1979-1980 crisis) energy and the economy have followed a similar path ofprogress.
Energy Consumption and Components
The per capita primary energy consumption in India is a low 305 kg against the world average of1,487 kg. Accordingly, with a total primary energy consumption of 314.7 million metric tonnes ofoil equivalent (MMTOE), India accounts for just 3.4% of the total world primary energyconsumption. However, at this stage, the point to note is that while the consumption of primaryenergy in the world grew at a low compounded annual growth rate (CAGR) of 1.1% during 1991-2001, it experienced a higher growth of 4.3% in India. The world primary energy consumptionshowed a higher growth rate of 3.1% per annum during the 1970s before declining to the currentlevel.
The decline in the growth rate is due to technological advances and process improvements thatimprove fuel efficiency. These efficiency gains are apparent in items as diverse as automobiles,airplanes, household electrical goods, power plants and manufacturing equipment.Oil, gas, hydroelectricity, nuclear power and coal are the five constituents of primary energy. Oiland gas account for 62.2% of the total world primary energy consumption. This figure is higher at64.8% for developed nations like the US. In India, coal is the principle source of energyaccounting for over 55% of the total primary energy consumption.
However, the share of oil & gas has increased from 34.8% in 1991 to the current level of 38.4%.The reasons for the growing importance of oil and gas are to be found in their multiple, varied andcost-effective applications. Further, other factors such as environmental problems (in the case ofcoal and nuclear energy), difficulty in handling (coal), higher capital costs, and limitation tospecific geographic regions (hydroelectricity) have restricted growth in the use of other forms ofenergy.
As per the Hydrocarbon Vision 2025, the share of oil & gas in the primary energy is expected toincrease to 45% by the year 2025. While, the share of oil would be 25%, the share of gas wouldbe to 20%. Growth in share of gas would largely be dictated by environmental reasons coupledwith efficiency factors. As in the case of per capita primary energy consumption, the per capita

consumption of oil & gas in India is also a low 117 kg against the world average of 925 kg. Thus,the growth in primary energy consumption, the increasing share of oil & gas in the primary energyconsumption, and the low per capita consumption of oil & gas are indicative of an enormouspotential for growth in the demand for oil & gas in India.
Crude
Crude or crude oil is a mixture of hydrocarbons that exists in a liquid phase in naturalunderground reservoirs. It remains liquid at atmospheric pressure after passing through surfaceseparating facilities. Production volumes reported as crude oil include:Liquids technically defined as crude oil;Small amounts of hydrocarbons that exist in the gaseous phase in natural undergroundreservoirs, but which are liquid at atmospheric pressure after being recovered from oil well(casing head) gas in lease separators;Small amounts of non-hydrocarbons produced with the oil.See annexure for detail(Hereunder if nothing is mentioned then oil or crude both refer to Crude Oil)
Products derived from crude
In India, following items are produced form crude oil,Light distillates (includes LPG, Mogas, Naptha, LD i.e.Propylene, C-3, Propane, Hexane,Special Boiling Point Spirit, Benzene, Toluene, Petroleum Hydro Carbon Solvent, NaturalHeptane, Methyl Tertiary Butyl Ether, Poly Isobutine, PBFS and MEKFS)Middle distillates (includes Kerosen, ATF, RTF, Jet A-1, HSD, LDO, MD i.e MineralTurpentine Oil, JP-5, Linear Alkyl Benzene Feed Stock, Aromex, Jute Batching Oil, Solvent1425, Low Sulphur Heavy fuel HSD, DHCB and Special Kerosene)Heavy ends (includes Furnace oil, LSHS, HHS, RFO, Lube oils, Bitumen, Petroleum coke,Paraffin wax, other waxes etc.)
There are in fact many products obtained from the processing of crude oil, and other hydrocarboncompounds. These include aviation gasoline, motor gasoline, naphtha, kerosene, jet fuel,distillate fuel oil, residual fuel oil, liquefied petroleum gas, lubricants, paraffin wax, petroleumcoke, asphalt and other products. Following are some of the products; -
Gasoline: a mixture of relatively volatile hydrocarbons, with or without small quantities ofadditives, that have been blended to form a fuel suitable for use in internal combustion engines;includes gasoline used in aviation.
Kerosene: medium hydrocarbon distillates in the 150° to 280° C distillation range, and used as aheating fuel as well as for certain types of internal combustion engine; includes jet fuel, which is a
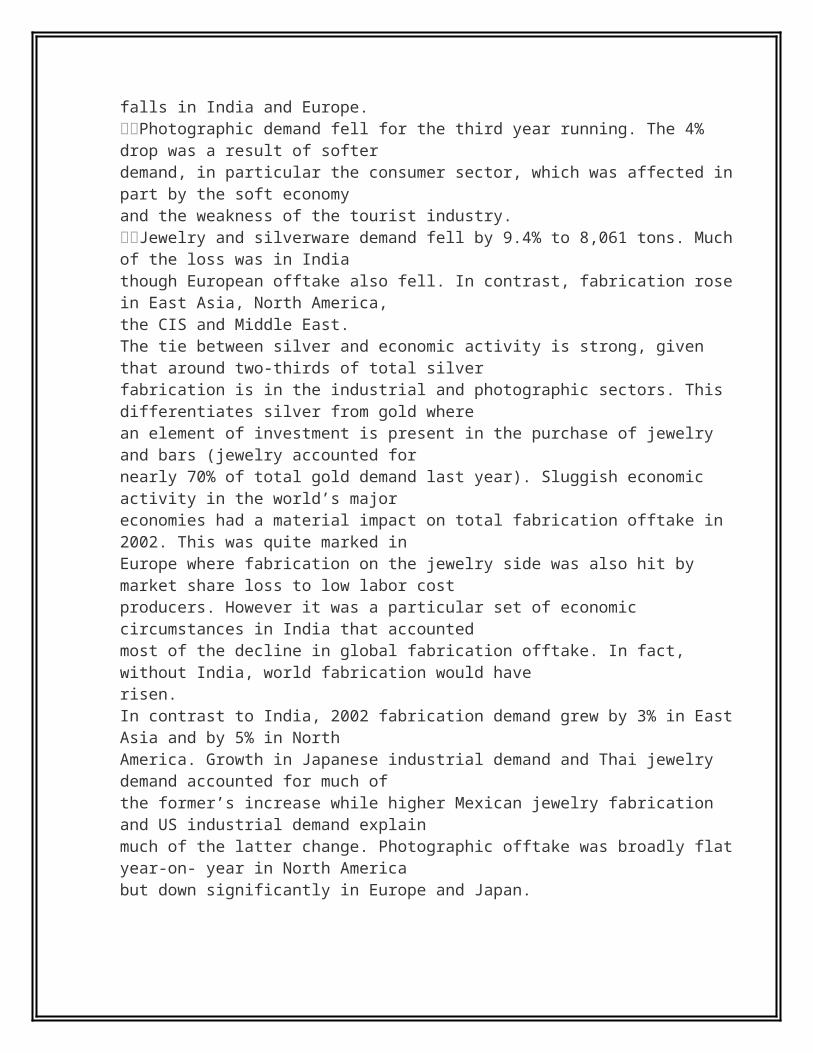
fuel of naphtha, or of kerosene type, suitable for commercial or military purposes in aircraftturbine engines.
Distillates: middle distillate type of hydrocarbons. Included are products similar to number oneand number two heating oils and diesel fuels. These products are used for space heating, dieselengine fuel and electrical power generation.
Residual fuel oil: these are fuels obtained as liquid still bottoms from the distillation of crude usedalone or in blends with heavy liquids from other refinery process operations. It is used for thegeneration of electric power, space heating, vessel bunkering and various industrial purposes.
Oil units
Facts
WorldBalance recoverable reserve is about 142.7 billion tones 2002, of which OPEC is 112 billiontonnesProduction is about 3557 million tones 2002, of which OPEC is 1384 million tonesRefinery capacity is about (2002) 4166 mn tones/ year
IndiaBalance recoverable reserve is about 733 million tones 2003, of which offshore is 394 mntones and on shore is 339 million tonnesProduction of crude oil in 2002-03 is 33.04 million tonesImport of crude oil 81.99 mn tones valued at Rs 761.95 billion (02-03)Crude oil produced onshore in Gujrat, Assam, Nagaland, Arunachal Pradesh, Tamil Nadu,Andhra Pradesh.

Historical background of IndiaThe history of the oil sector in India dates back to the late 19th century, when oil was first struckat Digboi in Assam in 1889. In the subsequent period, till the 1960s, oil exploration andproduction activities were largely confined to the North-Eastern region. The daily crude oilproduction then averaged 5,000 barrels per day. The later discovery of the Cambay onshorebasin (in 1958) and the Bombay offshore basin (in 1974) enhanced the production to the currentlevel of 0.7 mn. barrels per day (mbd). In the downstream sector, the first refinery was set up atDigboi in 1901. However, new capacities were added only in the late 1950s-early 1960s byinternational majors such as Shell, Caltex, and Esso. Refineries were also set up by theGovernment in the 1960s. Although the exploration and production activities were dominantlyunder Government control, the nationalisation of both the upstream and downstream sectors wasinitiated after the Oil Shock of 1970s and completed on October 14, 1981. As a result, theinternational oil companies withdrew from India. Following nationalisation, controls were imposedby the Government on the pricing and distribution of crude oil and petroleum products in India.
International scenario
Upstream OilThe upstream oil sector is an international market, with investment and operational decisionsincreasingly determined against world norms, heavily influenced by both the current world oilprice and anticipated price for its impact on new field developments. The volatility of the oil pricehas led to changes in the structure of the oil sector, encompassing both the oil companies andtheir various contractors. In particular there has been consolidation both horizontally and verticallyin the traditional contracting supply chain.In recent years the continued pressures on costs has encouraged sharing of responsibilitiesbetween the oil companies and their major contractors. Over 1998 / 1999 there was a severereduction in oil price, especially when viewed in real terms. Increases in the oil price since theend of 1999 have improved the cash flow for oil companies and a stable recovery in activity isunderway. Continued world economic growth, particularly assuming there are no major downturns in world regions (as in Russia and SE Asia in 1998 / 1999), will lead to increaseddemand for oil. With limitations on the spare production capacity available world-wide at present,increased world demand will certainly require increased development activity in both OPEC andnon-OPEC countries. Thus it is expected that world investment in exploration and productionfacilities will rise.
The level of activity in any one country is influenced generally by the expectation on oil price, andlocal conditions reflecting the country's competitive position with respect to others. Localconditions generally, the attractiveness of the oil province geologically (indicated perhaps byrecent discovery rates and size of discovered fields), legislation affecting conditions and taxation

on developments, and the confidence in political system and proximity to markets are all factorsto be taken into account.
Downstream OilThere is a long term trend of refineries being built more in developing and petroleum producingcountries and away from developed, consuming, countries, as producers seek to increase theiradded value and developing countries seek to reduce their dependence on imports. Thedeveloped world's refineries operated efficiently and profitably while oil prices were low (cheapfeedstock) and supply readily available. Subsequently, with tight oil supplies, higher feedstockprices and pressure from consumers on prices, they are operating less profitably. However,refineries in other parts of the world, especially SE Asia, have suffered from low demand in recentyears, leading to continuing low margins.Demand for new refineries is limited, generally driven by national policies on adding value withproducts from crude oil, or meeting national demand for refined products from indigenousproduction capacity. However, there is an ongoing requirement for the upgrading of refineries toimprove and revise the product mix and to meet more exacting environmental standards. Thedemands for different products in the automobile sector are an important driver in this.
Worldwide trends in the various issues related to primary energy, oil, andrefinery activities:
Primary Energy: -The stagnation in the World Primary Energy Consumption (WPEC) during the 1990s is aresult of two opposing factors: consumption gains in North America and the emergingmarkets on the one hand, and the collapse of the Former Soviet Union (FSU) and theSouth-East Asian crises on the other. However, despite this stagnation, the currentconsumption is over 1.5 times the figure for the early 1970s. Oil and gas account for thebulk of WPEC. While gas has witnessed an increase in its share in WPEC, the share of oilhas remained more or less stable during the last decade. The WPEC is marked withregional disparities. Oil is the principal component of primary energy in the Middle East,South and Central America, North America, Europe and Africa. In the Asia-Pacific region,coal is a major component of primary energy. The relatively low Reserve to Productionratio (R/P) of oil & gas (as compared with coal) demands technical innovations in E&Pactivities for enhancing new discoveries so that these fuel sources last longer.
Oil: -The Organization of Petroleum Exporting Countries (OPEC), with a 76% share of world oilreserves, accounts for just around 40% of the world oil production.The relatively low production share of OPEC nations is due to several reasons. By nationalizingtheir oil industries and doing their best through the OPEC cartel to keep prices high in the 1970sand 1980s, they encouraged oil development elsewhere. With oil so profitable, prospectors

searched inhospitable parts of the world. The perverse result is that high-cost regions (such asthe North Sea) have been exploited before low-cost ones (such as Iran). Technologicaladvancements have lowered the cost of finding, developing and producing crude oil in real termsin countries outside the Middle East from more than US$25/bbl in the early 1980s to belowUS$10/bbl. This has led to emergence of low-cost oil producers in different parts of the world.While, the OPEC nations still have the lowest break even point for oil production (US$2/bbl for theMiddle East, US$7/bbl for Nigeria and Venezuela, US$6/bbl for Indonesia), other places such asMexico (US$10/bbl) and North Sea (US$11/bbl) are also emerging as low-cost oil producers. Theimplication of this is that if oil prices are not dictated by politics and cartel behavior anddetermined more by geology and cost of production, then the consumers worldwide may see anera of low oil prices. Friction among OPEC members to sustain production cuts and expansion ofoil supplies by the low-cost non- OPEC nations are the factors that may lead to price falls.
North America and FSU are the next largest producers after OPEC. On the consumptionfront, North America and Asia-Pacific are the major consumers of oil. The world demandfor oil has largely been dictated by the demand in the Asia-Pacific region during the pastfew years. The world consumption, trade and prices of oil declined sharply in 1998following the decline in oil demand in the Asia-Pacific region because of the South EastAsian crisis. In fact, the prices of crude and products fell to a 10-year low in 1998.Agreements among OPEC nations to cut production resulted in oil prices firming up fromthe second quarter of 1999. This price rise was sustained till 2000, with the OPECmembers agreeing to regulate oil supplies so as to maintain it within a band of US$22-US28/bbl. Prices, however, declined by around 15% in 2001 and touched the lower end ofthis band, following a deterioration in the world economic conditions led by the weak USeconomy and the September 11 attacks. The prices, however, started increasing in Q22002 onwards, following fears of US military attacks on Iraq. This upward movement got afurther fillip in December 2002 following suspension of oil production in Venezuela (whichaccounts for approximately 3.5% of global production) due to countrywide strike coupledwith OPEC’s resolution to limit production level at 23 million barrels per day startingJanuary 2003. Recovery of the worldwide economic conditions coupled with expansion ofsupplies by low cost non-OPEC nations would, however, be factors, which may prevent ofprice rise.
Substantial differences exist in the pattern of oil product consumption across nations because ofdisparities in economic development, local preferences and government policies.Refineries, capacity distribution: -
North America and the Asia-Pacific region account for the largest share of the world’srefining capacity. Asia-Pacific has experienced the highest growth in refining capacityadditions during the last decade. In fact, while the world refining capacity has increasedby around 9% during the past decade, the refining capacity in Asia Pacific has grown byalmost 51%. Although the world average for refinery capacity utilisation was 85% in 2001,there are considerable regional disparities. Currently, refineries worldwide are focusing onintegrating their operations with upstream exploration and downstream marketing

functions, and increasing their complexity levels to achieve higher and more stablemargins.
Refinery conversion capacity, the plant and equipment used to increase production of lighterproducts from a given amount of crude oil, is expanding rapidly. This capacity expansion hasbeen considered necessary for meeting the demand for lighter products, primarily transportationfuels. Total crude capacity on January 1, 2002 was around 1.45 mn. barrels per day (bpd) morethan the start of 1980, but catalytic cracking capacity, used to increase the gasoline yield from abarrel of crude oil, increased by 5.9 mbd over the same period. Similarly, thermal operationsincreased by 5.2 mbd and catalytic reforming increased by 2.5 mbd. Rise in conversion capacityis also shown in the chart above. Refineries in North America remained among the mostsophisticated, based on the ratio of upgrading capacity to total crude oil throughput capacity. Asof January 1, 2002, catalytic cracking, catalytic reforming and thermal operations combined wereequal to 55.4% of crude capacity. In comparison, the world average figure was 35.3% as against23.5% in 1980.
Internationally, the margins for both refining and marketing have shown an erratic behavior.However, higher marketing margins have always supported lower refining margins. This is apointer towards the relative lower earnings of a pure refining company in a fully deregulatedmarket. During the 1990s, the refining margins in the US have been relatively higher than those inEurope. This is primarily because of the demand-supply situation there. While a surplus in theEuropean market translated into a lower refining margin, a deficit in the US market resulted inincreased reliance on imported products, and hence the higher prices and margins. Here, it isimportant to point out the behaviour of margins of a complex refinery versus those of a simplerefinery. As can be observed, the cracking (primary distillation of crude with secondaryprocessing) margins tend to show greater resilience in a depressed market and tend to be higherthan the hydroskimming (that is, primary distillation of crude without secondary processing)margins under all situations. This is true of other markets also.
About OPEC
The Organization of Petroleum Exporting Countries (OPEC) was founded in Baghdad, Iraq,in September 1960, to unify and coordinate members' petroleum policies. OPEC members'national oil ministers meet regularly to discuss prices and, since 1982, to set crude oilproduction quotas. Original OPEC members include Iran, Iraq, Kuwait, Saudi Arabia, andVenezuela. Between 1960 and 1975, the organization expanded to include Qatar (1961),Indonesia (1962), Libya (1962), the United Arab Emirates (1967), Algeria (1969), and Nigeria(1971). Ecuador and Gabon were members of OPEC, but Ecuador withdrew in December1992, and Gabon followed suit in January 1995. Although Iraq remains a member of OPEC,Iraqi production has not been a part of any OPEC quota agreements since March 1998. EIAestimates the current eleven OPEC members account for almost 40% of world oilproduction and about 2/3 of the world's proven oil reserves.

Production of OPEC countries
OPEC price band
OPEC collects pricing data on a "basket" of seven crude oils, including: Algeria's Saharan Blend,Indonesia Minas, Nigeria Bonny Light, Saudi Arabia Arab Dubai Fateh, Venezuela Tia Juana andMexico Isthmus (a non-OPEC oil). The OPEC price — which was introduced on January 1, 1987—is an arithmetic average of these oils. OPEC uses this price to monitor world oil marketconditions. Because the U.S. benchmark West Texas Intermediate (WTI) crude oil is a very light,sweet (low sulfur content) crude, it is generally more expensive than the OPEC basket, which isan average of light sweet crude oils such as Algeria's Saharan Blend and heavier sour crudes(with high sulfur content) such as Dubai's Fateh. Brent is also lighter, sweeter, and moreexpensive than the OPEC basket, although less so than WTI.
At its March 2000 meeting, OPEC set up a price band mechanism, triggered by the OPEC basketprice, to respond to changes in world oil market conditions. According to the price bandmechanism, OPEC basket prices above $28 per barrel for 20 consecutive trading days or below$22 per barrel for 10 consecutive trading days would result in production adjustments. Thisadjustment was originally automatic, but OPEC members changed this so that they could finetuneproduction adjustments at their discretion. Since its inception, the informal price bandmechanism has been activated only once. On October 31, 2000, OPEC activated the mechanism

to increase aggregate OPEC production quotas by 500,000 barrels per day.
Indian scenarioThe Indian oil sector has historically been a regulated one dominated by Governmentundertakings. However, with the Government loosening its control, new private sectorplayers are now gaining presence. Unlike the international oil majors which haveintegrated operations along the energy value chain, the Indian oil sector has companiesoperating in three distinct sub-segments: Oil & Gas Exploration and Production (E&P), OilRefining and marketing of refined products (R&M) and, Distribution of Natural Gas. Thevarious players in each of these sub-sectors are listed in the figure below.
Reserves
The total resource base of oil and gas is the entire volume formed and trapped in-place within theEarth before any production. The largest portion of this base is non-recoverable by current orforeseeable technology. This inability is either because of unfavourable economics, or intractablephysical forces, or a combination of both. At the next level, the recoverable resources are dividedinto discovered and undiscovered segments. In India reserves are classified as (a) rognosticated

(which is basically all the resources "expected" to be contained), (b) geological or in-place whichis discovered resources but not recoverable and (c) balance recoverable reserves.The total proven reserves on natural gas in India as at the end of FY2002 was about 750 billioncubic metres. The giant gas discovery in the KG baisn resulted in the reserves at the end ofFY2003 increase to 920 billion cubic metres (mcm). The total gas production in India was about31,400 mcm in 2002-03 compared with 2,358 mcm in 1980-81. At this production level, India'sreserves are likely to last for around 29 years; that is significantly longer than the 19 yearsestimated for oil reserves.
Indian sales & consumption:

Indian pricing policy
Needless to mention that crude influences the economy in many ways. Not only it directly affectthe manufacturing industry but also affects one’s personal disposable income in real terms.India is almost a free market economy now, unlike even a decade back. The Indian oil industryhas been deregulated, the oil prices decontrolled (supposedly). The critics cry foul – deregulationwith government dictating price lines? The poor common man wonders what’s in store for himnext.Let’s look at the facts.
First, with about 80% import dependence, we cannot afford to divorce domestic retail prices frominternational oil prices. Buying crude at high prices and selling products processed from that verycrude at artificially low retail prices is just not sustainable. Prices have to reflect costs.
Second, price volatility in international oil markets is today a norm, rather than the exception.There are just too many factors influencing oil prices – Organisation of Petroleum ExportingCountries (OPEC) decisions; conflicts in the Middle East; US crude stock levels; the harshness ofthe European winters; and so on and so forth.
Third, the erstwhile-administered pricing mechanism (APM) protected the Indian consumer fromthe ups and downs in the global markets through the oil pool. The pool absorbed the volatility andkept retail prices stagnant. In April 2002, however, the APM for the oil industry was dismantled.

The oil pool is now defunct. Save the government directive to oil companies to hold price lines forsome time, the common man would have already been fully exposed to the vagaries of the globaloil markets. Lastly, it must be borne in mind that the said directive, is at best, temporary.
Distilling the facts, it follows, that eventually domestic retail prices will start reflecting internationaloil prices. In fact it does reflect the same. The best way to analyse the system is to consider it intwo distinct segments – refining and marketing, even while considering prices offered by onesingle company. The refining division would procure crude from international markets; process it;and transfer products to the marketing division at the refinery gate. Margins in the refiningindustry are embedded in the inherent crude and product price differentials in international oilmarkets. The transfer price for products at the refinery gate thus reflects international productprices, what is typically referred to as the import parity price of that product. Deregulation to thiseffect, i.e., affecting refinery purchases and receivables at import parity prices, actually took placeway back in April 1998 itself. This refinery gate price, essentially, becomes the base price for the final consumer. Added to thisare distribution costs; excise duties; sales tax and other local levies; and finally the marketingmargin. The only variable element in this entire list of mark ups is the marketing margin, andhence, it becomes one of the most crucial elements in price fixation in a deregulatedenvironment. Under the APM, marketing margins were decided by the government in relation tothe net worth of the companies, and reimbursed through the oil pool. An important point to note isthat the margin was fixed and was not adjusted from a month-to-month basis as done for therefinery gate product prices. (Actually there are daily variations in prices in international oilmarkets, but in India these were averaged out over a period for simplification and administrativeease). It is this system which changes with the now announced full deregulation of the industry. Ina deregulated environment, market prices would be driven by competition. In mature markets inthe West for instance, pump prices of one company differ from that of another. Oil companies viefor market share through aggressive stands on marketing margins. In addition, there are weekly/fortnightly price revisions. In times of high oil prices, oil companies moderate the impact of highinternational prices by taking a squeeze on their margins.
The long and short of it – the Indian consumer should reconcile himself to frequent priceadjustments (either way, upwards and downwards). As international oil markets become tight,global prices would rise, and so would domestic retail prices. The common man may be on theshort-end of it on account of market sentiments alone. The oil companies would play their role inmoderating the price fluctuations to some degree by contracting/expanding their marketingmargins. Under the APM, they enjoyed guaranteed returns. Now, the common man on the streetis their bread maker and they will go all out to appease him. Of course, the bottomline of thegame is still profits.

Latest development: Govt fixes price band for oil (July 2004)
Even as global petro-product prices continue to be northward bound, retail consumersback home will remain insulated from the volatility in global prices.The government has formulated a price band for auto fuels — petrol and diesel withinwhich oil marketing companies will be free to revise prices automatically.Though the mechanism talks about a band within which prices will be revised everyfortnight, retail prices of petrol and diesel are unlikely to see much of a change in thecoming days. Since global prices have remained firm, oil companies are currently sellingpetrol and diesel close to the top end of the band.
The “moving price band” will be based on the average of the global prices in the immediate pastthree months and the past one year. Oil companies will have the limited freedom to revise prices(both upwards and downwards) up to 10% of this mean price.
Factors influencing crude price in India
The petroleum sector has a major influence on the inflationary trend in a country like India. This isbecause in India (like in many other developing countries), the total oil consumption in relation toGDP is relatively high as compared with many developed countries in North America andWestern Europe.
A high level of oil consumption in relation to output implies high oil intensity. China, South Koreaand Mexico are the other most oil intensive nations with oil consumption to GDP ratios of 0.26,0.2 and 0.31 respectively, during 1998. Japan and four major European countries (France,Germany, the UK and Italy) are the least oil intensive. The last decade and a half has shown amarginal change in oil intensity across nations.
In the case of India, because of a high level of oil intensity (in relation to GDP), the energy sector(Fuel, Power, Light & Lubricants) has a significantly higher share of 14.23% in the WholesalePrice Index (WPI), which is a measure of inflation in the country. This figure implies that for every10% rise in the prices of products in the energy sector, the inflation (as measured by WPI) wouldgo up by 1.4 percentage points.
The office of the Economic Adviser to the Government of India, Ministry of Commerce &Industry, has replaced the old series of WPI (Base: 1981-82=100) by a new series with abase 1993-94=100 for the Wholesale Price Index with effect from the week ending 1st April,2000. As per this new base, the share of Fuel, Power, Light & Lubricants is 14.23% in WPIas compared to 10.66% earlier. This is due to the structural change in the economy since

1981-82.
Intensity of traffic is steadily increasing in India. Demand from this section of the is a majordeterminant of oil price. This sector consumes a very high amount of oil, considering all the majormodes of transportation. It in turn, further demonstrates the importance of the petroleum sector inthe Indian economy. In the case of the railways, petroleum accounts for around 7% of the totalrevenue earning traffic. The POL traffic using the railways more than doubled to 36.2 millionmetric tonnes during 2000-2001 from 14.95 million metric tonnes in 1980-81. Similarly, petroleumaccounts for around 38% of the total port traffic in India, and in volume terms, the traffic morethan trebled to 107 million metric tones during 2000-01 from 34 million metric tonnes in 1980-81.Since India is a growing economy with GDP expected to grow at 8 – 10% per annum, demandfrom the manufacturing sector is expected to grow manifolds. In fact development economistpredict that by 2050 India will be the third largest economy in the world (annexure 1).
Role of government
India is one of the top 10 oil-consuming countries in the world. Oil and gas represent over 40 percent of the total energy consumption in India. The consumption of petroleum products in thecountry is on the rise and demand already far exceeds domestic supply. Therefore, the countryhas to depend largely on imports.
The country’s existing annual crude oil production is peaked at about 32 million tonnes as againstthe demand of about 110 million tonnes. With inadequate crude production, the country is heavilydependent on imports. Crude is the single largest item on India’s import list. Estimates show thatthe demand is likely to grow at a faster pace over the next decade if India is to maintain the GDPgrowth target of 8 per cent. This implies larger imports unless new domestic oil reserves arefound. With this in view, the government announced the New Exploration Licensing Policy (NELP)in 2000. With a view to ensure long-term energy security, the government is also building oil andgas equity abroad.
Policy Initiatives
The deregulation of the petroleum sector has been completed on schedule (March 2002) withthe government completely dismantling the administered pricing mechanism for all petroleumproducts except kerosene and LPG. As a result, the petroleum product prices will be marketdetermined and the marketing companies will be free to set prices.The government offers both off-shore and on-shore exploration blocks under the NELP for

Indian and foreign private participants. Several exploration blocks have already been givenout in the first two rounds of NELP. Currently the third round NELP III of bidding out blocks ison. A total of twenty-seven blocks, covering eleven on land, seven shallow-water offshoreand nine deep-water offshore have been offered by the government for exploration. So far,contracts with private investors have been signed for 47 blocks in the two rounds of licensing.The recent Reliance discovery of major natural gas reserve has given a major impetus fornew explorations.The government allows 100 per cent foreign equity in private refining ventures. However, FDIin refineries promoted by public sector companies is restricted to 26 per cent. Foreign equityparticipation in petroleum product marketing has been capped at 74 per cent. Foreign equityinvestment in oil and gas pipeline projects is currently restricted to 51 per cent.The government has allowed private companies to market petroleum products in the countryprovided that the private company either produces 3 million tonnes or more per annum ofcrude or has invested over US$ 400 million in the country’s oil and gas related infrastructuresector.In order to improve the viability of stand-alone refineries, the government has linked them tothe major public sector oil companies.
Opportunities
Entire gamut of exploration & production, refining, transportation & distribution and retailmarketing activities present opportunities for FDI:Production sharing contracts for oil and gas exploration under NELPSupply of crude oilSupply of gasLNG import and transportationSetting up refineriesMarketing petroleum products including LPGSetting up of petroleum infrastructure like storage facilities, pipelines, etcRetail marketing of transportation fuels
As part of its divestment strategy, the government is likely to privatise some of the major publicsector oil companies in the near future. At least a change the equity structure is very much in theoffing. This provides a good investment opportunity for entrepreneurs looking at investing in thissector, or entering the petroleum retail market.
The country has traditionally operated under an Administered Pricing Mechanism for petroleumproducts. This system was based on the retention price concept under which the oil refineries, oilmarketing companies and the pipelines are compensated for operating costs and are assured areturn of 12% post-tax on net worth. Under this concept, a fixed level of profitability for the oilcompanies is ensured subject to their achieving their specified capacity utilisation. Upstreamcompanies, namely ONGC, oil and GAIL, are also under retention price concept and are assureda fixed return.

The administered pricing policy of petroleum products ensured that products used by thevulnerable sections of the society, like kerosene, or products used as feed stocks for productionof fertilizer, like naphtha, may be sold at subsidized prices. Gradually, the Government of India moved away from the administered pricing regime to marketdetermined,tariff-based pricing. Free imports are permitted for almost all petroleum productsexcept petrol and diesel. Free imports are permitted for almost all petroleum products exceptpetrol and diesel. Free marketing of imported kerosene, LPG and lubricants by private parties ispermitted. It is contemplated that in a phased manner, all administered price products will betaken out of the administered pricing regime and the system will be replaced by a progressivetariff regime in order to provide a level playing field for new investments in a free and competitivemarket.
Impact of union budget (2004-05)
Background
Crude oil prices remained volatile during FY’04 and 1st quarter of FY’05 mainly due to geopoliticaltensions such as Iraq war, strike by workers in Venezuela and Nigeria, lower level ofinventory held by US and higher demand from China.Although APM was dismantled w.e.f April 1, 2002, oil companies have rarely priced endproducts on commercial basis. Increasing price of crude during FY’04 had adverse impact onoil companies in India as end fuel prices were not reset to reflect the increase in prices ofcrude. On June 15, 2004, the retail price of petrol was hiked by Rs.2/litre, diesel by Rs.1/ litreand LPG by Rs.20/cylinder. Also, excise duty on petrol was reduced by 4% to 26% and dieselby 3% to 11%.Post APM, two Regulatory Commissions; one for upstream sector and one for downstreamsector were proposed to be set up. This was to ensure availability of products in far flungplaces as well as to avoid price shocks and monopolistic behavior of oil companies. TheseCommissions have not yet been set-up. Petroleum Regulatory Board Bill, 2002, whichincorporates the framework for regulatory bodies, is pending in Lok Sabha.In September 2003, GAIL and ONGC were asked to share subsidy burden on account of saleof kerosene and LPG by public sector oil marketing companies (OMCs) to retail consumers.In a three-way split, the Government decided to transfer one-third of the subsidy burden toONGC and GAIL, another one-third through overpricing other products such as petrol anddiesel, and the remaining to be borne by the OMCs. It is estimated that total subsidy burdenon account of under pricing for FY’04 stood at Rs.8,200 crore. ONGC and GAIL share wasestimated to be at Rs.2,400 crore.
Budget proposalsSurvey & exploration of minerals have been brought under the service tax net. Service taxrate has been increased from 8% to 10%.

Education cess of 2% on income tax, corporation tax, excise duties, custom duties andservice tax to be levied. Credit on education cess on duties paid on Motor Spirit (MS), HighSpeed Diesel (HSD) and Light Diesel Oil (LDO) will not be allowed.Total expenditure of Ministry of Petroleum and Natural Gas (MoPNG) for 2004-05 isproposed at Rs.3573 crore as against revised estimate of Rs.6903 crore of 2003-04.Equity support of Rs.14,194 crore and loans of Rs.2,132 crore to entral Public SectorEnterprises (PSEs) in six sectors, including petroleum, is budgeted.Excise duty on gas stoves with an MRP not exceeding Rs.2,000 per unit has been reducedfrom 16% to 8%. 15Existing Countervailing Duty (CVD) exemptions on LNG to continue. Excise duty of 16 % onLNG has been done away with.
Budget Impact on Industries
Levy of service tax on survey and exploration activities would have an adverse impact oncompanies in the exploration and production sector.Reduction in budgetary allocation for MoPNG is likely to increase the subsidy burden to beborne by oil marketing companies. Further, there is no clarification on continuation/withdrawalof the three way split scheme for sharing of subsidy burden on LPG and Kerosene introducedduring FY’04.Education cess of 2% is likely to increase the retail price of selected petroleum products

marginally. Further, cess paid on MS, HSD and LDO will not be available as credit forpayment of cess on the final products.Reduction in excise duty on LPG stoves is expected to increase penetration, particularly inthe rural segment. This is expected to increase consumption of LPG.
Budget impact on companies
India - major players
Integrated Companies with International PresenceThe private fully-integrated international companies (that is, having exploration and production,refining and distribution as well as petrochemical plants) often with oversized downstreamactivities (compared with their upstream) following the nationalisation of their concessions duringthe 1970s. The operations of these players are also geographically diversified. These playershave the advantages of economies of scale and scope apart from the synergies of following anintegrated operation. As a result, these companies are among the most profitable ones in theglobal oil & gas industry. Further, the profitability of these companies is driven by the upstreamoperations--the performance of which, in turn, is dictated by the trend in oil prices.

The National Oil CompaniesThe national oil companies of the producing countries, which are focused mainly on explorationand production. However, there are some in this category that are trying to break into refining anddistribution and petrochemicals, to achieve a better balance in their business.The national companies of the consumer countries who often are limited to refining, distributionand petrochemical activities and who, in size, are quite modest in comparison with theheavyweights like integrated companies with international presence and national oil companies ofthe producing region.
The Niche PlayersThese are the players, who have evolved due to non-traditional skills such as deal making,financing, trading, commercial, etc. Examples include players like the erstwhile Enron and Tosco.Historically, Enron's capability was limited to conventional pipeline aggregation skills and contractgas supply skills. By employing innovative financial, risk management and trading skills, itemerged as a leading energy player with business worth over $250 mn, before collapsing in 2001due to certain financial irregularities. Similarly, Tosco's skills in acquiring refineries at cheapvaluations and operating them efficiently resulted in the emergence of a profitable niche player inthe refinery segment.
ONGC is the major player in the Indian E&P sector. Other players include Oil India Ltd., RelianceIndustries, Indian Oil Corporation, Gas Authority of India Ltd., British Gas, Essar Oil, Videocon,Cairn Energy, Hindustan Oil Exploration Company, Niko Resources, Gazprom, Energy Equity,Geoenpro Petrol Ltd., Geopetrol International, Enpro India Ltd., Hardy Oil, Tata Petrodyne,Gujarat State Petroleum Corporation, Selan Exploration Technologies Ltd., L&T, Joshi Tech.,Interlink Petroleum, Mosbacher, Tullow Oil, Phoenix, Okland International, Premier Oil andGeo Global Resources
Government Controlled Companies: ONGC, OIL, IOC, HPCL , BPCL and GAIL. CPCL, BRPLand IBP have now become subsidiaries of IOC. KRL and NRL are now subsidiaries of BPCL.
Joint Sector Companies: MRPL used to be a joint sector company with equal stake of HPCL andAditya Birla Group. However, ONGC has bought the stake of the Aditya Birla Group in MRPLmaking it a public sector company.
Private Sector Companies: Reliance Petroleum Ltd. (RPL) - which has now been merged withparent Reliance Industries Ltd. (RIL)
The three key organisations under the administrative control of the MoP&NG are the Oil Coordination

Committee (OCC) , the Oil Industry Development Board (OIDB) and the DirectorateGeneral of Hydrocarbons. Set up in 1975, the OCC played a pivotal role in the Indian oil sector,by assuming responsibilities in the areas of:
Determining the product mix of refineries;Allocating indigenous and imported crude oil to Indian refineries;Planning for imports, transportation requirements and storage infrastructure, based on shorttermestimates for supply/demand;Administering the pricing mechanism for controlled petroleum products;Monitoring the oil pool account;Co-ordinating marketing functions;Organising monthly industry co-ordination meetings and supply plan meetings to resolveproblems and work out supply plans and maximise product yields; and,Monitoring the performance of the oil industry to achieve optimality.With the full decontrol of the petroleum sector from April 1, 2002, the OCC has been dismantledand has been replaced by the Petroleum Planning and Analysis Cell (PPAC). The PPAC's role isto analyse the trends in the international oil markets and domestic prices; forecasting andevaluation of petroleum imports and export trends; maintenance of information database andcommunication system to deal with emergencies and unforeseen circumstances. The OIDB, setup in 1975, provides financial and other assistance as is appropriate for the development of theoil industry. The financial assistance is extended by way of loans and grants for activities likeprospecting, refining, processing, transporting, storing, handling and marketing of mineral oil andoil products.
Set up in April 1993, the Directorate General of Hydrocarbons (DGH) functions as anindependent regulatory body for supervising the activities of companies in the upstream oil & gassector in the national interest and to oversee that oilfield development in the country confirms tosound engineering practices.
The segment of oil & gas exploration and production has players such as ONGC and OIL, bothPSUs. Until recently, almost the entire exploration and production work was carried out by thesetwo national oil companies. Of late, the Government has been awarding oilexploration/development blocks to private companies also.
The New Exploration Licensing Policy (NELP) of the Government is a step in this direction. Underthe NELP the Government offers attractive fiscal terms such as: level playing field for national oilcompanies; international oil price to contractors; zero cess liability; and 50% rebate on royaltypayments for seven years for deep offshore areas. Oil exploration and production has also beengiven infrastructure status, which, inter alia, provides for a seven-year tax holiday. So far, theGovernment has signed production sharing contracts (PSCs) for 47 blocks in the first two roundsof NELP and has awarded 23 blocks under NELP III. In the backdrop of the giant gas discovery

made in recent times, the government has launched NELP IV during May 2003. A total of 24blocks are on offer in this fourth round of NELP.
Crude oil futuresThe Indian government has now permitted oil companies in India to hedge against commodityprice risks while importing crude and petroleum products. This initiative has been taken by theIndian government in a bid to protect the economy from the volatility of international crude prices.All oil companies having underlying exposures in crude and petroleum products will now beallowed to import and hedge future prices against the drastic volatility of the prices in thehydrocarbon sector. This has almost become a necessity for a country like India, which imports70 percent of its petroleum requirement and needs to be protected against such price movementsin the International oil markets.
Oil companies such as the Indian Oil Corporation (IOC), Reliance Petroleum and MRPL areexpected to be the beneficiaries of this move from the government. The hedging facility is to besubjected to detailed guidelines to be issued by the RBI and is expected to make Indianproducers more efficient and enable them to compete in the International markets. The immediatebeneficiaries of the decision will be the Industry experts opine that hedging instruments which areused for other commodities like sugar etc. are like insurance, both for the buyer and the seller,while the buyer can protect his interests by locking future physical deliveries at prices quoted atpresent, the seller too can protect his interest by contracting sales at a price which may fall in theconsequent months.
The volatility in the International Oil markets can be gauged by the fact that oil prices have beenroller coasting during the period December 1999 and April-May 2000. The prices in Decemberstood at a historic low of barely $10 a barrel while by April-May it moved up to over $31 a barrel.Now (August 2004) it is hovering around $44/ barrel). Oil companies have gained or lostsignificantly due to the lack of price risk hedging instruments and have been unable to protecttheir future interests.
The hedging mechanism is based on a benchmark crude for which price quotes are available.Each of the above exchanges that trade in oil futures has their own crude benchmarks.In the oil futures market, the quotes are usually for a period of about six months and the buyer ofthe future needs to take a position for a particular quantity to be physically delivered at aparticular point of time. The advantage for the buyer would be that if prices moved up by the timethat the physical delivery of the product takes place, the buyer is compensated with anadjustment and a settlement with the difference being paid back. The buyer thus is able to hedgeagainst an increase in the prices of crude and petroleum products. In the case wherein there is afall in the prices of crude and petroleum products then the sellers interest is protected as thedelivery is made on the agreed price by the buyer.

For the Indian market the relevance of the permission by the government allowing oil companiesto hedge against price risks in the crude and petroleum products markets lies in the facts thatLarge crude buyers such as the Indian Oil Corporation, Reliance Petroleum and MRPL will beable to improve profitability.The impact of the volatile international oil prices can be tamed by being able to hedge againstprice hikes using oil futures.Lastly this will enable the Indian oil companies to gear up to competition from global oil playerssuch as Morgan Stanley and Citibank who are poised the enter the Indian markets.
Benefits of MCX crude futuresWhile energy futures markets in the US and Europe trade many times their underlying oilproduction and consumption, the need for active energy futures instruments still exist to a largeextent in the Asia-Pacific.Safeguard mechanismsThe MCX crude Futures will allow oil producers, refiners, traders and consumers to manage theircrude oil price risk with greater precision and without concerns for counter-party risks as alltransactions are cleared and guaranteed by MCX.It also offers individual investors with another trading instrument for them to capitalize on theirviews of the volatile crude oil prices caused by the political tension in the Middle East.Real Time Oil PricesThe best bids and offers on MCX are continuously disseminated on a real-time basis throughprice vendors for the benefits of all market users. This gives market users a real-time pricereference that is fair, equal and easily accessible. MCX also provides a daily settlement price.Wider Market ParticipationWith counter-party risk addressed by the clearing and guarantee offered by MCX, there can begreater involvement by more participants. In addition to larger and more active oil companies,smaller companies and MCX individual members and individual investors would also be able to trade MCX Crude Futures.Flexible Transaction Size The relatively small contract size of I00 barrels allows oil market participants to hedge varying sizes of crude oil exposure effectively.
Price variationFollowing shows the price volatility of the crude. Unlike previous years, which were underthe APM and protected with Oil Pool account, now crude price is having a high co relationwith the international market price. As on date, even the prices of crude bi products areallowed to vary +/- 10% keeping in line with international crude price, subject to certaingovernment laid down norms/ formulae. All these facilitates a future trade in crude.

Annexure
BASICS OF HYDROCARBON CHEMISTRY
Crude oil is a mixture of hydrocarbon molecules, which are organic compounds of carbon andhydrogen atoms that may include from one to 60 carbon atoms. The properties of hydrocarbonsdepend on the number and arrangement of the carbon and hydrogen atoms in the molecules.The simplest hydrocarbon molecule is one carbon atom linked with four hydrogen atoms:methane. All other variations of petroleum hydrocarbons evolve from this molecule.
Hydrocarbons containing up to four carbon atoms are usually gases, those with 5 to 19 carbonatoms are usually liquids, and those with 20 or more are solids. The refining process useschemicals, catalysts, heat, and pressure to separate and combine the basic types of hydrocarbonmolecules naturally found in crude oil into groups of similar molecules. The refining process alsorearranges their structures and bonding patterns into different hydrocarbon molecules andcompounds. Therefore it is the type of hydrocarbon (paraffinic, naphthenic, or aromatic) ratherthan its specific chemical compounds that is significant in the refining process.Three Principal Groups or Series of Hydrocarbon Compounds that Occur Naturally in Crude OilParaffins. The paraffinic series of hydrocarbon compounds found in crude oil have the generalformula CnH2n+2 and can be either straight chains (normal) or branched chains (isomers) ofcarbon atoms. The lighter, straight-chain paraffin molecules are found in gases and paraffinwaxes. Examples of straight-chain molecules are methane, ethane, propane, and butane (gasescontaining from one to four carbon atoms), and pentane and hexane (liquids with five to sixcarbon atoms). The branched-chain (isomer) paraffins are usually found in heavier fractions ofcrude oil and have higher octane numbers than normal paraffins. These compounds are
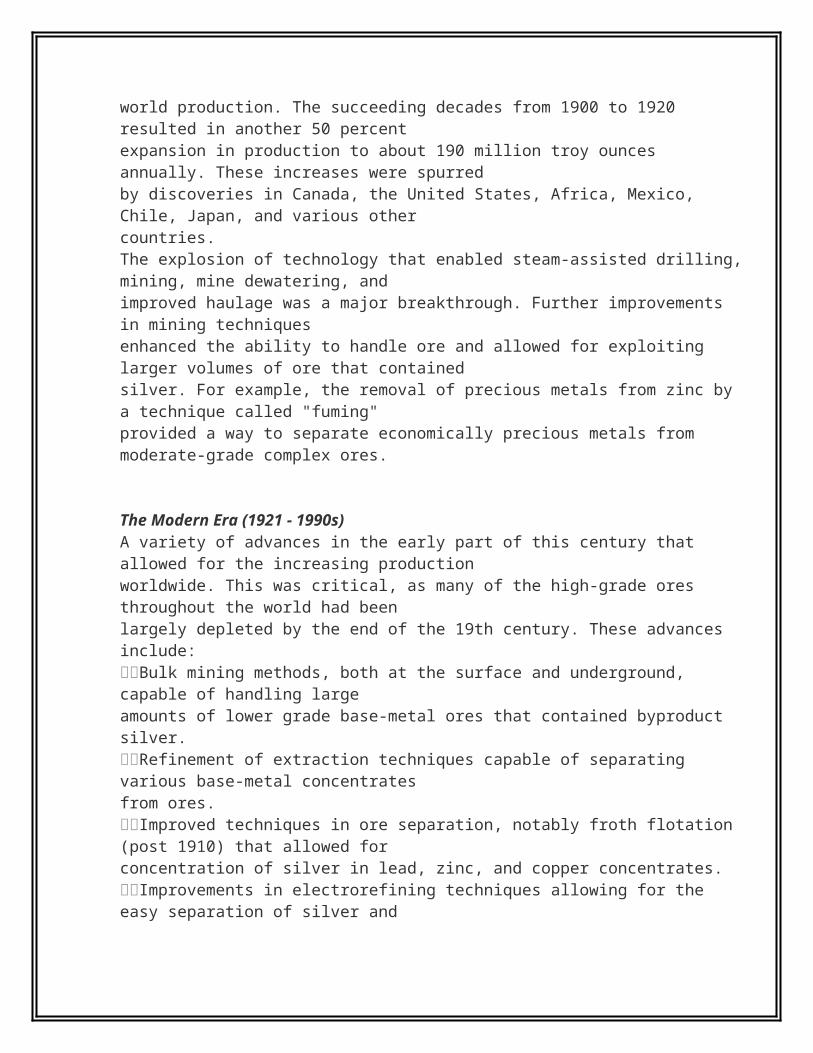
saturated hydrocarbons, with all carbon bonds satisfied, that is, the hydrocarbon chain carries thefull complement of hydrogen atoms.
)
Aromatics are unsaturated ring-type (cyclic) compounds which react readily because they havecarbon atoms that are deficient in hydrogen. All aromatics have at least one benzene ring (asingle-ring compound characterized by three double bonds alternating with three single bondsbetween six carbon atoms) as part of their molecular structure. Naphthalenes are fused doubleringaromatic compounds. The most complex aromatics, polynuclears (three or more fusedaromatic rings), are found in heavier fractions of crude oil.
Naphthenes are saturated hydrocarbon groupings with the general formula CnH2n, arranged in theform of closed rings (cyclic) and found in all fractions of crude oil except the very lightest. Singleringnaphthenes (monocycloparaffins) with five and six carbon atoms predominate, with two-ringnaphthenes (dicycloparaffins) found in the heavier ends of naphtha.
Other Hydrocarbons.Alkenes are mono-olefins with the general formula CnH2n and contain only one carbon-carbondouble bond in the chain. The simplest alkene is ethylene, with two carbon atoms joined by adouble bond and four hydrogen atoms. Olefins are usually formed by thermal and catalyticcracking and rarely occur naturally in unprocessed crude oil.

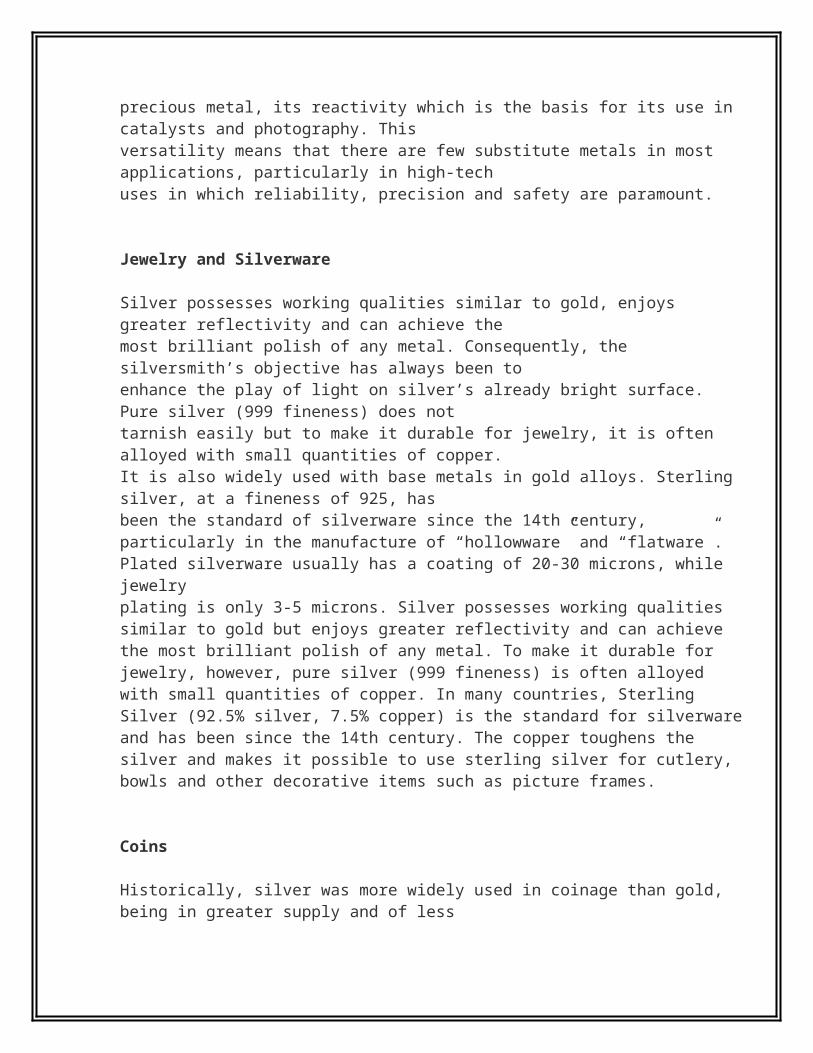
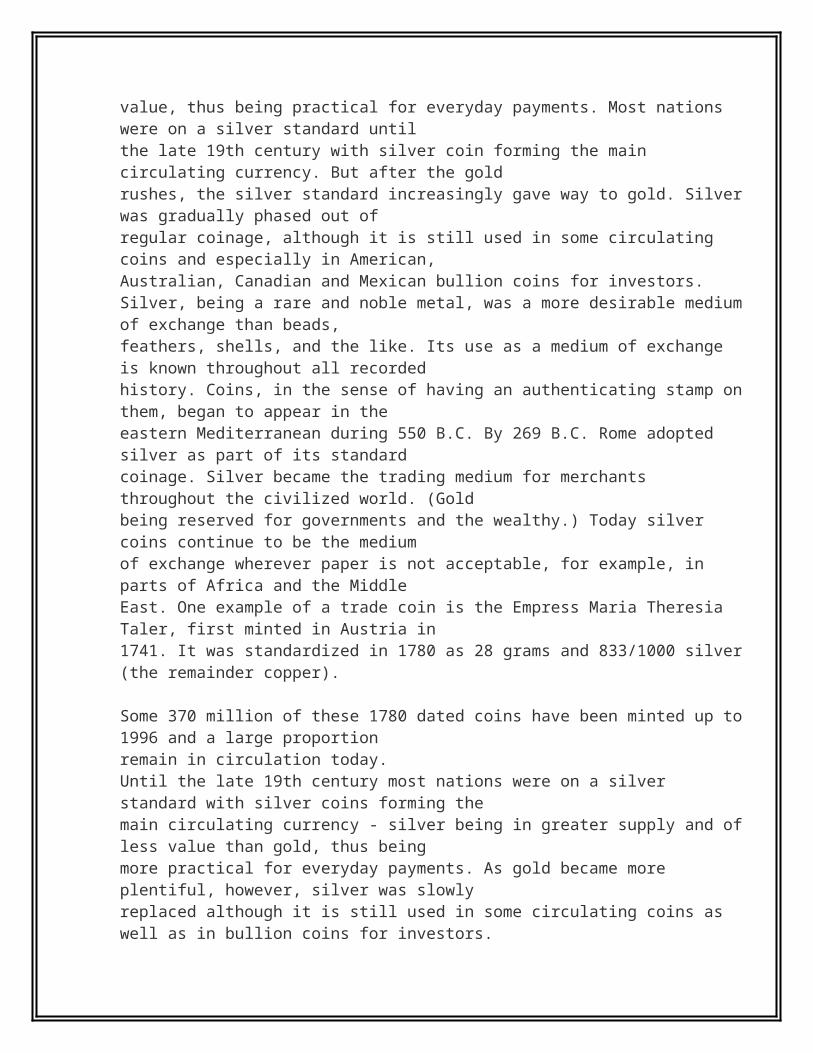
)Dienes and Alkynes Dienes, also known as diolefins, have two carbon-carbon double bonds. Thealkynes, another class of unsaturated hydrocarbons, have a carbon-carbon triple bond within themolecule. Both these series of hydrocarbons have the general formula CnH2n-2. Diolefins such as1,2-butadiene and 1,3-butadiene, and alkynes such as acetylene, occur in C5 and lighter fractionsfrom cracking. The olefins, diolefins, and alkynes are said to be unsaturated because they containless than the amount of hydrogen necessary to saturate all the valences of the carbon atoms.These compounds are more reactive than paraffins or naphthenes and readily combine with otherelements such as hydrogen, chlorine, and bromine.
NonhydrocarbonsSulfur Compounds. Sulfur may be present in crude oil as hydrogen sulfide (H2S), as compounds(e.g. mercaptans, sulfides, disulfides, thiophenes, etc.) or as elemental sulfur. Each crude oil hasdifferent amounts and types of sulfur compounds, but as a rule the proportion, stability, andcomplexity of the compounds are greater in heavier crude-oil fractions. Hydrogen sulfide is aprimary contributor to corrosion in refinery processing units. Other corrosive substances areelemental sulfur and mercaptans. Moreover, the corrosive sulfur compounds have an obnoxiousodor.
Pyrophoric iron sulfide results from the corrosive action of sulfur compounds on the iron and steel

used in refinery process equipment, piping, and tanks. The combustion of petroleum productscontaining sulfur compounds produces undesirables such as sulfuric acid and sulfur dioxide.Catalytic hydrotreating processes such as hydrodesulfurization remove sulfur compounds fromrefinery product streams. Sweetening processes either remove the obnoxious sulfur compoundsor convert them to odorless disulfides, as in the case of mercaptans.
Oxygen Compounds Oxygen compounds such as phenols, ketones, and carboxylic acids occur incrude oils in varying amounts.
Nitrogen Compounds Nitrogen is found in lighter fractions of crude oil as basic compounds, andmore often in heavier fractions of crude oil as nonbasic compounds that may also include tracemetals such as copper, vanadium, and/or nickel. Nitrogen oxides can form in process furnaces.The decomposition of nitrogen compounds in catalytic cracking and hydrocracking processesforms ammonia and cyanides that can cause corrosion.Trace Metals Metals, including nickel, iron, and vanadium are often found in crude oils in smallquantities and are removed during the refining process. Burning heavy fuel oils in refineryfurnaces and boilers can leave deposits of vanadium oxide and nickel oxide in furnace boxes,ducts, and tubes. It is also desirable to remove trace amounts of arsenic, vanadium, and nickelprior to processing as they can poison certain catalysts.
Salts Crude oils often contain inorganic salts such as sodium chloride, magnesium chloride, andcalcium chloride in suspension or dissolved in entrained water (brine). These salts must beremoved or neutralized before processing to prevent catalyst poisoning, equipment corrosion,and fouling. Salt corrosion is caused by the hydrolysis of some metal chlorides to hydrogenchloride (HCl) and the subsequent formation of hydrochloric acid when crude is heated. Hydrogenchloride may also combine with ammonia to form ammonium chloride (NH4Cl), which causesfouling and corrosion.
Carbon Dioxide Carbon dioxide may result from the decomposition of bicarbonates present in oradded to crude, or from steam used in the distillation process.Naphthenic Acids Some crude oils contain naphthenic (organic) acids, which may becomecorrosive at temperatures above 450° F when the acid value of the crude is above a certain level.(Source: US dept of labour)
BASICS OF CRUDE OIL
1. Crude oils are complex mixtures containing many different hydrocarbon compounds that varyin appearance and composition from one oil field to another. Crude oils range in consistencyfrom water to tar-like solids, and in color from clear to black. An "average" crude oil containsabout 84% carbon, 14% hydrogen, 1%-3% sulfur, and less than 1% each of nitrogen, oxygen,metals, and salts. Crude oils are generally classified as paraffinic, naphthenic, or aromatic,based on the predominant proportion of similar hydrocarbon molecules. Mixed-base crudeshave varying amounts of each type of hydrocarbon. Refinery crude base stocks usuallyconsist of mixtures of two or more different crude oils.

2. Relatively simple crude oil assays are used to classify crude oils as paraffinic, naphthenic,aromatic, or mixed. One assay method (United States Bureau of Mines) is based ondistillation, and another method (UOP "K" factor) is based on gravity and boiling points. Morecomprehensive crude assays determine the value of the crude (i.e., its yield and quality ofuseful products) and processing parameters. Crude oils are usually grouped according toyield structure.
3. Crude oils are also defined in terms of API (American Petroleum Institute) gravity. The higherthe API gravity, the lighter the crude. For example, light crude oils have high API gravitiesand low specific gravities. Crude oils with low carbon, high hydrogen, and high API gravityare usually rich in paraffins and tend to yield greater proportions of gasoline and lightpetroleum products; those with high carbon, low hydrogen, and low API gravities are usuallyrich in aromatics.
4. Crude oils that contain appreciable quantities of hydrogen sulfide or other reactive sulfurcompounds are called "sour." Those with less sulfur are called "sweet." Some exceptions tothis rule are West Texas crudes, which are always considered "sour" regardless of their H2Scontent, and Arabian high-sulfur crudes, which are not considered "sour" because their sulfurcompounds are not highly reactive.


CONCLUSION:
Derivatives products today which play an important role in finance world came out as ‘hedging tool’. Volatility in prices of products in cash market has lead to trading in forward or futures markets. Derivatives products include forward, futures and options, swaps etc. The underlying instruments could be financial instruments or commodities. In agricultural dominated country like India trading in commodities is deeply rooted. The price movements in agricultural products have always been a major concern of farmers, manufacturers as well as consumers. Due to development of well organized and more technically advanced market place the Exchanges were evolved where people enter into futures contracts. MCX and NCDEX provide the facility of online trading in commodity futures the same as NSE in case of financial instruments such as shares. Right now options are not available. The reason behind evolution of commodity futures was hedging against prices movements in commodities such as cotton, sugar, gold, silver, crude oil, etc. Commodity futures play vital role in:1) Price discovery2) Liquidity (leverage)3) Risk transferThe above 3 are the functions of 3 players in the market namely: Hedgers, Speculators, and Arbitrageurs
1) Price Discovery:
The farmers with their agricultural output approaches middleman called Dalal etc in India who charges commission. The prices are decided by these middlemen and so different prices for same product prevail. But the concept of Commodity Futures on commodity exchanges eradicates middleman’s role as farmers, manufacturers, dealers meet at one place through exchange to decide date, quantity and rate of the product.
How this future price is decided? The important players in this market are Hedgers, Speculators, and Arbitrageurs decides futures prices according to their need (Demand and Supply)
Hedgers: Generally these are farmers, manufacturer and Wholesalers. For example a cotton farmer 3 months before January knows that his produce will come to market in January but
EXCHANGE
BUYERS SELLERS

concerned about price movement and finding right customer. So he can now hedge this risk by entering into future contract with buyer (generally manufacturer) to sell the cotton at agreed quantity, quality and rate. In the same way manufacturer who is in need of cotton want to enter into such contract. Number of such contracts is entered and according to demand and supply the prices are fixed. So they want to avoid risk.
Speculators: While the hedgers avoid risk speculators wants to take risk and make profit just by price movement. These are important player as they absorb excess demand and supply generated by hedgers thus providing liquidity and dampens price movements. Generally these are Individuals or retail investors who are not producers or farmers.On this exchange the hedgers and speculators meet and the right price is discovered.
Arbitrageurs: Generally these are people who want to earn risk less profit. They find the opportunity when the price of same commodity is different on two different markets such as cash (Spot) and futures. This opportunity does not exist for a long time as arbitrageurs start buying commodity from a market where the prices are low the prices starts rising and as they sell commodity in market where the prices are high the prices goes down.
These 3 players meet on exchanges and enters into contract and an “equilibrium price” in arrived.
Negotiates FARMERS Negotiates
MANUFACTURERS CUSTOMERS / RETAIL INVESTORS
Negotiates Negotiates WHOLESALERS PRICE ON EXCHANGE MEANS FUTURES PRICE
Pricing It:
In case of commodities the farmers, manufacturer or dealers carry these commodities till those are sold and physically delivered. Here the seller so incurs “holding cost” which is equal to:Cost of finance + Storage Cost + Insurance. This is also called fair value of future contract mathematically given as: F = (S + U)ert
Where,F = Future PriceS = Spot PriceU = Present Value of Storage
PRICE ON EXCHANGE

r = Cost of Financing (using continuous compounded interest rate) t = Time till expiration e = 2.71828
2) Liquidity (Leverage):
While entering into futures contract the buyer as well as seller doesn’t have to pay the entire value of the contract, instead will have to deposit just the margin amount with exchange. The account is Dr or Cr due to mark to market. The buyer and seller obliged to take or give delivery of the commodity or enter into offsetting position.
3) Risk Transfer:
The above 3 important players play vital role by reallocating the existing risk with different participants in the market. According to (Merton H. Miller: Financial Innovation: Achievements and Prospects”, Japan and the world Economy, Vol 4, no 2 (June 1992). “The combined set of futures and options contracts and the markets, formal and informal, in which they are transferred has thus been linked to a gigantic insurance company-and rightly so. Efficient risk-sharing is what much of the futures and options revolution has been all about.” As trading in commodity futures is exchange traded contracts the more functions such as ease of transaction, lower transaction cost, standardize quantity and quality, Eradicating counter party risk (default of payment) are also performed in the market.
Beneficiaries:Companies such as Oil companies (IOC, RIL, MRPL etc.) are beneficiaries as this enable co to hedge against international price movements and gear up to competition from global oil players.Textiles and commodity related industries, jewelers, wholesales and of course farmers are major beneficiaries
Investment in Commodity Futures:In case of financial investment the people invest with the aim of return and price appreciation. But in case of commodity futures there are no such returns but only price appreciation which is effected due to demand and supply in spot market. How to benefit from commodity futures investment? In case of financial instruments ‘security analysis’ is carried out which includes fundamental and technical analysis. In commodity futures ‘the commodity analysis’ could be the following through the benefits are obtained:

Commodity Analysis:
1)Understanding commodities:
Commodities classified broadly are Energy (Crude oil), Metals, Precious Metals, and Consumption Commodities (Sugar, cotton, Palm oil, etc). Enter into the commodity in which you have knowledge such as its demand and supply. For example in case of crude oil: Determinants of prices: 1) News about OPEC decisions as slight increase or decrease in oil production there is disproportionate increase or decrease in international prices. 2) US crude oil stock levels 3) oil industry deregulation 4) Level of consumption in relation to output etc. India is net importer of crude oil having high oil intensity. The reasons why demand will rise in India: 1) Limitation on spare production Capacity available world wide. 2) Growth in Primary Energy Consumption and low per Capita Consumption of Oil and Gas 3) Importance of oil and gas as multiple, varied and cost effective application. 4) Energy intensive developing 5) Continued world economic growth and no major downturn 6) Refining/Catalyst Cracking/Up gradation Capacity to Total Oil Capacity etc.
In case of Cotton: Incase of cotton in Maharashtra the seeding takes place in month of July and harvesting is done in month of December or January first week. So the raw cotton comes in market in January. After this according to demand and supply the prices per quintal in fixed.
2) Finding Appropriate Opportunities:
Hedging, speculation and arbitrage. According to individual want the strategies regarding above 3 can be formed. A person in need of gold can hedge against price movement. Speculators as well arbitrageurs and profit form movement in crude oil prices as well arbitrageurs. If crude oil is to rise by say 3$ then to purchase it companies will increase demand for $. So both the prices fluctuate. So such opportunity can be tapped earlier by knowing such correlations.
3) Tools:
a) Technical analysis through historical data of spot and future price and forming pattern and correlations in spot and future prices to tap the opportunities such as arbitrage.

b) Finding Spread orders such as It is entering into one long and one short in same commodity with different contract months or in closely related commodity. The prices of futures tend to go up or down together. So the gain on one side off set the loss on other. Therefore the goal is to profit form change in difference between two future prices.
c) Rollover: It closing out one future contract and taking same position in future contract with later delivery date. Some times it is attractive or may be unattractive. For example: If oil company holds short of JUNE month contract at rate 2500 per barrel for hedging purpose, so in MAY end it rolls the hedge forward into JULY month contract. In the same way it can do rollover any number of times. So if Crude Oil price drops from 2500 to 2400 then the shorted contract at the rate 2500 and closed out rate at 2400 will fetch profit of 100 per barrel. In the same way if Company shorted at 2391 of JUNE contract and in JUNE at maturity the rate is 2411 and if you close out here you will face loss. So to avoid this doing rollover that is closing out and again taking short position of JULY contract at different rate and so facing just notional loss is beneficial. So here if prices drop the company may be in profit.
d) Hedge Ratio: It is basically a statistical tool which helps to identify minimum basis risk. It is the ratio of size of the position taken in the futures contract to the size of exposure in underlying asset. It answers to: 1) what is optimal hedge ration? 2) How much contract should be bought? Mathematically it is defined as:
h = ρ * σs/ σf
Where,h = Hedge Ratio S = Change in spot price, S, during a period of time equal to the life of the hedge F = Change in spot price, F, during a period of time equal to the life of the hedgeσs = Standard deviation of S σf = Standard deviation of F ρ = Coefficient of correlation between S and F
For example: If Hedge Ratio is 1 that is Spot and Future perfectly correlated, hedger would have taken exactly same exposure as the asset underlying the future contract he uses.
4) Funds Diversification: So far we have seen what is commodity analysis, commodity selection, strategy and contract month selection, and building different tools for trading in commodity futures.Now we will see the how the funds are invested in different commodities. According to the characteristics of investor the funds can be invested:
Commodity RA BS CharacteristicsBullion Market (Gold and Silver)
50%
30%
High liquid and secured, less impact on gold prices due to inflation, interest@ GDP as compared to other commodities and financial instruments
Consumption 20 30 Different patterns as depends upon agriculture

commodities % %Energy (Crude Oil) 30
%40%
Mixed pattern and volatility in international prices
We know that mutual funds diversify funds to minimize risk. This may or may not be the best portfolio. The returns on this depend upon the timely shift over. (RA-RISK AVERSE , BS-BOLD STRATEGY)5) Commodity Options: Right now they are not available in India but widely traded in abroad such as NYMEX, etcOptions give the holder the right to buy/sell the underlying asset (commodity here) by a certain date (expiration or maturity date) for a certain price (strike or exercise price). It cost nothing (except margin requirement to be deposited at exchange) to enter into futures contract, the purchaser of an option is required to pay an up-front to the writer of an option.Parties: 1) Buyer of an option (Pays up-front or option premium to buy right to purchase/sell and not obligation)2) Writer of an option (Receives option premium or up-front and then is oblige to sell/buy if buyer exercises on him the right)Options Positions:1) A long position in Call Option (Right to buy)2) A long position in Put Option (Right to sell)3) A short position in Call Option (Writer: Oblige to sell)4) A short position in Put Option (Writer: Oblige to buy)Broad categories of Traders: Hedgers, Speculators, Arbitragers.HEDGING:
Futures and forwards are designed to neutralize risk by fixing the price that hedger will pay or receive for underlying asset.Options provides insurance, they offer a way for investor to protect themselves against adverse price movements in future, while still allowing them to benefit from favorable price movements.Therefore: Hedging in futures makes disadvantage able condition less disadvantage able, and advantage able condition less disadvantage able. Options are more versatile than futures for hedging.
Example:
If there is buyer of 3 month Call Option of Gold ( 10units or 1000grams) at strike of 7000 per 10 grams, the up-front being 80, if upon expiration gold trades above the strike of 7000, the buyer would exercise his option to buy gold (Take delivery). So if on maturity the price goes above 7000 say 7100 then buyer will take delivery at the rate 7000 and sell it in the market immediately to earn 7100 (100 profit).

Mathematically his profit will be:
PROFIT = MARKET PRICE ON MATURITY – (STRIKE PRICE + OPTION PREMIUM) = 7100 – (7000 + 80) = 20 per 10 grams or 1000/10*10 = 1000 Rs.
Profit
0 7000(strike price) Gold 80 Loss
In the above diagram we see that the profits are potentially unlimited for buyer above 7000 + option premium 80. However if price fall below 7000(strike price), he lets the option expires and thus loss limits to the up-front (option premium). Here the writer is in profit to the extent of up front charged by him (Rs. 80) but loss incurred is potentially unlimited .Similarly options are useful in arbitrage and speculation.
Thus by creating wide variety of innovative combinations of futures and options or different option positions can give useful pay off structures.

Bibliography
Web Sites referred:
1) www.mcxindia.com 2) www.ncdex.com 3) www.prabodh.com 4) www.google.com
Various documents of the firm.

ANNEXURE-I
ORIGIN OF DERIVATIVES AND DERIVATIVES MARKETS:
The origin of derivatives can be traced back to the need of farmers to protect themselves against fluctuations in the price of their crop. From the time it was sown to the time it was ready for harvest, farmers would face price uncertainty. Through the use of simple derivative products, it was possible for the farmer to partially or fully transfer price risks by locking in asset prices. These were simple contacts developed to meet the needs of farmers and were basically a means or reducing risk.

A farmer who sowed his crop in June faced uncertainty over the price he would receive for his harvest in September. In years of scarcity, he would probably obtain attractive prices. However during times of oversupply, he would have to dispose off his harvest at a very low price. Clearly this meant that the farmer and his family were exposed to a high risk of price uncertainty.
On the other hand, a merchant with and ongoing requirement of grains too would face a price risk that of having to pay exorbitant prices during dearth, although favorable prices could be obtained during periods of oversupply. Under such circumstances, it clearly made sense for the farmer and the merchant to come together and enter into a contract whereby the price of the grain to be delivered in September could be decided earlier. What they would then negotiate happened to be a futures type contract, which would enable both parties to eliminate the price risk.
In 1848, the Chicago board of trade, or CBOT was established to bring farmers and merchants together. A group of traders got together and created the to arrive contract at proved useful as a device for hedging and speculation on price changes. These were eventually standardized, and in 1925 the first futures clearing house came into existence.
Today, derivative contracts exist on a variety of commodities such as corn, cotton etc. Besides commodities, derivatives contracts also exist on a lot of financial underlying like stocks, exchange rate, interest rate, etc.
DEFINITION OF DERIVATIVES:
A derivative is a product whose value is derived from the value of one or more underlying variable or assets in a contractual manner.
The underlying asset can be equity, forex, commodity or any other asset. In our earlier discussion, we saw that wheat farmers may wish to sell their harvest at a future date to eliminate the risk of a change in prices by that date. Such a transaction is an example of a derivative. The price of this derivative is driven by the spot price of wheat which is the underlying in this case.
REGULATIONS:
The forward contract (Regulation) Act, 1952, regulates the forward/ futures contracts in commodities all over India. As per this the forward markets commission continues to have jurisdiction over commodity forward/future contract. Howerver when derivative trading in securities was introduced in 2001 the term security in the securities contract regulation act 1956 (SCRA) was amended to include derivative contracts in securities. Consequently, regulation of derivatives came under the preview of securities exchange board of India (SEBI). We thus have separate regulatory authorities for securities and commodity derivative markets.
The securities contracts (Regulation) Act, 1956 (SC(R)A) defines “derivative” to include:

1) A security derived from a debt instrument, share, loan whether secured or unsecured, risk instrument or contract for differences or any other form of security.2) A contract which derives its value form the prices, or index of prices, of underlying securities.
PRODUCT PARTICIPANTS AND FUNCTIONS:
Derivative contracts are of different types. The most common ones are forwards, futures, options and swaps. Participants who trade in the derivatives market can be classified under the following three broad categories- hedgers, speculators, and arbitragers.
1) Hedgers: The farmer’s example that we discussed about was a case of hedging. Hedgers face risk associated with the price of and asset. They use the futures or options markets to reduce or eliminate this risk.2) Speculators: Speculators are participant who wish to bet on future movements in the price of an asset. Futures and options contractors can give them leverage; that is by putting in small amounts of money upfront, they can take large positions on the market. As result of this leveraged speculative position, they increase the potential for large gains as well as large losses.
3) Arbitragers Arbitragers work at making profits by taking advantage of discrepancy between prices of the same product cross different markets. If, for example they see the futures price of an asset getting out of line with the cash price, they would take offsetting positions in the two markets to lock in the profit.
Whether the underlying asset is a commodity or a financial asset, derivative markets perform a number of economic functions:
1) Prices in an organized derivatives market reflect the perception of market participant about the future and lead the prices of underlying to the perceived future level. The prices of derivative converge with the prices of the underlying at the expiration of the derivative contract. Thus derivatives help in discovery of future as well as current prices.2) Derivatives market helps to transfer risks from those who have them but may not like them to thos who have and appetite for them.3) Derivatives, due to their inherent nature, are linked to the underlying cash markets. With the introduction of derivatives, the underlying market witnesses higher trading volumes because of participation by more players who would not otherwise participate for lack of an arrangement to transfer risk.4) Speculative traders shift to a more controlled environment to the derivatives market. In the absence of an organized derivatives market, speculators trade in the underlying cash markets. Margining, monitoring and surveillance of the activities of various participants become extremely difficult in these kind of mixed markets5) An important incidental benefit that flows from derivatives trading is that is acts as a catalyst for new entrepreneurial activity. Derivatives have history of attracting many bright, creative, well educated people with an entrepreneurial attitude. They often energize others to create new businesses, new products and new employment opportunities, the benefit of which are immense.
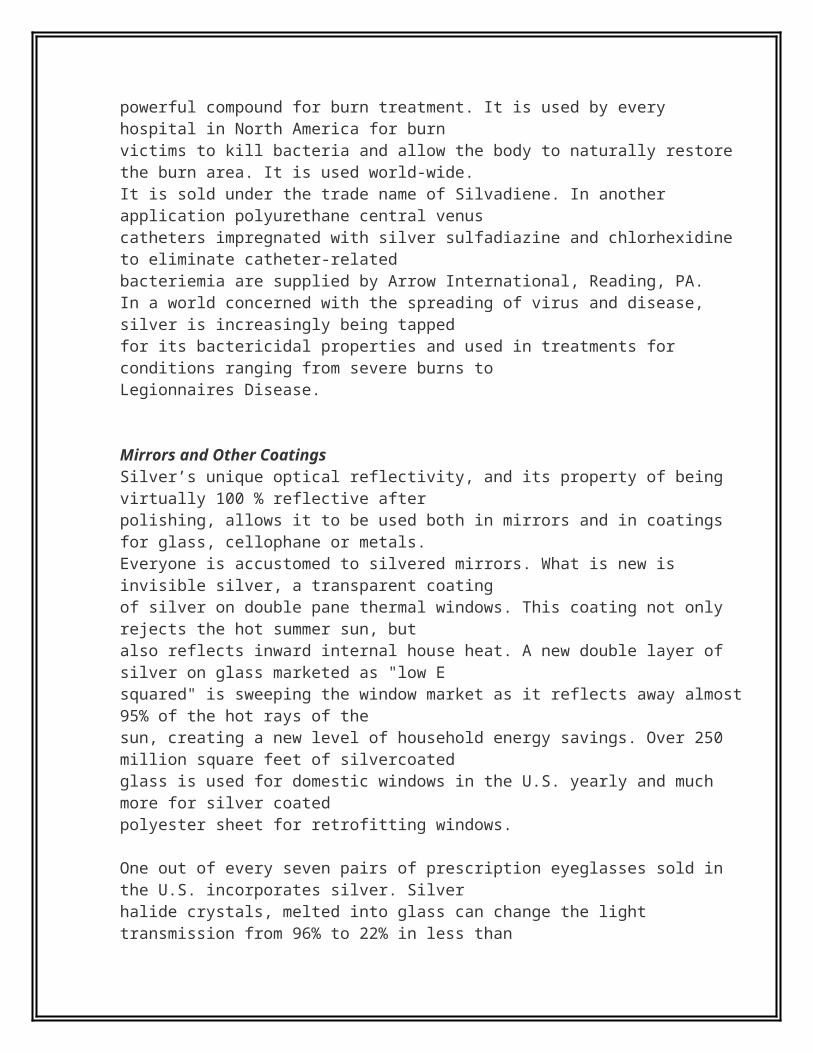
6) Derivatives markets help increase savings and investment in the long run. The transfer of risk enables market participants to expand their volume of activity.
DERIVATIVES MARKETS:
Derivatives markets can broadly be classified as commodity derivative market and financial derivatives markets. As the name suggest, commodity derivatives markets trade contracts for which the underlying asset is a commodity. It can be agricultural commodity like wheat, soybeans, rapeseed, cotton, etc or precious metals like gold, silver, etc. Financial derivatives markets trade contracts that have a financial asset or variable as the underlying. The more popular financial derivatives are those which have equity, interest rates and exchange rates as the underlying. The most commonly used derivatives contracts are forwards, futures and options which we shall discuss in detail later.
Spot versus forward transaction:Spot: Every transaction has three components – trading, clearing and settlement. In spot transactions the trading clearing and settlement happens instantaneously, Ex: On 1st Feb Vijay wants to buy some gold. The goldsmith quotes Rs 6000 per 10 grams. They agree upon this price and Vijay buys 20 grams gold. He pays 12000 takes the gold and leaves.
Forward:Now suppose Vijay does not want to buy the gold on 1st Feb, but want to buy it a month later. The goldsmith quotes 6015 per 10 grams. They agree upon the forward price for 20 grams of gold that Vijay want to buy and Vijay leaves. A month later, he pays the gold smith Rs 12030 and collects his gold. This is forward contract. Thus:“A contract by which two parties irrevocably agrees to settle a trade at a future date, for a stated price and quantity.”
No money changes hands when the contract is signed. The exchange of money and underlying goods only happens at the end of specific period. We call it derivative because it derives value from the price of asset underlying the contract, in this case gold.
Exchange traded versus OTC derivatives:Derivatives have probably been around for as long as people have been trading with one another. Forward contracting dates back at least to the 12th century, and may well have been around before then. These contracts were typically OTC kind of contracts. Over the counter derivatives are privately negotiat4ed contracts. Merchants entered into contracts with one another for future delivery of specified amount of commodities at specified price. A primary motivation for pre- arranging a buyer or seller for a stock of commodities in early forward contracts was to lessen the possibility that large swings would inhibit marketing the commodity after a harvest. Later many of these contracts were standardized in terms of quantity and delivery dates and began to trade on exchange.

The OTC derivatives market have the following features compared to exchange traded derivatives:1) The management of counter party (credit) risk is decentralized and located within individual institutions.
2) There are no formal centralized limits on individual positions, leverage, or margining.
3) There are no formal rules for risk and burden sharing.
4) There are no formal rules or mechanisms for ensuring market stability and integrity, and for safeguarding the collective interests of market participants.
5) The OTC contracts are generally not regulated by a regulatory authority and the exchange’s self-regulatory organization, although they are affected indirectly by national legal systems, banking supervision and market surveillance.
While both exchange traded and OTC derivative contracts offer many benefits, the former have rigid structures compared to the latter. The largest derivative market is the interbank foreign exchange market. Commodity derivatives the world over are typically exchange traded and not OTC in nature.
DERIVATIVES: DIFFERENT TYPES:
1) Forwards: It is an agreement between two entities to buy or sell the underlying asset at a future date, at today’s pre-agreed price.
2) Futures:It is an agreement between two parties to buy or sell the underlying asset at a future date at today’s future price. Futures contracts differ from forward contracts in the sense that they are standardized and exchange traded.
3) Options:There are two types of options – calls and puts. Calls give the buyer the right but not the obligation to buy a given quantity of the underlying asset, at a given price on or before a given future date. Puts give the buyer the right, but not the obligation to sell a given quantity of the underlying asset at a given price on or before a given date.
4) Baskets:These are options on portfolios of underlying assets. The underlying asset is usually a weighted average of a basket of assets. Equity index options are a form of basket options.
5) Swaps:

These are private agreement between two parties to exchange cash flows in the future according to a prearranged formula.
COMMODITY DERIVATIVES:
Derivatives as a tool for managing risk first originated in the commodities markets. They were then found useful as a hedging tool in financial markets as well. In India, trading is commodity futures has been in existence from the 19th century with organized trading in cotton through the establishment of cotton treade4 association in 1875. Over a period of time, other commodities were permitted to be traded in futures exchanges. Regulatory constraints in 1960s resulted in virtual dismantling of the commodities futures markets. It is only in the last decade that commodity future exchanges have been activelyu encouraged. However, the markets have been thin with poor liquidity and have not grown to any significant level.
EVOLUTION OF COMMODITY EXCHANGES:

Most of the commodity exchanges, which exist today, have their origin in the late 19th and earlier 20th century. The first central exchange was established in 1848 in Chicago under the name Chicago Board Of Trade. The emergence of the derivatives markets as the effective risk management tools in 1970s and 1980s has resulted in the rapid creation of new commodity exchanges and expansion of the existing ones. At present, there are major commodity exchanges all over the world dealing in different types of commodities.
EVOLUTION:The creation of exchanges goes back to the late 19th century with the development of national and international market places. The main rationale was the reduction of transaction costs, the major potential for it lying in organizing a physical market place, where buyers and sellers could be sure fo finding a ready market.
One of the factors that led to the creation of the Chicago Board of Trade, over a century old and still one of the worlds largest commodity exchanges, was that farmers coming to Chicago at times found no buyers, and had to dump their cereals unsold in Lake Michigan, adjoining the city. these “old” exchanges are located mainly in developed countries. However, a few were created in developing countries, too. The Buenos Aires Grain Exchange in Argentina, founded in 1854, is one of the oldest in the world.
We are now seeing the onset of new phase in the evolution of commodity exchanges, driven by technology. Established traditional exchanges for convinced that the internet is providing them with unprecedented opportunities. This is equally true for commodity exchanges in developing countries – Technology has made it possible for them to offer new products at a lower cost.
SOME OF THE LEADING COMMODITY EXCHANGES ACROSS THE GLOBE ARE:
North and South America:USA:Chicago Board of Trade Chicago Mercantile Exchange New York Cotton ExchangeNew York Mercantile Exchange
CANADA:The Winnipeg Commodity Exchange
BRAZIL:Brazilian Futures Exchange Commodities and Futures Exchange
Asia / Pacific:
AUSTRALIA:Sydney Futures Exchange Ltd.

PEOPLE’S REPUBLIC OF CHINA:Beijing Commodity Exchange Shanghai Metal Exchange
HONG KONG:Hong Kong Futures ExchangeJAPAN:Tokoyo International Financial FuturesExchange Kansai Agricultural CommoditiesExchange Tokoyo Grain Exchange
MALAYSIAKula Lampur Commodity Exchange
UKThe London International Financial Futures and Options Exchange The London Metal Exchange
COMMODITY EXCHANGES IN INDIA:(EVOLUTION OF COMMODITY DERIVATIVE MARKETS IN INDIA):
First organized futures market evolved in India by setting up of ‘Bombay Cotton Trade Associtaion Ltd.’ in 1875.
Bombay Cotton Exchange Ltd. was established in 1893 following the widespread discontent amongst leading cotton mill owners and merchants over the functioning of Bombay Cotton Trade Association.
The Futures trading in oilseeds started in 1900 with the establishment of the Gujarati Vyapari Mandali which carried on futures trading in groundnut, castor seed and cotton.
Futures trading in wheat was existent at several places in Punjab and UP. But out of all the most nogbale futures exchange for wheat was chamber of commerce at Hapur set up in 1913
Futures trading in bullion began in Mumbai in 1920
Calcutta Hessian Exchange Ltd. was established in 1919 for Futures trading in raw jute and jute goods. But organized futures trading in raw jute began only in 1927 with the establishment of East Indian Jute Association Ltd. These two associations amalgamated in 1945 to form the East India Jute & Hessian Ltd. to conduct organized trading in both Raw Jute and Jute goods.
Enactment of Forward Contracts (Regulation) Act, 1952

Establishment of the Forwards Markets Commission (FMC) in 1953 under the Ministry of Consumer Affairs and Public Distribution.
SOME IMPORTANT COMMODITY EXCHANGES IN INDIA:COMMODITY EXCHANGE PRODUCTS TRADED1) Bhatinda Om & Oil Exchange Ltd. Bhatinda Gur2) The Bombay Commodity Exchange Ltd., Mumbai
Sunflower Oil, Cotton, Groundnut, Castor Oil-Int’l, Castorseed Oilcake Crude Palm Oil
2) The Kanpur Commodity Exchange Ltd., Kanpur
Rapeseed/MustardseedRapeseed/Mustardseed OilRapeseed/Mustardseed Oil-Cake
3) Ahmedabad Commodity Exchange ltd Cottonseed, castorseed4) Rajdhani Oils and Oilseeds Exchange Ltd., Delhi
Gur, Rapeseed/Mustardseed, Sugar Grade-M
5) National Board of Trade Indore Rapeseed/ Mustardseed/oilcake etc6) The East India Jute & Hessian Exchange., Kolkata
Hessian, Sacking
7) National Multi Commodity Exchange of India Ltd., Ahmedabad
Gur, RBD Pamolein, Crude Palm Oil, Sunflower, Copra, Cotton, Sugar, Sacking etc.,
COMMODITIES IN WHICH FUTURES TRADING IS PERMITTED:COMMODITY GROUP PRODUCTS
Fibres and Manufacturers Kapas, Hessian Indian Cotton, Staple Fiber Yarn, Sacking Gram
Spices Pepper, Turmeric
Edible Oilseeds and Oil RBD Pamolein, soyabean, Copra, Cotton, Groundnut, Sesamum, Crude Palm Oil, Vanaspati
Others Gur, Potato, Sugar, Coffee, Rubber
Metals Aluminum Ingots, Nickle, Copper, Zinc, Lead, Gold, Silver

ANNEXURE-II
ABOUT THE COMPANY/FIRM:
Prabodh Group stands for a movement in the business field, which creates wealth but uses it predominantly for social purpose. Thus, Prabodh is a group of entrepreneurs who conduct a cluster of professional activities, the surplus generated from which is dedicated to the work of Jnana Prabodhini, an educational trust in Pune.
Prabodh, the very name indicates its origin from the educational heritage of this innovative institution- Jnana Prabodhini, which means Awakening through Knowledge. The alma mater cherishes a life- long relationship with its students and puts forth a dream of solving problems of our country through man - making education. Financial autonomy is preserved by its alumni by offering Guru Dakshina -- a devotional sum in gratitude, regularly.
Prabodh Group was founded in 1988 with this very objective. There is a ceiling on the individual income, while the surplus goes back to the society.
Having accomplished excellence in education, the Prabodh members acquired long professional experience in various fields. The multi dimensional activities as elaborated further, depict this versatility of the

Prabodh Group.
It, therefore, transcends the conventional concepts of modern business. Prabodh is a highly professional body in Print Expression, Manufacture, Investment and Consultation. Not only an efficient service is provided, but a hope for the future is incarnated in the endeavour, that is Prabodh.
PRABODH GROUP
Prabodh Sankul Pvt. Ltd. Prabodh Udyog Prabodh Vinimay Prabodh Sampada Prabodh Samwardhan Prabodh Nirman Pvt. Ltd. Prabodh Artha Sanchay Pvt. Ltd.
Prabodh Artha Wardhini Ltd.
Here we give the details of the investment consulting department:
INVESTMENT CONSULTANCY:
SHARE BROKERS
Members of Pune Stock Exchange Members of National Stock Exchange Services of Bombay Stock Exchange.
FUND MANAGERS Mutual Fund of more than 400 Individual Investors. Present amount deployed is above
Rs. 8 to 10 crores Corporate Funds of even larger size being handled through us. Inter - Corporate Deposits
Bill Discounting facilities Funds Deployed in Share Market for Attractive Returns Funds fully secured against shares.
INVESTMENT SERVICES Portfolio Advice New Issue services

Secondary Market Operations.
Prabodh has recently started the commodity futures trading through ‘MCX’ and ‘NCDEX’ and this project is done in this department.

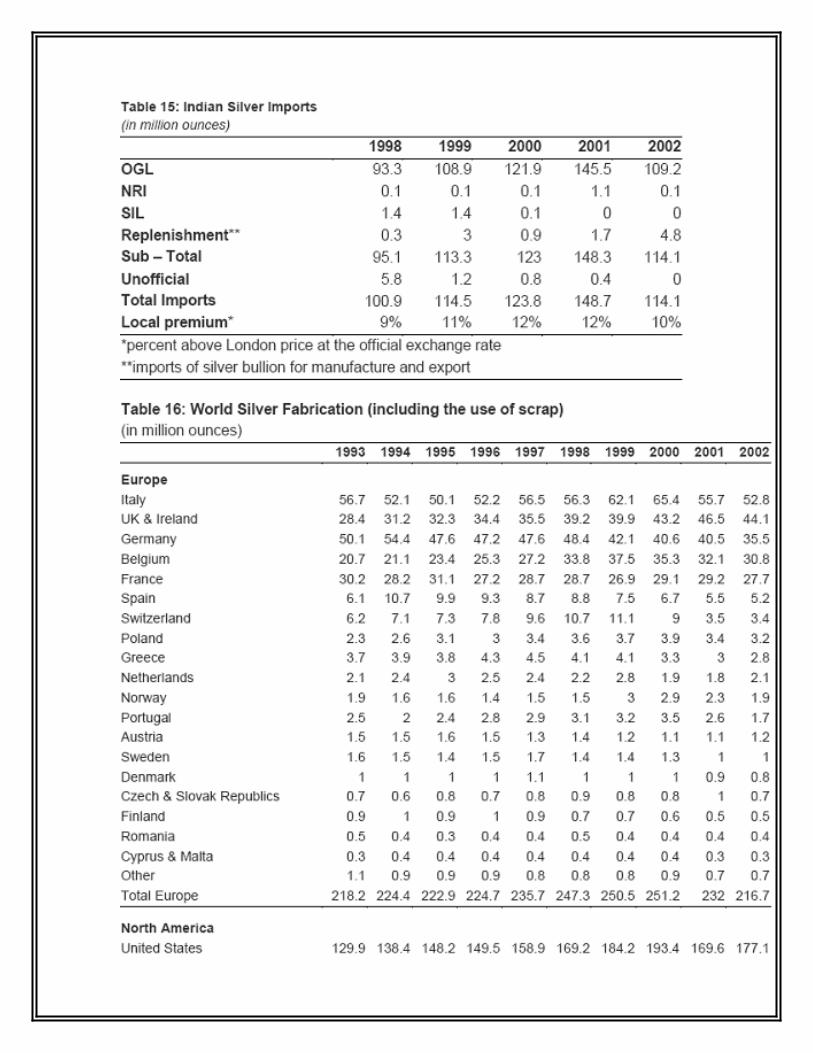
CONCLUSION