assessment of time and practice resources required … · background: there is an epidemic of...
TRANSCRIPT
714 Journal of Managed Care Pharmacy JMCP November/December 2006 Vol. 12, No. 9 www.amcp.org
BACKGROUND: There is an epidemic of chronic kidney disease (CKD) and ahigh prevalence of anemia (47%) observed in CKD patients. Little is knownabout the cost in physician office resources of routine erythropoiesis-stimu-lating protein (ESP) administration to treat patients with nondialysis CKD.
OBJECTIVES: The objectives of this research were (1) to explore the patternsof care in physician offices where nondialysis CKD patients receive routineESP injections, (2) to examine differences in the monthly resources andrelated costs incurred by physician offices in treating patients receivingeither weekly (QW) or monthly (QM) ESP regimens, and (3) to identify oppor-tunities to minimize the burden of CKD treatment on physician offices.
METHODS: An observational, cross-sectional time and motion assessmentwas performed in 10 community-based outpatient nephrology practices (5 QW and 5 QM practices); each practice had ≥40 patients on routine ESPtherapy for nondialysis CKD. Three observers trained in health care researchdocumented injection-related tasks and time associated with 91 ESP injec-tion procedures (47 QW and 44 QM) from patients’ arrival to and departurefrom the physician office, office personnel follow-up on billing and docu-mentation, and injection-related staff time. Monthly injection times for QMwere calculated by summing the time required to perform the tasks associ-ated with administering a single injection of ESP to subjects, as documentedby observers. Total monthly per-patient medical practice costs for providingQM ESP injections were calculated, including labor costs (calculated byapplying average wage rates of practice staff to time observed for the spe-cific activities performed) and supply costs (based on average list pricesfound in medical supply catalogs). Monthly injection times and costs for theQW regimen were calculated by summing the same list of activities as forthe QM regimen and multiplying by 4.3 (4.3 weeks per month). Nephrologypractice personnel completed a questionnaire summarizing practice charac-teristics and estimated the time required for some of the injection-relatedactivities. The time and cost associated with each task were analyzed usingdescriptive and comparative statistics (i.e., Fisher’s exact test and t test).
RESULTS: On average, patients spent 21 minutes in the clinic for a routineinjection visit (QW: 17 minutes, QM: 25 minutes; P=0.053), during which 11 minutes (52%) were spent interacting with clinic staff (QW: 8.9 minutes,QM: 13.4 minutes; P=0.005). In the time spent interacting with staff, 3 min-utes (QW: 2.9 minutes, QM: 3.6 minutes; P =0.065) were for dose adminis-tration and 8 minutes (QW: 5.3 minutes, QM: 9.8 minutes; P=0.011) were forstaff providing various services to the patients, including registering patientson arrival, examining patients (vital signs, weight, blood work), consulting withpatients, and scheduling patients’ next visits. Each month, clinic staff spent atotal visit average of 38 minutes providing anemia-related treatment for eachQW injection patient, compared with 13 minutes for each QM injection patient(P <0.001). After patients’ departure, clinic staff spent additional time (notquantified) on billing, filing claims, and other administrative responsibilitiesmost of which could not be observed during our 1-day observation. Theaverage total monthly practice cost of providing ESP therapy to a QW patient($17.00 [95% confidence interval (CI), 13.00-27.13]) was more than doublethat for a QM patient ($6.78 [95% CI, 5.34-9.12]); (P=0.004). Differences invisit-related labor costs (QW: $8.34, QM: $3.43; P=0.108) and injection sup-ply costs (QW: $4.39, QM: $1.67; P <0.001) accounted for the largest portions
Authors
RESEARCH
Assessment of Time and Practice Resources Required to Provide Weekly or Monthly Erythropoiesis-Stimulating Protein Therapy
to Chronic Kidney Disease Patients in the Physician Office SettingMARIALIZA BERNARDO, MD; PAUL CRAWFORD, MD; JOACHIM HERTEL, MD; CHRIS SHOLER, MD;
XIAO XU, PhD; THOMAS GOSS, PharmD; RESHMA KEWALRAMANI, MD; and DENISE GLOBE, PhD
of the total monthly cost differential between the treatment regimens. QM dosing would require, on average, 83 hours less staff time and $2,044 less estimated cost treating 200 patients per month compared with weeklyadministration per clinic.
CONCLUSIONS: Administering routine ESP injections to nondialysis CKDpatients for anemia using a QM regimen results in substantial time and costsavings compared with a QW therapy regimen. Managing patients on less-frequent ESP dosing schedules may alleviate medical practice burden byreducing the staff time and supplies related to providing injections in theoffice.
KEYWORDS: Nondialysis chronic kidney disease, Anemia, Routine ESP admin-istration, Patterns of nephrology care, Resource requirement
J Manag Care Pharm. 2006;12(9);714-25
MARIALIZA BERNARDO, MD, is a principal investigator, SouthwestHouston Research, Houston, Texas; PAUL CRAWFORD, MD, is a principalinvestigator, Associates in Nephrology, Evergreen Park, Illinois; JOACHIMHERTEL, MD, is a principal investigator, Nephrology Associates, PC, Augusta,Georgia; CHRIS SHOLER, MD, is a principal investigator, Plaza Medical Group,Oklahoma City, Oklahoma; XIAO XU, PhD, is a principal and THOMASGOSS, PharmD, is a vice president, Outcome Services, Covance, Inc.,Gaithersburg, Maryland; RESHMA KEWALRAMANI, MD, is a medicaldirector and DENISE GLOBE, PhD, is director of global health economics,Nephrology Team, Amgen, Inc., Thousand Oaks, California.
AUTHOR CORRESPONDENCE: Marializa Bernardo, MD, PrincipalInvestigator, Southwest Houston Research, 8323 Southwest Fwy., Houston, TX 77074. Tel: (713) 484-8123; Fax: (713) 484-7859; E-mail: [email protected]
Copyright© 2006, Academy of Managed Care Pharmacy. All rights reserved.
ABSTRACT
t is estimated that chronic kidney disease (CKD) affectsapproximately 20 million Americans, with 80,000 newlydiagnosed per year.1,2 The incidence and prevalence of the
disease doubled in the past decade, and the rates reportedlyincreased in all 50 states over the same time period. Much ofthe observed increase in CKD stems from epidemic increases inobesity, type 2 diabetes, and hypertension among the U.S. population, with diabetes and hypertension estimated to accountfor 70% of new cases.3 Improved treatments for hypertension, diabetes mellitus, and coronary disease have increased longevity inaffected patients and, therefore, their likelihood of developingCKD.1,2 Regardless of the type of kidney disease, the major
I

outcomes of CKD include progression to kidney failure, complica-tions from decreased kidney function, and developmentof cardiovascular disease.4 For instance, approximately 20% ofpatients with severe CKD progress to dialysis.5
Although it is well recognized from the third NationalHealth and Nutrition Examination Survey (NHANES)6 thatthere is an increasing prevalence of early-stage kidney diseaseand an increasing incidence of end-stage renal failure, whichleads to poor outcomes, CKD is still underdiagnosed and under-treated.7 To address this issue, the National Kidney Foundation(NKF) Kidney Disease Outcome Quality Initiative (K/DOQI)Advisory Board was tasked to develop clinical practice guidelinesto define CKD and to classify stages in the progression of CKDin 2000. The classification and clinical practice guidelines disseminated in 2002 were based on evaluation of the severityof kidney disease, association of level of kidney function with complications, and stratification of risks for loss of kidneyfunction and development of cardiovascular disease. The systemclassifies individuals into 5 categories, based on glomerular filtration rate (GFR) levels from less severe (Stage I) to most severe(Stage V) (Table 1). GFR may be estimated from serum creatinineand patient characteristics using algorithms including theMDRD (modification of diet in renal disease) or the Cockcroft-Gault formula.8,9 The 2006 K/DOQI guidelines defines anemia inCKD patients by a hemoglobin level of <13.5 g/dL in men and 12 g/dL in women.10 Anemia prevalence rises with the worseningof kidney function, from 26.7% of patients in the early stages ofCKD to 53.6% in the latest stage of CKD before dialysis.11
Anemia is a common complication in CKD patients due tothe kidneys’ inability to produce sufficient endogenous erythro-poietin, a hormone essential for stimulating the bone marrow to produce new red blood cells and prevent anemia.Approximately half of CKD patients with GFR <60 cc/min/1.73 m2
have CKD-related anemia,12 and anemia has been associatedwith decreased quality of life (QOL) and increased morbidity,health care costs, and mortality.13-16 CKD and anemia combinedare thought to be synergistic for adverse health outcomes, particularly for cardiovascular morbidity and mortality.17,18
Importantly, higher hemoglobin levels in CKD patients, boththose dependent on dialysis and those not yet on dialysis, haveconsistently been associated with improved QOL and lower
hospitalization and mortality rates.18-21 While this association isunderstood, CKD patients routinely present to dialysis withanemia. Data from the Dialysis Outcomes and Practice PatternsStudy (DOPPS) indicated that 27% of patients new to end-stagerenal disease treatment received erythropoietin prior to initiation ofdialysis, while 66% had a hemoglobin level of <11 g/dL.22,23
The advent of erythropoiesis-stimulating proteins (ESPs)dramatically reduced the use of red blood cell transfusions asthe mainstay of therapy for CKD anemia. Epoetin alfa (Epogen),was approved by the U.S. Food and Drug Administration (FDA)for the treatment of anemia in dialysis patients, followed by theapproval of ESPs for the treatment of anemia in June 198924-26
in CKD patients (I–IV) not on dialysis (epoetin alfa, Procrit in December 1990)27,28 and darbepoetin alfa, Aranesp, inSeptember 2001).29 However, despite the efficacy of ESPs andMedicare’s willingness to pay for ESPs in patients with hemat-ocrit <33% (after ruling out other treatable causes of anemia), ithas been speculated that the low proportion of CKD patientsreceiving anemia treatment may have to do with the cumber-some frequency of physician visits that is required.
ESP regimens are commonly administered in the outpatientsetting, including physician offices and nephrology clinics.Common ESP regimens include dosing frequencies rangingfrom 3 times per week (TIW) to monthly (QM), depending onpatient and physician preference as well as choice of ESPadministered. Four recent studies have established the safetyand efficacy of QM dosing for darbepoetin alfa and epoetin alfain the treatment of anemia in CKD patients.30-33 The Ling et al.study showed that, for patients initiated on weight-based,every-2-week dosing of darbepoetin alfa, the interval could beextended to QM and the dose was doubled.30 One of the 4 studies,Disney et al,31 was an open-label study of darbepoetin alfa. Studies have shown that different ESP dosing regimens routinely achieve comparable clinical results based on achievingtargeted hemoglobin levels.34-36 Since clinicians perceive differentESP regimens to achieve comparable clinical results, economicand operational factors could influence the therapy and dosing regimen most commonly adopted by nephrology practices andthe protocols implemented in these practices.
Currently, little is known about the quantity of medical clinicresources (including time and disposables [e.g., syringes, needles],
Assessment of Time and Practice Resources Required to Provide Weekly or Monthly Erythropoiesis-Stimulating Protein Therapy to Chronic Kidney Disease Patients in the Physician Office Setting
Stage of Chronic Kidney Disease
I II III IV V
eGFR range ≥90 ml per minute per 60-89 ml with evidence 30-59 ml 15-29 ml <15 ml or dialysis1.73m2 of body surface of kidney damagearea with evidence of
kidney damage
eGFR = estimated glomerular filtration rate.
Stages of Chronic Kidney DiseaseTABLE 1
www.amcp.org Vol. 12, No. 9 November/December 2006 JMCP Journal of Managed Care Pharmacy 715

716 Journal of Managed Care Pharmacy JMCP November/December 2006 Vol. 12, No. 9 www.amcp.org
but excluding ESP product costs) consumed by administeringroutine ESP injections to nondialysis anemic CKD patients andwhether there is an impact of dosing regimens, particularly dosingfrequency, on medical clinic processes and/or burden.According to Crémieux et al., extended dosing intervals couldtranslate into favorable clinical and economic outcomes forpatients and caregivers; however, the study did not address theimpact of extended dosing on medical clinics.37 In-office ESPadministration to nondialysis CKD patients for anemia correctionconsumes a significant amount of time and medical practiceresources. With the epidemic of CKD, managing patients onless-frequent ESP dosing schedules may alleviate practice burdenby reducing the staff time and supplies related to providinginjections in the office. Less-frequent dosing could facilitateredirection of medical practice resources to administration ofother services and thus could increase capacity in the nephrologist’soffice and improve the quality of CKD care for a greater num-ber of patients.38 Therefore, knowing this type of informationshould be helpful to any medical practice with potentially constrained resources, including but not limited to pharmacy-based injection clinics, managed care clinics, and clinics acceptinggovernment reimbursement (e.g., Medicaid and Medicare).
The purpose of the Anemia Management Office ResourceEvaluation Study was to examine patient-flow characteristicsand assess patterns of care in clinics where nondialysis CKDpatients receive ESP therapies. The study is intended to identifythe overall impact of routine ESP administration on practiceburden and to assess the impact of ESP injection administrationdosing frequency on the practice burden in terms of monthlyinjection administration time and monthly injection-relatedsupply costs, excluding ESP costs.
■■ Methods Study Design An observational, cross-sectional time and motion study wasconducted to assess practice resources related to ESP injection.A convenience sample of 10 nephrology practices that treated atleast 40 CKD patients (a relatively high volume) with a standardQM or QW (weekly) ESP regimen was included in the assess-ment. Five sites routinely administering ESP QM and 5 sitesroutinely administering ESP QW were selected for comparabilityof patient volume for the 2 regimens according to the followingsite selection criteria: • Outpatient CKD clinic administering ESP QM or QW in the
office with ≥40 patients receiving one or both regimens • Willingness to allow time and motion observation of ESP-
related practice activities• Willingness to complete a brief practice survey
Selection of sites with comparable volumes of patientsreceiving ESP therapy was required to reduce the risk of biasassociated with scale economies. Time and motion observationdata were collected from June through September 2005. The study
protocol was approved by an accredited central human institu-tional review board (IRB).
QM and QW regimens were defined by the dosing intervalonly, not by the product. The ESP injection could be any typeof ESP drug. The observations that we recorded at each sitewere either QM or QW at a particular site even though some ofthe sites administered ESPs at both dosing intervals. Given thatonly 1 regimen was observed at each site, we thus classified thesites as QM or QW in this study.
Data Collection Three researchers (observers), each with 2 to 4 years of healthservices research background, received standardized training onobserving and recording times associated with various standard activities associated with ESP injection administration.The standardized 6-hour training included reviewing the studyprotocol, observation process, and practice flow; practicing timerecording by watching injection videos; comparing documentedtimes across observers and trainers; and analyzing the differ-ences. The trained observers went to each site in pairs for a 1-dayobservation and observed all the injections throughout theentirety of the injection clinic schedule for the day on which theoffice observation was scheduled. Activities and time wererecorded from each patient’s arrival in the clinic/office until thepatient’s departure. After the patient’s departure, activities relatedto the injection, such as billing, were followed and recorded. To control for possible observer bias by treatment regimen, reasonable efforts were made to ensure that observers were“blinded” to regimen. Specifically, the trained observers were notprovided a priori information concerning the type of ESP usedor the frequency of patient dosing in the practice while theywere on site to conduct the time and motion assessment. Thestudy coordinators and staff working with the observers weretrained not to inform the observers; the intent was for theseobservers to be unbiased with regard to the treatment regimen. Atotal of 44 QM injections were observed in the QM sites, and 47 QW injections were observed in the QW sites. To assessinterrater reliability, the extent of the consensus among theobservers, 2 trained observers at each site observed 10% of theinjections (1 injection per site) concurrently. The injection to beobserved concurrently was selected based on random numberlists generated a priori (assuming an average of 8 injections tobe observed per site).
Time and Motion Task List
A standardized task list was developed and used to record timesin minutes and seconds. Data collected during the time andmotion assessment included the number of injections scheduledfor the same time slot, time of day the injection was administered,patient sign-in and sign-out time, injection-related clinical activities,injection-related administrative activities, clinical supplies used,providers seen during visit, and reimbursement-related activities.
Assessment of Time and Practice Resources Required to Provide Weekly or Monthly Erythropoiesis-Stimulating Protein Therapy to Chronic Kidney Disease Patients in the Physician Office Setting

Assessment of Time and Practice Resources Required to Provide Weekly or Monthly Erythropoiesis-Stimulating Protein Therapy to Chronic Kidney Disease Patients in the Physician Office Setting
The injection-related clinical and administrative activities weregrouped into 5 main categories: 1. Visit-related activities. Greeting patient and taking him/her
to the exam room, taking vital signs/blood pressure, weighingpatient, taking blood sample, consulting by physician, dismissing patient
2. Dose administration-related activities. Reviewing patient chartand confirming dose, obtaining product from central storagearea, preparing injection, administering injection, disposingof waste, documenting ESP injection
3. Front office-related activities. Scheduling appointments,rescheduling appointments, appointment remindercalls/cards, arranging travel for ESP patient, registeringpatient on arrival, pulling patient chart, filing labs intopatient chart, filing ESP records into patient chart, refilingpatient chart
4. ESP-related financial activities. Preparing bills, recordingpayments, filing claim, making calls to payers, preparingsupporting documentation
5. Other ESP-related activities. Counting and ordering ESPinventory, stocking ESP inventory, making holiday arrange-ments for patient, recording and delivering iron prescriptionsAny activities observed that were not on the standard check-
list were recorded under “other” where room was provided for abrief description. Patients’ waiting time also was documented.In addition, supplies used in the ESP administration, such asgloves, alcohol swabs, needle, and syringe, were documented inthe task list.
Practice Questionnaire
Each investigator also completed a questionnaire assessing specificnephrology practice characteristics, including practice size,
Data Sources for ESP Injection-Related Practice Resource UtilizationTABLE 2
Observed (Time, Staff, and Supplies)
Patient signed-in and signed-out time
Visit-related activities: greeting patient and takingto the exam room, taking blood pressure/vitalsigns, weighing patient, taking blood samples,physician consultation, and dismissing patient
Dose administration-related activities: reviewingpatient chart and confirming dose, obtaining product from central storage area, preparing injection, administering injection, disposing waste, and documenting ESP injection
Front office-related activities: scheduling appoint-ments, rescheduling appointments, providingappointment reminder calls/cards, arranging travelfor ESP patient, registering patient on arrival,pulling patient chart, filing labs into patient chart,filing ESP records into patient chart, and refilingpatient chart
Other ESP-related activities: counting and orderingESP inventory, stocking ESP inventory, making holiday arrangement for patient, preparing andadministering iron prescriptions
Financial activities: preparing bills, recording payments, filing claim, making calls to payers, and preparing supporting documentation
Reported by Practices (Time)
Rescheduling appointments
Appointment reminder calls/cards
Arranging travel for ESP patient
Front-office preparation for injection for patient
Average ESP injection (preparing medication tocompleting administration and waste disposal)
Preparing bills/filing claims
Following up on billing (calls, support document-ation, bookkeeping)
Recording payments, updating and managing ESP-related accounts receivables
Arrangements, including for patient iron prescrip-tions, etc.
Counting ESP inventory
Ordering ESP inventory
Stocking ESP inventory
Calculated*
Per injection time:
Total time patient is in the practice: calculated aspatient signed-out time minus patient sign-in time
Visit-related activities time: sum of observed visit-related activities times
Dose administration time: sum of the observedtime for dose administration activities
Front office-related activities time: sum of theobserved time for front office-related activities
Other ESP-related activities time†: sum of theobserved time for other ESP-related activities
Financial activities time†: sum of the observedtime for financial activities
Total practice staff time: sum of the time for visit-related activities, dose administration, front office-related activities, other ESP-relatedactivities† and financial activities†
Per-injection labor cost†: calculated by applyingaverage wage rates of practice staff to timeobserved for the specific activities performed
Per-injection supply cost: calculated by multiplyingaverage list price by quantity for specific suppliesused (ESP drug cost not included)
Monthly injection-related time and cost†QM regimen: same as per-injection time and costQW regimen: per-injection time and cost multi-plied by 4.3
* Calculated time and cost were based on observed activities only.† Since most of the other ESP-related activities and financial activities occurred at different locations and/or times other than the days when we conducted on-site
observations, we did not report time or cost associated with these 2 categories of activities. Further, the total practice staff time and cost did not include these categories in this manuscript.
ESP = erythropoiesis-stimulating protein; QM = each month; QW = each week.
www.amcp.org Vol. 12, No. 9 November/December 2006 JMCP Journal of Managed Care Pharmacy 717

718 Journal of Managed Care Pharmacy JMCP November/December 2006 Vol. 12, No. 9 www.amcp.org
Assessment of Time and Practice Resources Required to Provide Weekly or Monthly Erythropoiesis-Stimulating Protein Therapy to Chronic Kidney Disease Patients in the Physician Office Setting
patient type (by insurance), time spent providing injection-related clinical activities, time spent on reimbursement-relatedactivities for injections, the number of patients routinely scheduledfor shot clinics, the frequency of shot clinics, the length of timeof each shot clinic, proportion of missed appointments for anemiainjections per week, reasons for missed appointments, perceived time involved in administering the injections, billingcodes routinely used for injection visits, barriers to reimbursement,and frequency and type of previsit reminders used. Practice-reported time was not included in the monthly injection-timecalculation outlined below. Table 2 summarizes activities observedand nephrology practice-reported times, as well as formulas usedto calculate summary times and costs.
Methods of Analysis Monthly injection times for QM were calculated by summingthe observed time required to perform the tasks associated withadministering a single injection of ESP to nondialysis CKD subjects,which included injection-related clinical activities (visit-relatedactivities and dose administration-related activities) and injection-
related administrative activities (front office-related activities,ESP-related financial activities, and other ESP-related activities).We were only able to observe ESP-related financial activities (e.g., filing claim, making calls to payers) for 2 injections and toobserve counting and ordering ESP inventory at 1 site. Most ofthese activities occurred at different locations and/or times otherthan the days when we conducted on-site observations. Giventhe limited observations, we did not include time associated withthese tasks in our total ESP-related time calculation. Monthlyinjection times for the QW regimen were calculated by summing the same list of activities as for QM regimen and multiplying by 4.3 (4.3 weeks per month). To compare perceivedtime with actual time spent on various activities, we comparedthe practice-reported injection time as estimated by the study coordinator at each study site to the actual injection time measured by the observer.
Total monthly per-patient practice costs for providing ESPinjections were calculated using labor costs and supply costs.The labor costs were calculated by applying average wage ratesof practice staff to time observed for the specific activities
Nephrology Practice Characteristics for the Sites for Time and Motion StudyTABLE 3
Practice Characteristic QW (n=5) QM (n=5) P Value
Type of practice, n (%) 1.000*Private office 3 (60.0) 3 (60.0)Nephrology clinic 2 (40.0) 2 (40.0)
Number of ancillary personnelMean [SD] 15.2 [9.63] 8.8 [5.31] 0.229†Median (range) 13 (4-29) 7 (4-17) 0.370‡
Average number of patients seen per dayMean [SD] 56.0 [39.8] 44.4 [26.7] 0.603†Median (range) 37 (15-110) 35 (25-90) 0.839‡
Number of nondialysis CKD patients currently seen in the office, n (%) 0.444*100-124 0 (0.0) 1 (20.0)250-274 0 (0.0) 1 (20.0)>300 5 (100.0) 3 (60.0)
Number of patients currently on ESP therapy Mean [SD] 217.6 [160.9] 292.0 [243.6] 0.584†Median (range) 291 (27-400) 200 (60-600) 0.686‡
Practice organizes a specific injection day/time, yes, n (%) 4 (80.0) 4 (80.0) 1.000*Number of hours per week organized for injection
Mean [SD] 10.3 [8.1] 24.3 [10.7] 0.081†Median (range) 8.0 (4.0-21.0) 22.8 (14.0-37.5) 0.154‡
Number of ESP injection patients treated on a typical dayMean [SD] 23.8 [14.6] 20.2 [8.3] 0.643†Median (range) 18 (9-45) 20 (8-30) 0.919‡
Percentage of office hours spent doing injections Mean [SD] 42.9 [40.5] 67.6 [25.7] 0.283†Median (range) 26.7 (8.9-100.0) 62.2 (43.8-100) 0.368‡
* P value from Fisher’s exact test.† P value from student t test.‡ P value from Wilcoxon test.CKD = chronic kidney disease; ESP = erythropoiesis-stimulating protein; QM = each month; QW = each week.
Assessment of Time and Practice Resources Required to Provide Weekly or Monthly Erythropoiesis-Stimulating Protein Therapy to Chronic Kidney Disease Patients in the Physician Office Setting
performed. We used standardized national wage rates from the2005 U.S. Department of Labor/Bureau of Labor Statistics, NationalCompensation Survey, and salary.com to assign practice staffwage rates. The supply costs were based on average list pricesfound in medical supply catalogs. The costs of resources used asdetermined by the activities and supplies listed above weresummed to calculate QM costs, while the monthly costs for QWwere calculated by summing the costs of the resources observed(reported) per injection and multiplying by 4.3 (52 weeks peryear/12 months per year). This method of calculation has beenwidely used in other studies, including studies reported by Fosteret al. in the Journal of the American Medical Association.39
Summary statistics (n, mean, standard deviation [SD], median,and range) were calculated for the continuous variables (e.g., monthly practice-level injection administration time,monthly practice-level billing time, and monthly cost of practiceresources used). Frequency distributions were reported for thecategorical outcomes (e.g., sex, employment status preference
for ESP regimen). Differences between treatment groups werecompared using Fisher’s exact test for categorical variables andthe t test or Wilcoxon test for continuous variables.
The interrater reliability among the observers was calculatedusing 2 methods. First, for all the tasks, we established consensus(measured as the number of agreements [observed/not observed]divided by the total number of observations) and reported as a Kappa statistic. By convention, a Kappa of 0.40 to 0.59 is considered moderate interrater reliability, 0.60 to 0.79 is consideredsubstantial interrater reliability, and 0.80 is considered outstand-ing interrater reliability.40 To assess how similar the observedtimes were between observers for each activity and to whatextent the observers agreed on the length of time taken for eachobserved activity, we calculated the intraclass correlation(ICC).41 The interpretation of ICC is similar to Kappa.
■■ Results We screened 232 nephrology practices to identify 15 sites that
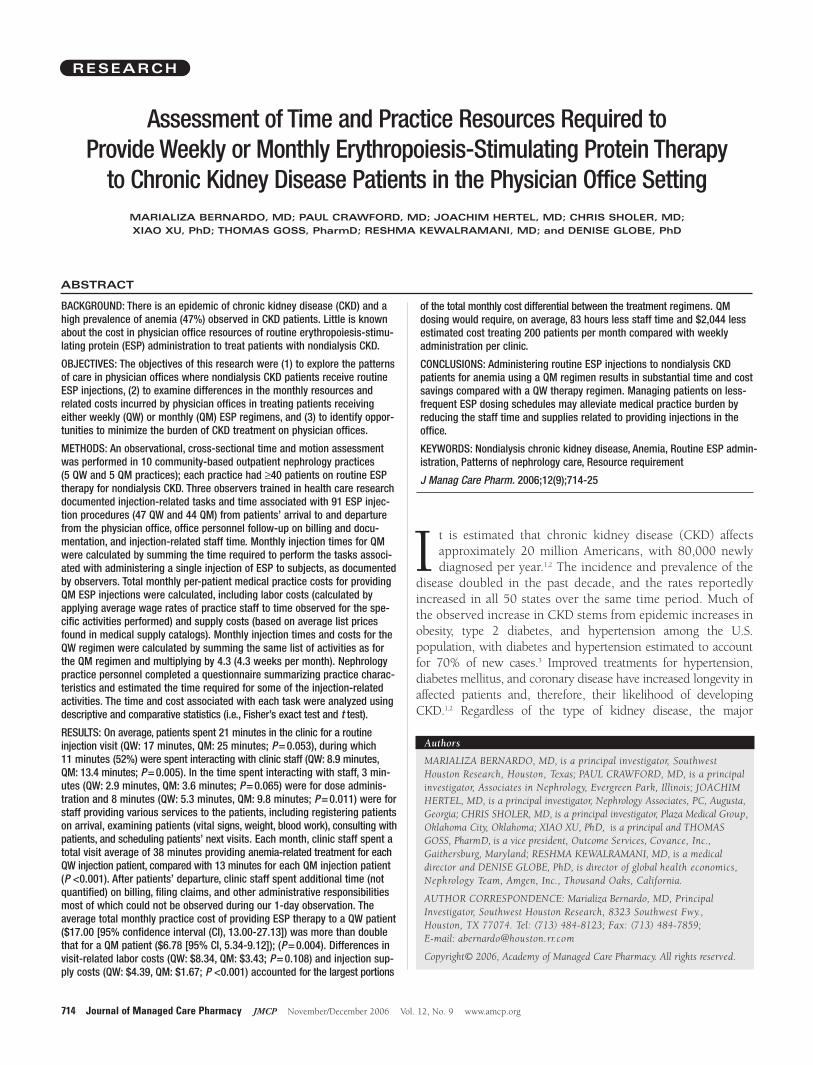
Frequency of Observed ActivitiesFIGURE 1
QM = each month; QW = each week.
www.amcp.org Vol. 12, No. 9 November/December 2006 JMCP Journal of Managed Care Pharmacy 719
A. Taking Blood Pressure/Vital Signs C. Taking Blood Sample
B. Weighing the Patients D. Physician Consultation

720 Journal of Managed Care Pharmacy JMCP November/December 2006 Vol. 12, No. 9 www.amcp.org
Assessment of Time and Practice Resources Required to Provide Weekly or Monthly Erythropoiesis-Stimulating Protein Therapy to Chronic Kidney Disease Patients in the Physician Office Setting
were interested and able to participate in the study and coulduse a central IRB. Among these 15 sites, we selected 10 largesites that met study inclusion criteria. Table 3 summarizes theparticipating study site characteristics by treatment regimen(QW vs. QM). These practice demographics provide severalimportant insights on nephrology practices treating CKDpatients with anemia. On average, 254 patients were receivingESP therapy at each site (218 at QW sites and 292 at QM sites).Among the practices, 80% (4/5 QW and 4/5 QM) reportedusing a specific “injection clinic” day or time to manage routineESP injections. The QW sites reported designating an average of
10 hours per week, while QM practices reported designating anaverage of 24 hours per week for injection clinics. On a typicalday, QW sites provided 24 injections and QM sites provided 20 ESP injections. All the sites participating in this study wereaccepting new patients. None of the differences between QWand QM sites reached statistical significance.
Time Assessments We observed 91 ESP injections—47 in the QW practices and 44 in the QM practices—and when we assessed consensus inactivities observed and time recorded between the observers, weobserved a high degree of interrater reliability (Kappa = 0.81,ICC = 0.79) among the observers. There were differences betweenQW and QM sites in the relative frequency in which routineactivities were performed as part of a visit in which an ESP injec-tion was administered, including weighing the patient, takingblood pressure/vital signs, taking blood for laboratory analysis, andproviding physician consultation (Figure 1 A-D). For example, taking blood pressure/vital signs was not routinely performed in23% of QW observations compared with only 2% of the QMobservations (P=0.004). Physician consultation was only observedin 4% of QW patients but in 21% of QM patients (P = 0.024).There also was a substantial variation in the time spent on injection-related activities between QM and QW injection sites on a per-injection basis (data not presented). For example, the timespent administering an injection took only half a minute for theQW regimen but 1 minute for the QM regimen (P <0.001).Among patients who received physician consultation, the averageconsultation time was 7.8 minutes per QM patient but 5.2 minutesper QW patient (P=0.684).
Figure 2 summarizes the observed time per patient permonth spent on injection-related activities. Each month,nephrology practices spent a mean (SD) of 38.2 (33.1) minuteswith each QW patient (8.9 minutes at injection level) comparedwith 13.4 (7.3) minutes with each QM patient (P <0.001 forcomparison at monthly level; P = 0.0048 for comparison at injec-tion level). Further, QW and QM sites reported 150 and 87.5(median) additional minutes per patient per month, respectively,for administrative tasks related to ESP injections, which werenot observed directly by the trained observers. We note that therelationship between QM and QW injections is not linear (i.e., QW injections do not require 4 times the time observed for 1 QM injection on a per-patient per-month basis).
Per month, patients on QW regimen spent 74.8 minutes innephrology clinics receiving their ESP injections, while patientson QM regimen only spent a total time of 24.8 minutes (P <0.001, Figure 2). Patients receiving ESP injections spent asubstantial amount of time waiting and on activities other thanreceiving the injection. Overall, patients spent a mean (median)time of 21 (19) minutes in the clinic for a routine injection visit(mean: QW: 17 minutes, QM: 25 minutes; P = 0.053). Duringthis time, 3 minutes (QW: 2.9 minutes, QM: 3.6 minutes;
Summary of Practice Time Per Patient Per Month
FIGURE 2
ESP = erythropoiesis-stimulating protein; QM = each month; QW = each week.
Difference in Practice-Reported VersusObserved ESP Injection-Related ActivityTime (Minutes per Injection)
FIGURE 3
ESP = erythropoiesis-stimulating protein; QM = each month; QW = each week.

Assessment of Time and Practice Resources Required to Provide Weekly or Monthly Erythropoiesis-Stimulating Protein Therapy to Chronic Kidney Disease Patients in the Physician Office Setting
P = 0.065) were spent interacting with clinic staff for doseadministration (reviewing chart, confirming dose, preparing andadministering injection, disposing of waste, and documentinginjection) and 8 minutes (QW: 5.3 minutes, QM: 9.8 minutes;P = 0.011) were spent on staff providing various services to thepatients, including registering patients on arrival, examiningpatients (vital signs, weight, blood work), consulting withpatients, and scheduling patients’ next visits. The other 10 minuteswere spent on waiting (QW: 8.8 minutes, QM: 11.6 minutes; P=0.319).
Observer-Questionnaire Agreement Some ESP-related activities, such as rescheduling appointments,front-office preparation for injection for patient, and actual ESPinjection, were both observed and estimated by practices. Thesites consistently overestimated the time spent on routine injection-related activities by a substantial amount (Figure 3). For example,the practices estimated spending 7 minutes preparing medicationto completing administration and waste disposal for QW injectionand 15 minutes for QM injection per injection, but only 2.7minutes for QW injection and 3.4 minutes for QM injectionwere observed.
Practice CostsOne of the main objectives of this study was to estimate themonthly costs of administering ESP regimens from the nephrologypractice perspective. The mean (SD) total monthly nephrologypractice cost of providing ESP therapy to a QW patient ($17.00[21.80]) was more than double that for a QM patient ($6.78[6.20]), respectively, for activities observed in this study. A summary of the components of the monthly cost of providingan ESP regimen is provided in Figure 4. Mean costs were different between the QM and QW groups for total monthlyinjection-related practice costs (P = 0.004), labor costs of visit-related (P=0.108), dose administration-related (P <0.001), andfront office-related activities (P = 0.005), and injection-relatedsupplies costs (P <0.001). As mentioned earlier, since most ofthe other ESP-related activities (i.e., ordering and counting ESPinventory) and financial activities (i.e., filing claims, makingcalls to payers) occurred at different locations and/or timesother than the days when we conducted on-site observations,the labor costs estimates associated with practice staff time didnot include time of these 2 categories of activities.
■■ DiscussionThis is one of very few studies42,43 to collect empirical data onactivities and resource utilization associated with routine ESPadministration from nephrology practices (outpatient clinicsand physician offices) administering in-office ESP therapy andthe only study to our knowledge to report these data fromnephrology offices on nondialysis CKD patients. Our studyobserved that the average number of ancillary personnel at the
QW sites was almost 100% higher than at the QM sites, whilethe average number of patients seen per day was only about26% higher. Further, the number of patients on ESP therapy atQM sites was about 34% higher compared with QW sites.
Management of CKD patients generally includes monitoringpatients’ vital signs, weight, and lab results and adjusting therapyaccordingly. Although we observed that these activities were notnecessarily performed routinely at each injection visit, they wereperformed in a larger proportion of observed QM injectionscompared with QW injections. In this study, there was no evidence that more frequent office visits for injection resulted inmore comprehensive care. While this study provides anoverview of the activities and staff resources used during routineESP injection visits, there was a notable variation in the averagetime spent per injection: staff spent an average of 13 minutesinteracting with QM patients while only 8.9 minutes with QW patients per injection. The relationship between QM andQW injections is not linear (i.e., QW injections do not require4 times the time observed of 1 QM injection on a per-patient-per-month basis). Patients treated with a QM regimen spentmore time with their physicians, nurse practitioners, and nurses fortheir consultation compared with patients on a QW regimen (4%of QW [equivalent to 17% QM] and 21% of QM patients had aphysician consultation observed, with the mean observed timebeing 5.2 minutes for QW patients and 7.8 minutes for QMpatients).
The average number of patients receiving injections in theobserved nephrology practices each month was more than 200.Each month, nephrology practices spent a mean of 38.2 minuteswith each QW patient and 13.4 minutes with each QM patient.
ESP Injection-Related Practice Burden(Cost [US$] Per Patients Per Month)
FIGURE 4
* These summary costs do not include the cost of unobserved practice activities (such as billing, inventory), overhead-related costs (e.g., practice management,malpractice, rent), or ESP drug cost.
† P values from t test.ESP = erythropoiesis-stimulating protein; QM = each month; QW = each week.
www.amcp.org Vol. 12, No. 9 November/December 2006 JMCP Journal of Managed Care Pharmacy 721

722 Journal of Managed Care Pharmacy JMCP November/December 2006 Vol. 12, No. 9 www.amcp.org
Assessment of Time and Practice Resources Required to Provide Weekly or Monthly Erythropoiesis-Stimulating Protein Therapy to Chronic Kidney Disease Patients in the Physician Office Setting
Considering the number of patients receiving injections, thenephrology practices spent 82.7 more hours per month performing observed injection-related activities to treat 200QW patients compared with 200 QM patients. Stated anotherway, the observed staff time required to administer QW injec-tions to 200 patients each month is equivalent to the observedstaff time required to administer QM injections to 570 patients,which suggests that switching from a QW to a QM injectionschedule could increase nephrology practice capacity by 185% ina practice treating 200 patients per month. Also, at a monthlylevel, the total monthly nephrology practice cost was twice ashigh for providing QW regimen compared with QM regimen(mean cost: QW $17.00, QM $6.78). To put the estimates in thecontext of the number of patients receiving injections in a busynephrology practice treating 200 patients per month, the med-ical practice would have incurred an estimated $2,044 more intotal monthly practice costs when providing QW ESP therapycompared with a QM regimen.
On the basis of the findings from the present study, in estimating time savings for providing ESP injections to a hypo-thetical clinic size of 200 patients on a cumulative monthlybasis, QM dosing would require, on average, 83 fewer hours ofstaff time and $2,044 less cost per month compared with QW.It is possible that the time saved could be used to see other CKDpatients or to provide other components of CKD care. CKD clinicsthat provide comprehensive care for anemia management provided by nurse practitioners have reported positive out-comes of slowed progression of CKD among patients, andimproved blood pressure control, medication compliance, and diabetes self-management skills.44,45 With the practices having more time, more comprehensive and quality care couldbe provided to patients to improve their overall health and well-being.
Given that some of the activities (such as billing and inventory)were not observed, the actual medical practice burden is likelygreater than the time and costs presented in this study. Theunobserved time (e.g., practice preparation time, retrieval oflaboratory results) could not be included because this informationcould not be collected accurately at the patient level. In addition,our estimate of medical practice costs (based on time, labor, anddisposables) clearly excludes the costs associated with practiceoverhead and malpractice insurance expenses. The overallweighting of the relative value unit (RVU) for typical physicianservices comprises 3 factors: a work component (approximately30%-35%), practice expense component (approximately 63%-68%), and physician liability insurance component (2%-3%) forcommon injection and level 1 evaluation and managementcodes. The payment rate for a routine administration (CurrentProcedural Terminology [CPT] code 90772) is approximately$18.57 per injection, and CPT code 99211 is approximately$21.60, according to the 2006 Medicare Physician Fee Schedulefrom the Centers for Medicare and Medicaid Services (CMS).
Using the RVU proportion of the work component, medicalpractices are reimbursed from $5.57 to $7.56 per injection for injection-related work. The time observed in the practices represented only a proportion of the staff work time per injection.Thus, the current reimbursement rate may be insufficient forthe amount of work associated with administration practices for injections.
An important observation from the current study is theapparent discrepancy between practice-reported estimates oftime spent on activities, which were both observed directly bythe trained observers and self-reported by the medical practices.For the ESP injection-related activities that were both recordedby observers and reported by practice staff, sites overwhelminglyand consistently overestimated the time sent on routine injection-related activities, possibly because practice staff had a difficulttime separating out time for discrete tasks. This finding is consistentwith the finding from another time and observation studyreporting physician activities during time out of the examinationroom.46 Given that the nephrology practice personnel overestimatedthe resources required for routine ESP administration, theymight underestimate their capacity to treat nondialysis CKDpatients, which validates the need for studies like this.
LimitationsWhile the sample size studied was sufficient to observe some ofthese important differences between QM and QW regimens, itis possible that other important differences may not have beenobserved and that the results cannot be generalized to all sitesproviding ESP therapy to CKD patients. First, this studyfocused on sampling large nephrology practices to ensure itstimely completion. A broad sample of sites was contacted toassess interest in participation; however, the participation ratewas quite low due to the criterion of selecting large nephrology practices that currently had, on average, at least 40 CKDpatients with anemia requiring ESP injections. The timeobserved might underestimate the actual activity time, given that the participation sites might be more efficient in injection-related activities because of high patient volume.
Second, this is a convenience sample because the clinics volunteered to participate. It is possible that these sites may differ in some unknown ways from other CKD practices that routinely provide ESP therapy. On one hand, we are awarethat our trained study observers were in the nephrology practices for only 1 day per practice site, and it is possible thatthe injections we observed are not able to be completely generalized to the nephrology practices on other days. On theother hand, convenience samples have been frequently used inpublished research. According to Kalton,47 most behavioral andsocial science studies use convenience samples consisting ofstudents, paid volunteers, and patients. Studies with such samples are useful primarily for documenting that a particularcharacteristic or phenomenon occurs within a given group or,
Assessment of Time and Practice Resources Required to Provide Weekly or Monthly Erythropoiesis-Stimulating Protein Therapy to Chronic Kidney Disease Patients in the Physician Office Setting
alternatively, for demonstrating that not all members of thatgroup manifest a particular trait. Such studies are also very useful for detecting relationships between different phenomena.As this study was based on a convenience sample, P values frominferential statistics should be interpreted carefully.
A third potential limitation to this study includes the factthat we preselected the injection intervals to study. We knowthat other common regimen frequencies, such as Q2W, Q3W,and Q5W (every 2, 3, and 5 weeks, respectively), would be ofinterest and relevant to the practicing nephrology community,but these dose regimens were beyond the scope of the currentstudy and would have added complexity and cost to study designand execution. We also note with interest that this study providedsufficient data for us to conclude that the time and costs associ-ated with these other regimens wouldn’t simply be linear relativeto the QW regimen (i.e., 2, 3, or 5 times the time and costsassociated with the QW regimen). Fourth, where the injection-related activities were not observed, practice-reported data mayoverestimate the time (and therefore the costs) associated withsome injection-related activities.
While we note these limitations, we believe that the overallstudy results provide new and meaningful data to help CKDpractices inform the selection of ESP regimens to help improvepractice efficiency while ensuring high quality of care and theeffectiveness of the overall delivery of anemia management tonondialysis CKD patients.
■■ Conclusions This study provides an overview of the activities and staffresources required during routine QW and QM ESP injectionappointments. This study documents that CKD patients on ESPtherapy spend substantial amounts of their time in nephrologypractices, regardless of treatment regimen. The informationfrom this study may be used to identify clinic practices thatimprove efficiency in managing nondialysis CKD patients, mini-mizing both patient and clinic staff time while providing similar orimproved patient care.
Practices spent approximately two thirds less time permonth with patients on QM ESP therapy than with patients onQW therapy. Extended ESP dosing reduces the time burden ofCKD clinic staff and can provide opportunities to perform comprehensive patient care activities. Staff estimates of time differed significantly from observed time, underscoring theimportance and the benefit of directly measuring the impact ofthese common activities. Given the differences we observedbetween routine QW and QM ESP administration in busynephrology practices, nephrology clinics could realize potentialbenefits associated with more evidence-based resource planning.
ACKNOWLEDGMENTS
The authors thank the following Anemia Management Office ResourceEvaluation Study investigators and coordinators who assisted with data
collection for the current research: Felicia Chidolue, study coordinator,Southwest Houston Research, Houston, Texas; Karen Roberts, study coordinator, Associates in Nephrology, Evergreen Park, Illinois; MichaelGermain, MD, principal investigator, and Joele Thomas, study coordinator,Western New England Renal and Transplant Associates, Springfield,Massachusetts; Stephen Graham, MD, principal investigator, and EvonneDaza, study coordinator, Tower Nephrology, Los Angeles, California ; MarkGunning, MD, principal investigator, and Annette Borden, study coordinator,Western Washington Medical Group–Nephrology, Everett, Washington; SamiaKhwaja, MD, principal investigator, Renal Medical Associates, Lynwood,California; Dan Legault, MD, principal investigator, and Sue Saladin, studycoordinator, Renal Associates of Grand Rapids, PC, Grand Rapids, Michigan;Dellia Dion, study coordinator, Plaza Medical Group, Oklahoma City,Oklahoma; David Simon, MD, principal investigator, and Rosella McLean,study coordinator, Metabolism Associates, New Haven, Connecticut; MarkSmith, MD, principal investigator, and Lisa Futrelle, study coordinator,Nephrology Associates, PC, Augusta, Georgia; Jacquelynn Swan, MD, principalinvestigator, and Bianca Blanco, study coordinator, Nephrology Associates,Palm Beach Gardens, Florida; Paul Turer, MD, principal investigator, andSheila Young, study coordinator, Mid-Atlantic Nephrology Associates, PA,Baltimore, Maryland; Timothy Youell, MD, principal investigator, and MarilynSlater, study coordinator, Nephrology Associates of Central Florida, PA,Orlando, Florida.
DISCLOSURES
Funding for this research was provided by Amgen, Inc. Members of theresearch team included participants from the sponsor who also met the crite-ria to participate as coauthors. Members of the sponsor team disclose thatthey have been involved in all aspects of this project from study design tomanuscript preparation but have not unduly influenced the objectivity of thestudy analysis, data interpretation, or report of the results. Authors ReshmaKewalramani and Denise Globe are employees of Amgen, Inc., and ownAmgen stock and stock options. Authors Marializa Bernardo, Paul Crawford,Joachim Hertel, and Chris Sholer were investigators in the current study andreceived compensation from Amgen, Inc. for their work; authors Xiao Xu and Thomas Goss are employees of Covance Inc., the company that held thecontract for conducting the study funded by Amgen, Inc.
Bernardo served as principal author of the study. Study concept and designwere primarily contributed by Kewalramani and Globe, with input from thecoauthors. Data collection was the work of Bernardo, Crawford, Hertel, andSholer; data interpretation was primarily the work of Xu and Goss, with inputfrom the coauthors. Writing of the manuscript and its revision was the workof all authors, with primary input from Globe and Kewalramani.
REFERENCES
1. Snively CS, Gutierrez C. Chronic kidney disease: prevention and treatmentof common complications. Am Fam Physician. 2004;70(10):1921-28.
2. Centers for Disease Control and Prevention. State-specific trends in chronickidney failure—United States, 1990-2001. MMWR Morb Mortal Wkly Rep.2004;53(39):918-20.
3. U.S. Department of Health and Human Services, Office of DiseasePrevention and Health Promotion (ODPHP). Chronic kidney disease: a silent threat. Prevention Report 2004;18(4):1-6. Available at:http://odphp.osophs.dhhs.gov/pubs/prevrpt/04Volume18/Iss4Vol18.pdf.Accessed June 9, 2006.
What is already known about this subjectCurrently little is known about the quantity of medical clinic resources con-sumed by administering routine ESP injections to nondialysis anemic CKDpatients.
What this study adds This study assessed professional time and costs associated with routine ESPtherapy and provides an estimate of resource costs associated with ESP dosingfrequency.
www.amcp.org Vol. 12, No. 9 November/December 2006 JMCP Journal of Managed Care Pharmacy 723

724 Journal of Managed Care Pharmacy JMCP November/December 2006 Vol. 12, No. 9 www.amcp.org
4. Johnson CA, Levey AS, Coresh J, Levin A, Lau J, Eknoyan G. Clinical practiceguidelines for chronic kidney disease in adults: Part I. Definition, disease stages,evaluation, treatment, and risk factors. Am Fam Physician. 2004;70(5):869-76.
5. Keith DS, Nichols GA, Gullion CM, Brown JB, Smith DH. Longitudinal follow-up and outcomes among a population with chronic kidney disease in a large managed care organization. Arch Intern Med. 2004;164:659-63.
6. Coresh J, Wei GL, McQuillan G, et al. Prevalence of high blood pressureand elevated serum creatinine level in the United States: Findings from thethird National Health and Nutrition Examination Survey (1988-1994). Arc hIntern Med. 2001;161(9):1207-16.
7. Collins AJ, Li S, Gilbertson DT, Liu J, Chen SC, Herzog CA. Chronic kidneydisease and cardiovascular disease in the Medicare population. Kidney IntSuppl. 2003;87:S24–S31.
8. Levey AS, Coresh J, Balk E, et al. National Kidney Foundation practiceguidelines for chronic kidney disease: evaluation, classification, and stratification.Ann Intern Med. 2003;139(2):137-47.
9. National Kidney Foundation. K/DOQI clinical practice guidelines for chronickidney disease: evaluation, classification, and stratification. Am J Kidney Dis.2002;39(2 suppl 1):S1-S266.
10. K/DOQI; National Kidney Foundation. KDOQI clinical practice guidelinesand clinical practice recommendations for anemia in chronic kidney disease.Am J Kidney Dis. 2006;47(5 suppl 3):S11-S145.
11. McClellan W, Aronoff SL, Bolton WK, et al. The prevalence of anemia inpatients with chronic kidney disease. Curr Med Res Opin. 2004;20(9):1501-10.
12. McClellan W, Tran LL, the PAERI Study Group. The prevalence of anemiain patients with chronic kidney disease: final results from the PAERI study. J Am Soc Nephrol. 2002;13:461A.
13. Perlman R, Finkelstein F, Liu L, et al. Quality of life in chronic kidney disease (CKD): a cross-sectional analysis in the renal research institute-CKDstudy. Am J Kidney Dis. 2005;45:658-66.
14. Harnett JD, Kent GM, Foley RN, et al. Cardiac function and hematocritlevel. Am J Kidney Dis. 1995;25(suppl 1):S3-S7.
15. Foley RN, Parfrey PS, Harnett JD, et al. The impact of anemia on cardiomyopathy, morbidity, and mortality in end-stage renal disease. Am J Kidney Dis. 1996;28:53-61.
16. Collins AJ, Li S, Ebben J, et al. Hematocrit levels and associated Medicareexpenditures. Am J Kidney Dis. 2000;36:282-93.
17. Astor BC, Coresh J, Heiss G, Pettitt D, Sarnak MJ. Kidney function and anemia as risk factors for coronary heart disease and mortality: theAtherosclerosis Risk in Communities (ARIC) Study. Am Heart J. 2006;151(2):492-500.
18. Kovesdy CP, Trivedi BK, Kalantar-Zadeh K, et al. Association of anemiawith outcomes in men with moderate and severe chronic kidney disease.Kidney Int. 2006;69:560-64.
19. Revicki D, Brown R, Feeny D, et al. Health-related quality of life associatedwith recombinant human erythropoietin therapy for predialysis chronic renaldisease patients. Am J Kidney Dis. 1995;25:548-54.
20. Locatelli F, Pisoni RL, Combe C, et al. Anaemia in haemodialysis patientsof five European countries: association with morbidity and mortality in theDialysis Outcomes and Practice Patterns Study (DOPPS). Nephrol DialTransplant. 2004;19(1):121-32.
21. Gilbertson D, Guo H, Liu J, et al. The effect of hemoglobin levels below11 g/dL on future hospitalizations and mortality among incident hemodialysispatients. Poster presented at: 2006 Spring Clinical Meetings of the NationalKidney Foundation; April 19-23, 2006; Chicago IL.
22. Pisoni RL, Bragg-Gresham JL, Young EW, et al. Anemia management andoutcomes from 12 countries in the Dialysis Outcomes and Practice PatternsStudy (DOPPS). Am J Kidney Dis. 2004;44(1):94-111.
23. U.S. Renal Data System. USRDS 2005 Annual Data Report: Atlas of End-Stage Renal Disease in the United States. Bethesda, MD: U.S. Renal DataSystem, National Institutes of Health, National Institute of Diabetes andDigestive and Kidney Diseases; 2005:88-89.
24. U.S. Food and Drug Administration. Summary basis of approval: druglicense name: epoetin alfa; brand name: EPOGEN. June 1, 1989.
25. U.S. Food and Drug Administration. List of orphan products designationsand approvals (through December 31, 1999). Available at: http://www.fda.gov/ohrms/dockets/dailys/00/mar00/030100/lst0094.pdf. Accessed November 10, 2006.
26. Rettig RA, Levinsky NG, eds. Committee for the Study of the MedicareEnd-Stage Renal Disease Program, Division of Health Care Services, Instituteof Medicine. Kidney Failure and the Federal Government. Washington DC:National Academy Press, 1991. Available at: http://fermat.nap.edu/books/0309044324/html. Accessed November 10, 2006.
27. The Biopharmaceuticals. FDA-approved biopharmaceutical drugs and vaccines [online]. Available at: http://www.accessexcellence.org/RC/AB/BA/The_Biopharmaceuticals.html. Accessed November 10, 2006.
28. Columbia, co-transformation, commercialization & controversy: the Axelpatent litigation. Harvard J Law Technol [online]. 2004;17(2):538-618.Available at: http://jolt.law.harvard.edu/articles/pdf/v17/17HarvJLTech583.pdf.Accessed November 10, 2006.
29. U.S. Food and Drug Administration. FDA approved drug products[online]. Available at: http://www.accessdata.fda.gov/scripts/cder/drugsatfda/.Accessed November 10, 2006.
30. Ling B, Walczyk M, Agarwal A, Carroll W, Liu W, Brenner R. Darbepoetinalfa administered once monthly maintains hemoglobin concentrations inpatients with chronic kidney disease. Clin Nephrol. 2005;63(5):327-34.
31. Disney A, de Jersey P, Kirkland G, et al. Darbepoetin alfa administeredmonthly maintains haemoglobin concentrations in patients with chronic kid-ney disease not receiving dialysis: a multicentre, open-label, Australian study.Nephrology. 2006;260(6):577-85.
32. Agarwal AK, Silver MR, Reed JE, et al. An open-label study of darbepoetinalfa administered once monthly for the maintenance of haemoglobin concen-trations in patients with chronic kidney disease not receiving dialysis. J InternMed. In press.
33. Provenzano R, Bhaduri S, Singh AK; PROMPT Study Group. Extendedepoetin alfa dosing as maintenance treatment for the anemia of chronic kidneydisease: the PROMPT study. Clin Nephrol. 2005;64(2):113-23.
34. Piccoli A, Malagoli A, Komninos G, et al. Subcutaneous epoetin-alphaevery one, two, and three weeks in renal anemia. J Nephrol. 2002;15:565-74.
35. Suranyi MG, Lindberg JS, Navarro J, et al. Treatment of anemia with darb-epoetin alfa administered de novo once every other week in chronic kidneydisease. Am J Nephrol. 2003;23:106-11.
36. Toto RD, Pichette V, Navarro J, et al. Darbepoetin alfa effectively treatsanemia in patients with chronic kidney disease with de novo every-other-weekadministration. Am J Nephrol. 2004;24:453-60.
37. Crémieux PY, Fastenau JM, Kosicki G, Piech CT, Fendrick AM. Cost-mini-mization analysis of once-weekly versus thrice-weekly epoetin alfa forchemotherapy-related anemia. J Manag Care Pharm. 2004;10(6):531-37.Available at: http://www.amcp.org/data/jmcp/Formulary%20Management-531-537.pdf. Accessed October 30, 2006.
38. London R, Solis A, Goldberg GA, Wade S, Ryu S. Health care resource utilization and the impact of anemia management in patients with chronickidney disease. Am J Kidney Dis. 2002;40:539-48.
39. Foster SE, Vaughan RD, Foster WH, Califano JA Jr. Alcohol consumptionand expenditures for underage drinking and adult excessive drinking. JAMA.2003;289:989-95.
40. Landis JR, Koch GG. The measurement of observer agreement for categoricaldata. Biometrics. 1977;33:159-74.
41. Shrout PE, Fleiss JL. Intraclass correlations: uses in assessing rater reliability.Psychological Bulletin. 1979;86:420-28.
42. Beveridge RA, Rifkin RM, Moleski RJ, et al. Impact of long-acting growthfactors on practice dynamics and patient satisfaction. Pharmacotherapy.2003;23(12 pt 2):101S-109S.
Assessment of Time and Practice Resources Required to Provide Weekly or Monthly Erythropoiesis-Stimulating Protein Therapy to Chronic Kidney Disease Patients in the Physician Office Setting
43. Meehan KR, Tchekmedyian NS, Smith RE, Kallich J. Resource utilizationand time commitment associated with correction of anaemia in cancerpatients using epoetin alfa. Clin Drug Invest. 2006;26(10):593-601.
44. Crawford PW. Lessons learned in an urban CKD clinic. Nephrol NewsIssues. January 2005;43-48.
45. Calvin D, Roberts K. The role of the nurse practitioner in a CKD clinic.Nephrol News Issues. June 2005;26-29.
46. Gilchrist V, McCord G, Schrop SL, et al. Physician activities during timeout of the examination room. Ann Fam Med. 2005;3(6):494-99.
47. Kalton, G. Introduction to Survey Sampling. Beverly Hills: SagePublications; 1983.
Assessment of Time and Practice Resources Required to Provide Weekly or Monthly Erythropoiesis-Stimulating Protein Therapy to Chronic Kidney Disease Patients in the Physician Office Setting
www.amcp.org Vol. 12, No. 9 November/December 2006 JMCP Journal of Managed Care Pharmacy 725