assessment of the sri gasification process for syngas ... documents/year 2012/assessment of...
TRANSCRIPT

INL/EXT-12-25578
Assessment of the SRI Gasification Process for Syngas Generation with HTGR Integration – White Paper
Anastasia M. Gandrik
April 2012

DISCLAIMER This information was prepared as an account of work sponsored by an
agency of the U.S. Government. Neither the U.S. Government nor any agency thereof, nor any of their employees, makes any warranty, expressed or implied, or assumes any legal liability or responsibility for the accuracy, completeness, or usefulness, of any information, apparatus, product, or process disclosed, or represents that its use would not infringe privately owned rights. References herein to any specific commercial product, process, or service by trade name, trade mark, manufacturer, or otherwise, does not necessarily constitute or imply its endorsement, recommendation, or favoring by the U.S. Government or any agency thereof. The views and opinions of authors expressed herein do not necessarily state or reflect those of the U.S. Government or any agency thereof.

INL/EXT-12-25578
Assessment of the SRI Gasification Process for Syngas Generation with HTGR Integration – White
Paper
Anastasia. M. Gandrik
April 2012
Idaho National Laboratory VHTR Program
Idaho Falls, Idaho 83415
http://www.inl.gov
Prepared for the U.S. Department of Energy Office of Nuclear Energy
Under DOE Idaho Operations Office Contract DE-AC07-05ID14517


v
ABSTRACT
This white paper is intended to compare the technical and economic feasibility of syngas generation using the SRI gasification process coupled to several high-temperature gas-cooled reactors (HTGRs) with more traditional HTGR-integrated syngas generation techniques, including:
• Gasification with high-temperature steam electrolysis (HTSE)
• Steam methane reforming (SMR)
• Gasification with SMR with and without CO2 sequestration

vi

vii
CONTENTS
ABSTRACT .................................................................................................................................................. v
ACRONYMS ............................................................................................................................................... ix
INTRODUCTION ........................................................................................................................................ 1
SRI PROCESS OVERVIEW AND MODELING APPROACH .................................................................. 1
SYNGAS GENERATION TECHNICAL COMPARISON ......................................................................... 3
SYNGAS GENERATION ECONOMIC COMPARISON .......................................................................... 6
REFERENCES ............................................................................................................................................. 9
FIGURES Figure 1. Syngas generation comparison modeling case material balance summary. .................................. 4
Figure 2. Carbon tax results, baseline cases. ................................................................................................. 8
Figure 3. Carbon tax results, HTGR-integrated cases. .................................................................................. 9
TABLES Table 1. SRI case comparison. ..................................................................................................................... 3
Table 2. Syngas generation comparison modeling case study results.......................................................... 5
Table 3. Economic assumptions. ................................................................................................................... 6
Table 4. Syngas generation economic results. .............................................................................................. 7

viii
ix
ACRONYMS
HHV Higher heating value
HTGR High-temperature gas-cooled reactor
HTSE High-temperature steam electrolysis
MTG Methanol to gasoline
PRB Powder River Basin
IPCC International Pittsburgh Coal Conference
IRR Internal rate of return
SMR Steam methane reforming
TCI Total capital investment

x

1
Assessment of the SRI Gasification Process for Syngas Generation with HTGR Integration – White
Paper
INTRODUCTION
This white paper is intended to compare the technical and economic feasibility of syngas generation using the SRI gasification process coupled to several high-temperature gas-cooled reactors (HTGRs) with more traditional HTGR-integrated syngas generation techniques, including:
• Gasification with high-temperature steam electrolysis (HTSE)
• Steam methane reforming (SMR)
• Gasification with SMR with and without CO2 sequestration
SRI PROCESS OVERVIEW AND MODELING APPROACH
The SRI process combines coal gasification and SMR in a single high pressure reactor, which is operated at 1,015 psi. In traditional gasification, coal is combusted with oxygen to provide heat for coal devolatilization and char gasification. SRI has developed a novel concept where this heat is provided by electric heaters coupled with reforming for hydrogen production, thereby reducing/eliminating the CO2 produced in the gasifier. Literature information does not provide specific detail on the conversion of electricity to heat for the gasifier, for this study a baseline efficiency of 85% was assumed.
The SRI gasifier was modeled similarly to the Shell gasifier described in TEV-672. However, rather than supplying oxygen to meet a specific reactor outlet temperature, the amount of electric heat input to the system was varied to achieve a syngas outlet temperature of 2,732°F. Steam was fed at 15% excess1. 7% of the natural gas and 2% of the coal feed remains unconverted. Finally, the natural gas feed was varied to achieve the syngas H2, CO, CO2 ratio for methanol production: −+ = 2.10
Heat is recovered from the syngas to preheat the natural gas and steam feeds to 1,112°F. The syngas remains well above the temperature where whisker carbon is formed from the Boudouard reaction; however, given the high temperature and pressure this heat exchanger would likely be made of specialty materials. Sulfur is removed from the syngas using the Rectisol process; however, the Selexol process could also be used. Sulfur removal differs from that described in TEV-672 as a pure CO2 stream is not produced due to the fact that all CO2 produced in the gasifier is required for methanol production.
For verification of the process information presented by SRI at the International Pittsburgh Coal Conference (IPCC) the SRI gasifier was inserted into the methanol to gasoline (MTG) coal model developed by the INL as documented in TEV-667, in order to accurately capture the recycle gas composition and flowrate which is fed to the SRI gasifier. This recycle flow will have a large impact on how much natural gas is required by the process. It was assumed that the amount of light gas generated for methanol to jet fuel should be fairly similar to the amount generated in the MTG process. Both processes use methanol as an intermediate; hence the H2/CO ratios required are consistent.
1 15 mol-% excess assuming that all steam reacts with the carbon fed to the reactor.
2
It was determined, based on the higher heating value (HHV), that the SRI presentation assumed the same Powder River Basin (PRB) coal type with 28.09% moisture that INL has used in previous Aspen Plus models. Also, based on the HHV presented the natural gas feed is assumed by SRI to be pure methane. The presentation was not specific on how much the PRB coal was dried prior to gasification; hence several dryness levels were assessed. The model looked at no drying, drying to 12% (the most likely scenario for a PRB coal), drying to 6%, and drying to 0% moisture. Based on information from Shell, drying a high moisture content coal like PRB to less than 12% may not be technically feasible as a portion of the moisture is actually locked into the coal and hence is not released until devolatilization.
The moisture content of the coal after drying and gas preheat levels had no impact on the required natural gas feed, only the amount of electrical heat required for the gasifier. The model predicted a natural gas feed rate of within 2% of the value listed in the presentation, which is extremely close given the limited information available to model the process. However, the model was farther off when comparing the electrical heat requirement.
Assuming less than 1% heat loss in the gasifier and 85% efficiency for heat from electricity requires an electrical input of 4,379 MWe, which is 34% higher than the 3,274 MW listed in the presentation, for coal dried to 12% moisture and preheated to 220°F, which is considered the most reasonable scenario. Looking at various coal preheat and coal drying levels only decreases the electrical input to 4,284 MWe, for the assumed heat loss and heat generation efficiency. If no losses are assumed and 100% conversion efficiency from electricity to heat is assumed, the required electrical input decreases to 3,641 MWe for 12% moisture and 220°F coal preheat, which is still greater than the value listed in the presentation. Even assuming the coal can be dried to 0% moisture, the amount of electricity is almost 9% higher than the value listed in the presentation. For full results, see Table 1.

3
Table 1. SRI case comparison.
Baseline 1 2 32 4 5 6 7 Coal Feed Rate (ton/day) 1,352,000 1,352,000 1,352,000 1,352,000 1,352,000 1,352,000 1,352,000 1,352,000
Moisture Content After Drying (%) 28.09 28.09 12 12 6 6 0
Dry Coal Feed Rate (ton/day) 1,352,000 1,352,000 1,104,799 1,104,799 1,034,280 1,034,280 972,223
Coal Preheat Temperature (°F) 450 220 450 220 450 450
Methane Feed Rate (lb/hr) 690,739 701,491 701,491 701,491 701,491 701,491 701,491 701,491
%-Error from Baseline 1.6 1.6 1.6 1.6 1.6 1.6 1.6
Gasifier Heat Input (MWt) 3,823 3,774 3,722 3,687 3,694 3,662 3,647
Electricity Required – 85% Eff. (MWe) 3,274 4,498 4,439 4,379 4,337 4,345 4,308 4,284
%-Error from Baseline 37.4 35.6 33.8 32.5 32.7 31.6 30.8
Electricity Required – 100% Eff. w/ no Losses (MWe) 3,741 3,692 3,641 3,605 3,612 4,212 3,560
%-Error from Baseline 14.3 12.8 11.2 10.1 10.3 9.4 8.7
SYNGAS GENERATION TECHNICAL COMPARISON
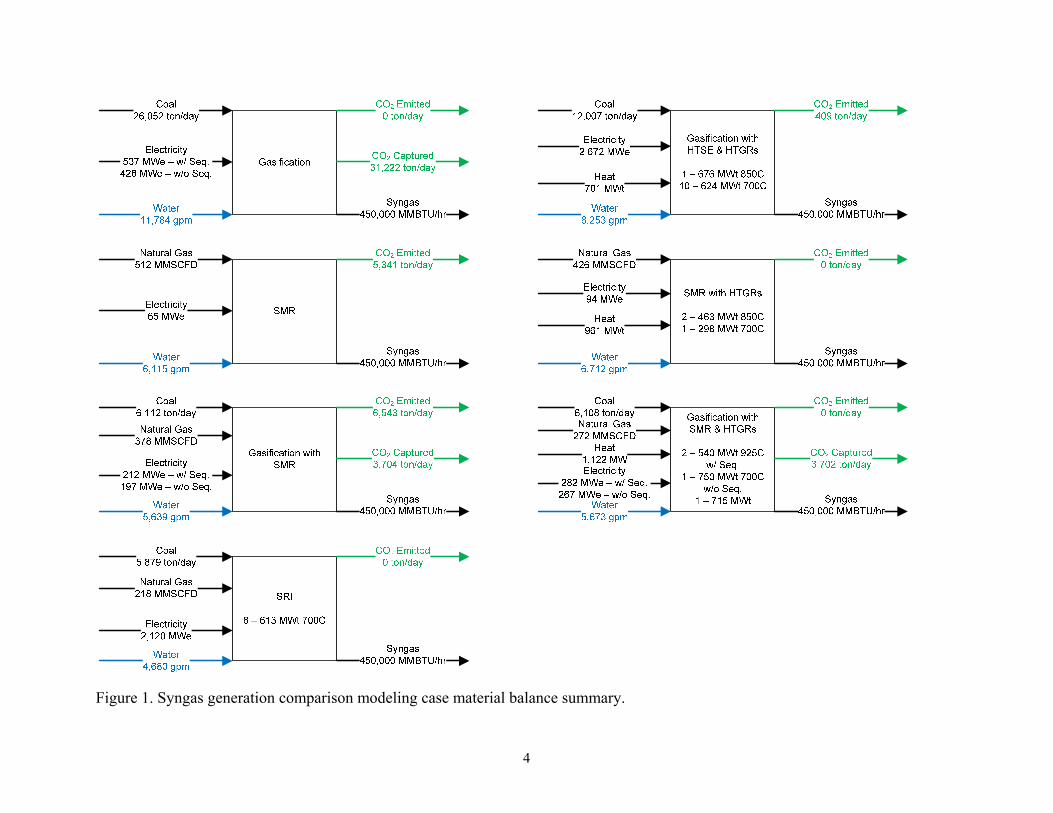
For all processes only syngas production and cleaning are modeled, this allows for a simple comparison of syngas generation without complicating the models with light gas recycles, which will be present to a varying degree for all syngas production techniques. All models include a syngas compressor which pressurizes the syngas to 1,090 psi in preparation for methanol production.
All processes were modeled to produce approximately 450,000 MMBTU/hr of syngas for methanol production. The following figure and table summarize the material and energy balances for the syngas generation techniques analyzed. The results presented in the table assume CO2 sequestration where applicable.
All processes are technically feasible for syngas generation. However, integration of HTSE with gasification and the SRI gasifier requires an extremely large amount of electrical input to the system, which has a large impact on the process economics.
2 Most likely scenario.
4
Figure 1. Syngas generation comparison modeling case material balance summary.

5
Table 2. Syngas generation comparison modeling case study results.
Gasification Gasification w/ HTSE &
HTGRs SMR SMR w/
HTGRs Gasification
w/ SMR
Gasification w/ SMR and
HTGRs
SRI w/ HTGRs
Inputs
Coal Feed rate (ton/day) 26,052 12,007 N/A N/A 6,112 6,108 5,879
Natural Gas Feed Rate (MMSCFD)3 N/A N/A 512 426 378 272 218
% Carbon to Liquid Product 45.0 97.7 83.0 100.0 70.9 86.1 98.9
HTGR Thermal Input (MWt) N/A 6,916 N/A 1,224 N/A 1,830 4,904
Outputs
Syngas Produced (MMBTU/hr) 450,000 450,000 450,000 450,000 450,000 450,000 450,000
Utility Summary
Power Consumed (MWe) -537 -2,672 -65 -94 -212 -282 -2,120
Water Consumed (gpm)4 11,784 8,253 6,115 6,712 5,639 5,673 4,680
CO2 Summary
Total CO2 Produced (ton/day) 31,222 409 5,341 0 10,247 0 Emitted 0 409 5,341 0 6,543 0 0
Capturable 31,222 0 0 0 3,704 3,702 0
Nuclear Integration Summary
Electricity to Process (MWe) N/A 2,672 N/A 94 N/A 282 2,120
HTGR Heat to Process (MWt) N/A 701 N/A 961 N/A 1,122 N/A
3 Standard temperature of 60°F. 4 Does not include water usage for HTGR
6
SYNGAS GENERATION ECONOMIC COMPARISON
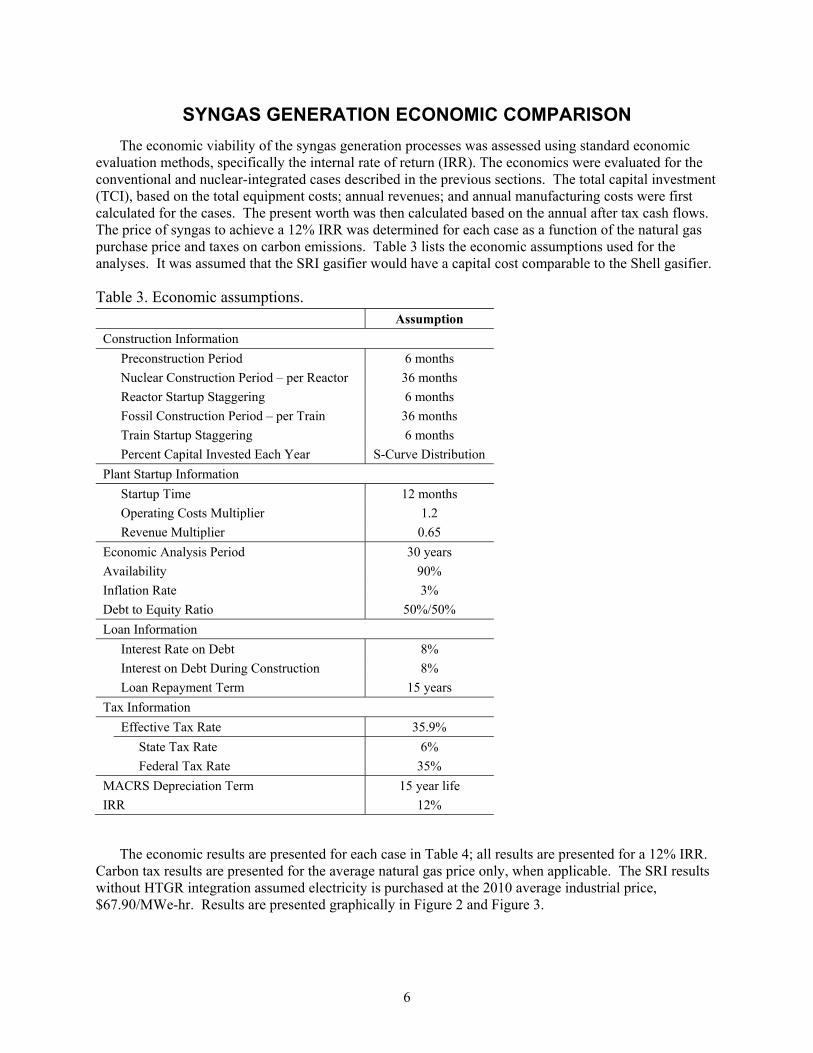
The economic viability of the syngas generation processes was assessed using standard economic evaluation methods, specifically the internal rate of return (IRR). The economics were evaluated for the conventional and nuclear-integrated cases described in the previous sections. The total capital investment (TCI), based on the total equipment costs; annual revenues; and annual manufacturing costs were first calculated for the cases. The present worth was then calculated based on the annual after tax cash flows. The price of syngas to achieve a 12% IRR was determined for each case as a function of the natural gas purchase price and taxes on carbon emissions. Table 3 lists the economic assumptions used for the analyses. It was assumed that the SRI gasifier would have a capital cost comparable to the Shell gasifier.
Table 3. Economic assumptions. Assumption Construction Information
Preconstruction Period 6 months
Nuclear Construction Period – per Reactor 36 months
Reactor Startup Staggering 6 months
Fossil Construction Period – per Train 36 months
Train Startup Staggering 6 months
Percent Capital Invested Each Year S-Curve Distribution
Plant Startup Information
Startup Time 12 months
Operating Costs Multiplier 1.2
Revenue Multiplier 0.65
Economic Analysis Period 30 years
Availability 90%
Inflation Rate 3%
Debt to Equity Ratio 50%/50%
Loan Information
Interest Rate on Debt 8%
Interest on Debt During Construction 8%
Loan Repayment Term 15 years
Tax Information
Effective Tax Rate 35.9%
State Tax Rate 6%
Federal Tax Rate 35%
MACRS Depreciation Term 15 year life
IRR 12%
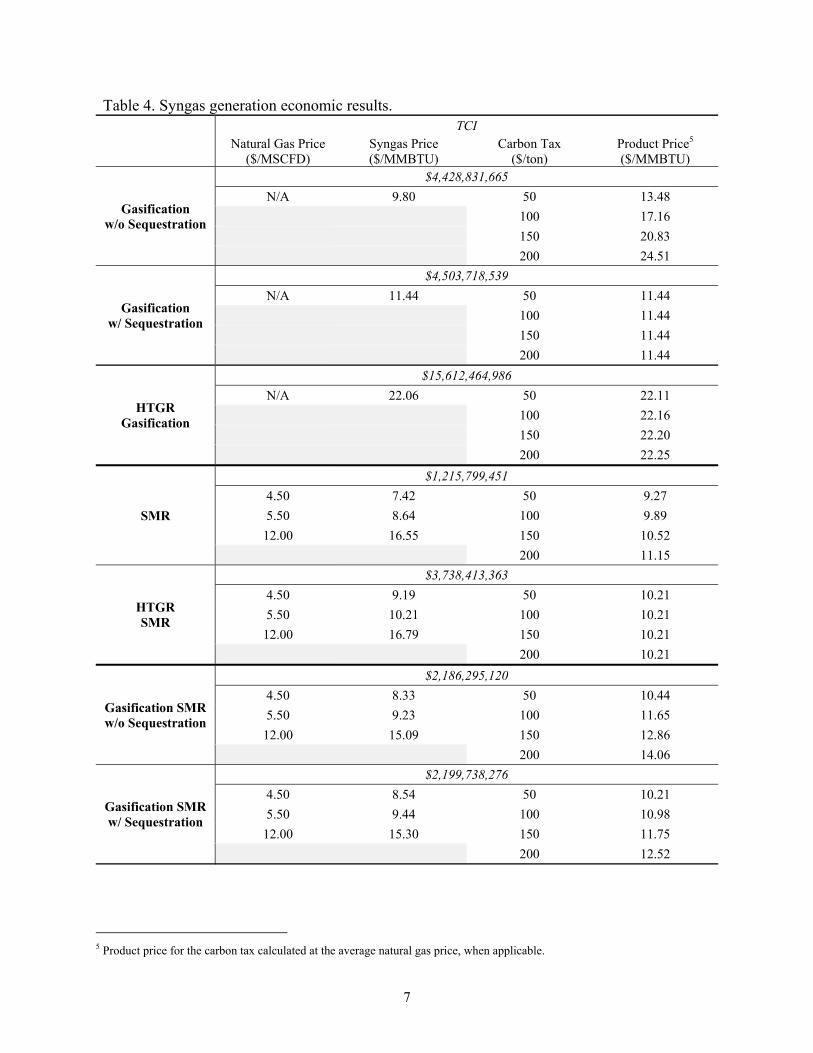
The economic results are presented for each case in Table 4; all results are presented for a 12% IRR. Carbon tax results are presented for the average natural gas price only, when applicable. The SRI results without HTGR integration assumed electricity is purchased at the 2010 average industrial price, $67.90/MWe-hr. Results are presented graphically in Figure 2 and Figure 3.
7
Table 4. Syngas generation economic results.
TCI Natural Gas Price
($/MSCFD) Syngas Price ($/MMBTU)
Carbon Tax ($/ton)
Product Price5 ($/MMBTU)
Gasification w/o Sequestration
$4,428,831,665 N/A 9.80 50 13.48
100 17.16
150 20.83
200 24.51
Gasification w/ Sequestration
$4,503,718,539 N/A 11.44 50 11.44
100 11.44
150 11.44
200 11.44
HTGR Gasification
$15,612,464,986 N/A 22.06 50 22.11
100 22.16
150 22.20
200 22.25
SMR
$1,215,799,451 4.50 7.42 50 9.27
5.50 8.64 100 9.89
12.00 16.55 150 10.52
200 11.15
HTGR SMR
$3,738,413,363 4.50 9.19 50 10.21
5.50 10.21 100 10.21
12.00 16.79 150 10.21
200 10.21
Gasification SMR w/o Sequestration
$2,186,295,120 4.50 8.33 50 10.44
5.50 9.23 100 11.65
12.00 15.09 150 12.86
200 14.06
Gasification SMR w/ Sequestration
$2,199,738,276 4.50 8.54 50 10.21
5.50 9.44 100 10.98
12.00 15.30 150 11.75
200 12.52
5 Product price for the carbon tax calculated at the average natural gas price, when applicable.

8
Table 4. Syngas generation economic results.
HTGR Gasification SMR w/o
Sequestration
$5,816,734,002 4.50 10.59 50 11.67
5.50 11.24 100 12.11
12.00 15.45 150 12.54
200 12.98
HTGR Gasification SMR
w/ Sequestration
$5,879,403,543 4.50 10.80 50 11.45
5.50 11.45 100 11.45
12.00 15.66 150 11.45
200 11.45
SRI
$1,711,918,230 4.50 13.30 50 13.82
5.50 13.82 100 13.82
12.00 17.18 150 13.82
200 13.82
HTGR SRI
$10,078,695,338 4.50 15.99 50 16.51
5.50 16.51 100 16.51
12.00 19.87 150 16.51
200 16.51
Figure 2. Carbon tax results, baseline cases.
7
9
11
13
15
17
19
21
23
25
0 50 100 150 200
Syng
as P
rice
($/M
MB
TU
)
CO2 Tax ($/ton)
Gasification w/o Seq. Gasifcation w/ Seq.
SMR Gasification SMR w/o Seq
Gasification SMR w/ Seq SRI
9
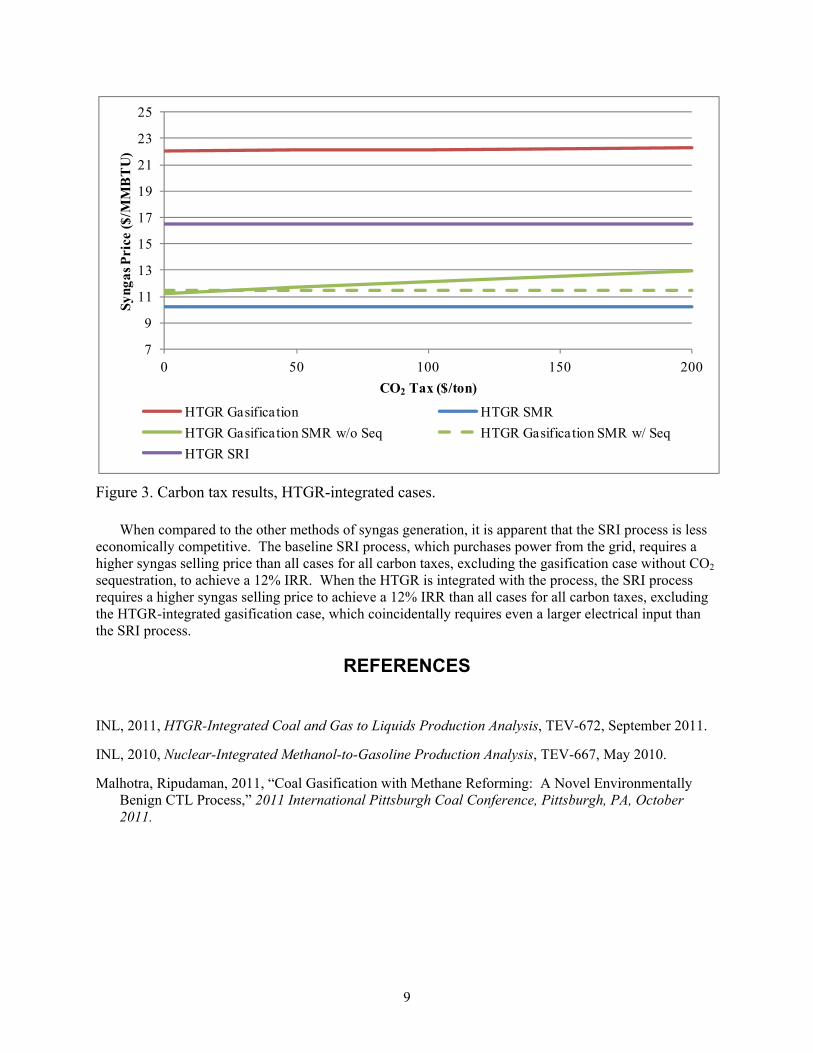
Figure 3. Carbon tax results, HTGR-integrated cases.
When compared to the other methods of syngas generation, it is apparent that the SRI process is less economically competitive. The baseline SRI process, which purchases power from the grid, requires a higher syngas selling price than all cases for all carbon taxes, excluding the gasification case without CO2 sequestration, to achieve a 12% IRR. When the HTGR is integrated with the process, the SRI process requires a higher syngas selling price to achieve a 12% IRR than all cases for all carbon taxes, excluding the HTGR-integrated gasification case, which coincidentally requires even a larger electrical input than the SRI process.
REFERENCES
INL, 2011, HTGR-Integrated Coal and Gas to Liquids Production Analysis, TEV-672, September 2011.
INL, 2010, Nuclear-Integrated Methanol-to-Gasoline Production Analysis, TEV-667, May 2010.
Malhotra, Ripudaman, 2011, “Coal Gasification with Methane Reforming: A Novel Environmentally Benign CTL Process,” 2011 International Pittsburgh Coal Conference, Pittsburgh, PA, October 2011.
7
9
11
13
15
17
19
21
23
25
0 50 100 150 200
Syng
as P
rice
($/M
MB
TU
)
CO2 Tax ($/ton)
HTGR Gasification HTGR SMR
HTGR Gasification SMR w/o Seq HTGR Gasification SMR w/ Seq
HTGR SRI