assessment of the i-5 portland cement concrete pavements ... · assessment of the i-5. portland...
TRANSCRIPT

December 2007Michael A. Hansen Joe P. MahoneyNewton C. JacksonCarol HunterLinda M. Pierce George Turkiyyah
WA-RD 682.1
Office of Research & Library Services
WSDOT Research Report
Assessment of the I-5 Portland Cement Concrete Pavements in King County

RESEARCH REPORT Agreement T4118, Task 02
Pavement Deterioration
ASSESSMENT OF THE I-5 PORTLAND CEMENT CONCRETE PAVEMENTS
IN KING COUNTY
Michael A. Hansen Joe P. Mahoney
Newton C. Jackson Carol Hunter
Linda M. Pierce George Turkiyyah
Washington State Transportation Center (TRAC) University of Washington, Box 354802
1107NE 45th Street, Suite 535 Seattle, Washington 98105-4631
Prepared for Washington State Transportation Commission
Department of Transportation and in cooperation with
U.S. Department of Transportation Federal Highway Administration
December 2007

TECHNICAL REPORT STANDARD TITLE PAGE
1. REPORT NO.
WA-RD 682.1 2. GOVERNMENT ACCESSION NO. 3. RECIPIENT’S CATALOG NO.
5. REPORT DATE
December 2007 4. TITLE AND SUBTITLE
ASSESSMENT OF THE I-5 PORTLAND CEMENT CONCRETE PAVEMENTS IN KING COUNTY
6. PERFORMING ORGANIZATION CODE
7. AUTHORS
Michael A. Hansen, Joe P. Mahoney, Newton C. Jackson, Carol Hunter, Linda M. Pierce, and George Turkiyyah
8. PERFORMING ORGANIZATION CODE
10. WORK UNIT NO. 9. PERFORMING ORGANIZATION NAME AND ADDRESS
Washington State Transportation Center University of Washington, Box 354802 University District Building, 1107 NE 45th Street, Suite 535 Seattle, Washington (98105-7370)
11. CONTRACT OR GRANT NUMBER
T4118, Task 02
13. TYPE OF REPORT AND PERIOD COVERED
Research Report 12. SPONSORING AGENCY NAME AND ADDRESS
Research Office Washington State Department of Transportation Transportation Building, MS 47372 Olympia, Washington 98504-7372 Project Manager: Kim Willoughby, 360-705-7978
14. SPONSORING AGENCY CODE
15. SUPPLIMENTARY NOTES
16. ABSTRACT
The Interstate 5 portland cement concrete pavement (PCCP) in King County has been in service for over 40 years, twice its planned design life. As such, I-5 is in need of a rehabilitation/reconstruction effort. This study provides WSDOT information that will aid decision making about the timing, locations, and type of rehabilitation or reconstruction. Extensive pavement conditions/distress data provided by WSDOT were summarized, analyzed, and used to develop visual tools to communicate the condition of the I-5 PCCP. The performances of the non-rehabilitated, diamond ground, and the dowel bar retrofit and diamond ground PCCP were summarized and compared. Use of such information shows that about 66 percent of I-5 in King County is in need of rehabilitation or reconstruction. To further illustrate these conditions, Arc GIS was used to map the various distresses/conditions, and the results suggest which sections of I-5 should be addressed early in the rehabilitation/reconstruction process. A field study assessing the I-5 PCCP was conducted at the same location as a 1986 study, providing a unique opportunity to compare the PCCP conditions over a span of 20 years. The field study showed that the number of cracks had more than doubled, spalling dimensions had increased, and faulting displacements had increased by more than 43 percent. The report concludes with a broad assessment of expected I-5 conditions and necessary WSDOT actions for five-year increments (0 to 5 years, 5 to 10 years and greater than 10 years).
17. KEY WORDS
Portland cement concrete, pavement performance, wear, IRI, cracking, faulting
18. DISTRIBUTION STATEMENT
19. SECURITY CLASSIF. (of this report) 20. SECURITY CLASSIF. (of this page) 21. NO. OF PAGES
22. PRICE

iii
DISCLAIMER
The contents of this report reflect the views of the authors, who are responsible
for the facts and the accuracy of the data presented herein. The contents do not
necessarily reflect the official views or policies of the Washington State Transportation
Commission, Washington State Department of Transportation, or Federal Highway
Administration. This report does not constitute a standard, specification, or regulation.

iv

TABLE OF CONTENTS
EXECUTIVE SUMMARY ........................................................................................ x
CHAPTER 1 INTRODUCTION .............................................................................. 1 1.1 The Problem...................................................................................................... 1 1.2 The Study.......................................................................................................... 1 1.3 Objectives ......................................................................................................... 2 1.4 Organization...................................................................................................... 2
CHAPTER 2 I-5 PCCP DATA................................................................................ 3 2.1 I-5 PCCP Distress Data .................................................................................... 3 2.1.1 2004 I-5 PCCP Distress Data............................................................. 4 2.1.2 2006 I-5 PCCP Distress Data............................................................. 5 2.2 I-5 Video Imagery.............................................................................................. 5 2.3 Accident Data.................................................................................................... 5 2.4 Field Study Data................................................................................................ 6 2.4.1 Field Study Site Selection Criteria...................................................... 6 2.4.2 Selected Field Study Site—Northbound I-5 at MP 176.35 ................. 6 2.4.4 1986 I-5 Field Study Data collection—MP 176.35.............................. 7 2.4.5 2007 I-5 Field Study Data collection................................................... 8
CHAPTER 3 I-5 PCCP DISTRESS DATA ANALYSIS.......................................... 10 3.1 2004 I-5 PCCP Distress Data Summary ........................................................... 10 3.1.1 Non-Rehabilitated 2004 PCCP Distress............................................. 10 3.1.2 Diamond Ground 2004 PCCP Distress .............................................. 13 3.1.3 Dowel Bar Retrofit and Diamond Ground 2004 PCCP Distress......... 14 3.1.4 Type and Year of Construction—2004 PCCP Distress Summary...... 15 3.2 2004 I-5 PCCP Distress Data Failure Analyses................................................ 17 3.2.1 IRI Trigger Values and Analysis ......................................................... 17 3.2.2 Average Faulting Trigger Values Analysis ......................................... 19 3.2.3 Wheel Path Wear Trigger Value and Analysis ................................... 19 3.2.4 Panel Cracking Trigger Value and Analysis ....................................... 19 3.2.5 Summary of 2004 I-5 PCCP Distress Data Failure Analysis.............. 20 3.3 2006 I-5 PCCP Distress Summary.................................................................... 21 3.4 Pavement Distress Plots for 2004 I-5 PCCP Distress Data .............................. 22 3.4.1 Distress Plots for IRI, Wheel Path Wear, Average Faulting, and
Percentage of Cracked Panels........................................................... 22 3.4.2 Distress Plots for Cracked Panels...................................................... 27 3.4.3 Distress Plots for Percentage of Panels with Two or More Cracks .... 27 3.4.4 Distress Plots for Percentage of Cracked Panels and Average Faulting 27 3.5 Arc GIS Mapping of I-5 PCCP Distresses......................................................... 31 3.5.1 Sectioning of I-5 in King County for the Arc GIS Images ................... 31 3.5.2 Arc GIS Pavement Distress Images................................................... 32 3.5.3 General Pavement Condition ............................................................. 37 3.6 Arc GIS Mapping of Rehabilitation and Reconstruction Options....................... 40
v

3.6.1 Arc GIS Images Based on WSDOT’s Trigger Values for Pavement Distress-Based Rehabilitation ............................................................ 40
3.6.2 Pavement Distress-Based Rehabilitation Arc GIS Images Based on Modified Triggers for the I-5 Triage Project........................................ 44
3.7 Arc GIS Images for Wet Surface Condition Accidents ...................................... 44 3.8 Accident Data Analyses .................................................................................... 47 3.8.1 Summary of Accident Data Analysis .................................................. 47 3.8.2 Wet Surface Accidents and Diamond Ground PCCP......................... 50 3.9 I-5 Field Study Analysis..................................................................................... 53 3.9.1 Field Study Cracking Survey .............................................................. 54 3.9.2 Field Study Spalling Survey ............................................................... 55 3.9.3 Field Study Faulting Survey ............................................................... 56 3.9.4 Field Study Coring.............................................................................. 57 3.9.5 Nondestructive Deflection Testing...................................................... 58
CHAPTER 4 PORTLAND CEMENT CONCRETE REHABILITATION OPTIONS
FOR I-5............................................................................................ 61 4.1 Diamond Grinding ............................................................................................. 61 4.1.1 The Process of Diamond Grinding ..................................................... 61 4.1.2 When Should a PCCP Be Diamond Ground? .................................... 61 4.1.3 Diamond Grinding Issues and Benefits Specific to I-5 ....................... 62 4.2 Dowel Bar Retrofitting ....................................................................................... 62 4.2.1 The Process of Dowel Bar Retrofitting ............................................... 62 4.2.2 When Should a PCCP Be Dowel Bar Retrofit? .................................. 64 4.2.3 Dowel Bar Retrofit Issues and Benefits Specific to I-5 ....................... 65 4.3 Reconstruction and Panel Replacement........................................................... 65 4.3.1 The Process of Panel Replacement................................................... 65 4.3.2 When Should a PCCP Have Panel Replacement or Be Replaced? .. 66 4.3.3 Reconstruction and Panel Replacement Issues and Benefits
Specific to I-5...................................................................................... 66 4.4 HMA Overlay Options ....................................................................................... 67
CHAPTER 5 CONCLUSIONS AND RECOMMENDATIONS ................................ 72
5.1 Conclusions........................................................................................... 72 5.2 Recommendations ................................................................................ 73 5.3 Concensus View.................................................................................... 73
REFERENCES........................................................................................................ 75
vi

LIST OF APPENDICES
Appendix A – Mile Post Breakdown Northbound and Southbound
Appendix B – I-5 Field Study
Appendix C – 2004 Non-Rehabilitated PCCP Summary Tables
Appendix D – 2004 DBR+DG PCCP Summary Tables
Appendix E – 2004 Diamond Ground PCCP Summary Tables
Appendix F – 2004 Type and Year of Construction PCCP Tables
Appendix G – Map of I-5 Through King County and Sections of Construction
Appendix H – IRI Pavement Distress Plots
Appendix I – Average Faulting Distress Plots
Appendix J – Wheel Path Wear Distress Plots
Appendix K – Number of Cracks per Section Distress Plots
Appendix L – Percentage of Cracked Panels Distress Plots
Appendix M – Percentage of Panels with Two or More Cracks Distress Plots
Appendix N – Percentage of Cracked Panels and Faulting Distress Plots
Appendix O – Arc GIS IRI Pavement Distress Images
Appendix P – Arc GIS Average Faulting Pavement Distress Images
Appendix Q – Arc GIS Percentage of Cracked Panels with Two or More Cracks
Distress Images
Appendix R – Arc GIS Wheel Path Wear Pavement Distress Images
Appendix S – Arc GIS General Conditions Images
Appendix T – Arc GIS WSDOT Trigger Rehabilitation Options Images
Appendix U – Arc GIS Triage Rehabilitation Option Images
Appendix V – Arc GIS Wet Condition Accident Images
Appendix W – Bridge Clearances: I-5 King County
vii

LIST OF FIGURES
Figure Page
3.1 I-5 King County PCCP in 2004................................................................. 11 3.2 Example Plot of IRI................................................................................... 23 3.3 Example Plot of Wheel Path Wear ........................................................... 24 3.4 Example Plot of Faulting .......................................................................... 25 3.5 Example Plot of Percentage of Cracked Panels ...................................... 26 3.6 Example Plot of Cracked Panels.............................................................. 28 3.7 Example Plot of Percentage of Panels with Two or More Cracks ........... 29 3.8 Example Plot of Percentage of Cracked Panels and Average Faulting ... 30 3.9 Example Image of IRI Values................................................................... 33 3.10 Example Image of Wheel Path Wear ....................................................... 34 3.11 Example Image of Average Faulting ........................................................ 35 3.12 Example Image of Percentage of Panels with Two or More Cracks ........ 36 3.13 Example Image of General Pavement Condition ..................................... 39 3.14 Example Image of Pavement Distress-Based Rehabilitation ................... 42 3.15 Example Image of Wet Surface Condition Accidents............................... 46 4.1 Dowel Bar Slots........................................................................................ 63 4.2 Placement of Dowel Bars ......................................................................... 63 4.3 Placing Grout in Dowel Bar Slots ............................................................. 64 4.4 Dowel Bar Retrofit PCCP After Diamond Grinding................................... 64
viii

LIST OF TABLES
2.1 I-5 Bridge Deck in King County by Centerline Miles and Percentage ...... 5 3.1 2004 Average Distresses of Non-Rehabilitated, Diamond Ground, and
Diamond Ground with Dowel Bar Retrofit PCCP...................................... 12 3.2 Summary of Construction Sections, 2004 Distress Performance ............ 16 3.3 Lanes Miles of I-5 in Excess of Trigger Values ........................................ 18 3.4 Percentage of I-5 in Excess of Trigger Values ......................................... 18 3.5 Trigger Value Sets and Lane Mile and Percentage of Roadway Exceed-
ing Them .................................................................................................. 21 3.6 Levels of Distress and Associated Color in the Arc GIS Distress Images 32 3.7 Equivalent Levels of Faulting and Cracking with Assigned Values, Colors,
and Pavement Condition .......................................................................... 37 3.8 WSDOT Rehabilitation Trigger Values..................................................... 41 3.9 Triage Project Quantitative Rehabilitation Trigger Value Analysis ........... 43 3.10 Modified Trigger Values for the I-5 Triage Project.................................... 44 3.11 WSDOT Quantitative Rehabilitation Modified Triage Trigger Value
Analysis .................................................................................................... 45 3.12 I-5 Wet Surface Accidents Lighting Conditions ........................................ 47 3.13 I-5 Wet Surface Accidents Vehicle Type .................................................. 48 3.14 Number of Vehicles per I-5 Wet Condition Accidents .............................. 48 3.15 Wet Condition Accidents, Days of Rain, and AAWDT.............................. 49 3.16 Wet Surface Accidents by Direction and Lane ......................................... 50 3.17 Percentage of AAWDT at Boeing Field .................................................... 50 3.18 Diamond Ground PCCP and Wet Surface Accidents (MP 144.45 to 146.18
and MP 147.47 to 149.18)........................................................................ 51 3.19 Diamond Ground PCCP and Reduction of Wet Surface Accidents (MP
158.47 to 161.50) ..................................................................................... 52 3.20 All Diamond Ground PCCP and Wet Surface Accidents.......................... 52 3.21 1986 and 2007 Cracking Survey Number of Cracked Slabs.................... 55 3.22 Spalling in 1986 and 2007........................................................................ 55 3.23 1986 and 2007 Average Faulting and Locations...................................... 56 3.24 1986 and 2007 PCC Cores Compressive Strengths................................ 57 3.25 1986 and 2007 Load Transfer Efficiencies in the Outer Lane, I-5, MP 175 59 4.1 Performance of HMA Overlays on I-5 over PCC...................................... 68 4.2 Performance of HMA Overlays on PCC for All WSDOT Interstates......... 69 4.3 Performance of First HMA Overlay Placed on PCC for All WSDOT
Interstates................................................................................................. 69 5.1 Interstate 5 Estimates for King County—A Consensus View ................... 74
ix

EXECUTIVE SUMMARY
The Interstate 5 portland cement concrete pavement (PCCP) in King
County has been in service for over 40 years, twice its planned design life. As
such, I-5 is in need of a rehabilitation/reconstruction effort. This study provides
WSDOT information that will aid in decision making about the timing, location,
and type of rehabilitation or reconstruction.
Extensive pavement conditions/distress data provided by WSDOT were
summarized, analyzed, and used to develop visual tools to communicate the
condition of the I-5 PCCP. The performances of non-rehabilitated, diamond
ground, and dowel bar retrofit and diamond ground PCCP were summarized and
compared. Use of such information shows that about 66 percent of I-5 in King
County is in need of rehabilitation or reconstruction. To further illustrate these
conditions, Arc GIS was used to map the various distresses/conditions, and the
results suggest which sections of I-5 should be addressed early in the
rehabilitation/reconstruction process.
A field study assessing the I-5 PCCP was conducted at the same location
as a 1986 study, providing a unique opportunity to compare the PCCP conditions
over a span of 20 years. The field study showed that the number of cracks had
more than doubled, spalling dimensions had increased, and faulting
displacements had increased by more than 43 percent.
The report concludes with a broad assessment of expected I-5 conditions
and WSDOT actions that will be necessary in five-year increments (0 to 5 years,
5 to 10 years, and greater than 10 years).
x

1
CHAPTER 1 INTRODUCTION
1.1 THE PROBLEM
The U.S. Interstate system is about 50 years old. For I-5 within King
County, most of the original portland cement concrete pavement (PCCP) was
placed up to 47 years ago, according to the Washington State Department of
Transportation (WSDOT). These 9-inch-thick pavements have been in service for
more than twice their original design life of 20 years.
Why has I-5 performed as well as it has? This could be due to Western
Washington’s mild climate and the durable aggregates used in the PCC.
Despite the good performance of the I-5 PCC pavements, they are now
showing high levels of distress and are in need of rehabilitation and/or
replacement. High volumes of heavy truck traffic have resulted in extensive panel
cracking and transverse joint faulting. Studded tire use has also created
extensive wheel path wear and aggregate surface polishing. As a result,
pavements are not only losing their structural capacity but are becoming
uncomfortable for the public to travel upon.
1.2 THE STUDY
In an effort to address the issues associated with the deterioration of I-5 in
King County, WSDOT’s Urban Corridors Office commissioned the Route
Development Plan to assess the condition and deterioration of I-5 in King
County. This study is a joint effort among the WSDOT Office of Urban Corridors,
Parametrix Engineering, Nichols Consulting Engineers, and a team from the
University of Washington’s Department of Civil and Environmental Engineering.
Parametrix Engineering is providing a traffic assessment for I-5 within King
County and a traffic model that uses the program VisSim, short for Visual
Simulations. The VisSim model was used to identify possible methods for
improving traffic efficiency, such as removing exits or adding lanes to reduce
weaving and increase capacity.

The UW team consisted of professors Joe Mahoney and George
Turkiyyah, Graduate Research Assistant Michael Hansen, WSDOT State
Pavements Engineer Linda Pierce, and Newton Jackson of Nichols Consulting.
1.3 OBJECTIVES
This report is the first of at least three reports to be produced by the study
team. This report presents a pavement assessment and the development of
visual tools for reviewing the condition of the I-5 PCCP. The second report is an
executive summary of the major study findings. A third report will overview the
research relating to the modeling of the PCCP’s structural behavior.
1.4 ORGANIZATION
The report contains five chapters. Chapter 2 overviews the I-5 PCCP
distress data. Chapter 3 describes the analyses of those data, Chapter 4 reviews
the PCCP rehabilitation options for I-5, and Chapter 5 contains the study’s initial
conclusions and recommendations.
2

CHAPTER 2 I-5 PCCP DATA
Evaluating the distress of the I-5 PCCP requires extensive data collection.
Fortunately, WSDOT has collected much of the needed data for I-5 through King
County.
This chapter describes the data that were collected, including data from
2004 and 2007. Additional information was collected from the Washington State
Pavement Management System (WSPMS), video imagery, and accident
histories.
2.1 I-5 PCCP DISTRESS DATA
For this report, slab cracking, transverse joint faulting, wheel path wear,
and International Roughness Index (IRI) will be referred to as PCCP distress.
WSDOT collected the I-5 PCCP distress data with its data distress
collection van. The van is outfitted with multiple lasers for measuring wheel path
wear and the road profile, along with video imaging equipment that documents
other pavement distress such as slab cracking. Data were collected continuously
and summarized in 1/10-mile increments for IRI, wheel path wear, faulting, and
cracking.
The IRI was averaged for the right and left wheel paths for each of the
1/10-mile sections. An examination of the IRI data revealed that higher IRI values
were recorded in the left wheel paths for all lanes in both the northbound and
southbound directions. Initially this was thought to have been the result of
longitudinal cracking, which tends to be more prevalent in the left wheel path.
Extensive longitudinal cracking was noted in a research report that examined I-5
performance in the early 1990s (Mahoney et al., 1991). However, discussions
with WSDOT determined that this discrepancy was a result of problems with the
collection equipment. Therefore, only the data from the right wheel path were
used in the study (Pierce, 2006).
3

Wheel path wear was evaluated in both the wheel paths and averaged
over 1/10-mile sections. The maximum wear depth was recorded and stored for
each section.
The faulting of the pavement sections was collected as a percentage of
the slabs in a 1/10-mile section (1/10-mile equals 35 slabs) that exhibited one of
three levels of faulting: ⅛ in. to ¼ in., ¼ in. to ½ in., and ½ in. and greater.
Additionally, the average faulting was recorded over each 1/10-mile section.
Through analyses of video imagery, WSDOT determined the number of
cracks (either one, two to three, or four or more cracks) in each of the panels per
1/10-mile section.
2.1.1 2004 I-5 PCCP Distress Data
The 2004 I-5 PCCP distress data were collected between July 8, 2004,
and July 22, 2004. These data represented pavement distress data collected by
WSDOT from milepost (MP) 139.5 (King-Pierce County Line) to MP 177.75
(King-Snohomish County Line) for lanes 1 through 4 in both the northbound and
southbound directions. The 2004 survey was the first one conducted by WSDOT
for all lanes in both directions.
For this study it was necessary to filter the 2004 distress data, which
included the removal of sections of hot mix asphalt (HMA) paving, HMA overlays,
and bridge decks. The centerline mileage of I-5 in King County is shown in Table
1.1.
Within King County, I-5 has a total of 76.5 centerline miles, including 9.7
miles of bridge deck (both directions), or about 13 percent of the total. Each of
the 1/10-mile sections that contained bridge deck were removed from the 2004
distress data used in this study. The logic for this is that where the bridge deck
meets with the PCCP, displacement at the joint tends to cause a large increase
in faulting and IRI.
4

Table 2.1. I-5 Bridge Deck in King County by Centerline Miles and Percentage
Item Northbound Southbound Total
I-5 Total Centerline Miles 38.25 38.25 76.5
Total Centerline Miles of Bridge Deck 4.01 5.69 9.7
Total % of Bridge Deck 10.5% 14.9% 12.68%
All of I-5 in King County was originally constructed with PCCP. Since the
original construction, only one section of I-5 in King County has been overlaid
with HMA. This section of HMA exists in the southbound lanes between
mileposts 156.5 and 156.7. This section was also removed from the data set.
2.1.2 2006 I-5 PCCP Distress Data
The 2006 I-5 PCCP distress data were collected on August 14th, 17th, and
November 1st of 2006 as part of WSDOT’s annual pavement distress collection
process. This data collection was done in one pass of a single lane of I-5
northbound and southbound, most of which was in Lane 2. Bridge decks were
identified and removed from the 2006 distress data. Refer to Appendix A for a
detailed road log with MP locations.
2.2 I-5 VIDEO IMAGERY
Video imagery was collected from four cameras mounted on the WSDOT
distress collection van. Two of the cameras face down toward the pavement and
take surface images of the lane that the van is traveling. These two cameras take
continuous images that overlap, providing a complete picture of the pavement.
The other two cameras face forward, taking images of the roadway ahead of the
van in a driver’s perspective. These images are not taken as often as the
pavement images. For every five sets of pavement images there is one driving
perspective set of images.
2.3 ACCIDENT DATA
WSDOT documents all reported accidents that occur on state routes. For
this study the accidents that occurred in wet conditions were of special interest.
5

Wet condition accidents are accidents that occurred either when the roadway
was wet or when water was standing on the roadway. Between 2001 and 2006,
4,485 wet condition accidents occurred on I-5 in King County (excluding all
accidents involving alcohol).
The data recorded for each accident include the following:
- Milepost
- Lane and Direction
- Date and Time
- Number of Injuries and Fatalities
- Number of Vehicles
- Roadway Surface Condition (Wet/Standing Water)
- Type of Vehicle.
2.4 FIELD STUDY DATA
This study used field data that were collected in conjunction with a
previous study of I-5 pavement performance
2.4.1 Field Study Site Selection Criteria
As another factor to assess the condition of I-5, a pavement section was
sought that included extensive distress but was not necessarily the worst case.
Such distress would include longitudinal cracking, panels with multiple cracks,
wheel path wear, and faulting. I-5 exhibits an abnormal amount of longitudinal
cracking, especially in the left wheel path. These longitudinal cracks developed
early in the life of these slabs and progressed minimally over several decades
(Jackson, 2006; Mahoney et al, 1991).
Once multiple cracks develop in a panel, the pavement begins to lose
serviceability. Assessing panels with multiple cracks allows further understanding
of the progression of crack development.
2.4.2 Selected Field Study Site—Northbound I-5 at MP 176.35
Northbound I-5 at milepost 176.35 was selected, in part, because of
previous testing in September 1986 (Mahoney et al., 1991). Testing at this
6

location provided a unique opportunity to study how these PCC pavements had
deteriorated over a 21-year period.
This section of I-5 was constructed in December 1964 with four 12-foot-
wide PCC lanes in each direction and HMA shoulders. The transverse joints
were spaced 15 feet apart and perpendicular to the centerline. The pavement
design for this section of I-5 consisted of 9 inches of plain jointed PCC over 2
inches of crushed surfacing top course, over 5 inches of special ballast, over a
silty subgrade.
The 1986 testing began at about MP 176.35 and extended north about
420 feet in the two outside lanes. The core locations from 1986 are visible on
Pathview, which allowed identification of the slabs.
The 1986 field study data from MP 176.35 were collected in three groups
of four panels each in lanes 1 and 2 (slabs 1 to 4, 18 to 21, and 25 to 28). Cores
were taken; cracking, spalling, and faulting were surveyed; and falling weight
deflectometer (FWD) tests were conducted.
2.4.3 1986 I-5 Field Study Data Collection—MP 176.35
Forty 4-inch-diameter cores were obtained in the initial investigation in
1986. These cores were taken at slab centers, transverse joints, longitudinal
joints, and intact areas between joints and cracks, as noted in Appendix B.
Each slab in the test was closely scrutinized to identify every crack. The
cracks were then inspected for spalling; the area of highest spalling distress was
identified; and the maximum depth and width of the spall were recorded. The
cracking and spall data can also be found in Appendix B.
Faulting measurements for joints and cracks were made at the outside
and inside edges of Lane 1 on all of the slabs. Measurements were limited to the
outside edge of Lane 2 for all slabs except 25 and 26. Additional measurements
were made at the middle of the lane and in each wheel path in Lane 1 for slabs 1
through 4. All of the faulting measurement locations are shown in Appendix B.
FWD testing was conducted in the outside wheel panel edge, the right
wheel path, and at the center of the lane in Lane 1 for slabs 1 through 4. The
7

FWD was positioned on either side of the joints and at the center of the slabs.
For slabs 19 and –20, FWD tests were taken at the outside edge of Lane 1 and
on either side of a longitudinal crack in Slab 18. Tests were also conducted on
either side of a longitudinal crack in slabs 25 and 26, as laid out in Appendix B.
2.4.4 2007 I-5 Field Study Data Collection
The 2007 I-5 field study was similar to the 1986 field study. The 2007 field
study was conducted in the early morning hours of July 28th and collected much
of the same information at the same locations as in the 1986 study. In
comparison to the 1986 field study, the 2007 field study was not as in-depth but
provided a unique opportunity to compare two sets of distress data collected 21
years apart.
As occurred in 1986, the 2007 data collection was a joint effort of WSDOT
and the University of Washington. WSDOT provided the core drilling, FWD
testing, and traffic control. The University of Washington provided the field study
plan, conducted the faulting and cracking surveys, and assisted with the FWD
testing and the core drilling.
While 40 cores were collected in 1986, only 12 were collected in 2007,
short of the planned number. Core locations were restricted to the outside wheel
path at mid-slab and at the transverse joints of Lane 1, as seen in Appendix B.
Unfortunately, because of time constraints and a lack of patching material, core
drilling was cut short.
The crack and spalling survey was the same as in 1986. The cracking
survey was not fully completed because of safety concerns associated with traffic
during the field study (slabs 26, 27, and 28 were not completely surveyed).
These slabs exhibited some of the worst spalling observed at the test site.
Spalling widths were estimated to be in excess of 4 in. at two of the slabs.
The faulting survey was also cut short at Slab 26 because of safety
concerns. The detailed locations of the faulting survey are found in Appendix B.
8

The FWD was used primarily at the transverse joints and at the
longitudinal cracks to assess load transfer, and these locations are more fully
described in Chapter 3 and Appendix B.
9

CHAPTER 3 I-5 PCCP DISTRESS DATA ANALYSIS
The data provided by WSDOT and described in Chapter 2 were analyzed
to assess the pavement’s current condition, identify sections of high distress, and
provide an improved understanding of the remaining life of the PCCP along I-5
through King County. The methods and results for these data are discussed in
this chapter.
3.1 2004 I-5 PCCP DISTRESS DATA SUMMARY
The 2004 distress data set was large, which made it a bit challenging to
process and summarize. As such, the data were organized into three
manageable sets. These sets consisted of (1) non-rehabilitated PCCP, (2)
diamond ground PCCP, and (3) dowel bar retrofitted and diamond ground PCCP.
These three sets were further divided by increasing/decreasing direction and
lane (1 through 4).
These groups of data were statistically analyzed and placed in tabular
form for ease of comparison. These tables can be found in appendices C, D, and
E.
This division of distress data resulted in 27 summary tables. By use of
these divisions, it was possible to compare the non-rehabilitated PCCP
distresses for each lane.
3.1.1 Non-Rehabilitated 2004 PCCP Distress
The majority of the existing I-5 PCCP in King County was constructed
between 1962 and 1971, and as of 2004, it had not been reconstructed or
rehabilitated. Out of a total of 195.7 lane miles (refer to Figure 3.1), I-5 in King
County has 162.9 lane miles of non-rehabilitated PCCP, or 83 percent. As might
be expected given their age and traffic, these pavements are showing significant
distress.
10

Figure 3.1. I-5 King County PCCP in 2004
The average IRI in the right wheel path for all non-rehabilitated PCCP is
157 in./mile. As expected, the highest IRI values are in lanes 1 and 2 (refer to
Table 3.1), where a higher volume of truck traffic contributes to faulting and
increased panel cracking.
I-5’s non-rehabilitated pavements exhibit substantial wheel path wear,
which is attributed to studded tires. The average wear for all these pavements is
0.34 in. in both the right and left wheel paths. The maximum wear exceeds 0.75
in., which can cause difficulty with lane changes and create potential for
hydroplaning (Pierce, 2006).
11

Table 3.1. 2004 Average Distresses of Non-Rehabilitated, Diamond Ground, and Diamond Ground with Dowel Bar Retrofit PCCP
Item Non-Rehabilitated PCCP
Diamond Ground PCCP
Dowel Bar Retrofit and
Diamond Grinded PCCP
NB Mile Posts 139.5-177.75 103.75 ln-mi
154.14-158.24 14.16 ln-mi N/A
SB Mile Posts 139.75-177.75 59.05 ln-mi
154.16-154.4 12.68 ln-mi
144.45-149.69 6.04 ln-mi
Average IRI (in/mi) 157 70 52
Average Rut Left (in) 0.34 0.17 0.26
Average Rut Right (in) 0.34 0.19 0.27
Average Faulting (in) 0.11 0.05 0.03
Number of Faults per 35 slabs 8.10 2.17 2.54
⅛" - ¼" 22.18 4.70 3.39
¼" - ½" 5.80 1.64 0.00
½" + 0.94 0.02 0.00
% o
f Fau
lted
Slab
s
Total 28.91 6.36 3.39
1 Crack 3.77 3.56 1.41
2 - 3 Cracks 0.67 0.33 0.13
Ave
rage
# o
f C
rack
s pe
r Pa
nel p
er 3
5 sl
abs
4+ Cracks 0.09 0.05 0.00
1 Cracks 11.20 10.73 4.04
2 - 3 Cracks 2.08 0.98 0.38
# of
Cra
cks
as %
of T
otal
Sl
abs
4+ Cracks 0.29 0.14 0.00
⅛" - ¼" 7.78 0.65 0.23
¼" - ½" 2.93 0.23 0.00
½" + 0.20 0.01 0.00
Faul
ted
Slab
s as
%
of T
otal
Sla
bs
Total 10.91 0.89 0.23
% PCCP Cracked 13.56 11.85 4.42
Average Age of PCCP as of 2004 40.43 37.00 39.74
Age of
Rehabilitation as of 2004
N/A 5.0 3.0
12

As observed in previous studies, faulting on I-5 is not as prevalent as it is
on other PCCP pavements in Washington (Mahoney et al., 1991). On average,
29 percent of the slabs are faulted, with an average fault displacement of 0.11 in.
(a bit less than ⅛ in.); 22 percent of the slabs have a displacement of between ⅛
in. and ¼ in.; 6 percent of the slabs have a displacement of ¼ in. to ½ in.; and
about 1 percent of the slabs have a displacement of ½ in. or greater (refer to
Table 3.1).
In comparison, about 14 percent of the non-rehabilitated PCCP panels
exhibit cracking (see Table 3.1).
3.1.2 Diamond Ground 2004 PCCP Distress
About 41 lane miles of diamond ground PCCP are on I-5 in King County.
This grinding occurred in 1999 in both the northbound and southbound directions
between mileposts 154.14 and 158.45 (refer to Figure 3.1). The performance of
the ground PCCP exceeds that of the non-rehabilitated PCCP, as expected.
The ride of these pavements is smoother than that of the non-rehabilitated
pavements. The IRI for these diamond ground pavements is 70 in./mile in
comparison to 157 in./mile for the non-rehabilitated sections.
The average wear for the diamond ground PCCP is 0.17 in. in the left
wheel path and 0.19 in. in the right wheel path.
The diamond ground PCCP has substantially less faulting than the non-
rehabilitated PCCP. Only 6 percent of the slabs of the diamond ground PCCP
exhibit faulting, with an average of 0.05 in., in comparison to the non-rehabilitated
sections, 29 percent of which have faulted slabs, with an average faulting of 0.11
in. (refer to Table 3.1). Assuming that the grinding removed the then-existing
faulting, this level of faulting developed over a 5-year span (1999 to 2004). While
dynamic loading at the transverse joints is reduced, issues associated with the
base material, subgrade, and joint load transfer are not solved by diamond
grinding.
Cracking is a bit less prevalent in the diamond ground PCCP. Twelve
percent of the diamond ground PCCP panels have experienced cracking in
13

comparison to 14 percent of the non-rehabilitated PCCP panels. This difference
is not considered significant (see Table 3.1).
3.1.3 Dowel Bar Retrofit and Diamond Ground 2004 PCCP Distress
There are only two sections of dowel bar retrofit (DBR) and diamond
ground PCCP on I-5 within King County (a total of 6.04 lane miles). As seen in
Figure 3.1, these sections exist on southbound I-5 from mileposts 144.45 to
146.18 and mileposts 147.67 to 149.69.
As expected, the PCCP that was both retrofitted with dowel bars and
diamond ground is performing better than either the non-rehabilitated or solely
diamond ground PCCP. The increased performance would be expected, in part,
because the DBR and diamond grinding were done in 2001, and the pavement
had experienced only three years of traffic before the data collection in 2004.
Furthermore, the pavement with DBR and diamond grinding would be expected
to exhibit better performance than the pavements that were only ground because
of the increased load transfer provided by the dowel bars. The improved load
transfer would, in turn, reduce faulting and improve the pavement’s ability to
carry heavy traffic.
The DBR and diamond grinding improved the ride of these pavements, as
evident by the low IRI values. The IRI for all pavements that had DBR and
diamond grinding is 52 in./mile. The faulting for these pavements is almost non-
existent, with 3 percent of the panels exhibiting faulting with an average of 0.03
in. No faulting over 0.25 in. was observed in any of the PCCP that had DBR and
diamond grinding.
Despite being ground in 2001, the DBR and diamond ground pavements
exhibit more wear than the pavement diamond ground in 1999. According to
WSDOT, this is a result of a shallower grind depth in 2001 than in 1999 (Pierce,
personal communication, 2007).
The cracking of the PCCP panels is also lower in the sections that had the
DBR and diamond grinding than for either the diamond ground or non-
rehabilitated pavements. Only 4 percent of the PCCP panels exhibit any
14

cracking, and none of the panels has more than three cracks. This indicates that
the PCCP panels that have developed four or more cracks in the non-
rehabilitated and diamond ground sections may have recently developed these
cracks, suggesting accelerating deterioration of the PCCP in this corridor.
3.1.4 Type and Year of Construction—2004 PCCP Distress Summary
The WSPMS was used to identify the year of construction and the type
and thickness of base associated with the non-rehabilitated I-5 PCCP in King
County. Thirteen distinct sections of construction were identified. Tables are
shown in Appendix F, and maps of the locations of these sections along I-5 are
located in Appendix G.
All of the PCCP in the I-5 King County corridor was constructed with a
slab thickness of 9 in., while base materials had varying thicknesses and types.
Most of the sections have untreated base material ranging in thickness from 0.59
ft to 1.08 ft, while a few sections were constructed with an asphalt treated base
(ATB) and concrete treated base (CTB). The ATB was placed at a thickness of
0.33 ft, with 0.58 ft and 0.75 ft of untreated base beneath. The single section of
CTB was placed with a thickness of 0.17 ft, with 0.42 ft of untreated base
underneath (see Table 3.2).
The data in Table 3.2 suggest that the sections of PCCP that were
constructed with the ATB have performed better with respect to faulting than
those sections of PCCP with untreated base. The percentage of faulted slabs is
lower for the ATB sections than for the untreated base sections. The cracking for
both types of section (ATB and untreated) does not appear to be significantly
different.
The single section of PCCP with CTB has performed similarly to the
PCCP sections with ATB. Like the ATB sections, the CTB section shows better
faulting resistance. The percentage of cracked slabs with the CTB base is similar
to values seen with the ATB sections. The sections with the greatest thickness of
untreated base (160.17 to 162.68 SB) are performing better than all of the other
sections in all categories except for percentage of cracked slabs.
15

16
Table 3.2. Summary of Construction Sections, 2004 Distress Performance
MILE POST NB
174.58-177.75
172.79-174.58
170.85-172.76
170.5-170.85
169.18-170.25
176.13-168.34
166.21-167.13
162.68-165.32 N/A 158.24-
162.68 152.65-158.24
149.39-152.65
139.50-149.39
Mile Post SB N/A N/A 170.85-177.75
170.5-170.85
169.18-170.25
167.72-168.34
N/A 162.68-166.36
160.17-162.68
157.47-160.07
153.15-158.45
149.40-153.15
139.50-149.40
Year Constructed 1965 1965 1965 1963 1965 1964 1965 1967 1967 1967 1969 1966 1962
Number of Lanes 4 4 4 3 4 4 4 4 4 4 4 3 3
Thickness of ATB (ft) N/A N/A N/A N/A N/A N/A N/A N/A N/A 0.33 0.33 N/A N/A
Thickness of CTB (ft) 0.17 N/A N/A N/A N/A N/A N/A N/A N/A N/A N/A N/A N/A
Thickness of UB (ft) 0.42 0.92 0.59 0.67 0.67 0.67 0.92 0.92 1.08 0.75 0.58 0.67 0.75
Average IRI (in/mile) 135 159 161 155 175 179 169 121 89 133 103 148 172
Average Faulting (in) 0.09 0.13 0.13 0.12 0.13 0.12 0.12 0.09 0.06 0.08 0.08 0.10 0.12
% of Faulted Slabs 22.4 35.8 38.0 37.4 37.4 29.7 31.5 19.2 10.0 19.2 18.0 21.0 27.5
% of Cracked Slabs 17.44 17.66 19.95 16.25 11.13 11.28 4.40 15.62 13.78 8.53 18.48 17.74 5.54

17
3.2 2004 I-5 PCCP DISTRESS DATA FAILURE ANALYSIS
For the distress types available for 2004 (IRI, faulting, wheel path wear,
and panel cracking), there are generally accepted levels of distress that are
associated with pavement rehabilitation and/or replacement. For this report such
values will be referred to as trigger values. The 2004 distress data were analyzed
by using typical trigger values to determine the total lane miles and percentage of
lane miles that exceeded these values.
3.2.1 IRI Trigger Values and Analysis
For IRI, trigger values of 170 and 220 in./mile are used. These trigger
values are the result of a study focused on driver-perceived roughness on urban
highways (Shafizadeh, 2002). This study determined that an IRI value of 170
in./mile is the upper threshold at which drivers perceive the roughness of the
road as acceptable. The 220 in./mile trigger value was determined from a
consensus of pavement engineers, who agreed that at this level of roughness the
pavement becomes uncomfortable to drive, especially for semi-tractor trailer
drivers (Shafizadeh, 2002).
An analysis of the 2004 distress data determined that 16 percent of the I-5
PCCP had an IRI value of between 170 and 220 in./mile and another 16 percent
had an IRI value of greater than 220 in./mile. Thus 32 percent of the I-5 analyzed
pavement exceeded the trigger values. It is important to note that the average IRI
value for all the non-rehabilitated PCCP was 157 in./mile, and much of this PCCP
was on the verge of exceeding 170 in./mile (refer to Table 3.3, which shows the
lane miles in excess of the trigger values, and Table 3.4, which shows the
percentage of lane miles).

Table 3.3. Lanes Miles of I-5 in Excess of Trigger Values
Direction and Lane
IRI o
f 170
in/m
ile
IRI o
f 220
in/m
ile
Whe
el P
ath
Wea
r D
epth
of 0
.40"
⅛"
of F
aulti
ng
¼"
of F
aulti
ng
½"
of F
aulti
ng
10%
of P
anel
s C
rack
ed
5% o
f Pan
els
with
2
or M
ore
Cra
cks
10%
of P
anel
s w
ith 2
or M
ore
Cra
cks
Northbound Lane 1 7.57 4.43 2.42 8.21 1.3 0.00 7.56 3.91 1.51Northbound Lane 2 12.58 5.9 9.32 13.23 1.3 0.00 13.64 8.2 4.53Northbound Lane 3 6.18 2.18 15.87 8.57 0.61 0.10 11.52 2.01 0.41Northbound Lane 4 5.59 2 5.97 3.62 0.77 0.20 4.13 0.46 0.1Northbound Total 31.92 14.51 33.58 33.63 3.98 0.30 36.85 14.58 6.55
Southbound Lane 1 8.03 6.09 1.85 8.03 0.91 0.00 7.42 3.78 1.48Southbound Lane 2 8.61 5.71 7.78 10.12 0.9 0.00 12.99 6.56 3.71Southbound Lane 3 6.74 3.05 8.67 7.87 0.65 0.00 6.61 0.7 0.2Southbound Lane 4 3.99 0.72 2.92 4.96 0.7 0.20 4.4 0.52 0.12Southbound Total 27.37 15.57 21.22 30.98 3.16 0.20 31.42 11.56 5.51
Total 59.29 30.08 54.8 64.61 7.14 0.50 68.27 26.14 12.06
Table 3.4. Percentage of I-5 in Excess of Trigger Values
Direction and Lane
IRI o
f 170
in/m
ile
IRI o
f 220
in/m
ile
Whe
el P
ath
Wea
r D
epth
of 0
.40"
⅛"
of F
aulti
ng
¼"
of F
aulti
ng
½"
of F
aulti
ng
10%
of P
anel
s C
rack
ed
5% o
f Pan
els
with
2
or M
ore
Cra
cks
10%
of P
anel
s w
ith
2 or
Mor
e C
rack
s
Northbound Lane 1 35.59 20.83 11.38 38.60 6.11 0.00 35.54 18.38 7.10Northbound Lane 2 47.40 22.23 35.12 49.85 4.90 0.00 51.39 30.90 17.07Northbound Lane 3 23.78 8.39 61.06 32.97 2.35 0.38 44.32 7.73 1.58Northbound Lane 4 20.13 7.20 21.50 13.04 2.77 0.72 14.87 1.66 0.36
Northbound Total 31.43 14.29 33.06 33.11 3.92 0.30 36.28 14.35 6.45Southbound Lane 1 46.74 35.45 10.77 46.74 5.30 0.00 43.19 22.00 8.61Southbound Lane 2 39.01 25.87 35.25 45.85 4.08 0.00 58.86 29.72 16.81Southbound Lane 3 30.29 13.71 38.97 35.37 2.92 0.00 29.71 3.15 0.90Southbound Lane 4 17.51 3.16 12.81 21.76 3.07 0.88 19.31 2.28 0.53Southbound Total 32.47 18.47 25.17 36.75 3.75 0.24 37.28 13.71 6.54
Total 31.90 16.18 29.48 34.76 3.84 0.27 36.73 14.06 6.49
18

3.2.2 Average Faulting Trigger Values and Analysis
The faulting trigger values used were ⅛ in. and ¼ in. If faulting is greater
than ⅛ in., it can be felt by vehicle occupants. Once faulting exceeds ¼ in., it is
noticeably uncomfortable, especially for operators of semi-tractor trailers
(Mahoney, 2006).
The average faulting of the non-rehabilitated PCCP determined in the
2004 distress analysis was 0.11 in. In 2004, 31 percent of the non-rehabilitated
PCCP exhibited average faulting of between ⅛ in. and ¼ in., while only 4 percent
exhibited average faulting of over ¼ in.
At a ½ inch, faulting is very severe, and the conditions are uncomfortable
for all using the roadway. Of the 162.8 lane-miles of non-rehabilitated PCCP,
only a ½ mile exhibited faulting in excess of a ½ in. Because this is such a small
percentage (less than half a percent) of the total non-rehabilitated PCCP, it was
not used as a trigger value in this study.
3.2.3 Wheel Path Wear Trigger Value and Analysis
For wheel path wear, a single trigger value is used. Once the wheel path
wear exceeds 0.4 in. there is increased risk that standing water could result in
hydroplaning (Pierce, 2006). For 2004, the average wheel path wear was 0.34
in., while 29 percent of the non-rehabilitated I-5 PCCP in King County exceeded
0.4 in.
3.2.4 Panel Cracking Trigger Value and Analysis
There are several views about how panel cracking affects the life of a
PCCP, as reflected in the decision making process of replacing and rehabilitating
PCCP. One criterion is that replacement may be considered when 10 percent of
the panels in a section of the trafficked lane (outside lane) exhibit multiple cracks.
Another criterion is that once a panel has more than two cracks, the panel has or
is losing ability to function structurally (Pierce, 2006; Jackson, 2006). For this
study two sets of trigger values were developed on the basis of these two views.
19

The first set of trigger values was based on the 10 percent method but
extended to each lane of traffic. So any given section of PCCP that exceeded 10
percent would satisfy the trigger value. Of the existing non-rehabilitated I-5
PCCP within King County, 37 percent exceeded this trigger value. Since panels
with a single longitudinal crack are capable of providing continuing serviceability,
this trigger value is not the best for considering the needs of the I-5 PCCP
(Pierce, 2006; Jackson, 2006).
The second set of trigger values, based on multiple cracks, is better suited
for the I-5 PCCP. Trigger values were set at 5 percent and 10 percent of panels
in a section with multiple cracks. This set of trigger values eliminated the panels
that had a single longitudinal crack. The results of these trigger values were that
in 8 percent of the non-rehabilitated PCCP sections, 5 to 10 percent of panels
had multiple cracks, while in 6 percent of the sections, the number of panels with
multiple cracks exceeded 10 percent.
3.2.5 Summary of 2004 I-5 PCCP Distress Data Failure Analysis
The eight trigger values provided the opportunity to analyze the 2004
distress data with 12 different sets of trigger values. Table 3.5 illustrates these
sets, as well as the resulting lane miles and percentage of roadway that each
value triggered. The lane miles are the total lane miles that exceeded at least
one of the trigger values. Many sections of the non-rehabilitated PCCP exceeded
more than one trigger value.
As the severity of the trigger values increased, the number of lane miles
that exceeded those values decreased. For example, in Column 1, the lowest
triggers were used, resulting in the highest percentage of roadway exceeding the
trigger values. Conversely, the least number of lane miles exceeded the specific
trigger values of set column 12, which had the highest trigger values.
Depending on which trigger value set was used, the table indicates that
between 43 percent and 70 percent of the non-rehabilitated I-5 PCCP needs to
be rehabilitated or replaced. The trigger values that should be selected for use in
the decision making process for rehabilitation and reconstruction will ultimately
20

be a function of available funding, timing, and anticipated serviceability of the
PCCP.
Table 3.5. Trigger Value Sets and Lane Mile and Percentage of Roadway Exceeding Them
Trigger Sets 1 2 3 4 5 6 7 8 9 10 11 12
IRI of 170 in/mile x x x x x x
IRI of 220 in/mile x x x X x x
Wheel Path Wear Depth of 0.40" x x x x x x x X x x x x
⅛" of Faulting x x x x x x
¼" of Faulting x x x X x x
10% of Panels Cracked x x x x
5% of Panels with 2 or More Cracks x x x X
10% of Panels with 2 or More Cracks x x x x
Lane Miles 129.18 122.96 122.98 109.97 112.94 104.17 105.34 87.77 107.54 97.32 99.74 79.82
Percentage of Roadway 69.50 66.16 66.17 59.17 60.77 56.05 56.68 47.22 57.86 52.36 53.66 42.95
3.3 2006 I-5 PCCP DISTRESS SUMMARY
The 2006 distress data were summarized by using the same methodology
as was used to summarize the 2004 distress data. The data were broken down
by pavement rehabilitation method (or none), direction, and lane, and averages
were calculated.
A review of the 2006 distress data showed improved values for every
pavement distress in comparison to the 2004 distress data. This suggests that
something was different in the data collection, or the sections of pavement from
the 2004 data used to compare with the 2006 data did not match. Therefore, the
2006 distress data were not used for comparison to the 2004 data.
21

3.4 PAVEMENT DISTRESS PLOTS FOR 2004 I-5 PCCP DISTRESS DATA
Each of the pavement distresses in the 2004 distress data was plotted to
develop a visual tool for assessing the pavement. Seven different sets of distress
plots were created, including IRI, average faulting, wheel path wear, percentage
of cracked panels, number of cracked panels, percentage of panels with two or
more cracks, and percentage of cracked panels and faulting
Each lane of northbound and southbound I-5 was divided into roughly
equivalent sections. These sections were used in all the plot sets for ease of
comparison.
3.4.1 Distress Plots for IRI, Wheel Path Wear, Average Faulting, and Percentage of Cracked Panels The distress plots for IRI, wheel path wear, average faulting, and
percentage of cracked panels are the basic plots of the 2004 distress data. Each
figure contains the trigger values discussed previously as red lines to identify
sections that are in poor condition. Figures 3.2, 3.3, 3.4, and 3.5 are examples of
what can be found in appendices H, I, J, and K for all of I-5 in King County.
22

23
0
50
100
150
200
250
300
350
400
450
500
550IR
I(in/
mile
)16
9.78
- 16
9.88
169.
88 -
169.
9816
9.98
- 17
0.08
170.
08 -
170.
1817
0.18
- 17
0.25
Brid
ge -
172.
49 -
172.
5917
2.59
- 17
2.69
Brid
ge -
172.
89 -
172.
9917
2.99
- 17
3.09
173.
09 -
173.
1917
3.19
- 17
3.29
173.
29 -
173.
3917
3.39
- 17
3.49
173.
49 -
173.
5917
3.59
- 17
3.69
173.
69 -
173.
7917
3.79
- 17
3.89
173.
89 -
173.
9917
3.99
- 17
4.09
174.
09 -
174.
1417
4.14
- 17
4.24
174.
24 -
174.
3417
4.34
- 17
4.44
174.
44 -
174.
5417
4.54
- 17
4.64
174.
64 -
174.
7417
4.74
- 17
4.84
174.
84 -
174.
9417
4.94
- 17
5.04
175.
04 -
175.
11Br
idge
- 17
5.24
- 17
5.34
175.
34 -
175.
44Br
idge
-
175.
64 -
175.
7417
5.74
- 17
5.79
Mile Post
Northbound Lane 1 IRI Values MP 169.78 to MP 175.79
Figure 3.2. Example Plot of IRI

0.00
0.05
0.10
0.15
0.20
0.25
0.30
0.35
0.40
0.45
0.50
0.55
0.60
0.65
0.70
0.75
0.80
Whe
el P
ath
Wea
r Dep
th(in
)16
9.78
- 16
9.88
196
5
169.
88 -
169.
98 1
965
169.
98 -
170.
08 1
965
170.
08 -
170.
18 1
965
170.
18 -
170.
25 1
965
Brid
ge -
172.
49 -
172.
59 1
965
172.
59 -
172.
69 1
965
Brid
ge -
172.
89 -
172.
99 1
965
172.
99 -
173.
09 1
965
173.
09 -
173.
19 1
965
173.
19 -
173.
29 1
965
173.
29 -
173.
39 1
965
173.
39 -
173.
49 1
965
173.
49 -
173.
59 1
965
173.
59 -
173.
69 1
965
173.
69 -
173.
79 1
965
173.
79 -
173.
89 1
965
173.
89 -
173.
99 1
965
173.
99 -
174.
09 1
965
174.
09 -
174.
14 1
965
174.
14 -
174.
24 1
965
174.
24 -
174.
34 1
965
174.
34 -
174.
44 1
965
174.
44 -
174.
54 1
965
174.
54 -
174.
64 1
965
174.
64 -
174.
74 1
965
174.
74 -
174.
84 1
965
174.
84 -
174.
94 1
965
174.
94 -
175.
04 1
965
175.
04 -
175.
11 1
965
Brid
ge -
175.
24 -
175.
34 1
965
175.
34 -
175.
44 1
965
Brid
ge -
175.
64 -
175.
74 1
965
175.
74 -
175.
79 1
965
Mile Post
Northbound Lane 1 Wheel Path Wear MP 169.78 to MP 175.79
Figure 3.3. Example Plot of Wheel Path Wear
24

0.00
0.05
0.10
0.15
0.20
0.25
0.30
0.35
0.40
0.45
0.50
Ave
rage
Fau
lting
(in)
169.
78 -
169.
8816
9.88
- 16
9.98
169.
98 -
170.
0817
0.08
- 17
0.18
170.
18 -
170.
25Br
idge
- 17
2.49
- 17
2.59
172.
59 -
172.
69Br
idge
- 17
2.89
- 17
2.99
172.
99 -
173.
0917
3.09
- 17
3.19
173.
19 -
173.
2917
3.29
- 17
3.39
173.
39 -
173.
4917
3.49
- 17
3.59
173.
59 -
173.
6917
3.69
- 17
3.79
173.
79 -
173.
8917
3.89
- 17
3.99
173.
99 -
174.
0917
4.09
- 17
4.14
174.
14 -
174.
2417
4.24
- 17
4.34
174.
34 -
174.
4417
4.44
- 17
4.54
174.
54 -
174.
6417
4.64
- 17
4.74
174.
74 -
174.
8417
4.84
- 17
4.94
174.
94 -
175.
0417
5.04
- 17
5.11
Brid
ge -
175.
24 -
175.
3417
5.34
- 17
5.44
Brid
ge -
175.
64 -
175.
7417
5.74
- 17
5.79
Mile Post
Northbound Lane 1 Faulting MP 169.78 to MP 175.79
Figure 3.4. Example Plot of Faulting
25

26
0
10
20
30
40
50
60
70
80
90
100
Perc
enta
ge o
f Cra
cked
Pan
els
169.
78 -
169.
8816
9.88
- 16
9.98
169.
98 -
170.
0817
0.08
- 17
0.18
170.
18 -
170.
25Br
idge
- 17
2.49
- 17
2.59
172.
59 -
172.
69Br
idge
- 17
2.89
- 17
2.99
172.
99 -
173.
0917
3.09
- 17
3.19
173.
19 -
173.
2917
3.29
- 17
3.39
173.
39 -
173.
4917
3.49
- 17
3.59
173.
59 -
173.
6917
3.69
- 17
3.79
173.
79 -
173.
8917
3.89
- 17
3.99
173.
99 -
174.
0917
4.09
- 17
4.14
174.
14 -
174.
2417
4.24
- 17
4.34
174.
34 -
174.
4417
4.44
- 17
4.54
174.
54 -
174.
6417
4.64
- 17
4.74
174.
74 -
174.
8417
4.84
- 17
4.94
174.
94 -
175.
0417
5.04
- 17
5.11
Brid
ge -
175.
24 -
175.
3417
5.34
- 17
5.44
Brid
ge -
175.
64 -
175.
7417
5.74
- 17
5.79
Mile Post
Northbound Lane 1 Percentage of Cracked Panels MP 169.78 to MP 175.79
Figure 3.5. Example Plot of Percentage of Cracked Panels

27
3.4.2 Distress Plots for Cracked Panels
The distress plots for cracked panels are three-dimensional bar charts
produced to illustrate the number of panels with 1, 2 to 3, or 4-plus cracks per
panel per 1/10-mile section. Figure 3.6 is an example of the set of plots that are
in Appendix L.
3.4.3 Distress Plots for Percentage of Panels with Two or More Cracks
The distress plots for percentage of panels with two or more cracks
express cracking in terms of panels with multiple cracks. This plot was developed
as a result of the prediction that panel serviceability dramatically decreases with
the presence of multiple panel cracks. The trigger values of 5 percent and 10
percent of the panels in a given section with multiple cracks are displayed. Figure
3.7 is an example of the distress plots for percentage of panels with two or more
cracks that are in Appendix M.
3.4.4 Distress Plots for Percentage of Cracked Panels and Average Faulting The distress plots for percentage of cracked panels and average faulting
were developed to display any relationship between panel cracking and faulting.
However, a review of this set of plots did not show any discernable relationship.
Figure 3.8 is an example of what can be found in Appendix N.

28
169.
78 -
169.
88
169.
88 -
169.
98
169.
98 -
170.
08
170.
08 -
170.
18
170.
18 -
170.
25Br
idge
-
172.
49 -
172.
59
172.
59 -
172.
69Br
idge
-
172.
89 -
172.
99
172.
99 -
173.
0917
3.09
- 17
3.19
173.
19 -
173.
2917
3.29
- 17
3.39
173.
39 -
173.
4917
3.49
- 17
3.59
173.
59 -
173.
6917
3.69
- 17
3.79
173.
79 -
173.
8917
3.89
- 17
3.99
173.
99 -
174.
0917
4.09
- 17
4.14
174.
14 -
174.
2417
4.24
- 17
4.34
174.
34 -
174.
4417
4.44
- 17
4.54
174.
54 -
174.
6417
4.64
- 17
4.74
174.
74 -
174.
8417
4.84
- 17
4.94
174.
94 -
175.
0417
5.04
- 17
5.11
Brid
ge -
175.
24 -
175.
3417
5.34
- 17
5.44
Brid
ge -
175.
64 -
175.
7417
5.74
- 17
5.79
02468
10121416182022242628303234
Num
ber o
f Cra
cked
Pan
els
Mile Post
Northbound Lane 1 Cracked Panels MP 169.88 to MP 175.79
# of Panels w/ 4+ Cracks# of Panels w/ 2-3 # of Panels w/ 1 CrackTotal # of Cracked Panels
Figure 3.6. Example Plot of Cracked Panels

05
101520253035404550556065707580859095
100
Perc
enta
ge o
f Pan
els
with
2 o
r Mor
e C
rack
s16
9.78
- 16
9.88
169.
88 -
169.
9816
9.98
- 17
0.08
170.
08 -
170.
1817
0.18
- 17
0.25
Brid
ge -
172.
49 -
172.
5917
2.59
- 17
2.69
Brid
ge -
172.
89 -
172.
9917
2.99
- 17
3.09
173.
09 -
173.
1917
3.19
- 17
3.29
173.
29 -
173.
3917
3.39
- 17
3.49
173.
49 -
173.
5917
3.59
- 17
3.69
173.
69 -
173.
7917
3.79
- 17
3.89
173.
89 -
173.
9917
3.99
- 17
4.09
174.
09 -
174.
1417
4.14
- 17
4.24
174.
24 -
174.
3417
4.34
- 17
4.44
174.
44 -
174.
5417
4.54
- 17
4.64
174.
64 -
174.
7417
4.74
- 17
4.84
174.
84 -
174.
9417
4.94
- 17
5.04
175.
04 -
175.
11Br
idge
-
175.
24 -
175.
3417
5.34
- 17
5.44
Brid
ge -
175.
64 -
175.
7417
5.74
- 17
5.79
Mile Post
Northbound Lane 1 Percentage of Panels with 2 or More Cracks MP 169.78 to MP 175.79
Figure 3.7. Example Plot of Percentage of Panels with Two or More Cracks
29

169.
78 -
169.
8816
9.88
- 16
9.98
169.
98 -
170.
0817
0.08
- 17
0.18
170.
18 -
170.
25Br
idge
-
172.
49 -
172.
5917
2.59
- 17
2.69
Brid
ge -
172.
89 -
172.
9917
2.99
- 17
3.09
173.
09 -
173.
1917
3.19
- 17
3.29
173.
29 -
173.
3917
3.39
- 17
3.49
173.
49 -
173.
5917
3.59
- 17
3.69
173.
69 -
173.
7917
3.79
- 17
3.89
173.
89 -
173.
9917
3.99
- 17
4.09
174.
09 -
174.
1417
4.14
- 17
4.24
174.
24 -
174.
3417
4.34
- 17
4.44
174.
44 -
174.
5417
4.54
- 17
4.64
174.
64 -
174.
7417
4.74
- 17
4.84
174.
84 -
174.
9417
4.94
- 17
5.04
175.
04 -
175.
11Br
idge
- 17
5.24
- 17
5.34
175.
34 -
175.
44Br
idge
- 17
5.64
- 17
5.74
175.
74 -
175.
79
0
10
20
30
40
50
60
70
80
90
100
Perc
enta
ge o
f Cra
cked
Pan
els
and
Ave
rage
Fa
ultin
g (1
/100
in)
Mile PostAverage FaultingPercentage of Cracked Panels
Figure 3.8. Example Plot of Percentage of Cracked Panels and Average Faulting
30

31
3.5 ARC GIS MAPPING OF I-5 PCCP DISTRESSES
The 2004 distress data summary and the distress plots are good tools for
evaluation purposes, but they do not meet the needs of the decision process for
the reconstruction and/or rehabilitation of I-5. Specifically, the data summary and
distress plots lack the ability to efficiently compare between lanes and directions
of traffic and do not provide the reference to roadways and exits that is
necessary for the effective communication of pavement condition.
Several options for filling these gaps were considered, including detailed
sectional mapping in Excel, a Flash application, and Arc GIS mapping. The use
of Excel would not have produced a product that would be user friendly and meet
the communication needs. A Flash application would have been ideal, but
unfortunately, it would be too time consuming to develop.
Alternatively, the use of Arc GIS was a reasonable choice for
communicating PCCP distress. The WSDOT Geographic Services Office
provided assistance in the development of the Arc GIS mapping of the
distresses. It provided the data that were used to create the images, including the
major roads, cities, water features, and more, for the base map into which the
distress data were imported.
3.5.1 Sectioning of I-5 in King County for the Arc GIS Images
I-5 in King County was broken into eleven sections that were used for the
Arc GIS images. The eleven sections are as follows:
Section 1 – King Pierce County Line to S. 320th
Section 2 – S. 320th to S.272nd St.
Section 3 – S. 272nd St. to S. 216th St.
Section 4 – S. 216th St. to I-405
Section 5 – I-405 to South Boeing Access Rd,
Section 6 – South Boeing Access Rd. to Michigan St.
Section 7 – Michigan St. to I-90
Section 8 – I-90 to Ship Canal Bridge
Section 9 – Ship Canal Bridge to Northgate Way

Section 10 – Northgate Way to N. 175th St.
Section 11 – N. 175th St. to St. 244th SW.
3.5.2 Arc GIS Pavement Distress Images
Each of the PCCP distresses from the 2004 distress data was imported
into the Arc GIS application. The distress data are displayed for each lane (1
through 4) in both the northbound and southbound directions. Each individual
1/10-mile section is displayed with the assigned color for the specific level of
distress. The levels of distress are the result of the trigger values that were
described previously. These levels of distress can be seen in Table 3.6. Figures
3.9, 3.10, 3.11, and 3.12 are examples of the Arc GIS images that are contained
in appendices O (IRI), P (faulting), Q (slab cracking), and R (wheel path wear).
Table 3.6. Levels of Distress and Associated Color in the Arc GIS Distress Images
IRI (in/mile) Wheel Path Wear Faulting Panel Cracking Color
0 - 170 0 - 0.40” 0 – ⅛” 0 – 5% Green 170 to 219 N/A ⅛” – ¼”. 5% - 10% Orange
220+ 0.40” + ¼”+ 10%+ Red
32

Figure 3.9. Example Image of IRI Values
33

Figure 3.10. Example Image of Wheel Path Wear
34

Figure 3.11. Example Image of Average Faulting
35

Figure 3.12. Example Image of Percentage of Panels with Two or More Cracks
36

3.5.3 General Pavement Condition
The 2004 distress data were summarized to develop a straightforward Arc
GIS application that would aid in communicating with a non-technical audience.
All lanes in each direction and distress types were reduced to a representation of
the overall pavement condition.
Only faulting and panel cracking were used to develop the general
pavement condition information. IRI was not considered as important as faulting
and slab cracking because IRI is essentially a summation of all the pavement
distresses (especially faulting). Wheel path wear was also eliminated because it
does not result in structural failure of PCC pavement.
Three methods were evaluated for their ability to determine general
pavement condition. These methods were (1) worst of the worst, (2) average of
dominating distress, and (3) average of distresses. Each method was based on
the assumption that particular levels of faulting and cracking result in equivalent
pavement distress. These levels of distress were defined by the trigger values.
As shown in Table 3.7, faulting of 0 to ⅛ in. was considered equivalent to 0 to 5
percent of panels with two or more cracks, and so on. Each of these levels of
distress was assigned a value of 1, 2, or 3, with 1 being the best condition and 3
being the worst.
Table 3.7. Equivalent Levels of Faulting and Cracking with Assigned Values, Colors, and
Pavement Condition
Faulting Cracking Assigned
Value Color Pavement Condition
0 – ⅛ n. 0 – 5% 1 green Good ⅛ in. – ¼ in. 5% - 10% 2 orange Poor
¼ in.+ 10%+ 3 red Extremely Poor
3.5.3.1 Worst of the Worst
Worst of the worst was based on the concept that all lanes of a roadway
are controlled by the condition of the single worst lane. The worst condition
37

observed for any lane for a 1/10-mile section was selected to represent the
pavement condition of that section of I-5.
By definition, this method depicted I-5 pavements in their worst-case
condition. Figure 3.13 is an example of the Arc GIS images for general pavement
conditions resulting from the worst of the worst method that are contained in
Appendix S.
3.5.3.2 Average Dominating Distress
With this method the dominating distress of each lane in each 1/10-mile
section was determined. The value of the dominating distress was then assigned
to represent the condition of that lane. The average of the values assigned to
each lane was taken to produce a representative value for the pavement
condition.
This method did not have any significant basis for decision-making but
was considered, calculated, and plotted. The associated Arc GIS plots are not
shown in this report.
3.5.3.3 Average of Distresses
For the average of distresses method, the distress values of all lanes were
averaged for each 1/10-mile section. Eight values were produced: one for
cracking and one for faulting for each of the four lanes.
This method was the most straightforward but did not have any significant
basis in decision making and, therefore, was not used and is not shown in this
report.
38

Figure 3.13. Example Image of General Pavement Condition
39

3.5.3.4 Updates to Arc GIS Images for General Pavement Conditions
The data used to develop the general pavement condition Arc GIS
application were collected in July 2004. Since then, the pavements of northbound
and southbound I-5 from the Pierce-King County line to Federal Way have been
rehabilitated (MP 139.5 to MP 144.74). Most of the construction consisted of
diamond grinding and dowel bar retrofitting. Therefore, the faulting that was
recorded in 2004 has most likely been reduced to below ⅛ in. In the Arc GIS
images for general pavement conditions, the faulting south of MP 144.74 was
assumed to be below ⅛ in.
While the grinding and dowel bar retrofitting would have reduced the
faulting, it would not have changed any of the existing cracking conditions. As a
result, any distress that was noted in the pavement condition south of Federal
Way would be panel cracking.
3.6 ARC GIS MAPPING OF REHABILITATION AND RECONSTRUCTION OPTIONS The 2004 distress data were subjected to various sets of trigger values
that are associated with certain rehabilitation options in an effort to identify how
sections of PCCP could be managed. This allowed for the quantification and
identification of non-rehabilitated PCCP that would require rehabilitation or
reconstruction.
3.6.1 Arc GIS Images Based on WSDOT’s Trigger Values for Pavement Distress-Based Rehabilitation WSDOT has established levels of cracking and faulting that are used to
determine how a pavement should be rehabilitated or reconstructed. These
levels of distress are reflected in the trigger values that were used throughout this
study.
Currently WSDOT utilizes three distinct rehabilitation options for improving
PCC pavements:
• diamond grinding
• dowel bar retrofit with diamond grinding
40

• reconstruction or panel replacement
• hot mix asphalt (HMA) overlay.
Pavements that exhibit less than ⅛ in. of faulting at transverse joints and
that have two or more cracks in less than 10 percent of the panels are usually not
considered for rehabilitation (Pierce, 2006). Once faulting exceeds ⅛ in., dowel
bar retrofitting with grinding is considered as a rehabilitation option. If the
percentage of panels with two or more cracks exceeds 10 percent of the panels
in a section, reconstruction or panel replacement is considered as a pavement
option (Pierce, 2006). Table 3.8 summarizes WSDOTs rehabilitation trigger
values.
Table 3.8. WSDOT Rehabilitation Trigger Values
Trigger Activity Faulting Cracking Wear
Nothing <⅛" <10% 0 - 0.39" Grinding - - 0.4"+ DBR + Grinding ⅛" - ½" <10% - Reconstruction >½" >10% 1"+
Along with faulting and cracking, wheel path wear is a pavement distress
that could trigger PCC pavement rehabilitation. If wheel path wear exceeds 0.4
in., grinding the pavement is a good rehabilitation option to reduce water ponding
. If wheel path wear is greater than an inch, it may be appropriate to replace the
PCC pavement (Pierce, 2006).
WSDOT’s distress triggers were used to decide on pavement
rehabilitation for each of the 1/10-mile sections of I-5. For each 1/10-mile
section, the distress that triggered the highest order of rehabilitation was used to
represent that section. Figure 3.14 is an example of the images, shown in
Appendix T, that were developed by using the WSDOT trigger values. Note that
actual rehabilitation project lengths will likely differ because of traffic control,
funding constraints, and so on.
41

Figure 3.14. Example Image of Pavement Distress-Based Rehabilitation
42

Table 3.9 breaks down the rehabilitation strategies in lane miles and
percentages of lanes for each direction of I-5 according to the WSDOT trigger
values. The result is about 26 lane miles of grinding, 47 lane miles of DBR and
grinding, and 14 miles of reconstruction.
Table 3.9. Triage Project Quantitative Rehabilitation Trigger Value Analysis
Direction and Lane Nothing Grind DBR+Grind Reconstruct Lane Miles
Lane 1 17.69 1.22 6.30 1.61 26.82 Lane 2 16.68 2.75 8.04 4.83 32.30 Lane 3 15.64 7.96 7.94 0.82 32.36 Lane 4 23.32 5.47 3.04 0.30 32.13
Northbound Lane Miles
Total 73.33 17.40 25.32 7.56 123.61Lane 1 65.96% 4.55% 23.49% 6.00% Lane 2 51.64% 8.51% 24.89% 14.95% Lane 3 48.33% 24.60% 24.54% 2.53% Lane 4 72.58% 17.02% 9.46% 0.93%
Northbound Percentage
of Lane Miles
Total 59.32% 14.08% 20.48% 6.12%
Lane 1 19.72 0.4 4.1 1.48 25.70 Lane 2 19.68 2.44 5.26 4.21 31.59 Lane 3 20.76 4.31 6.92 0.3 32.29 Lane 4 25.55 1.01 5.4 0.42 32.38
Southbound Lane Miles
Total 85.71 8.16 21.68 6.41 121.96Lane 1 76.73% 1.56% 15.95% 5.76% Lane 2 62.30% 7.72% 16.65% 13.33% Lane 3 64.29% 13.35% 21.43% 0.93% Lane 4 78.91% 3.12% 16.68% 1.30%
Southbound Percentage
of Lane Miles
Total 70.28% 6.69% 17.78% 5.26%
Lane 1 37.41 1.62 10.40 3.09 52.52 Lane 2 36.36 5.19 13.30 9.04 63.89 Lane 3 36.40 12.27 14.86 1.12 64.65 Lane 4 48.87 6.48 8.44 0.72 64.51
Total Lane Miles
Total 159.04 25.56 47.00 13.97 245.57Lane 1 71.23% 3.08% 19.80% 5.88% Lane 2 56.91% 8.12% 20.82% 14.15% Lane 3 56.30% 18.98% 22.99% 1.73% Lane 4 75.76% 10.04% 13.08% 1.12%
Total Percentage
of Lane Miles
Total 64.76% 10.41% 19.14% 5.69%
43

3.6.2 Pavement Distress-Based Rehabilitation Arc GIS Images Based on Modified Triggers for the I-5 Triage Project The I-5 Triage Project is a PCCP rehabilitation project that is planned for
design and bid in 2008 and construction during 2009. For the purposes of this
project the rehabilitation triggers were modified to accommodate the budget of
the project. Specifically, grinding was considered for pavements that exhibit
between ⅛ in. and ¼ in. of faulting, and DBR and grinding was considered for
pavements with faulting of between ¼ in. and ½ in. Pavements with faulting of
over ½ in. were considered for grinding only but would be some of the first
pavements addressed in the next round of rehabilitation and reconstruction.
Table 3.10 Modified Trigger Values for the I-5 Triage Project
Trigger Activity Faulting Cracking Wear
Nothing <⅛" <10% 0 - 0.39" Grinding ⅛"- ¼", >½" <10% 0.4"+
DBR + Grinding ¼" - ½" <10% - Reconstruction - >10% 1"+
Altering the faulting triggers shifted the lane miles of rehabilitation. The
lane miles of grinding increased from 26 to about 69, while lane miles of DBR
and grinding decreased from 47 to 4 miles. There was also a slight decrease in
the lane miles of reconstruction. Table 3.11 provides the number of lane miles
and percentage of roadway predicted to need rehabilitation on the basis of the
triage triggers. Appendix U contains these data for I-5 though King County from I-
90 to the Pierce County Line.
3.7 ARC GIS IMAGES FOR WET SURFACE CONDITION ACCIDENTS
The WSDOT wet condition accident data were imported into Arc GIS, and
images mapping the number of accidents per roadway section were produced.
Figure 3.15 is an example of the images that are in Appendix V.
44

Table 3.11 WSDOT Quantitative Rehabilitation Modified Triage Trigger Value Analysis
Direction and Lane Nothing Grind DBR+Grind Reconstruct Lane Miles
Lane 1 17.79 7.11 0.31 1.61 26.82
Lane 2 16.38 10.49 0.6 4.83 32.3
Lane 3 15.66 15.12 0.78 0.8 32.36
Lane 4 23.52 8.01 0.5 0.1 32.13
Northbound Lane Miles
Total 73.35 40.73 2.19 7.34 123.61
Lane 1 66.33% 26.51% 1.16% 6.00%
Lane 2 50.71% 32.48% 1.86% 14.95%
Lane 3 48.39% 46.72% 2.41% 2.47%
Lane 4 73.20% 24.93% 1.56% 0.31%
Northbound Percentage
of Lane Miles
Total 59.34% 32.95% 1.77% 5.94%
Lane 1 19.72 4.39 0.11 1.48 25.7
Lane 2 19.68 7.2 0.6 4.11 31.59
Lane 3 20.76 10.51 0.82 0.2 32.29
Lane 4 25.65 5.81 0.7 0.22 32.38
Southbound Lane Miles
Total 85.81 27.91 2.23 6.01 121.96
Lane 1 76.73% 17.08% 0.43% 5.76% Lane 2 62.30% 22.79% 1.90% 13.01% Lane 3 64.29% 32.55% 2.54% 0.62% Lane 4 79.22% 17.94% 2.16% 0.68%
Percentage of
Lane Miles Total 70.36% 22.88% 1.83% 4.93%
Lane 1 37.51 11.5 0.42 3.09 52.52 Lane 2 36.06 17.69 1.2 8.94 63.89 Lane 3 36.42 25.63 1.6 1 64.65 Lane 4 49.17 13.82 1.2 0.32 64.51
Total Lane Miles
Total 159.16 68.64 4.42 13.35 245.57 Lane 1 71.42% 21.90% 0.80% 5.88% Lane 2 56.44% 27.69% 1.88% 13.99% Lane 3 56.33% 39.64% 2.47% 1.55% Lane 4 76.22% 21.42% 1.86% 0.50%
Total Percentage
of Lane Miles
Total 64.81% 27.95% 1.80% 5.44%
45

Figure 3.15 Example Image of Wet Surface Condition Accidents
46

3.8 ACCIDENT DATA ANALYSES
A roadway that is wet has a decreased coefficient of friction between the
tire and pavement, sometimes resulting in friction conditions that can contribute
to accidents. This section describes an analysis of the accident data provided by
WSDOT, along with an exploration of diamond grinding and its possible
relationship to reducing wet condition accidents.
3.8.1 Summary of Accident Data Analysis
The original data obtained from WSDOT were modified for the purpose of
this study, which was concerned with accidents that were potentially related to
the pavement surface in wet conditions. Accidents in non-wet conditions and
those involving alcohol were removed, leaving a total of 4,485 accidents
accumulated over six years. These accidents involved 10,554 vehicles, yielding
an average of 2.35 vehicles per accident. Of the 4,485 accidents, 98 percent
occurred on a wet surface, and 2 percent occurred when there was standing
water on the roadway.
The majority of these accidents occurred during daylight or at night under
street lights (see Table 3.12). The remaining 13 percent of the wet surface
accidents occurred in low lighting conditions. Despite the potential contribution of
low light conditions, the number of these accidents was such a small percentage
that they were included in the analysis.
Table 3.12 I-5 Wet Surface Accidents Lighting Conditions
Conditions Percentage
Street Lights Off 0.69% Street Lights On 27.51%
Dawn 3.24% Daylight 64.31%
Dusk 3.83% Other 0.43%
Most of the vehicles in the wet condition accidents were passenger cars
and light pickups. In Table 3.13, Vehicle I is the following vehicle and Vehicle 2 is
47

the lead vehicle. In general, Vehicle 1 was usually at fault because of striking a
vehicle from behind. This scenario would generally result from Vehicle 1 being
unable to control its deceleration in the event that Vehicle 2 slowed or completely
stopped.
Table 3.13 I-5 Wet Surface Accidents Vehicle Type
Vehicle Type Vehicle 1 Vehicle 2
Bus or Motor Stage 0.32% 0.15% Motorcycle 0.35% 0.09% Not Stated 4.01% 3.19%
Passenger Car 57.79% 44.09% Pickup/Truck< 5 Ton 30.54% 47.48%
Truck Db. Trailer Combo 0.16% 0.20% Truck Trailer 1.08% 1.00%
Truck Van, flatbed, etc. 2.15% 1.33% Truck Tractor 0.30% 0.20%
Truck Tractor semi trailer 3.31% 2.28%
Most of the I-5 wet condition accidents involved two or more vehicles.
Table 3.14 shows that about 75 percent of wet condition accidents consisted of
two vehicles.
Table 3.14 Number of Vehicles per I-5 Wet Condition Accidents
Number of Vehicles % of Accidents
1 2.19% 2 75.45% 3 21.72% 4 0.36%
5+ 0.28%
According to the WSDOT data, the number of wet surface accidents
steadily decreased from 2001 to 2005. Factors that could have contributed to the
drop include decreases in traffic volume, number of days of rain, and
construction. Table 3.15 shows that annual average weekday traffic (AAWDT)
gradually deceased at MP 158 near Boeing Field for all lanes northbound and
48

southbound from 2001 to 2006. The decreases are small in AAWDT and the
changes are unlikely to affect the number of accidents on I-5..
Along with a decrease in AAWDT, a change in annual days of rain would
be expected to affect the annual number of wet surface accidents. Table 3.15
shows decreases in days of rain between 2001 and 2002, 2003 and 2004, and
2004 and 2005 that correlate with decreases in the annual number of wet surface
accidents. From 2005 to 2006 the large increase in accidents was mirrored by an
increase in days of rain; however, in 2003 there was a substantial increase in
days of rain but a gradual decrease in accidents.
Table 3.15 Wet Condition Accidents, Days of Rain, and AAWDT
Year 2001 2002 2003 2004 2005 2006
Accidents 768 758 736 704 693 826
% Change of Accidents N/A -1.30% -2.90% -4.35% -1.56% 19.19%
Days of Rain 138 119 141 135 131 138
% Change of Days of Rain N/A -13.77% 18.49% -4.26% -2.96% 5.34%
AAWDT 217,117 197,119 198,025 190,952 193,248 192,200
% Change of AADWT N/A -9.21% 0.46% -3.57% 1.20% -0.54%
In 2006 the increase in wet surface accidents may have been the result of
an increased number of rainy days, construction near Federal Way, and/or the
weather of November and December, which was marked by especially heavy
rains and snow.
The wet surface accidents occurred relatively uniformly over lane and
direction. The accidents were almost evenly divided between northbound, 48.8
percent, and southbound, 51.2 percent (refer to Table 3.16). The percentage of
accidents by lane was also well balanced. Lanes 1 and 2 had slightly more
accidents than lanes 3 and 4.
49

Table 3.16 Wet Surface Accidents by Direction and Lane
Direction Lane 1 Lane 2 Lane 3 Lane 4 Total Northbound 26.82% 26.95% 20.88% 25.35% 48.81% Southbound 24.61% 27.79% 22.69% 24.91% 51.19% Total 25.69% 27.38% 21.81% 25.13%
A comparison of the percentage of AAWDT by lane and direction from MP
158 near Boeing Field suggests that other factors contributed to the distribution
of accidents by direction and lane. Table 3.17 shows an even division of AAWDT
between northbound and southbound directions, along with a steady increase in
AAWDT from lanes 1 to 4.
Table 3.17 Percentage of AAWDT at Boeing Field
Direction Lane1 Lane 2 Lane 3 Lane 4 Total
Northbound 22.79% 23.12% 25.58% 28.51% 49.96% Southbound 22.86% 23.11% 25.54% 28.49% 50.04% Total 22.82% 23.12% 25.56% 28.50%
3.8.2 Wet Surface Accidents and Diamond Ground PCCP
Three sections of diamond grinding exist in the southbound lanes and not
in the adjacent northbound lanes, creating the opportunity to compare wet
surface accidents on diamond ground PCCP to those on non-rehabilitated
PCCP. Tables 3.18, 3.19, and 3.20 provide a comparison of the wet surface
accidents in the northbound (not ground) and southbound (ground surface)
lanes.
It is recognized that numerous variables contribute to wet surface
accidents. As discussed in the accident data analysis, traffic volumes and annual
days of rain can affect accidents, as can alignment, grade, traffic patterns, and
on/off ramp configuration; however, it is fair to compare sections of Interstate with
similar design and traffic characteristics.
The three sections of diamond grinding in the southbound lanes extended
from mileposts 144.45 to146.18, mileposts 147.67 to149.69, and mileposts
50

158.47 to 161.50. The two southern sections of diamond grinding were
constructed in 2001 in association with dowel bar retrofitting in lanes 1 and 2,
while the northern section was constructed in 1999. Each of these sections of
diamond grinding included all lanes.
Table 3.18 Diamond Ground PCCP and Wet Surface Accidents (MP 144.45 to 146.18 and MP 147.47 to 149.18)
2001 2002 2003 2004 2005 2006 Total 02-06 Accidents/Mile 02-06
% Change in Accidents/MileLane
Southbound Diamond Ground MP 144.45 to MP 146.18 Lane 1 1 3 0 4 5 3 15 8.67 66.67% Lane 2 1 5 5 2 1 2 15 8.67 15.38% Lane 3 0 2 0 0 0 6 8 4.62 0.00% Lane 4 0 1 1 1 2 1 6 3.47 -50.00% Total 2 11 6 7 8 12 44 6.36 4.76% Southbound Diamond Ground MP 147.67 to MP 149.69 Lane 1 5 5 1 2 3 0 11 5.00 -45.00% Lane 2 7 3 1 1 1 3 9 4.09 0.00% Lane 3 3 2 2 0 0 2 6 2.73 -60.00% Lane 4 8 5 2 3 2 2 14 6.36 -48.15% Total 23 15 6 6 6 7 40 4.55 -43.66% Northbound MP 144.45 to MP 146.18 Lane 1 3 2 1 3 1 2 9 5.20 Lane 2 3 2 1 3 3 4 13 7.51 Lane 3 2 2 3 0 0 3 8 4.62 Lane 4 0 2 2 5 2 1 12 6.94 Total 8 8 7 11 6 10 42 6.07 Northbound MP 147.47 - MP 149.69 Lane 1 4 4 3 4 4 5 20 9.09 Lane 2 3 0 2 0 4 3 9 4.09 Lane 3 1 8 1 2 2 2 15 6.82 Lane 4 6 12 5 5 4 1 27 12.27 Total 14 24 11 11 14 11 71 8.07
For each of these sections the number of wet surface accidents was
counted in each lane and direction for each year from 2001 to 2006 (refer to
tables 3.18, 3.19, and 3.20).
51

Table 3.19. Diamond Ground PCCP and Reduction of Wet Surface Accidents (MP 158.47 to 161.50)
2001 2002 2003 2004 2005 2006 Total 01-06 Accidents/Mile 01-06
% Change in Accidents/MileLane
Southbound Diamond Ground MP 158.47 to MP 161.50 Lane 1 1 0 2 0 0 2 5 1.65 -75.00% Lane 2 1 2 3 1 0 4 11 3.63 -15.38% Lane 3 1 2 2 1 2 2 10 3.30 -64.29% Lane 4 0 2 2 3 4 1 12 3.96 -77.78% Total 3 6 9 5 6 9 38 3.14 -66.96% Northbound MP 158.47 to MP 161.50 Lane 1 2 3 5 3 3 4 20 6.60 Lane 2 1 0 2 6 3 1 13 4.29 Lane 3 3 1 5 10 5 4 28 9.24 Lane 4 6 8 8 13 8 11 54 17.82 Total 12 12 20 32 19 20 115 9.49
Table 3.20. All Diamond Ground PCCP and Wet Surface Accidents
2001 2002 2003 2004 2005 2006 Total Accidents/Mile % Change in Accidents/MileLane
Southbound Diamond Ground Lane 1 7 8 3 6 8 5 31 4.57 -36.73% Lane 2 9 10 9 4 2 9 35 5.16 0.00% Lane 3 4 6 4 1 2 10 24 3.54 -52.94% Lane 4 8 8 5 7 8 4 32 4.72 -65.59% Total 28 32 21 18 20 28 122 4.53 -46.49% Northbound Lane 1 9 9 9 10 8 11 49 7.23 Lane 2 7 2 5 9 10 8 35 5.16 Lane 3 6 11 9 12 7 9 51 7.52 Lane 4 12 22 15 23 14 13 93 13.72 Total 34 44 38 54 39 41 228 8.46
The southern diamond ground section of PCCP from MP 144.45 to MP
146.18 had slightly more wet surface accidents than the adjacent northbound
section. Wet surface accidents in lanes 1 and 2 in the southbound section
increased by 67 percent and 15 percent, respectively; those in Lane 3 remained
unchanged; and those in Lane 4 decreased by 50 percent. Overall, this section
showed a 5 percent increase in wet surface accidents (refer to Table 3.18).
52

The two sections from mileposts 147.67 to 149.69 and mileposts 158.47 to
161.18 experienced fewer accidents per mile than the non-rehabilitated PCCP in
the northbound lanes. Table 3.18 shows that from MP 147.47 to 149.69 the
southbound directions had, on average, 4.55 accidents per mile, whereas the
northbound lanes had 8.07 accidents per mile. This indicates that the
southbound diamond ground lanes had 44 percent fewer wet surface accidents
for this portion of I-5 (refer to tables 3.18 and 3.19).
The section of diamond grinding from mileposts 158.47 to 161.50, near
Boeing Field, exhibited the largest difference between northbound and
southbound accidents per mile. The northbound non-rehabilitated PCCP
experienced 9.49 accidents per mile, whereas the diamond ground southbound
sections had 3.14 accidents per mile; thus there were 67 percent fewer accidents
per mile on the diamond ground PCCP.
Overall, the three sections of diamond grinding experienced fewer wet
condition accidents than the adjacent northbound non-rehabilitated PCCP. As
seen in Table 3.20 there were 46 percent fewer wet surface accidents on the
diamond ground PCCP.
While it appears that diamond grinding might have resulted in fewer wet
surface accidents, it is not possible to prove this relationship. As previously
discussed, numerous factors contribute to vehicle accidents on any Interstate
highway. This study tried to reduce the effects of multiple factors by comparing
similar adjacent sections of I-5. Such data suggest that benefit is gained from a
recently ground PCC surface.
3.9 I-5 FIELD STUDY ANALYSIS
The I-5 field study provided a unique opportunity to collect information on
the condition of I-5 in King County. This section is used to present an analysis of
the data collected during the 2007 field study along with a comparison to the data
gathered in 1986. The location was MP 175 NB. The slab ages were 43 years old
at the time of testing on July 28-29, 2007. The weather at the time of testing was
mild with an air temperature of 67°F.
53

3.9.1 Field Study Cracking Survey
The 2007 I-5 field study cracking survey revealed that 19 of the 24 slabs
observed had at least one crack (79 percent), for a total of 24 longitudinal cracks
(no transverse). Panels in Lane 1 exhibited twice as many cracks (16) as in
Lane 2 (8). In Lane 1 two panels had multiple cracks, while in Lane 2 only one
panel had multiple cracks.
Of the 13 newly observed cracks in the 2007 survey, 10 did not extend the
full length of the panel (77 percent). These new cracks had developed at the
transverse joint adjacent to existing longitudinal cracking in the neighboring slab.
The longitudinal cracking location within the lane was strongly related to
the lane number. All of the longitudinal cracking in Lane 1 occurred in the inside
half of the lane, whereas in Lane 2 all the longitudinal cracking was observed in
the outside half of the lane. Detailed crack locations can be seen in Appendix B.
When the 2007 field study cracking survey data were compared to the
1986 cracking data, a large increase in cracking became evident. In 1986, 11 of
the 24 slabs exhibited one crack. After 21 years, eight more panels had
developed cracks, and three exhibited multiple cracks. In total, there were 13
more cracks, from 11 to 24, an increase of about 120 percent. Lane 1 increased
from seven to 16 cracks, while Lane 2 doubled from four to eight cracks (refer to
Table 3.21).
If it is assumed that the increase in cracking over the past 21 years (time
since the first slab survey) is linear, then the average increase is about 6 percent
per year. This suggests, at a minimum, that over the next 5 years the increase in
cracking will be at least 30 percent and for the next 10 years at least 60 percent.
This will result in more slabs with multiple cracks and the need for complete slab
removal.
As noted in Chapter 2, the 2007 cracking survey was cut short because of
safety concerns during the data collection process, and slabs 26, 27, and 28
were not completely surveyed. The field team noted that more cracks had
developed since 1986, but the location and extent of those cracks were not fully
documented.
54

Table 3.21. 1986 and 2007 Cracking Survey Number of Cracked Slabs
1986 2007 Slab Lane 1 Lane 2 Total Lane 1 Lane 2 Total
Increased # of Cracks
1 0 0 0 3 0 3 3 2 1 0 1 1 0 1 0 3 1 0 1 1 1 2 1 4 0 0 0 3 1 4 4
18 0 0 0 1 2 3 3 19 1 0 1 1 0 1 0 20 1 0 1 1 0 1 0 21 0 0 0 1 0 1 1
25 1 1 2 1 1 2 0 26 1 1 2 1 1 2 0 27 1 1 2 1 1 2 0 28 0 1 1 1 1 2 1
Total 7 4 11 16 8 24 13
3.9.2 Field Study Spalling Survey
The spalling surveys were conducted so that a comparison of the 1986
and 2007 results could be directly compared.
In the 2007 survey, spalling was identified on cracks that had existed in
the 1986 survey and on new cracks. In 1986, the cracks had an average spalling
width of 2.0 in. and depth of 1.9 in. In 2007 the same cracks exhibited an
average width of 2.7 in. and a depth of 1.9 in., increasing 36 percent in width see
Table 3.22).
Table 3.22. Spalling in 1986 and 2007
1986 2007 % Increase New Spalls
Average Spall Width (in) 2.0 2.7 36% 1.53 Average Spall Depth (in) 1.9 1.9 0% 1.25
55

The new cracks had an average width of 1.5 in. and depth of 1.2 in. All of
the locations and measurements of spalling from the 1986 and 2007 I-5 field
studies are shown in Appendix B.
3.9.3 Field Study Faulting Survey
The 2007 field study faulting survey revealed an increase in faulting since
1986 (Table 3.23). In 1986 the average faulting in the test section was 0.085 in.
This had increased to 0.122 in. in 2007, or 44 percent.
The largest increase in faulting was noted in the wheel paths of Lane 1.
The outside wheel path increased from 0.050 in. in 1986 to 0.136 in. in 2007, and
the inside wheel path increased from 0.050 in. to 0.135 in. The faulting increase
at the wheel path was surprising, given that this was where studded tire wear is
greatest and might reduce the faulting displacement between the lead and leave
slab. This might have been the result of slab curling, but this is uncertain.
Table 3.23. 1986 and 2007 Average Faulting and Locations
Average (in)
1986 2007 Increase (in) % Increase
Middle of Lane - 0.140 - -
Outside Wheel Path - 0.119 - -
Lane
1
Outside Panel Edge 0.091 0.118 0.027 29.24%
Inside Panel Edge 0.094 0.114 0.020 21.21%
Inside Wheel Path 0.050 0.136 0.086 172.73%
Middle of Panel 0.063 0.125 0.063 100.00%
Outside Wheel Path 0.050 0.135 0.085 170.83%
Lane
2
Outside Panel Edge 0.104 0.094 -0.010 -10.00%
Total 0.085 0.122 0.037 44%
The outside edge of the panels exhibited the least faulting and smallest
increase since 1986. The inside edge of Lane 1 averaged 0.118 in. of faulting in
2007, an increase of 0.027 in. (21 percent) since 1986, whereas the outside edge
56

of Lane 1 showed a 10 percent decrease in faulting from 1986 to 2007. In over
21 years the faulting on the outside panel edge decreased 0.010 in.
If it is again assumed that the increase in faulting over the past 21 years is
linear, then the average increase is about 2 percent per year. This suggests, at a
minimum, that over the next 5 years the increase in faulting will be at least 10
percent. The average faulting will then exceed the lower threshold of
acceptability (0.125 in.). Unfortunately, there is little reason to expect a linear
increase for future years given the high levels of distress observed for these
slabs. A much more likely scenario is an acceleration of faulting severity.
3.9.4 Field Study Coring
A total of 12 cores were taken for further analysis. Most of the cores that
were collected at the transverse joint broke vertically at the joint and occasionally
split horizontally in the lower few inches of the core. Compressive strengths were
determined for four intact cores at the Materials Laboratory at the University of
Washington in accordance with ASTM C42. The average compressive strength
was 11,875 psi. In 1986 the average for a set of cores taken at the same location
was 11,406 psi. Specific test results are shown in Table 3.24. Only Core Nos. 2
taken in both 1986 and 2007 were adjacent to each other. Those results suggest
a slight increase in PCC compressive strength over the 21 year span.
Table 3.24. 1986 and 2007 PCC Cores Compressive Strengths
Compressive Strength (psi) 1986 Core No. 2007 Core No. 1986 2007
2 2 11,141 12,700 9 4 11,495 10,900
25 6 11,491 11,100 39 11 11,495 12,800
Means 11,406 11,875 Standard Deviation 176 1,014
The differences in compressive strengths spanning the 21 year period are
insignificant. The fact that the standard deviation is higher in 2007 is of limited
57

interest. This could be due to sampling or testing variability. The 1986 results
appear to have an unusually low standard deviation.
The images in the Appendix B can be used to find the core locations.
3.9.5 Nondestructive Deflection Testing
The nondestructive deflection tests obtained with the WSDOT FWD were
used to evaluate load transfer efficiency at joints and cracks. When a wheel load
is applied at a joint or crack, both the loaded slab and the adjacent unloaded slab
deflect. The amount the unloaded slab deflects is directly related to joint
performance. If the joint is performing perfectly, both the loaded and unloaded
slabs deflect equally. The amount the pavement deflects is important because
when deflection occurs, tensile stresses are induced in the slab. The magnitude
of these tensile stresses has a direct impact on pavement performance, i.e., the
lower the stress, the longer the fatigue life (Mindess and Young, 1981).
Joint performance can be evaluated by using the FWD deflection data to
calculate load transfer efficiency (LTE) across a joint or crack. LTE can be
calculated by using the following equation:
LTE = (Δu/Δl)(100)
where
LTE = load transfer efficiency, percent
Δu = deflection of the unload slab, mils
Δl = deflection of the loaded slab, mils
Joint efficiency depends on several factors, including temperature (which
affects joint opening), number and magnitude of load applications, foundation
support, aggregate particle angularity, and the presence of mechanical load
transfer devices (Darter, 1977). No mechanical load transfer devices (such as
dowel bars) were installed in the originally constructed I-5 pavements, so load
transfer is provided solely by aggregate interlock across the joint or crack.
As noted, temperature plays a major role in determining joint
effectiveness. In general, the lower the temperature, the lower the load transfer
efficiency. This results from the increased opening of the joints during cooler
58

weather, which reduces the contact between the slab faces (Foxworthy, 1985).
Joint load transfer efficiency has also been shown, in both laboratory and field
studies, to decrease with increasing load applications (Colley et al., 1967, and
Stelzenmulter et al., 1973).
Deflections were measured across the transverse joint, with the load
applied on both the approach and leave slabs and across three longitudinal
cracks. The 2007 testing was conducted between about midnight and 4:00 am,
when the air temperature was approximately 67°F (the 1986 testing was done
between the same hours but at a slightly lower air temperature of 60°F). Refer to
Appendix B for specific locations. Specific load transfer results are shown in
Table 3.25.
Table 3.25. 1986 and 2007 Load Transfer Efficiencies in the Outer Lane, I-5, MP 175
LTE (%) Deflection Testing Location Slab
Location 1986 2007 Approach 91 86 Edge of Slab (Row 1)
Leave 91 91 Approach 93 88 Outer Wheelpath (Row 2)
Leave 91 95 Approach -- 85 Between Wheelpaths (Row 3)
Leave -- 93 Left -- 77 New Longitudinal Crack (Slab 18—
formed since 1986 survey) Right -- 51 Left -- 48 Existing Longitudinal Crack (Slab
25—preexisting during 1986 survey) Right 63 26 Left -- 71 Existing Longitudinal Crack (Slab
26—preexisting during 1986 survey) Right -- 60
These limited results show that the load transfer at the transverse joints
decreased slightly from 1986 to 2007 at this location. The load transfer across
the longitudinal cracks is much lower than the transverse joints. The LTEs of the
cracks appear to have decreased significantly (but the comparisons between
1986 and 2007 are quite limited).
59

The question is, what are acceptable (or conversely, unacceptable) LTEs?
• The Asphalt Institute MS-17 notes three levels of LTE ranges: (1)
greater than 75 percent is adequate, (2) 60 to 75 percent is fair,
and (3) less 60 percent is poor. Furthermore, it notes that for “thin”
HMA overlays to perform successfully on PCCP, the LTE of an
existing PCC pavement should be 80 percent or higher.
• The first dowel bar retrofit project in Washington State was on I-90
near Cle Elum. The slab thicknesses and base are similar to those
on I-5 in King County. The initial LTE was about 30 percent before
DBR. Following DBR, the LTEs ranged from 80 to 90 percent for a
span of about 8 years. Following this, the LTEs decreased and
faulting increased.
The bottom line on LTEs at MP 175 is that the LTEs show a limited need
for DBR at this time and that additional trafficking can be accommodated
before major faulting increases. This test section represents only a small
portion of I-5. A larger deflection survey will likely produce different results
and conclusions.
60

CHAPTER 4 PORTLAND CEMENT CONCRETE REHABILITATION
OPTIONS FOR I-5
Several approaches can be used to rehabilitate PCCP. This chapter
covers rehabilitation options and their relevance to I-5. WSDOT has used mostly
diamond grinding, dowel bar retrofitting (DBR), and panel replacement on I-5
within King County thus far. Some portions of I-5 outside of King County have
received HMA overlays.
4.1 DIAMOND GRINDING
Grinding is an effective option for improving the smoothness of the
existing PCCP. While it does not address panel cracking or the causes of
faulting, the result is a smoother pavement. Depending on the depth of grind,
faulting can be reduced, which reduces dynamic loading from heavy traffic and
reduces the progression of cracks (Mahoney, 2006). Diamond grinding also
reduces the thickness of the slab, decreasing the structural capacity and life of
the panels.
4.1.1 The Process of Diamond Grinding
Diamond grinding is accomplished with gang-mounted, diamond-tipped
blades to remove up to ¾ in. (Pavement Interactive, 2007). Typically, the depth
of the grind is determined by the vertical displacement of the faulting at the
transverse joint (Pierce, 2006). Because wheel path wear is often deeper than
the vertical displacement of faulting, not all wheel path wear may be removed.
When a PCCP is diamond ground, the roadway’s drainage must be
managed. To avoid altering the drainage design, it is preferred that all lanes be
diamond ground.
4.1.2 When Should a PCCP Be Diamond Ground?
Diamond grinding is often considered for a section of PCCP on the basis
of surface roughness. Poor surface roughness can often be a result of faulting,
wheel path wear, or panel curling (Pavement Interactive, 2007). As discussed
61

earlier in this report, diamond grinding is generally considered when faulting
exceeds ⅛ in. or when wheel path wear is in excess of 0.4 in.
4.1.3 Diamond Grinding Issues and Benefits Specific to I-5
Currently, diamond grinding is WSDOT’s least expensive rehabilitation
option for existing PCCP. In 2006 WSDOT spent about $100,000 per lane mile
(Pierce, 2006). With that cost per lane mile, diamond grinding is an effective
method for extending the life of a PCCP. Diamond grinding has been estimated
to extend the life of I-5 PCCP by five to ten years (Pierce, 2007).
4.2 DOWEL BAR RETROFITTING
DBR has been actively used by WSDOT as a PCCP rehabilitation option
for about 15 years. Since 1993 WSDOT has dowel bar retrofit over 300 lane
miles of PCCP, and it is predicting a need to dowel bar retrofit another 600 lane
miles in the next 20 years (WSDOT, 2007).
Unlike diamonding grinding alone, DBR addresses the issues that cause
faulting. DBR improves the panel’s ability to transfer loads from slab to slab, thus
reducing panel movements that result in faulting.
4.2.1 The Process of Dowel Bar Retrofitting
Typically, three or four bars are placed in the wheel paths at the
transverse joints (although WSDOT has almost exclusively used three bars per
wheel path). The entire process can be summarized in four steps:
62

Step 1: Cut and jack hammer the slots for the dowel bars (Figure 4.1).
Figure 4.1. Dowel Bar Slots (Image Courtesy Pavement Interactive)
Step 2: Place the of dowel bars (Figure 4.2).
Figure 4.2. Placement of Dowel Bars (Image Courtesy Pavement Interactive)
63

Step 3: Grout the dowel bars in slots (Figure 4.3).
Figure 4.3. Placing Grout in Dowel Bar Slots (Image Courtesy Pavement Interactive)
Step 4: Diamond grind the entire pavement surface (Figure 4.4).
Figure 4.4. Dowel Bar Retrofit PCCP After Diamond Grinding
(Image Courtesy Pavement Interactive)
4.2.2 When Should a PCCP Be Dowel Bar Retrofit?
Dowel bar retrofitting is often needed when the aggregate interlock at the
transverse joint is marginal (WSDOT, 2007). If faulting has exceeded ½ in., the
64

aggregate interlock is usually quite low, suggesting that a dowel bar retrofit is
necessary to keep faulting from returning after grinding (Pierce, 2007).
WSDOT trigger values for dowel bar retrofit can be seen in Table 3.7.
Typically, at faulting of ⅛ in. or ¼ in., dowel bar retrofitting is considered a
rehabilitation option.
4.2.3 Dowel Bar Retrofit Issues and Benefits Specific to I-5
In comparison to diamond grinding alone, dowel bar retrofitting is more
expensive per lane mile. In 2006, dowel bar retrofitting cost WSDOT about
$450,000 per lane (WSDOT, 2007). Currently, it is estimated that WSDOT’s DBR
PCCP will have an extended serviceability of about 10 years (WSDOT, 2007) but
that estimate assumes very limited slab cracking.
Because of WSDOT’s extensive use of dowel bar retrofitting, lessons have
been learned. Extensive cracking has developed at the DBR slots at some
Washington projects (Pierce, 2006). This could be the result of the slots being cut
too deeply and/or the jack hammer punching through the slab. Therefore, it is
very important that the contractor saw the slots to the appropriate depth and that
a jack hammer of appropriate weight be used.
It is also important that the dowel bars are placed perpendicular to the
transverse joint. Dowel bars that are placed at a slight skew can cause the joint
to lock up (WSDOT, 2007).
4.3 RECONSTRUCTION AND PANEL REPLACEMENT
Much of I-5 is in need of replacement or rehabilitation. Reconstruction is
the most expensive, while selective panel replacement can reduce costs and
extend the life of the pavement (Muench, 2007).
4.3.1 The Process of Panel Replacement
After panels have been identified for replacement, the damaged panels
are removed. There are two main methods of demolition, impact and non-impact
(Muench, 2007). Non-impact demolitions consist of cutting the existing slabs into
manageable chunks. Impact removal utilizes full-depth relief cuts 12 to 18 inches
65

from the panel’s longitudinal and transverse joints. The relief cuts reduce
damage to adjacent panels when either hoe-rams, hammers, or a guillotine
breaker are used to break the PCCP for removal (Muench, 2007).
Once demolition has been completed, dowel and tie bars must be placed
in the adjacent slabs. Placement of tie and dowel bars requires drilling and
inserting the bars into the slabs before the concrete is placed. This is followed by
a bond breaker that is applied to the base material and adjacent panels (Muench,
2007). Typically, a fast setting concrete is used, depending on how quickly the
road must be opened. After the concrete has cured, spot grinding is necessary to
smooth the joints of the new slab (Pierce, 2006).
4.3.2 When Should a PCCP Have Panel Replacement or Be Replaced?
Reconstruction and panel replacement are often considered when
cracking is so extensive that the panel is unable to effectively support traffic
loads. Once a panel has developed more than two cracks, the panel’s ability to
transfer load is reduced, and reconstruction or panel replacement should be
considered (Jackson, 2006).
The decision to either reconstruct or replace a panel depends on the
number of panels in a section that warrant replacement. It is typically
economically viable to replace panels when less than 5 percent of the panels in a
given section require replacement (Muench, 2007). If more than 5 percent of a
given section needs replacement, then the section should be considered for
reconstruction or some type of major rehabilitation.
4.3.3 Reconstruction and Panel Replacement Issues and Benefits Specific to I-5 WSDOT has been utilizing panel replacement on I-5 typically to replace
panels that have been extensively damaged as a result of poor base and sub-
grade conditions (Pierce, 2006).
Recent experience suggests that it costs WSDOT about $20,000 per
panel in a rehabilitation project that uses rapid concrete construction methods
(Muench, 2007). If 5 percent of the panels in a lane mile were replaced, the cost
66

would be about $350,000 per lane mile, in comparison to about $850,000 to $1.2
million per lane mile for complete reconstruction (Muench, 2007). Replacing 5
percent of the panels in a given section extends serviceability by about 10 years
(Muench, 2007).
4.4 HMA OVERAYS
Another possibility that WSDOT should consider for major rehabilitation of
I-5 is HMA overlays. HMA has been used to overlay much of the original PCC
from about MP 1 to MP 109 on I-5 (Vancouver to Olympia). It is of value to
examine how these overlays performed.
The originally constructed PCC for I-5 from about MP 1 to MP 109 was
built from about 1955 to the 1980s and is mostly 9.0-in.-thick PCC, non-doweled
joint concrete pavement (at some locations thicknesses of 8 in. were used).
Starting in the 1970s and into the early 1990s, these PCC pavements were
overlaid with HMA along portions of this corridor. These HMA overlays ranged in
thickness from about 1.8 to 4.8 in. and included, at some locations, interlayer
treatments (either fabric or asphalt-rubber). Through this corridor the ADT varies
widely, but it is typical for about 4,000 trucks to pass per day in each direction.
This certainly constitutes heavy traffic. Table 4.1 illustrates the performance of
these overlays subdivided by interlayer treatment.
The data in Table 4.1 illustrate that a wide range of performance can be
expected for HMA overlays over PCC, but, on average, a life of 10 to 15 years is
reasonable. Furthermore, most of the initial overlays placed on the PCC have
now received a subsequent overlay (or overlays). The data also show the miles
and percentages associated with how the overlays reached an unacceptable
condition. Almost 60 percent of the HMA overlays reached a rutting threshold
first. The remainder reached pavement structural condition (PSC) thresholds that
are largely due to various types of cracking. Rutting of HMA over PCC is a mix
issue (not thickness), and this has been improved during the 1990s until today
through new a mix design system and enhanced specifications and construction
techniques.
67

Table 4.1 Performance of HMA Overlays on I-5 over PCC
Treatment Overlay
Thickness (ft)
Average Age
(years) Total Miles
Rutting (miles)
PSC (miles)
Rutting (%)
PSC (%)
All 14.40 29.19 14.34 14.85 49 51 0.30 14.25 11.62 8.19 3.43 70 30 0.35 15.12 9.21 4.86 4.35 53 47 Fabric
0.40 13.80 8.36 1.29 7.07 15 85 All 10.31 7.44 7.44 0.00 100 0
0.15 14.00 0.11 0.11 0.00 100 0 0.30 14.00 1.53 1.53 0.00 100 0 0.35 7.41 2.64 2.64 0.00 100 0
Asphalt-rubber
0.40 10.82 3.16 0.14 3.02 4 96 All 15.25 17.25 17.25 0.00 100 0
0.15 19.00 0.34 0.00 0.34 0 100 0.30 15.81 15.06 11.36 3.70 75 25 0.35 10.00 0.86 0.86 0.00 100 0
HMA only
0.40 10.00 0.99 0.00 0.99 0 100 Totals 53.88 30.98 22.90 57 43
Data contained in tables 4.2 and 4.3 further illustrate typical HMA overlay
performance for WSDOT Interstate highways. Table 4.2 shows that overlay
performance improves somewhat with each overlay addition. This should not be
a surprise. What is interesting is that the overlay performance does not get worse
with each application.
Table 4.3 shows that a wide range of overlay thicknesses perform about
the same. These data are only for the first overlay placed on a PCC surface.
However, the selection of an overlay thickness is influenced by the condition of
the underlying PCC. As such, it is incorrect to assume that overlay thickness
does not matter.
68

Table 4.2 Performance of HMA Overlays on PCC for All WSDOT Interstates
Overlay Sequence Average
Age (years)
Total Miles
All HMA Overlays 12.6 172.2
1st Overlay over PCC 12.4 107.8
2nd Overlay over PCC 12.8 54.2
3rd Overlay over PCC 13.2 10.2
Table 4.3 Performance of First HMA Overlay Placed on PCC for All WSDOT Interstates
HMA Overlay Thickness
(ft)
Average Age
(years)
Number of Sections
< 0.15 13.0 8
0.15 to 0.20 11.0 36
0.21 to 0.30 14.0 35
0.31 to 0.40 13.0 114
> 0.40 13.0 10
I-5 between approximately MP 102 and 109 is a good illustration of an
HMA overlay over PCC. This portion of I-5 is from Tumwater through Olympia.
Following an attempt by WSDOT to ensure that zero or only limited voids existed
under the preexisting PCC via grout injection, a 4.3-in.-thick HMA overlay was
placed. This construction was done from about 1991 to 1993. Subsequently, an
open graded wearing course was removed and replaced with a dense graded
69

HMA during 2000 to 2001. The general performance of this portion of I-5 has
been quite good.
What are some of the issues associated with placing HMA overlays on
portions of I-5 in King County?
• Depending on the HMA overlay thickness, clearances must be
checked.
• All lanes and shoulders must be overlaid—there is no possibility that
isolated lanes can receive HMA and others not for a given segment of
I-5.
• What is the best pretreatment for the existing PCC slabs? Virtually all
of the previous HMA overlays placed on I-5 PCC have been
constructed with limited slab treatments (such as pressure grouting to
fill any voids under the slabs).
o Some states such as California do a PCC slab pretreatment
called “crack and seat” before placing the HMA overlay.
However, all of the PCC in California has been placed on
cement-treated bases (CTB), which have been susceptible to
pumping (erosion of the CTB material). This makes the use of
crack and seat quite logical for California. This type of base
(CTB) has been used on a very limited basis for WSDOT I-5
PCCP. The crack and seat pretreatment also reduces the
potential for temperature movement in the slab, thus reducing
the rate of reflection cracking. Given the high PCC strength of
these slabs, lack of use of CTB in King County, and generally
good transverse joint LTEs, it is unlikely that this type of
pretreatment needs to be applied to I-5. However, a more
extensive FWD survey would either confirm or alter this view.
o A visit by project staff (Joe Mahoney and Linda Pierce) during
November 2007 to California revealed that the Caltrans crack
and seat HMA overlays have performed well over a span of
70

about 25 years. Those original overlays are typically 4 to 6 in.
thick.
o Some states rubbilize the existing PCC, thus creating a high
stiffness base course. This results in a much thicker HMA
overlay than WSDOT has typically used. Rubbilization creates a
less stiff base for the HMA (in comparison to leaving the existing
PCC slabs in place), thus requiring a thicker overlay.
Furthermore, the current condition of I-5 in King County does
not, at this time, require such a drastic pretreatment.
Bridge clearances were checked to see what kind of restrictions would
need to be applied in relation to HMA overlay thickness. The data for this
assessment are contained in Appendix W. RCW 46.44.020 notes that the
maximum height of trucks in Washington State is 14 ft. WSDOT, of course,
has set bridge clearances higher. The major constraint with respect to
clearances in King County along I-5 is a 3.5-mile portion (about 10 percent of
the centerline mileage in King County) from downtown Seattle to just north of
the Ship Canal Bridge (MP 166.16 to 169.67). The lowest clearance through
this corridor is 14.75 ft. at NE 50th Street. The northbound lanes have lower
clearances than the southbound lanes. Appendix W contains these
clearances along with the reduced clearances associated with 4- and 5-in.-
thick HMA overlays.
71

CHAPTER 5 CONCLUSIONS AND RECOMMENDATIONS
This chapter covers the conclusions and recommendations that have
developed from available WSDOT data or obtained during the study.
5.1 CONCLUSIONS
This study has resulted in several deliverables that will aid WSDOT in
managing I-5 rehabilitation in King County, including
(1) assessment tools for I-5 PCCP
(2) further knowledge of the conditions of I-5 PCCP
(3) limited evidence linking diamond grinding and accident reduction
(4) a comparison of 1986 and 2007 pavement evaluations.
The assessment tools include the distress plots and images produced with
Arc GIS. These tools provide WSDOT with an improved understanding of I-5
conditions through straightforward visual presentation.
The summary analyses of the 2004 distress data provide a quantitative
understanding of the performance of the non-rehabilitated, diamond ground, and
dowel bar retrofit PCCP on I-5 in King County. As expected, the rehabilitation
efforts thus far have extended the life of I-5. As the trigger failure analysis
highlighted, at least 80 lane miles of I-5 (and possibly up to 129 lane miles, out of
195 total lane miles, depending on the trigger values used) need rehabilitation.
The analysis of wet surface accidents suggests a possible reduction in
accidents attributable to diamond grinding. As stated earlier, this is difficult to
prove but suggests further reasons for how and why I-5 PCCP needs to be
rehabilitated.
The field study on I-5 at MP 175 suggests that the condition of I-5 PCCP is
deteriorating. The faulting, cracking, and spalling observed are worse than
recorded in 1986—as expected. Furthermore, many of the new cracks are
currently propagating across the slabs, suggesting that panel cracking is
accelerating. The PCC in I-5 is still quite strong as measured by compressive
72

strength and, indirectly, by overall performance. The relatively high transverse
joint LTE values at the MP 175 test section are encouraging. However, they are
countered somewhat by the low LTEs for the longitudinal cracks. This suggests
that major rehabilitation may include an HMA overlay of the existing PCC.
Analyses of the data provided by WSDOT reveals that the I-5 PCCP in
King County is in poor condition. Diamond grinding and other rehabilitation efforts
will help this condition, but only temporarily. Ultimately, I-5 must receive major
rehabilitation or complete reconstruction.
5.2 RECOMMENDATIONS
This study has shown how diamond grinding and dowel bar retrofitting has
enhanced the performance of the PCCP and extended its service life. While it
may not be feasible to reconstruct all of I-5 in King County, rehabilitating portions
of I-5 will extend the life of the pavements and improve traffic safety. Currently,
with WSDOTs limited budget and the eventual need for major rehabilitation or
reconstruction, diamond grinding appears to be the single best option to extend
the life of the majority of I-5 in King County.
5.3 CONSENSUS VIEW
Table 5.1 was prepared by the WSDOT, University of Washington, and
Nichols Consulting team to provide expected I-5 conditions for three broad time
periods: 0 to 5 years, 5 to 10 years, and beyond 10 years. The assessment is
based on existing conditions and the best estimate of how I-5 will continue to
perform and the WSDOT actions the will be needed.
73

Table 5.1 Interstate 5 Estimates for King County—A Consensus View
Time Frame (years)
Expected PCC Distress During Time Frame
Required WSDOT Activities
0 to 5 Increased faulting of the transverse joints and, to a lesser degree, slab cracking, with localized areas of increased cracking. Pavement wear depths due to studded tires generally exceed safe levels (main concern is hydroplaning). Surface friction is low throughout the corridor for PCCP that has not been ground or resurfaced.
Continuing WSDOT maintenance will be required to address localized problem areas—mostly broken slabs. Contract rehabilitation should include a focus on grinding the PCC surface to remove/reduce faulting and broken slab replacement. Major rehabilitation or reconstruction should be designed, funded, and under way. The traveling public will complain about the pavement condition and related noise.
5 to 10 If only limited work is performed during the preceding 5 years, major faulting of the transverse joints throughout I-5 in King County is expected. A significant increase in slab cracking will occur. Without extensive grinding, pavement wheel path wear depths will continue to worsen, but slowly.
WSDOT Maintenance will be challenged to keep up with replacement/repair of broken slabs. Major rehabilitation or reconstruction must be designed, funded, and well under way. The traveling public will express increasing concern about the condition of the roadway, including pavement related noise. Trucking interests will have special concerns.
Greater than 10
If limited work is performed during the preceding 10 years, I-5 will be highly distressed, largely in the form of major faulting of the transverse joints, extensive slab cracking, and wheel path wear depths. In essence, a fully “failed” condition.
WSDOT will be in a triage mode with respect to I-5. The required repair work will be extensive. The structural capacity of I-5 will be at risk. WSDOT can expect strong public complaints about the condition of the roadway.
74

REFERENCES
Colley, B.E. and Humphrey, H.A. (1967), “Aggregate Interlock at Joints in Concrete Pavements,” Highway Research Record No. 189, Highway Research Board, Washington, D.C.
Darter, M.I. (1977), “Design of Zero-Maintenance Plain Jointed Concrete
Pavement: Vol. 1-Development of Design Procedures,” Report No. FHWA-RD-77-111, June 1977.
Foxworthy, P.T. (1985), “Concepts for the Development of a Nondestructive
Testing and Evaluation System for Rigid Airfield Pavements,” Ph.D. Thesis, University of Illinois at Urban-Champaign, June 1985.
Jackson, Newton, Engineer, Pavement Consulting, Personal Communication
July 2006 – June 2007 Mahoney, J.P., Lary, Jo A., Pierce, Linda M., Jackson, Newton C. and
Barenberg, Ernest I. (1991), “Urban Interstate Portland Cement Concrete Rehabilitation Alternatives for Washington State,” Research Report WA-RD 202.1, Washington State Department of Transportation, April 1991
Mahoney, Joe, Professor, University of Washington, Department of Civil and
Environmental Engineering. Personal Communication July 2006 – August 2007.
Muench, Stephen T., Uhlmeyer, Jeff, Ozolin and Pierce, Linda M. (2007) “Rapid
Concrete Panel Replacement in Washington State: Lessons Learned, Submitted to the International Conference on Optimizing Concrete Mixtures and Accelerated Concrete Pavement Construction and Rehabilitation, May 15 2007
Mindess. S. and Young, J.F. (1981), “Concrete,” Prentice-Hall, Inc., Englewood Cliffs,
N.J. Pavement Interactive (2007), http://pavementinteractive.org/index Pierce, Linda, State Pavement Engineer, Washington State Department of
Transportation. Personal Communication July 2006 – August 2007. Pierce, L., Uhlmeyer, J., Weston, J., Lovejoy, J., Mahoney, J. (2003), “Ten-Year
Performance of Dowel Bar Retrofit—Application, Performance, and Lessons Learned,” Journal of the Transportation Research Board No. 1853, Transportation Research Board, Washington, D.C.
75

76
Shafizadeh, Kevin, Mannering, Fred, and Pierce, Linda M. (2002), “A Statistical Analysis Factors Associated with Driver-Perceived Road Roughness on Urban Highways,” Research Report WA-RD 538.1, Washington State Department of Transportation, June 2002
Stelzenmulter, W.B., Smith, L.L., and Larson, T.J. (1973), “Load Transfer at
Contraction Joints in Plain Portland Cement Concrete Pavements,” Research Report 90-D, Florida Department of Transportation, April 1973.
Washington State Department of Transportation (2007), “Dowel Bar Retrofit Tech
Notes,” WSDOT, State Materials Laboratory, Olympia, WA, January 2007. http://www.wsdot.wa.gov/biz/mats/Pavement/Technotes/DBR_TN_2007.pdf .

Appendix A – Mile Post Breakdown Northbound and Southbound
A-1
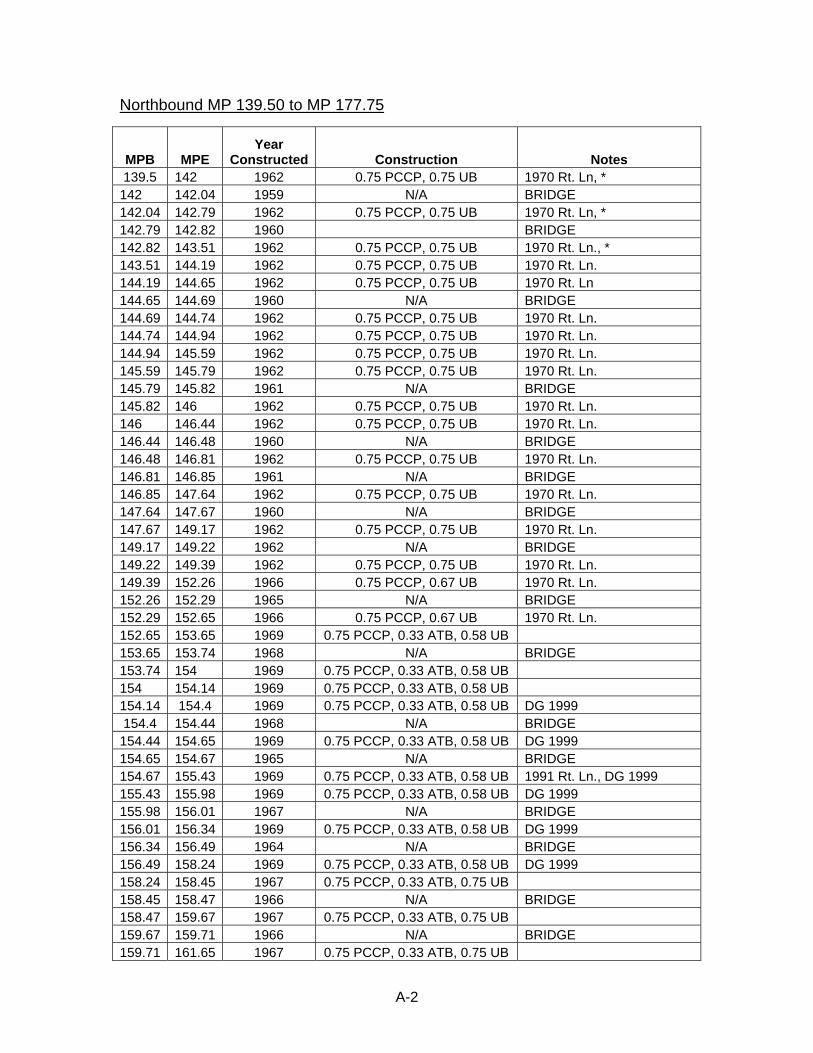
Northbound MP 139.50 to MP 177.75
MPB MPE Year
Constructed Construction Notes 139.5 142 1962 0.75 PCCP, 0.75 UB 1970 Rt. Ln, * 142 142.04 1959 N/A BRIDGE 142.04 142.79 1962 0.75 PCCP, 0.75 UB 1970 Rt. Ln, * 142.79 142.82 1960 BRIDGE 142.82 143.51 1962 0.75 PCCP, 0.75 UB 1970 Rt. Ln., * 143.51 144.19 1962 0.75 PCCP, 0.75 UB 1970 Rt. Ln. 144.19 144.65 1962 0.75 PCCP, 0.75 UB 1970 Rt. Ln 144.65 144.69 1960 N/A BRIDGE 144.69 144.74 1962 0.75 PCCP, 0.75 UB 1970 Rt. Ln. 144.74 144.94 1962 0.75 PCCP, 0.75 UB 1970 Rt. Ln. 144.94 145.59 1962 0.75 PCCP, 0.75 UB 1970 Rt. Ln. 145.59 145.79 1962 0.75 PCCP, 0.75 UB 1970 Rt. Ln. 145.79 145.82 1961 N/A BRIDGE 145.82 146 1962 0.75 PCCP, 0.75 UB 1970 Rt. Ln. 146 146.44 1962 0.75 PCCP, 0.75 UB 1970 Rt. Ln. 146.44 146.48 1960 N/A BRIDGE 146.48 146.81 1962 0.75 PCCP, 0.75 UB 1970 Rt. Ln. 146.81 146.85 1961 N/A BRIDGE 146.85 147.64 1962 0.75 PCCP, 0.75 UB 1970 Rt. Ln. 147.64 147.67 1960 N/A BRIDGE 147.67 149.17 1962 0.75 PCCP, 0.75 UB 1970 Rt. Ln. 149.17 149.22 1962 N/A BRIDGE 149.22 149.39 1962 0.75 PCCP, 0.75 UB 1970 Rt. Ln. 149.39 152.26 1966 0.75 PCCP, 0.67 UB 1970 Rt. Ln. 152.26 152.29 1965 N/A BRIDGE 152.29 152.65 1966 0.75 PCCP, 0.67 UB 1970 Rt. Ln. 152.65 153.65 1969 0.75 PCCP, 0.33 ATB, 0.58 UB 153.65 153.74 1968 N/A BRIDGE 153.74 154 1969 0.75 PCCP, 0.33 ATB, 0.58 UB 154 154.14 1969 0.75 PCCP, 0.33 ATB, 0.58 UB 154.14 154.4 1969 0.75 PCCP, 0.33 ATB, 0.58 UB DG 1999 154.4 154.44 1968 N/A BRIDGE 154.44 154.65 1969 0.75 PCCP, 0.33 ATB, 0.58 UB DG 1999 154.65 154.67 1965 N/A BRIDGE 154.67 155.43 1969 0.75 PCCP, 0.33 ATB, 0.58 UB 1991 Rt. Ln., DG 1999 155.43 155.98 1969 0.75 PCCP, 0.33 ATB, 0.58 UB DG 1999 155.98 156.01 1967 N/A BRIDGE 156.01 156.34 1969 0.75 PCCP, 0.33 ATB, 0.58 UB DG 1999 156.34 156.49 1964 N/A BRIDGE 156.49 158.24 1969 0.75 PCCP, 0.33 ATB, 0.58 UB DG 1999 158.24 158.45 1967 0.75 PCCP, 0.33 ATB, 0.75 UB 158.45 158.47 1966 N/A BRIDGE 158.47 159.67 1967 0.75 PCCP, 0.33 ATB, 0.75 UB 159.67 159.71 1966 N/A BRIDGE 159.71 161.65 1967 0.75 PCCP, 0.33 ATB, 0.75 UB
A-2

A-3
MPB MPE Year
Constructed Construction Notes
161.65 161.68 1967 N/A BRIDGE 161.68 162.19 1967 0.75 PCCP, 0.33 ATB, 0.75 UB 162.19 162.36 1967 N/A BRIDGE 162.36 162.68 1967 0.75 PCCP, 0.33 ATB, 0.75 UB 162.68 162.82 1997 0.75 PCCP, 0.92 UB 162.82 162.96 1967 N/A BRIDGE 162.96 163.04 1967 0.75 PCCP, 0.92 UB 163.04 163.2 1967 N/A BRIDGE 163.2 163.24 1967 0.75 PCCP, 0.92 UB 163.24 164.37 1967 N/A BRIDGE 164.37 164.62 1967 0.75 PCCP, 0.92 UB 164.62 164.66 1966 N/A BRIDGE 164.66 164.8 1967 0.75 PCCP, 0.92 UB 164.8 164.93 1966 N/A BRIDGE 164.93 165.32 1967 0.75 PCCP, 0.92 UB 165.32 166.21 1965 N/A BRIDGE 166.21 166.91 1965 0.75 PCCP, 0.92 UB 166.91 166.98 1964 N/A BRIDGE 166.98 167.13 1965 0.75 PCCP, 0.92 UB 167.13 167.35 1964 0.75 PCCP, 0.67 UB 167.35 167.67 1962 N/A BRIDGE 167.67 168.34 1964 0.75 PCCP, 0.67 UB 168.34 169.18 1961 N/A BRIDGE 169.18 170.25 1965 0.75 PCCP, 0.67 UB 170.25 170.5 1961 N/A BRIDGE 170.5 170.85 1963 0.75 PCCP, 0.67 UB 170.85 172.32 1965 0.75 PCCP, 0.59 UB 172.32 172.35 1965 N/A BRIDGE 172.35 172.76 1965 0.75 PCCP, 0.59 UB 172.76 172.79 1985 N/A BRIDGE 172.79 174.58 1965 0.75 PCCP, 0.92 UB 174.58 175.11 1965 0.75 PCCP, 0.17 CTB, 0.42 UB Lt. Ln. 1967 175.11 175.14 1965 BRIDGE 175.14 175.52 1965 0.75 PCCP, 0.17 CTB, 0.42 UB Lt. Ln. 1967 175.52 175.53 1990 BRIDGE 175.53 175.89 1965 0.75 PCCP, 0.17 CTB, 0.42 UB Lt. Ln. 1967 175.89 176.13 1965 0.75 PCCP, 0.17 CTB, 0.42 UB 176.13 176.16 1964 N/A BRIDGE 176.16 177.75 1965 0.75 PCCP, 0.17 CTB, 0.42 UB * New construction of HOV, left most lanes. UB - Untreated Base, ATB - Asphalt Treated Base CTB - Cement Treated Base, DG- Diamond Grinding DBR-Dowel Bar Retrofit (Year) Lt./Rt. Ln.– Left/Right Lane constructed that year

A-4
Southbound MP 139.50 to MP 177.75
MPB MPE Year
Constructed Construction (feet) Notes 139.5 142 1962 0.75 PCCP, 0.75 UB 1970 Rt. Ln., * 142 142.04 1959 N/A BRIDGE
142.04 142.79 1962 0.75 PCCP, 0.75 UB * 142.79 142.81 1960 N/A BRIDGE 142.81 143.24 1962 0.75 PCCP, 0.75 UB * 143.24 144.45 1962 0.75 PCCP, 0.75 UB 1970 Rt. Ln
144.45 144.65 1962 0.75 PCCP, 0.75 UB 1970 Rt. Ln., 2001 DBR/DG (Ln.1,2)*
144.65 144.69 1960 N/A BRIDGE
144.69 145.79 1962 0.75 PCCP, 0.75 UB 1970 Rt. Ln., 2001 DBR/DG (Ln.1,2)*
145.79 145.82 1961 N/A BRIDGE
145.82 146.18 1962 0.75 PCCP, 0.75 UB 1970 Rt. Ln., 2001 DBR/DG (Ln.1,2)*
146.18 146.43 1962 0.75 PCCP, 0.75 UB 1970 Rt. Ln., * 146.43 146.47 1960 N/A BRIDGE 146.47 146.81 1962 0.75 PCCP, 0.75 UB 1970 Rt. Ln., * 146.81 146.84 1961 N/A BRIDGE 146.81 147.64 1962 0.75 PCCP, 0.75 UB 1970 Rt. Ln., * 147.64 147.67 1960 N/A BRIDGE
147.67 148.88 1962 0.75 PCCP, 0.75 UB 1970 Rt. Ln., 2001 DBR/DG(Ln.1,2),*
148.88 149.17 1962 0.75 PCCP, 0.75 UB 1970 Rt. Ln., 2001 DBR/DG (Ln.1,2)
149.17 149.22 1962 N/A 2003 reconstructed bridge
149.22 149.4 1962 0.75 PCCP, 0.75 UB 1970 Rt. Ln., 2001 DBR/DG (Ln.1,2)
149.4 149.69 1966 0.75 PCCP, 0.67 UB 1970 Rt. Ln., 2001 DBR/DG (Ln.1,2)
149.69 152.26 1966 0.75 PCCP, 0.67 UB 1970 Rt. Ln. 152.26 152.29 1965 N/A BRIDGE
152.29 152.51 1966 0.75 PCCP, 0.67 UB 1970 Rt. Ln., 2004 HV Added (lt)
152.51 153.15 1966 0.75 PCCP, 0.67 UB 1970 Rt. Ln., 2004 HV Added (lt), *
153.15 154.06 1969 0.75 PCCP, 0.33 ATB,
0.58 UB 2004 HV Added (lt), 2004 ReCon.
154.06 154.12 1969 0.75 PCCP, 0.33 ATB,
0.58 UB 2004 HV Added (lt) 154.12 154.16 1968 N/A BRIDGE
154.16 154.4 1969 0.75 PCCP, 0.33 ATB,
0.58 UB 1999 DG, 2004 HV Added (Lt)
154.4 154.42 1968 N/A BRIDGE
154.42 154.5 1969 0.75 PCCP, 0.33 ATB,
0.58 UB 1999 DG 154.5 154.53 1968 N/A BRIDGE 154.53 154.65 1969 0.75 PCCP, 0.33 ATB, 1999 DG

A-5
0.58 UB 154.65 154.67 1965 N/A BRIDGE
154.67 155.98 1969 0.75 PCCP, 0.33 ATB,
0.58 UB 1999 DG 155.98 156.01 1967 N/A BRIDGE
156.01 156.34 1969 0.75 PCCP, 0.33 ATB,
0.58 UB 1999 DG 156.34 156.5 1964 N/A BRIDGE
156.5 156.7 1969 0.75 PCCP, 0.33 ATB,
0.58 UB 1976 Asphalt overlay, 1999 DG
156.7 157.56 1969 0.75 PCCP, 0.33 ATB,
0.58 UB 1999 DG
157.56 157.7 1969 0.75 PCCP, 0.33 ATB,
0.58 UB
157.7 158.45 1969 0.75 PCCP, 0.33 ATB,
0.58 UB 1999 DG 158.45 158.47 1998 N/A BRIDGE
158.47 159.67 1967 0.75 PCCP, 0.33 ATB,
0.75 UB 159.67 159.71 1998 N/A BRIDGE
159.71 160.07 1967 0.75 PCCP, 0.33 ATB,
0.75 UB 160.07 160.16 1998 N/A BRIDGE 160.16 161.54 1967 0.75 PCCP, 1.08 UB 161.54 161.63 1998 N/A BRIDGE 161.63 161.65 1967 0.75 PCCP, 1.08 UB 161.65 161.68 1998 N/A BRIDGE 161.68 162.24 1967 0.75 PCCP, 1.08 UB 162.24 162.37 1967 N/A BRIDGE 162.37 162.68 1967 0.75 PCCP, 1.08 UB 162.68 162.82 1967 0.75 PCCP, 0.92 UB 162.82 162.96 1967 N/A BRIDGE 162.96 163.06 1967 0.75 PCCP, 0.92 UB 163.06 164.33 1967 N/A BRIDGE 164.33 164.62 1967 0.75 PCCP, 0.92 UB 164.62 164.66 1966 N/A BRIDGE 164.66 164.8 1967 0.75 PCCP, 0.92 UB 164.8 164.93 1966 N/A BRIDGE 164.93 165.28 1967 0.75 PCCP, 0.92 UB 165.28 165.44 1965 N/A BRIDGE 165.44 166.36 1967 0.75 PCCP, 0.92 UB 166.36 167.72 1964 N/A BRIDGE 167.72 168.34 1964 0.75 PCCP, 0.67 UB 168.34 169.18 1961 N/A BRIDGE 169.18 170.25 1965 0.75 PCCP, 0.67 UB 170.25 170.5 1961 N/A BRIDGE 170.5 170.85 1963 0.75 PCCP, 0.67 UB 170.85 172.76 1965 0.75 PCCP, 0.59 UB 172.76 172.79 1985 N/A BRIDGE 172.79 174.58 1965 0.75 PCCP, 0.59 UB

A-6
174.58 175.11 1965 0.75 PCCP, 0.59 UB 1967 Rt. Ln. 175.11 175.14 1965 N/A BRIDGE 175.14 175.52 1965 0.75 PCCP, 0.59 UB 175.52 175.53 1990 N/A BRIDGE 175.53 176.13 1965 0.75 PCCP, 0.59 UB 176.13 176.16 1964 N/A BRIDGE 176.16 177.75 1965 0.75 PCCP, 0.59 UB * New construction of HOV, left most lanes. DBR-Dowel Bar Retrofit
UB - Untreated Base, ATB - Asphalt Treated Base (Year) Lt./Rt. Ln.– Left/Right Lane constructed that year
CTB - Cement Treated Base, DG- Diamond Grinding

Appendix B – I-5 Field Study
B-1

B-2
HMA Shoulder 7 ft wide
Lane 1 (PCC) 12 ft wide
Lane 2 (PCC) 12 ft wide
Slab 18 Slab 19 Slab 20 Slab 21
I-5, MP 175+ Northbound
Crack Survey2007
1986
Spalled crack: up to 3-1/2” wide and up to 7/8” deepSpalled crack: up to 2-7/8” wide and up to 2” deep
Spalled crack: up to 3” wide and up to 2-1/4” deep
Spalled crack: up to 2-3/4” wide and up to 2-1/2” deep
Spalled crack: up to 3-1/2” wide and up to 2/1/2” deep
Spalled crack: up to 4” wide and up to 2-3/4” deepSpalled crack: up to 3” wide and up to 3/4” deep
Spalled crack: up to 1-1/2” wide and up to 2” deepSpalled crack: up to 1-1/4” wide and up to 1/4” deepSpalled crack: up to 1-1/2” wide and up to 1-3/4” deep

HMA Shoulder 7 ft wide
Lane 1 (PCC) 12 ft wide
Lane 2 (PCC) 12 ft wide
Slab 25 Slab 26 Slab 27
Crack SurveySlab 28
I-5, MP 175+ Northbound
Spalled crack: up to 1-1/2” wide and up to 2” deepSpalled crack: up to 1-5/8” wide and up to 3” deepSpalled crack: up to 1-5/8” wide and up to 3” deep
Spalled crack: up to 2-1/2” wide and up to 2-3/4” deepSpalled crack: width up to 3”Spalled crack: up to 3” wide and up to 1-1/4” deepSpalled crack: up to 2-1/4” wide and up to 1-3/4” deep
2007
1986
Note: Slabs 26, 27, and 28 were not inspected completely.
B-3

HMA Shoulder 7 ft wide
Lane 1 (PCC) 12 ft wide
Lane 2 (PCC) 12 ft wide
Slab 1 Slab 2 Slab 3 Slab 4
I-5, MP 175+ Northbound
Faulting Measurements
Edge
Middle of lane
Wheelpath
Edge
Wheelpath
Note: Measurements in increments of 1/16 inch.
2007
1986
11
10
10
10
11
21
1
3
11
11
11
21
11
3 1
2
3
2
2
3 2
2 1
2
2
2 2
2 1
11
4 2
2 2
2 1
1 0
1 0
2 2
1 2
2
1 1
1 0
2 2
1 1
2 2
B-4

HMA Shoulder 7 ft wide
Lane 1 (PCC) 12 ft wide
Lane 2 (PCC) 12 ft wide
Slab 18 Slab 19 Slab 20 Slab 21
I-5, MP 175+ Northbound
Faulting Measurements
Note: Measurements in increments of 1/16 inch.
2 1
1 1
3 2
1 1
2 1
4
3
2
2
1
1
1
1
2
2
2 2
2 1
1 2
2 2
2 3
3 1
1 1
2 1
2 1
4 3
1
1
1
1
2
3
3
2
3
4
1
B-5

HMA Shoulder 7 ft wide
Lane 1 (PCC) 12 ft wide
Lane 2 (PCC) 12 ft wide
Slab 25 Slab 26 Slab 27 Slab 28
I-5, MP 175+ Northbound
Faulting Measurements
Note: Measurements in increments of 1/16 inch.
19862007
2
3
4
21
3
4
5
02
2 2
1
2
22 2
1 2
1 1
2
3
B-6

HMA Shoulder 7 ft wide
Lane 1 (PCC) 12 ft wide
Lane 2 (PCC) 12 ft wide
Slab 1 Slab 2 Slab 3
PCC Core Locations
Notes: (1) Only cores in the left wheel path were collected.,Time constraints and lack of patching material did not allomiddle of lane cores.
Slab 4
I-5, MP 175+ Northbound
(2) w for
Direction
2007
of traffic flow
1986
8 9
11 12
1 2 3 5 64 7
1 2
3
29
4 5
6
7
9
8
30
10
B-7

HMA Shoulder 7 ft wide
Lane 1 (PCC) 12 ft wide
Lane 2 (PCC) 12 ft wide
Slab 18 Slab 19 Slab 20 Slab 21
I-5, MP 175+ Northbound
PCC Core Locations
Notes:
2007
1986
15413
17
11 12
16
32
21
14
10
18
20
19
33
23
22
B-8

HMA Shoulder 7 ft wide
Lane 1 (PCC) 12 ft wide
Lane 2 (PCC) 12 ft wide
Slab 25 Slab 26 Slab 27 Slab 28
I-5, MP 175+ Northbound
PCC Core Locations
Notes:
1986
2007
24
28
2725
26
34
36 38
35
37
39
40
B-9

HMA Shoulder 7 ft wide
Lane 1 (PCC) 12 ft wide
Lane 2 (PCC) 12 ft wide
Slab 1 Slab 2 Slab 3
Notes: (1) Prior FWD testing was done at load levels of 6, 15 kips, (2) Approximate plate locations are shown for al
Slab 4
I-5, MP 175+ Northbound
FWD Plate Locations
9, 12, and l test locations.
Row 1 (outside edge)
Row 3 (middle of the lane)
Row 2 (centered in the outer wheelpath
1 2 111074 983 5 6
33 343231 35 3736 3938 4140
4549
484746 50
5055
545352
51
12 13
4443
14
42
56
58
57
B-10

HMA Shoulder 7 ft wide
Lane 1 (PCC) 12 ft wide
Lane 2 (PCC) 12 ft wide
Slab 18 Slab 19 Slab 20
FWD Plate LocationsSlab 21
I-5, MP 175+ Northbound
Notes: (1) Prior FWD testing was done at load levels of 6, 15 kips, (2) Approximate plate locations are shown for al
9, 12, and l test locations.
1516
2120191817
23
24
22
B-11

B-12
HMA Shoulder 7 ft wide
Lane 1 (PCC) 12 ft wide
Lane 2 (PCC) 12 ft wide
Slab 25 Slab 26 Slab 27
FWD Plate LocationsSlab 28
I-5, MP 175+ Northbound
Notes: (1) Prior FWD testing was done at load levels of 615 kips, (2) Approximate plate locations are show
, 9, 12, and n for all test locations.
27
28
25
26
29
30

Appendix C – 2004 Non-Rehabilitated PCCP Summary Tables
C-1

Northbound and Southbound PCCP w/out Rehabilitation MP 139.75 to 177.75 (162.81 lane miles)
Average Median Standard Deviation
Max Value BSRMP ESRMP Lane
Min Value
IRI Left (in/mile) 199.10 185.00 87.40 633.00 169.85 169.95 SB 4 37.00
IRI Right (in/mile) 156.59 142.00 64.45 533.00 162.18 162.19 NB 3 42.00
IRI Average (in/mile) 177.60 166.00 71.04 478.00 143.02 143.12 NB 1 40.00
Rut Left (in) 0.34 0.33 0.14 0.79 142.74 142.79 NB 3 0.06
Rut Right (in) 0.34 0.32 0.15 0.76 165.58 165.68 SB 3 0.07
Average Faulting (in) 0.11 0.10 0.07 0.72 148.87 148.97 NB 4 0.00
Number of Faults 8.10 6.00 7.52 36.00 143.32 143.42 NB 1 0.00
1/8" - 1/4" 22.18 16.70 23.95 100.00 N/A N/A ALL 0.00
1/4" - 1/2" 5.80 0.00 13.52 100.00 N/A N/A SB2/4, NB3 0.00
1/2" + 0.94 0.00 4.97 50.00 N/A N/A SB2/4, NB2 0.00
% o
f Fau
lted
Slab
s
Total 28.91 22.20 29.97 100.00 N/A N/A ALL 0.00
1 3.77 2.00 4.97 28.00 N/A N/A NB2, SB
4 0.00
2 - 3 0.67 0.00 1.76 23.00 150.54 150.64 SB 2 0.00
Num
ber o
f C
rack
s pe
r Pa
nel
4+ 0.09 0.00 0.52 10.00 169.25 169.35 SB 1 0.00
1 11.20 5.69 14.79 79.90 152.13 152.23 NB 2 0.00
2 - 3 2.08 0.00 5.81 65.70 150.54 150.64 SB 2 0.00
# of
Cra
cks
as %
of T
otal
Sl
abs
4+ 0.29 0.00 1.99 146.43 169.25 169.35 SB 1 0.00
1/8" - 1/4" 7.78 2.85 11.39 68.13 144.02 144.12 NB 2 0.00
1/4" - 1/2" 2.93 0.00 8.67 77.11 143.12 143.22 NB 1 0.00
1/2" + 0.20 0.00 1.13 11.43 150.64 150.74 SB 3 0.00
Faul
ted
Slab
s as
%
of T
otal
Sla
bs
Total 10.91 2.85 17.58 94.32 150.54 150.64 SB 2 0.00
% PCCP Crack 13.56 5.70 18.38 94.30 150.54 150.64 SB 2 0.00
Maximum Rut (mm) 9.39 8.89 3.63 20.07 142.74 142.79 NB 2 1.524
Maximum Rut (in) 0.37 0.35 0.14 0.79 142.74 142.79 NB 2 0.06
Age Of PCCP 40.43 41 2.29 44 N/A N/A N/A 36
Friction Number N/A N/A N/A 52.40 N/A N/A NB 1 25.30
C-2

Northbound PCCP w/out Rehabilitation MP 139.5 to MP 177.75 (103.76 lane miles)
Average Median Standard Deviation
Max Value BSRMP ESRMP Lane
Min Value
IRI Left (in/mile) 204.83 191.00 82.60 511.00 143.02 143.12 NB 1 39.00
IRI Right (in/mile) 162.49 147.00 63.55 460.00 162.18 162.19 NB 3 54.00
IRI Average (in/mile) 183.42 171.00 68.12 478.00 143.02 143.12 NB 1 46.00
Rut Left (in) 0.35 0.34 0.14 0.79 142.74 142.79 NB 3 0.06
Rut Right (in) 0.35 0.34 0.14 0.74 142.04 142.14 NB 3 0.09
Average Faulting (in) 0.11 0.10 0.07 0.72 148.87 148.97 NB 4 0.00
Number of Faults 8.81 6.00 7.79 36.00 143.32 143.42 NB 1 0.00
1/8" - 1/4" 22.22 18.20 22.93 100.00 N/A N/A ALL 0.00
1/4" - 1/2" 6.07 0.00 13.74 100.00 162.18 162.19 NB 3 0.00
1/2" + 0.80 0.00 4.30 50.00 162.20 162.30 NB 2 0.00
% o
f Fau
lted
Slab
s
Total 29.09 25.00 29.29 100.00 N/A N/A ALL 0.00
1 3.45 1.00 4.68 28.00 152.13 152.23 NB 2 0.00
2 - 3 0.61 0.00 1.58 14.00 173.19 173.29 NB 2 0.00
Num
ber o
f C
rack
s pe
r Pa
nel
4+ 0.08 0.00 0.42 6.00 146.33 146.43 NB 2 0.00
1 10.24 5.67 14.08 79.90 152.13 152.23 NB 2 0.00
2 - 3 1.89 0.00 5.19 39.90 173.19 173.29 NB 2 0.00
# of
Cra
cks
as
% o
f Tot
al
Slab
s
4+ 0.29 0.00 2.06 17.00 146.33 146.43 NB 2 0.00
1/8" - 1/4" 8.30 2.85 11.86 68.13 144.02 144.12 NB 2 0.00
1/4" - 1/2" 3.29 0.00 9.63 77.11 143.12 143.22 NB 1 0.00
1/2" + 0.19 0.00 0.91 11.41 143.02 143.12 NB 1 0.00
Faul
ted
Slab
s as
%
of T
otal
Sla
bs
Total 11.78 2.86 18.56 94.32 143.32 143.42 NB 1 0.00
% PCCP Crack 12.42 5.69 17.44 88.50 152.13 152.23 NB 2 0.00
Maximum Rut (mm) 9.56 9.14 3.64 20.07 142.74 142.79 NB 2 1.52
Maximum Rut (in) 0.38 0.36 0.14 0.79 142.74 142.79 NB 2 0.06
Age Of PCCP 40.55 41 2.57 44 N/A N/A N/A 36
Friction Number N/A N/A N/A 52.4 N/A N/A NB 1 25.3
C-3

Southbound PCCP w/out Rehabilitations MP 143.29 to MP 177.65 (59.05 lane miles)
Average Median Standard Deviation
Max Value BSRMP ESRM Lane
Min Value
IRI Left (in/mile) 188.99 174.00 94.50 633.00 169.85 169.95 SB 4 37.00
IRI Right (in/mile) 146.17 133.00 64.76 422.00 150.64 150.74 SB 2 42.00
IRI Average (in/mile) 167.34 156.50 74.86 353.00 169.85 169.95 SB 4 40.00
Rut Left (in) 0.32 0.30 0.14 0.72 171.92 172.02 SB 3 0.10
Rut Right (in) 0.32 0.29 0.15 0.76 165.58 165.68 SB 3 0.07
Average Faulting (in) 0.11 0.10 0.08 0.69 150.04 150.14 SB 4 0.00
Number of Faults 6.84 4.00 6.84 34.00 143.59 143.69 SB 1 0.00
1/8" - 1/4" 22.11 14.30 25.66 100.00 N/A N/A ALL 0.00
1/4" - 1/2" 5.31 0.00 13.12 100.00 N/A N/A SB 2/4 0.00
1/2" + 1.18 0.00 5.97 50.00 N/A N/A SB 2/4 0.00
% o
f Fau
lted
Slab
s
Total 28.60 20.00 31.16 100.00 N/A N/A ALL 0.00
1 4.34 2.00 5.40 28.00 164.98 165.08 SB 4 0.00
2 - 3 0.79 0.00 2.05 23.00 150.54 150.64 SB 2 0.00
Num
ber o
f C
rack
s pe
r Pa
nel
4+ 0.10 0.00 0.65 10.00 169.25 169.35 SB 1 0.00
1 12.88 6.03 15.84 79.61 164.98 165.08 SB 4 0.00
2 - 3 2.40 0.00 6.76 65.70 150.54 150.64 SB 2 0.00
# of
Cra
cks
as
% o
f Tot
al
Slab
s
4+ 0.29 0.00 1.86 28.43 169.25 169.35 SB 1 0.00
1/8" - 1/4" 6.86 2.84 10.47 59.84 143.89 143.99 SB 1 0.00
1/4" - 1/2" 2.28 0.00 6.60 14.29 171.29 171.39 SB 3 0.00
1/2" + 0.22 0.00 1.43 11.43 150.64 150.74 SB 3 0.00
Faul
ted
Slab
s as
%
of T
otal
Sla
bs
Total 9.37 2.85 15.60 94.03 150.54 150.64 SB 2 0.00
% PCCP Crack 15.57 8.52 19.79 94.30 150.54 150.64 SB 2 0.00
Maximum Rut (mm) 9.11 8.38 3.59 19.30 165.58 165.68 SB 3 2.794
Maximum Rut (in) 0.36 0.33 0.14 0.76 165.58 165.68 SB 3 0.11
Age Of PCCP 40.21 41 1.67 44 N/A N/A N/A 36
Friction Number N/A N/A N/A 45.20 N/A N/A SB 1 30.20
C-4

Northbound Lane 1 PCCP w/out Rehabilitation MP 139.5 to MP 177.70 (21.27 lane miles)
Average Median Standard Deviation
Max Value BSRMP ESRMP
Min Value
IRI Left (in/mile) 200.95 179.00 95.49 511.00 143.02 143.12 70.00
IRI Right (in/mile) 169.43 150.00 80.41 446.00 143.02 143.12 59.00
IRI Average (in/mile) 184.94 169.00 82.26 478.00 143.02 143.12 64.00
Rut Left (in) 0.31 0.30 0.08 0.54 173.19 173.29 0.13
Rut Right (in) 0.29 0.28 0.09 0.59 144.12 144.19 0.11
Average Faulting (in) 0.12 0.11 0.07 0.35 143.02 143.12 0.00
Number of Faults 11.26 9.00 9.61 36.00 143.32 143.42 0.00
1/8" - 1/4" 24.84 20.00 24.07 100.00 169.88 169.98 0.00
1/4" - 1/2" 7.60 0.00 16.99 81.80 143.12 143.22 0.00
1/2" + 0.33 0.00 2.16 25.00 173.69 173.79 0.00
% o
f Fau
lted
Slab
s
Total 32.76 25.00 32.07 100.00 143.02 143.12 0.00
1 3.38 1.00 4.80 25.00 161.25 161.35 0.00
2 - 3 0.70 0.00 1.59 13.00 146.33 146.43 0.00
Num
ber o
f C
rack
s pe
r Pa
nel
4+ 0.05 0.00 0.26 2.00 173.69 173.79 0.00
1 9.86 2.85 14.10 71.28 161.25 161.35 0.00
2 - 3 2.11 0.00 5.20 36.90 146.33 146.43 0.00
# of
Cra
cks
as
% o
f Tot
al
Slab
s
4+ 0.15 0.00 0.75 5.69 173.99 174.09 0.00
1/8" - 1/4" 11.73 5.69 14.52 62.67 141.80 141.90 0.00
1/4" - 1/2" 5.74 0.00 14.99 77.11 143.12 143.22 0.00
1/2" + 0.19 0.00 1.18 11.41 143.02 143.12 0.00
Faul
ted
Slab
s as
%
of T
otal
Sla
bs
Total 17.66 5.69 25.09 94.32 143.32 143.42 0.00
% PCCP Crack 12.12 5.66 17.63 79.80 161.25 161.35 0.00
Maximum Rut (mm) 8.35 8.13 2.07 15.00 144.12 144.19 3.81
Maximum Rut (in) 0.33 0.32 0.08 0.59 144.12 144.19 0.15
Age Of PCCP 37.73 36.00 2.12 42.00 N/A N/A 36.00
Friction Number 37.04 35.00 5.69 52.40 N/A N/A 25.30
C-5

Northbound Lane 2 PCCP w/out Rehabilitation MP 139.5 to MP 177.75 (27.93 lane miles)
Average Median Standard Deviation
Max Value BSRMP ESRMP
Min Value
IRI Left (in/mile) 246.49 240.00 78.97 493.00 139.50 139.60 49.00
IRI Right (in/mile) 183.85 178.00 58.35 445.00 162.96 163.04 72.00
IRI Average (in/mile) 214.93 206.00 64.03 425.00 171.30 171.40 71.00
Rut Left (in) 0.37 0.37 0.15 0.64 172.70 172.76 0.18
Rut Right (in) 0.36 0.35 0.15 0.61 166.81 166.91 0.12
Average Faulting (in) 0.14 0.13 0.07 0.45 162.20 162.30 0.00
Number of Faults 12.34 11.00 7.12 34.00 144.02 144.12 0.00
1/8" - 1/4" 31.19 33.30 22.59 100.00 176.46 176.56 0.00
1/4" - 1/2" 9.71 0.00 12.76 75.80 144.22 144.32 0.00
1/2" + 0.87 0.00 4.69 50.00 162.20 162.30 0.00
% o
f Fau
lted
Slab
s
Total 41.77 40.00 28.47 100.00 162.20 162.30 0.00
1 4.64 3.00 4.65 28.00 152.13 152.23 0.00
2 - 3 1.33 0.00 1.57 14.00 173.19 173.29 0.00
Num
ber o
f C
rack
s pe
r Pa
nel
4+ 0.19 0.00 0.45 6.00 146.33 146.43 0.00
1 13.91 8.56 14.09 79.90 152.13 152.23 0.00
2 - 3 4.15 0.00 5.19 39.90 173.19 173.29 0.00
# of
Cra
cks
as %
of T
otal
Sl
abs
4+ 0.71 0.00 2.28 17.00 146.33 146.43 0.00
1/8" - 1/4" 14.07 8.56 10.90 68.13 144.02 144.12 0.00
1/4" - 1/2" 5.46 0.00 7.55 71.35 143.22 143.32 0.00
1/2" + 0.23 0.00 0.83 8.58 171.30 171.40 0.00
Faul
ted
Slab
s as
%
of T
otal
Sla
bs
Total 19.76 11.40 16.14 85.62 171.30 171.40 0.00
% PCCP Crack 18.77 11.36 17.40 88.50 152.13 152.23 0.00
Maximum Rut (mm) 10.05 9.91 3.89 16.26 172.70 172.76 5.08
Maximum Rut (in) 0.40 0.39 0.15 0.64 172.70 172.76 0.20
Age Of PCCP 41.29 41.00 2.14 44.00 N/A N/A 37.00
Friction Number N/A N/A N/A N/A N/A N/A N/A
C-6

Northbound Lane 3 PCCP w/out Rehabilitation MP 139.5 to MP 177.75 (27.27 lane miles)
Average Median Standard Deviation
Max Value BSRMP ESRMP
Min Value
IRI Left (in/mile) 203.99 195.00 75.10 421.00 162.08 168.18 78.00
IRI Right (in/mile) 155.05 143.00 51.76 460.00 162.18 162.19 76.00
IRI Average (in/mile) 179.28 173.00 59.74 434.00 162.18 162.19 81.00
Rut Left (in) 0.46 0.46 0.14 0.79 142.74 142.79 0.16
Rut Right (in) 0.40 0.41 0.17 0.74 142.04 142.14 0.12
Number of Faults 6.69 5.00 5.39 28.00 171.50 171.60 0.00
1/8" - 1/4" 24.64 20.00 24.53 100.00 140.70 140.80 0.00
1/4" - 1/2" 5.11 0.00 12.26 100.00 162.18 162.19 0.00
1/2" + 1.03 0.00 5.03 50.00 170.18 170.25 0.00
% o
f Fau
lted
Slab
s
Total 30.78 25.00 29.10 100.00 170.18 170.25 0.00
1 4.20 3.00 4.80 27.00 153.30 153.40 0.00
2 - 3 0.34 0.00 0.90 7.00 177.60 177.70 0.00
Num
ber o
f C
rack
s pe
r Pa
nel
4+ 0.06 0.00 0.40 5.00 164.47 164.57 0.00
1 12.40 8.52 14.11 77.08 153.30 153.40 0.00
2 - 3 1.10 0.00 3.14 28.90 162.18 162.19 0.00
# of
Cra
cks
as
% o
f Tot
al
Slab
s
4+ 0.19 0.00 1.23 14.26 164.47 164.57 0.00
1/8" - 1/4" 5.84 2.85 7.74 42.77 164.67 164.77 0.00
1/4" - 1/2" 1.96 0.00 5.68 34.85 176.04 176.13 0.00
1/2" + 0.18 0.00 0.75 5.71 164.67 164.77 0.00
Faul
ted
Slab
s as
%
of T
otal
Sla
bs
Total 7.98 2.86 11.94 62.83 171.50 171.60 0.00
% PCCP Crack 13.69 8.54 15.84 82.79 153.30 153.40 0.00
Maximum Rut (mm) 12.09 12.19 3.50 20.07 142.74 142.79 5.33
Maximum Rut (in) 0.48 0.48 0.14 0.79 142.74 142.79 0.21
Age Of PCCP 41.32 41.00 2.11 44.00 N/A N/A 37.00
Friction Number N/A N/A N/A N/A N/A N/A N/A
C-7

Northbound Lane 4 PCCP w/out Rehabilitation MP 139.5 to MP 175.79 (27.29 lane miles)
Average Median Standard Deviation
Max Value BSRMP ESRMP
Min Value
IRI Left (in/mile) 165.74 158.50 58.32 366.00 169.38 169.48 39.00
IRI Right (in/mile) 142.55 133.50 52.41 418.00 143.72 143.82 54.00
IRI Average (in/mile) 153.89 149.50 46.50 341.00 147.67 147.77 46.00
Rut Left (in) 0.26 0.19 0.16 0.68 159.20 159.30 0.06
Rut Right (in) 0.36 0.38 0.15 0.63 160.71 160.75 0.09
Average Faulting (in) 0.08 0.07 0.07 0.72 148.87 148.97 0.00
Number of Faults 5.40 4.00 4.75 24.00 146.53 146.63 0.00
1/8" - 1/4" 8.46 0.00 14.75 66.70 143.52 143.62 0.00
1/4" - 1/2" 2.10 0.00 7.81 71.40 143.72 143.82 0.00
1/2" + 0.87 0.00 4.34 40.00 148.57 148.67 0.00
% o
f Fau
lted
Slab
s
Total 11.44 0.00 18.77 100.00 143.72 143.82 0.00
1 1.52 0.00 3.01 21.00 164.93 165.03 0.00
2 - 3 0.06 0.00 0.42 6.00 164.47 164.57 0.00
Num
ber o
f C
rack
s pe
r Pa
nel
4+ 0.02 0.00 0.20 3.00 169.68 169.78 0.00
1 4.59 0.00 9.33 64.44 163.20 163.24 0.00
2 - 3 0.19 0.00 1.28 17.12 164.47 164.57 0.00
# of
Cra
cks
as
% o
f Tot
al
Slab
s
4+ 0.05 0.00 0.56 8.56 169.68 169.78 0.00
1/8" - 1/4" 2.14 0.00 4.65 34.15 139.50 139.60 0.00
1/4" - 1/2" 0.47 0.00 1.62 14.24 143.72 143.82 0.00
1/2" + 0.17 0.00 0.80 5.70 148.57 148.67 0.00
Faul
ted
Slab
s as
%
of T
otal
Sla
bs
Total 2.78 0.00 5.38 37.02 139.50 139.60 0.00
% PCCP Crack 4.82 0.00 9.73 64.44 163.20 163.24 0.00
Maximum Rut (mm) 7.42 5.59 4.25 17.27 158.51 158.61 1.52
Maximum Rut (in) 0.29 0.22 0.17 0.68 158.51 158.61 0.06
Age Of PCCP 41.23 41.00 2.18 44.00 N/A N/A 37.00
Friction Number N/A N/A N/A N/A N/A N/A N/A
C-8

Southbound Lane 1 PCCP w/out Rehabilitation MP 143.29 to MP 177.65 (10.60 lane miles)
Average Median Standard Deviation
Max Value BSRMP ESRMP
Min Value
IRI Left (in/mile) 184.17 162.00 94.35 425.00 151.44 151.54 46.00
IRI Right (in/mile) 157.57 133.00 78.60 335.00 143.89 143.99 42.00
IRI Average (in/mile) 170.64 155.00 84.26 361.00 151.44 151.54 45.00
Rut Left (in) 0.28 0.29 0.10 0.54 173.24 173.34 0.10
Rut Right (in) 0.26 0.26 0.10 0.46 173.47 173.57 0.07
Average Faulting (in) 0.11 0.10 0.08 0.38 173.74 173.84 0.00
Number of Faults 8.07 4.00 8.81 34.00 143.59 143.69 0.00
1/8" - 1/4" 20.04 12.50 22.67 100.00 173.84 173.94 0.00
1/4" - 1/2" 7.63 0.00 14.67 56.00 150.64 150.74 0.00
1/2" + 0.93 0.00 6.11 40.00 173.74 173.84 0.00
% o
f Fau
lted
Slab
s
Total 28.60 20.00 31.32 100.00 173.84 173.94 0.00
1 5.98 4.00 6.25 23.00 150.54 150.64 0.00
2 - 3 1.00 0.00 1.81 8.00 150.44 150.54 0.00
Num
ber o
f C
rack
s pe
r Pa
nel
4+ 0.20 0.00 1.03 10.00 169.25 169.35 0.00
1 18.21 11.40 19.15 65.70 150.54 150.64 0.00
2 - 3 2.91 0.00 5.39 22.80 150.44 150.54 0.00
# of
Cra
cks
as
% o
f Tot
al
Slab
s
4+ 0.56 0.00 2.94 28.43 169.25 169.35 0.00
1/8" - 1/4" 8.24 2.84 12.65 59.84 143.89 143.99 0.00
1/4" - 1/2" 4.25 0.00 9.65 48.47 143.59 143.69 0.00
1/2" + 0.38 0.00 2.79 5.70 151.44 151.54 0.00
Faul
ted
Slab
s as
%
of T
otal
Sla
bs
Total 12.87 2.85 21.25 94.03 143.59 143.69 0.00
% PCCP Crack 21.68 14.33 22.56 79.80 150.44 150.54 0.00
Maximum Rut (mm) 7.38 7.62 2.61 13.70 173.24 173.34 2.79
Maximum Rut (in) 0.29 0.30 0.10 0.54 173.24 173.34 0.11
Age Of PCCP 38.73 39.00 2.16 43.00 N/A N/A 36.00
Friction Number 36.22 35.30 4.28 45.20 N/A N/A 30.20
C-9

Southbound Lane 2 PCCP w/out Rehabilitation MP 143.29 to MP 177.65 (15.57 lane miles)
Average Median Standard Deviation
Max Value BSRMP ESRMP
Min Value
IRI Left (in/mile) 196.94 192.00 98.96 458.00 170.05 170.15 37.00
IRI Right (in/mile) 145.24 132.00 68.16 422.00 150.64 150.74 42.00
IRI Average (in/mile) 170.86 159.00 79.90 388.00 150.64 150.74 40.00
Rut Left (in) 0.33 0.32 0.12 0.60 168.04 168.14 0.10
Rut Right (in) 0.33 0.32 0.14 0.73 165.58 165.68 0.12
Average Faulting (in) 0.12 0.11 0.08 0.55 174.81 174.91 0.00
Number of Faults 7.46 5.00 6.97 27.00 143.69 143.79 0.00
1/8" - 1/4" 24.34 20.00 25.38 100.00 169.65 169.75 0.00
1/4" - 1/2" 5.76 0.00 13.61 100.00 159.57 159.67 0.00
1/2" + 1.48 0.00 6.73 50.00 174.81 174.91 0.00
Total 31.57 25.00 30.98 100.00 174.81 174.91 0.00
1 5.62 5.00 5.32 24.00 150.44 150.54 0.00
2 - 3 1.93 0.00 3.29 23.00 150.54 150.64 0.00
Num
ber o
f C
rack
s pe
r Pa
nel
4+ 0.14 0.00 0.79 9.00 150.64 150.74 0.00
1 16.35 14.21 15.11 68.56 150.44 150.54 0.00
2 - 3 5.96 0.00 11.26 65.70 150.54 150.64 0.00
# of
Cra
cks
as
% o
f Tot
al
Slab
s
4+ 0.41 0.00 2.25 25.71 150.64 150.74 0.00
1/8" - 1/4" 7.51 2.85 10.53 45.46 150.24 150.34 0.00
1/4" - 1/2" 2.65 0.00 7.24 37.10 172.94 173.04 0.00
1/2" + 0.23 0.00 1.15 11.43 150.64 150.74 0.00
Faul
ted
Slab
s as
%
of T
otal
Sla
bs
Total 10.38 2.86 16.12 60.00 143.59 143.69 0.00
% PCCP Crack 22.71 17.06 22.61 94.30 150.54 150.64 0.00
Maximum Rut (mm) 9.31 8.89 3.15 18.54 165.58 165.68 3.56
Maximum Rut (in) 0.37 0.35 0.12 0.73 165.58 165.68 0.14
Age Of PCCP 40.58 41.00 1.34 44.00 N/A N/A 39.00
Friction Number N/A N/A N/A N/A N/A N/A N/A
C-10

Southbound Lane 3 PCCP w/out Rehabilitation MP 143.29 to MP 177.65 (16.58 lane miles)
Average Median Standard Deviation
Max Value BSRMP ESRMP
Min Value
IRI Left (in/mile) 189.05 188.00 83.85 403.00 164.50 164.60 46.00
IRI Right (in/mile) 152.91 148.50 62.69 365.00 165.68 165.78 42.00
IRI Average (in/mile) 170.72 169.50 70.37 364.00 164.50 164.60 50.00
Rut Left (in) 0.37 0.35 0.14 0.72 171.92 172.02 0.12
Rut Right (in) 0.35 0.30 0.18 0.76 165.58 165.68 0.11
Average Faulting (in) 0.10 0.10 0.07 0.41 160.94 161.04 0.00
Number of Faults 6.89 4.00 6.77 28.00 164.40 164.50 0.00
1/8" - 1/4" 22.68 15.50 25.66 100.00 170.69 170.79 0.00
1/4" - 1/2" 4.57 0.00 10.73 52.40 171.29 171.39 0.00
1/2" + 0.83 0.00 4.44 33.30 160.94 161.04 0.00
% o
f Fau
lted
Slab
s
Total 28.09 22.20 29.99 100.00 172.94 173.04 0.00
1 3.84 2.00 4.84 22.00 171.79 171.89 0.00
2 - 3 0.24 0.00 0.69 6.00 176.46 176.56 0.00
Num
ber o
f C
rack
s pe
r Pa
nel
4+ 0.04 0.00 0.27 3.00 164.50 164.60 0.00
1 11.34 5.72 14.09 62.42 171.79 171.89 0.00
2 - 3 0.67 0.00 1.96 17.02 176.46 176.56 0.00
# of
Cra
cks
as
% o
f Tot
al
Slab
s
4+ 0.12 0.00 0.78 8.51 164.50 164.60 0.00
1/8" - 1/4" 7.65 2.84 11.34 45.40 173.34 173.44 0.00
1/4" - 1/2" 2.15 0.00 6.18 48.66 171.29 171.39 0.00
1/2" + 0.14 0.00 0.62 2.90 150.54 150.64 0.00
Faul
ted
Slab
s as
%
of T
otal
Sla
bs
Total 9.94 2.84 15.57 68.40 164.40 164.50 0.00
% PCCP Crack 12.13 5.73 15.26 65.60 161.34 161.44 0.00
Maximum Rut (mm) 10.30 9.14 3.85 19.30 165.58 165.68 3.81
Maximum Rut (in) 0.41 0.36 0.15 0.76 165.58 165.68 0.15
Age Of PCCP 40.52 41.00 1.35 44.00 N/A N/A 39.00
Friction Number N/A N/A N/A N/A N/A N/A N/A
C-11

C-12
Southbound Lane 4 PCCP w/out Rehabilitation MP 143.29 to MP 174.14 (16.30 lane miles)
Average Median Standard Deviation
Max Value BSRMP ESRMP
Min Value
IRI Left (in/mile) 184.54 151.00 100.45 633.00 169.85 169.95 40.00
IRI Right (in/mile) 132.88 126.00 50.02 371.00 150.34 150.44 45.00
IRI Average (in/mile) 158.45 138.00 67.35 452.00 169.85 169.95 44.00
Rut Left (in) 0.27 0.22 0.14 0.66 170.05 170.15 0.10
Rut Right (in) 0.34 0.29 0.15 0.74 172.22 172.32 0.15
Average Faulting (in) 0.11 0.09 0.09 0.69 150.04 150.14 0.00
Number of Faults 5.41 4.00 4.81 23.00 172.94 173.04 0.00
1/8" - 1/4" 20.78 0.00 27.71 100.00 170.59 170.69 0.00
1/4" - 1/2" 4.09 0.00 13.63 100.00 149.94 150.04 0.00
1/2" + 1.40 0.00 6.44 50.00 161.94 162.04 0.00
% o
f Fau
lted
Slab
s
Total 26.28 11.10 32.39 100.00 150.04 150.14 0.00
1 2.56 1.00 4.80 28.00 164.98 165.08 0.00
2 - 3 0.13 0.00 0.51 4.00 172.64 172.74 0.00
Num
ber o
f C
rack
s pe
r Pa
nel
4+ 0.06 0.00 0.42 5.00 172.64 172.74 0.00
1 7.66 2.84 13.92 79.61 164.98 165.08 0.00
2 - 3 0.44 0.00 1.78 11.40 172.64 172.74 0.00
# of
Cra
cks
as
% o
f Tot
al
Slab
s
4+ 0.17 0.00 1.19 14.25 172.64 172.74 0.00
1/8" - 1/4" 4.57 0.00 7.15 39.93 172.94 173.04 0.00
1/4" - 1/2" 0.78 0.00 2.11 11.40 171.69 171.79 0.00
1/2" + 0.19 0.00 0.84 2.90 150.54 150.64 0.00
Faul
ted
Slab
s as
%
of T
otal
Sla
bs
Total 5.54 2.84 8.56 45.63 172.94 173.04 0.00
% PCCP Crack 8.26 2.84 15.14 85.29 164.98 165.08 0.00
Maximum Rut (mm) 8.86 7.62 3.81 18.80 172.22 172.32 4.32
Maximum Rut (in) 0.35 0.30 0.15 0.74 172.22 172.32 0.17
Age Of PCCP 40.53 41.00 1.34 44.00 N/A N/A 39.00
Friction Number N/A N/A N/A N/A N/A N/A N/A

Appendix D – 2004 DBR+DG PCCP Summary Tables
D-1

All Southbound PCCP with Dowel Bar Retrofit and Diamond Grinding MP 144.49 to MP 149.66 (6.04 lane miles)
Average Median Standard Deviation
Max Value BSRMP ESRMP Lane Min Value
IRI Left (in/mile) 61.08 56.00 17.01 113.00 148.28 148.38 SB 2 32.00
IRI Right (in/mile) 52.00 50.00 11.30 90.00 149.46 149.56 SB 2 33.00 IRI Average (in/mile) 56.26 54.00 11.02 84.00 149.36 149.46 SB 2 35.00
Rut Left (in) 0.26 0.23 0.09 0.47 148.78 148.88 SB 2 0.13
Rut Right (in) 0.27 0.26 0.07 0.41 145.82 145.91 SB 2 0.16 Average Faulting (in) 0.03 0.03 0.03 0.23 148.78 148.88 SB 2 0.00
Number of Faults 2.54 2.00 1.54 6.00 147.78 147.88 SB 1 0.00
1/8" - 1/4" 3.39 0.00 15.57 100.00 148.78 148.88 SB 2 0.00
1/4" - 1/2" 0.00 0.00 0.00 0.00 N/A N/A ALL 0.00
1/2" + 0.00 0.00 0.00 0.00 N/A N/A ALL 0.00
Total 3.39 0.00 15.57 100.00 148.78 148.88 SB 2 0.00
1 1.41 0.00 2.33 13.00 149.56 149.66 SB 2 0.00
2 - 3 0.13 0.00 0.43 2.00 149.26 149.36 SB 2 0.00
4+ 0.00 0.00 0.00 0.00 N/A N/A ALL 0.00
1 4.04 0.00 6.68 36.95 149.56 149.66 SB 2 0.00
2 - 3 0.38 0.00 1.23 5.71 149.26 149.36 SB 2 0.00
4+ 0.00 0.00 0.00 0.00 N/A N/A ALL 0.00
1/8" - 1/4" 0.23 0.00 0.94 5.67 149.36 149.46 SB 2 0.00
1/4" - 1/2" 0.00 0.00 0.00 0.00 N/A N/A ALL 0.00
1/2" + 0.00 0.00 0.00 0.00 N/A N/A ALL 0.00
Total 0.23 0.00 0.94 5.67 149.36 149.46 SB 2 0.00
% PCCP Crack 4.42 0.00 7.53 39.80 149.56 149.66 SB 2 0.00
Maximum Rut (mm) 7.70 7.37 1.98 11.94 148.78 148.88 SB 2 4.06
Maximum Rut (in) 0.30 0.29 0.08 0.47 148.78 148.88 SB 2 0.16
Age of PCCP 39.74 36.00 3.92 44.00 N/A N/A both 36.00
Friction Number N/A N/A N/A 46.10 N/A N/A SB 1 33.20
D-2

Southbound Lane 1 PCCP with Dowel Bar Retrofit and Diamond Grinding MP 144.49 to MP 149.66 (3.07 miles)
Average Median Standard Deviation
Max Value BSRMP ESRMP
Min Value
IRI Left (in/mile) 58.35 53.00 13.48 89.00 148.78 148.88 44.00
IRI Right (in/mile) 52.77 54.00 9.36 71.00 146.01 146.11 33.00
IRI Average (in/mile) 55.29 53.00 9.36 76.00 148.78 148.88 38.00
Rut Left (in) 0.21 0.21 0.04 0.28 148.38 148.48 0.13
Rut Right (in) 0.28 0.29 0.06 0.40 147.98 148.08 0.16
Average Faulting (in) 0.03 0.03 0.02 0.07 146.01 146.11 0.00
Number of Faults 2.74 3.00 1.77 6.00 147.78 147.88 0.00
1/8" - 1/4" 1.29 0.00 4.99 20.00 145.91 146.01 0.00
1/4" - 1/2" 0.00 0.00 0.00 0.00 N/A N/A 0.00
1/2" + 0.00 0.00 0.00 0.00 N/A N/A 0.00
% o
f Fau
lted
Slab
s
Total 1.29 0.00 4.99 20.00 145.91 146.01 0.00
1 0.61 0.00 1.17 5.00 144.79 144.89 0.00
2 - 3 0.00 0.00 0.00 0.00 N/A N/A 0.00
Num
ber o
f C
rack
s pe
r Pa
nel
4+ 0.00 0.00 0.00 0.00 N/A N/A 0.00
1 1.75 0.00 3.35 14.26 144.79 144.89 0.00
2 - 3 0.00 0.00 0.00 0.00 N/A N/A 0.00
# of
Cra
cks
as
% o
f Tot
al
Slab
s
4+ 0.00 0.00 0.00 0.00 N/A N/A 0.00
1/8" - 1/4" 0.18 0.00 0.71 2.85 146.01 146.11 0.00
1/4" - 1/2" 0.00 0.00 0.00 0.00 N/A N/A 0.00
1/2" + 0.00 0.00 0.00 0.00 N/A N/A 0.00
Faul
ted
Slab
s as
%
of T
otal
Sla
bs
Total 0.18 0.00 0.71 2.85 146.01 146.11 0.00
% PCCP Crack 1.75 0.00 3.35 14.26 144.79 144.89 0.00
Maximum Rut (mm) 7.28 7.37 1.37 10.16 147.98 148.08 5.08
Maximum Rut (in) 0.29 0.29 0.05 0.40 147.98 148.08 0.20
Age of PCCP 36.00 36.00 0.00 36.00 N/A N/A 36.00
Friction Number 37.08 37.20 3.99 46.10 N/A N/A 33.20
D-3

D-4
Southbound Lane 2 PCCP with Dowel Bar Retrofit and Diamond Grinding MP 144.79 to MP 149.66 (2.97 miles)
Average Median Standard Deviation
Max Value BSRMP ESRMP
Min Value
IRI Left (in/mile) 63.90 61.00 19.86 113.00 148.28 148.38 32.00
IRI Right (in/mile) 51.20 48.50 13.13 90.00 149.46 149.56 36.00
IRI Average (in/mile) 57.27 55.50 12.60 84.00 149.36 149.46 35.00
Rut Left (in) 0.31 0.31 0.10 0.47 148.78 148.88 0.14
Rut Right (in) 0.26 0.26 0.07 0.41 145.82 145.91 0.16
Average Faulting (in) 0.04 0.03 0.04 0.23 148.78 148.88 0.00
Number of Faults 2.33 2.00 1.27 5.00 145.59 145.69 0.00
1/8" - 1/4" 5.56 0.00 21.59 100.00 148.78 148.88 0.00
1/4" - 1/2" 0.00 0.00 0.00 0.00 N/A N/A 0.00
1/2" + 0.00 0.00 0.00 0.00 N/A N/A 0.00
% o
f Fau
lted
Slab
s
Total 5.56 0.00 21.59 100.00 148.78 148.88 0.00
1 2.23 1.50 2.90 13.00 149.56 149.66 0.00
2 - 3 0.27 0.00 0.58 2.00 149.26 149.36 0.00
Num
ber o
f C
rack
s pe
r Pa
nel
4+ 0.00 0.00 0.00 0.00 N/A N/A 0.00
1 6.42 4.26 8.33 36.95 149.56 149.66 0.00
2 - 3 0.77 0.00 1.67 5.71 149.26 149.36 0.00
# of
Cra
cks
as
% o
f Tot
al
Slab
s
4+ 0.00 0.00 0.00 0.00 N/A N/A 0.00
1/8" - 1/4" 0.28 0.00 1.14 5.67 149.36 149.46 0.00
1/4" - 1/2" 0.00 0.00 0.00 0.00 N/A N/A 0.00
1/2" + 0.00 0.00 0.00 0.00 N/A N/A 0.00
Faul
ted
Slab
s as
%
of T
otal
Sla
bs
Total 0.28 0.00 1.14 5.67 149.36 149.46 0.00
% PCCP Crack 7.19 4.26 9.49 39.80 149.56 149.66 0.00
Maximum Rut (mm) 8.14 8.26 2.41 11.94 148.78 148.88 4.06
Maximum Rut (in) 0.32 0.33 0.09 0.47 148.78 148.88 0.16
Age of PCCP 43.60 44.00 1.22 44.00 N/A N/A 40.00
Friction Number N/A N/A N/A N/A N/A N/A N/A

Appendix E – 2004 Diamond Ground PCCP Summary Tables
E-1

All Diamond Ground PCCP MP 154.14 to MP 158.40(26.84 lane miles)
Average MedianStandard Deviation
Max Value BSRMP ESRMP Lane
Min Value
IRI Left (in/mile) 73.63 59.00 46.86 428.00 155.92 156.02 NB 4 29.00
IRI Right (in/mile) 69.80 59.00 36.02 302.00 155.92 156.02 NB 4 35.00
IRI Average (in/mile) 71.47 60.50 38.74 365.00 155.92 156.02 NB 4 33.00
Rut Left (in) 0.17 0.16 0.05 0.32 154.74 154.84 NB 4 0.07
Rut Right (in) 0.19 0.19 0.05 0.41 154.74 154.84 NB 4 0.08
Average Faulting (in) 0.05 0.04 0.05 0.29 155.36 155.46 NB 2 0.00
Number of Faults 2.17 1.00 2.71 17.00 154.34 154.44 NB 1 0.00
1/8" - 1/4" 4.70 0.00 15.43 100.00 N/A N/A NB/SB 0.00
1/4" - 1/2" 1.64 0.00 9.46 75.00 155.36 155.46 NB 2 0.00
1/2" + 0.02 0.00 0.40 6.70 154.44 154.54 NB 1 0.00
% o
f Fau
lted
Slab
s
Total 6.36 0.00 17.98 100.00 N/A N/A NB4,SB2/3 0.00
1 3.56 2.00 4.63 25.00 155.40 155.50 SB 1 0.00
2 - 3 0.33 0.00 0.86 6.00 155.20 155.30 SB 1 0.00
Num
ber o
f C
rack
s pe
r Pa
nel
4+ 0.05 0.00 0.41 5.00 155.36 155.46 NB 1 0.00
1 10.73 5.71 13.89 71.28 155.40 155.50 SB 1 0.00
2 - 3 0.98 0.00 2.60 17.11 155.20 155.30 SB 1 0.00
# of
Cra
cks
as
% o
f Tot
al
Slab
s
4+ 0.14 0.00 1.16 14.21 155.36 155.46 NB 1 0.00
1/8" - 1/4" 0.65 0.00 2.33 17.13 154.54 154.64 NB 3 0.00
1/4" - 1/2" 0.23 0.00 1.40 14.38 155.92 156.02 NB 4 0.00
1/2" + 0.01 0.00 0.17 2.86 157.39 157.49 NB 1 0.00
Faul
ted
Slab
s as
%
of T
otal
Sla
bs
Total 0.89 0.00 2.89 20.14 155.92 156.02 NB 4 0.00
% PCCP Crack 11.85 5.72 15.52 79.83 155.40 155.50 SB 3 0.00
Maximum Rut (mm) 5.14 5.08 1.18 8.40 154.86 154.96 SB 4 2.03
Maximum Rut (in) 0.20 0.20 0.05 0.37 154.86 154.96 SB 4 0.08
Age of PCCP 37.00 37.00 0.00 0.37 N/A N/A N/A 37.00
MP Friction Range N/A N/A N/A 46.90 N/A N/A N/A 29.90
E-2

Northbound Diamond Ground PCCP MP 154.14 to MP 158.21(14.16 lane miles)
Average Median Standard Deviation
Max Value BSRMP ESRMP Lane
Min Value
IRI Left (in/mile) 73.36 58.00 53.35 428.00 155.92 156.02 NB 4 29.00
IRI Right (in/mile) 70.62 60.00 40.28 302.00 155.92 156.02 NB 4 35.00
IRI Average (in/mile) 71.77 60.00 44.45 365.00 155.92 156.02 NB 4 33.00
Rut Left (in) 0.17 0.16 0.05 0.32 154.74 154.84 NB 4 0.07
Rut Right (in) 0.19 0.18 0.05 0.36 154.74 154.84 NB 4 0.09
Average Faulting (in) 0.05 0.04 0.05 0.29 155.36 155.46 NB 2 0.00
Number of Faults 2.79 2.00 3.29 17.00 154.34 154.44 NB 1 0.00
1/8" - 1/4" 3.90 0.00 12.33 100.00 157.69 157.79 NB 4 0.00
1/4" - 1/2" 1.91 0.00 11.04 75.00 155.36 155.46 NB 2 0.00
1/2" + 0.04 0.00 0.55 6.70 154.44 154.54 NB 1 0.00
% o
f Fau
lted
Slab
s
Total 5.86 0.00 16.51 100.00 157.69 157.79 NB 4 0.00
1 3.37 2.00 3.81 22.00 157.89 157.99 NB 3 0.00
2 - 3 0.30 0.00 0.77 5.00 155.36 155.46 NB 1 0.00
Num
ber o
f C
rack
s pe
r Pa
nel
4+ 0.09 0.00 0.56 5.00 155.36 155.46 NB 1 0.00
1 10.50 5.75 12.50 62.99 157.89 157.99 NB 3 0.00
2 - 3 0.92 0.00 2.44 14.21 155.36 155.46 NB 1 0.00
# of
Cra
cks
as
% o
f Tot
al
Slab
s
4+ 0.26 0.00 1.59 14.21 155.36 155.46 NB 1 0.00
1/8" - 1/4" 0.82 0.00 2.92 17.13 154.54 154.64 NB 3 0.00
1/4" - 1/2" 0.34 0.00 1.86 14.38 155.92 156.02 NB 4 0.00
1/2" + 0.02 0.00 0.23 2.86 157.39 157.49 NB 1 0.00
Faul
ted
Slab
s as
%
of T
otal
Sla
bs
Total 1.18 0.00 3.68 20.14 155.92 156.02 NB 4 0.00
% PCCP Crack 11.68 8.53 14.23 68.70 157.89 157.99 NB 3 0.00
Maximum Rut (mm) 5.12 4.83 1.13 9.14 154.74 154.84 NB 4 2.79
Maximum Rut (in) 0.20 0.19 0.04 0.36 154.74 154.84 NB 4 0.11
Age of PCCP 37.00 37.00 0.00 37.00 N/A N/A N/A 37.00
MP Friction Range N/A N/A N/A 36.20 N/A N/A N/A 29.90
E-3

Southbound Diamond Ground PCCP MP 154.76 MP 158.40(12.68 lane miles)
Average Median Standard Deviation
Max Value BSRMP ESRMP Lane
Min Value
IRI Left (in/mile) 73.93 61.00 38.52 298.00 157.26 157.36 SB 2 34.00
IRI Right (in/mile) 68.88 58.00 30.70 182.00 157.66 157.76 SB 3 35.00
IRI Average (in/mile) 71.13 61.00 31.30 173.00 157.26 157.36 SB 2 38.00
Rut Left (in) 0.17 0.17 0.04 0.30 155.20 155.30 SB 3 0.07
Rut Right (in) 0.20 0.20 0.05 0.33 154.56 154.66 SB 4 0.08
Average Faulting (in) 0.04 0.04 0.04 0.16 157.96 158.06 SB 1 0.00
Number of Faults 1.48 1.00 1.59 7.00 156.24 156.34 SB 2 0.00
1/8" - 1/4" 5.58 0.00 18.29 100.00 N/A N/A SB2/3 0.00
1/4" - 1/2" 1.34 0.00 7.32 50.00 157.96 158.06 SB 1 0.00
1/2" + 0.00 0.00 0.00 0.00 N/A N/A 0.00
% o
f Fau
lted
Slab
s
Total 6.92 0.00 19.55 100.00 N/A N/A SB2/3 0.00
1 3.76 2.00 5.40 25.00 155.40 155.50 SB 1 0.00
2 - 3 0.36 0.00 0.96 6.00 155.20 155.30 SB 1 0.00
Num
ber o
f C
rack
s pe
r Pa
nel
4+ 0.00 0.00 0.00 0.00 N/A N/A N/A 0.00
1 11.00 5.69 15.34 71.28 155.40 155.50 SB 1 0.00
2 - 3 1.04 0.00 2.77 17.11 155.20 155.30 SB 1 0.00
# of
Cra
cks
as
% o
f Tot
al
Slab
s
4+ 0.00 0.00 0.00 0.00 N/A N/A N/A 0.00
1/8" - 1/4" 0.46 0.00 1.38 8.58 156.24 156.34 SB 2 0.00
1/4" - 1/2" 0.11 0.00 0.54 2.88 157.96 158.06 SB 1 0.00
1/2" + 0.00 0.00 0.00 0.00 N/A N/A N/A 0.00
Faul
ted
Slab
s as
%
of T
otal
Sla
bs
Total 0.56 0.00 1.57 11.44 156.24 156.34 SB 2 0.00
% PCCP Crack 12.04 5.71 16.90 79.83 155.40 155.50 SB 3 0.00
Maximum Rut (mm) 5.17 5.08 1.24 8.40 154.86 154.96 SB 4 2.03
Maximum Rut (in) 0.20 0.20 0.05 0.37 154.86 154.96 SB 4 0.08
Age of PCCP 37.00 37.00 0.00 0.37 N/A N/A N/A 37.00
MP Friction Range N/A N/A N/A 46.90 N/A N/A N/A 35.10
E-4

Northbound Lane 1 Diamond Ground PCCP MP 154.10 to MP 158.21(3.74 lane miles)
Average Median Standard Deviation
Max Value BSRMP ESRMP
Min Value
IRI Left (in/mile) 81.30 61.00 48.26 265.00 154.64 154.74 39.00
IRI Right (in/mile) 90.23 71.50 44.52 215.00 156.59 156.69 37.00
IRI Average (in/mile) 85.60 67.50 42.77 211.00 154.64 154.74 40.00
Rut Left (in) 0.16 0.15 0.04 0.26 155.36 155.46 0.09
Rut Right (in) 0.19 0.19 0.06 0.28 157.69 157.79 0.11
Average Faulting (in) 0.06 0.05 0.05 0.23 154.44 154.54 0.00
Number of Faults 4.33 3.00 4.26 17.00 154.34 154.44 0.00
1/8" - 1/4" 4.80 0.00 10.51 40.00 154.44 154.54 0.00
1/4" - 1/2" 1.32 0.00 5.65 33.30 155.26 155.36 0.00
1/2" + 0.17 0.00 1.06 6.70 154.44 154.54 0.00
% o
f Fau
lted
Slab
s
Total 6.29 0.00 12.46 46.70 154.44 154.54 0.00
1 2.38 2.00 2.45 10.00 156.12 156.22 0.00
2 - 3 0.33 0.00 0.97 5.00 155.36 155.46 0.00
Num
ber o
f C
rack
s pe
r Pa
nel
4+ 0.13 0.00 0.79 5.00 155.36 155.46 0.00
1 8.23 5.71 12.24 28.49 156.12 156.22 0.00
2 - 3 0.92 0.00 2.76 14.21 155.36 155.46 0.00
# of
Cra
cks
as
% o
f Tot
al
Slab
s
4+ 0.36 0.00 2.25 14.21 155.36 155.46 0.00
1/8" - 1/4" 1.81 0.00 4.64 17.10 154.44 154.54 0.00
1/4" - 1/2" 0.28 0.00 1.08 5.69 155.26 155.36 0.00
1/2" + 0.07 0.00 0.45 2.86 157.39 157.49 0.00
Faul
ted
Slab
s as
%
of T
otal
Sla
bs
Total 2.17 0.00 5.03 20.00 154.44 154.54 0.00
% PCCP Crack 9.50 5.71 13.80 45.50 155.36 155.46 0.00
Maximum Rut (mm) 5.19 4.95 1.26 7.10 157.69 157.79 3.05
Maximum Rut (in) 0.20 0.19 0.05 0.28 157.69 157.79 0.12
Age of PCCP 37.00 37.00 0.00 37.00 N/A N/A 37.00
MP Friction Range 34.41 35.30 2.30 36.20 N/A N/A 29.90
E-5

Northbound Lane 2 Diamond Ground PCCP MP 154.14 to MP 158.21(3.40 lane miles)
Average Median Standard Deviation
Max Value BSRMP ESRMP
Min Value
IRI Left (in/mile) 66.42 57.50 29.16 182.00 155.36 155.46 29.00
IRI Right (in/mile) 65.08 64.00 26.47 152.00 156.59 156.69 36.00
IRI Average (in/mile) 65.53 62.00 25.87 153.00 155.36 155.46 33.00
Rut Left (in) 0.17 0.17 0.05 0.28 155.06 155.16 0.09
Rut Right (in) 0.17 0.15 0.05 0.32 155.06 155.16 0.09
Average Faulting (in) 0.05 0.03 0.05 0.29 155.36 155.46 0.00
Number of Faults 2.64 1.00 3.07 14.00 154.54 154.64 0.00
1/8" - 1/4" 2.43 0.00 9.04 42.90 154.54 154.64 0.00
1/4" - 1/2" 2.08 0.00 12.50 75.00 155.36 155.46 0.00
1/2" + 0.00 0.00 0.00 0.00 N/A N/A 0.00
% o
f Fau
lted
Slab
s
Total 4.51 0.00 15.09 75.00 155.36 155.46 0.00
1 4.53 4.00 3.33 12.00 157.29 157.39 0.00
2 - 3 0.39 0.00 0.80 3.00 157.29 157.39 0.00
Num
ber o
f C
rack
s pe
r Pa
nel
4+ 0.22 0.00 0.76 4.00 155.36 155.46 0.00
1 13.31 11.38 9.27 34.09 157.29 157.39 0.00
2 - 3 1.11 0.00 2.29 8.56 157.89 157.99 0.00
# of
Cra
cks
as
% o
f Tot
al
Slab
s
4+ 0.63 0.00 2.16 11.36 155.36 155.46 0.00
1/8" - 1/4" 0.63 0.00 2.90 17.13 154.54 154.64 0.00
1/4" - 1/2" 0.24 0.00 1.42 8.52 155.36 155.46 0.00
1/2" + 0.00 0.00 0.00 0.00 N/A N/A 0.00
Faul
ted
Slab
s as
%
of T
otal
Sla
bs
Total 0.87 0.00 3.19 17.13 154.54 154.64 0.00
% PCCP Crack 15.05 12.77 10.99 42.61 157.29 157.39 0.00
Maximum Rut (mm) 4.88 4.70 1.19 8.13 155.06 155.16 2.79
Maximum Rut (in) 0.19 0.18 0.05 0.32 155.06 155.16 0.11
Age of PCCP 37.00 37.00 0.00 37.00 N/A N/A 37.00
MP Friction Range N/A N/A N/A N/A N/A N/A N/A
E-6

Northbound Lane 3 Diamond Ground PCCP MP 154.14 to MP 158.21(3.40 lane miles)
Average Median Standard Deviation
Max Value BSRMP ESRMP
Min Value
IRI Left (in/mile) 70.56 65.50 26.35 144.00 154.54 154.64 38.00
IRI Right (in/mile) 60.11 56.50 14.01 95.00 154.54 154.64 45.00
IRI Average (in/mile) 65.06 60.50 17.76 118.00 154.54 154.64 43.00
Rut Left (in) 0.19 0.18 0.04 0.31 155.66 155.76 0.11
Rut Right (in) 0.20 0.19 0.04 0.31 155.66 155.76 0.10
Average Faulting (in) 0.04 0.04 0.02 0.09 156.49 156.59 0.00
Number of Faults 1.83 1.00 2.09 11.00 154.54 154.64 0.00
1/8" - 1/4" 3.49 0.00 11.16 50.00 156.49 156.59 0.00
1/4" - 1/2" 0.00 0.00 0.00 0.00 N/A N/A 0.00
1/2" + 0.00 0.00 0.00 0.00 N/A N/A 0.00
% o
f Fau
lted
Slab
s
Total 3.49 0.00 11.16 50.00 156.49 156.59 0.00
1 5.56 4.00 5.28 22.00 157.89 157.99 0.00
2 - 3 0.42 0.00 0.84 3.00 157.69 157.79 0.00
Num
ber o
f C
rack
s pe
r Pa
nel
4+ 0.03 0.00 0.17 1.00 154.54 154.64 0.00
1 17.23 14.20 16.41 62.99 157.89 157.99 0.00
2 - 3 1.50 0.00 3.21 5.57 156.69 156.79 0.00
# of
Cra
cks
as
% o
f Tot
al
Slab
s
4+ 0.08 0.00 0.48 2.85 154.54 154.64 0.00
1/8" - 1/4" 0.32 0.00 0.91 2.87 156.49 156.59 0.00
1/4" - 1/2" 0.00 0.00 0.00 0.00 N/A N/A 0.00
1/2" + 0.00 0.00 0.00 0.00 N/A N/A 0.00
Faul
ted
Slab
s as
%
of T
otal
Sla
bs
Total 0.32 0.00 0.91 2.87 154.54 154.64 0.00
% PCCP Crack 18.81 14.22 18.97 68.70 157.89 157.99 0.00
Maximum Rut (mm) 5.42 5.59 0.88 7.87 155.66 155.76 4.06
Maximum Rut (in) 0.21 0.22 0.03 0.31 155.66 155.76 0.16
Age of PCCP 37.00 37.00 0.00 37.00 N/A N/A 37.00
MP Friction Range N/A N/A N/A N/A N/A N/A N/A
E-7

Northbound Lane 4 Diamond Ground PCCP MP 154.14 to MP 158.21(3.62 lane miles)
Average Median Standard Deviation
Max Value BSRMP ESRMP
Min Value
IRI Left (in/mile) 74.23 50.00 85.45 428.00 155.92 156.02 33.00
IRI Right (in/mile) 65.33 52.00 54.55 302.00 155.92 156.02 35.00
IRI Average (in/mile) 69.56 52.00 68.77 365.00 155.92 156.02 34.00
Rut Left (in) 0.16 0.14 0.06 0.32 154.74 154.84 0.07
Rut Right (in) 0.19 0.18 0.04 0.36 154.74 154.84 0.12
Average Faulting (in) 0.05 0.04 0.08 0.21 157.69 157.79 0.00
Number of Faults 2.23 1.00 2.78 14.00 155.92 156.02 0.00
1/8" - 1/4" 4.73 0.00 17.11 100.00 157.69 157.79 0.00
1/4" - 1/2" 4.12 0.00 17.20 35.70 155.92 156.02 0.00
1/2" + 0.00 0.00 0.00 0.00 N/A N/A 0.00
% o
f Fau
lted
Slab
s
Total 8.85 0.00 23.99 100.00 157.69 157.79 0.00
1 1.31 0.00 2.04 8.00 154.54 154.64 0.00
2 - 3 0.08 0.00 0.27 1.00 155.92 156.02 0.00
Num
ber o
f C
rack
s pe
r Pa
nel
4+ 0.00 0.00 0.00 0.00 N/A N/A 0.00
1 4.01 0.00 6.04 22.74 154.54 154.64 0.00
2 - 3 0.22 0.00 0.77 2.88 155.92 156.02 0.00
# of
Cra
cks
as
% o
f Tot
al
Slab
s
4+ 0.00 0.00 0.00 0.00 N/A N/A 0.00
1/8" - 1/4" 0.44 0.00 1.24 5.76 155.92 156.02 0.00
1/4" - 1/2" 0.80 0.00 3.20 14.38 155.92 156.02 0.00
1/2" + 0.00 0.00 0.00 0.00 N/A N/A 0.00
Faul
ted
Slab
s as
%
of T
otal
Sla
bs
Total 1.24 0.00 3.92 20.14 155.92 156.02 0.00
% PCCP Crack 4.23 0.00 6.35 25.59 154.54 154.64 0.00
Maximum Rut (mm) 4.98 4.83 1.11 9.14 154.74 154.84 3.05
Maximum Rut (in) 0.20 0.19 0.04 0.36 154.74 154.84 0.12
Age of PCCP 37.00 37.00 0.00 37.00 N/A N/A 37.00
MP Friction Range N/A N/A N/A N/A N/A N/A N/A
E-8

Southbound Lane 1 Diamond Ground PCCP MP 154.76 to MP 158.36(3.14 lane miles)
Average Median Standard Deviation
Max Value BSRMP ESRMP
Min Value
IRI Left (in/mile) 81.94 66.00 35.38 169.00 156.24 156.34 36.00
IRI Right (in/mile) 87.09 79.00 33.04 164.00 155.10 155.20 43.00
IRI Average (in/mile) 84.24 75.00 32.29 158.00 158.00 156.24 41.00
Rut Left (in) 0.15 0.15 0.04 0.22 157.96 158.06 0.07
Rut Right (in) 0.17 0.17 0.06 0.29 155.40 155.50 0.08
Average Faulting (in) 0.06 0.05 0.04 0.16 157.96 158.06 0.00
Number of Faults 2.09 2.00 1.65 6.00 154.76 154.86 0.00
1/8" - 1/4" 5.35 0.00 14.67 66.70 157.46 157.56 0.00
1/4" - 1/2" 4.04 0.00 13.19 50.00 157.96 158.06 0.00
1/2" + 0.00 0.00 0.00 0.00 N/A N/A 0.00
% o
f Fau
lted
Slab
s
Total 9.39 0.00 18.57 66.70 157.46 157.56 0.00
1 5.94 1.00 8.10 25.00 155.40 155.50 0.00
2 - 3 0.58 0.00 1.35 6.00 155.20 155.30 0.00
Num
ber o
f C
rack
s pe
r Pa
nel
4+ 0.00 0.00 0.00 0.00 N/A N/A 0.00
1 17.04 2.85 23.05 71.28 155.40 155.50 0.00
2 - 3 1.64 0.00 3.84 17.11 155.20 155.30 0.00
# of
Cra
cks
as
% o
f Tot
al
Slab
s
4+ 0.00 0.00 0.00 0.00 N/A N/A 0.00
1/8" - 1/4" 0.61 0.00 1.55 5.70 157.46 157.56 0.00
1/4" - 1/2" 0.26 0.00 0.84 2.88 157.96 158.06 0.00
1/2" + 0.00 0.00 0.00 0.00 N/A N/A 0.00
Faul
ted
Slab
s as
%
of T
otal
Sla
bs
Total 0.87 0.00 1.67 5.70 157.46 157.56 0.00
% PCCP Crack 18.68 2.85 25.80 79.83 155.40 155.50 0.00
Maximum Rut (mm) 4.60 4.32 1.36 7.37 155.30 155.40 2.03
Maximum Rut (in) 0.18 0.17 0.05 0.29 155.30 155.40 0.08
Age of PCCP 37.00 37.00 0.00 37.00 N/A N/A 37.00
MP Friction Range 38.69 36.30 4.76 46.90 N/A N/A 35.10
E-9

Southbound Lane 2 Diamond Ground PCCP MP 154.76 to MP 158.40(3.18 lane miles)
Average Median Standard Deviation
Max Value BSRMP ESRMP
Min Value
IRI Left (in/mile) 79.06 65.00 50.80 298.00 157.26 157.36 39.00
IRI Right (in/mile) 64.00 57.00 25.06 144.00 156.24 156.34 36.00
IRI Average (in/mile) 71.29 64.00 32.44 173.00 157.26 157.36 41.00
Rut Left (in) 0.16 0.16 0.03 0.23 154.86 154.96 0.11
Rut Right (in) 0.19 0.19 0.04 0.27 155.00 155.10 0.10
Average Faulting (in) 0.04 0.04 0.04 0.16 157.36 157.46 0.00
Number of Faults 1.35 1.00 1.79 7.00 156.24 156.34 0.00
1/8" - 1/4" 9.04 0.00 24.94 100.00 156.16 156.26 0.00
1/4" - 1/2" 0.42 0.00 2.45 14.30 156.24 156.34 0.00
1/2" + 0.00 0.00 0.00 0.00 N/A N/A 0.00
% o
f Fau
lted
Slab
s
Total 9.46 0.00 25.64 100.00 156.16 156.26 0.00
1 2.97 2.00 3.48 13.00 156.56 157.76 0.00
2 - 3 0.53 0.00 1.13 4.00 156.56 157.76 0.00
Num
ber o
f C
rack
s pe
r Pa
nel
4+ 0.00 0.00 0.00 0.00 N/A N/A 0.00
1 8.57 5.71 9.89 37.14 156.56 157.66 0.00
2 - 3 1.63 0.00 3.35 11.52 154.76 154.86 0.00
# of
Cra
cks
as
% o
f Tot
al
Slab
s
4+ 0.00 0.00 0.00 0.00 N/A N/A 0.00
1/8" - 1/4" 0.67 0.00 1.73 8.58 156.24 156.34 0.00
1/4" - 1/2" 0.08 0.00 0.49 2.86 156.24 156.34 0.00
1/2" + 0.00 0.00 0.00 0.00 N/A N/A 0.00
Faul
ted
Slab
s as
%
of T
otal
Sla
bs
Total 0.75 0.00 2.14 11.44 156.24 156.34 0.00
% PCCP Crack 10.19 8.56 11.47 48.57 157.66 157.76 0.00
Maximum Rut (mm) 4.83 4.70 0.88 6.86 155.00 155.10 3.56
Maximum Rut (in) 0.19 0.18 0.03 0.27 155.00 155.10 0.14
Age of PCCP 37.00 37.00 0.00 37.00 N/A N/A 37.00
MP Friction Range N/A N/A N/A N/A N/A N/A N/A
E-10

Southbound Lane 3 Diamond Ground PCCP MP 154.76 to MP 158.40(3.08 lane miles)
Average Median Standard Deviation
Max Value BSRMP ESRMP
Min Value
IRI Left (in/mile) 66.55 58.00 29.29 159.00 157.56 157.66 34.00
IRI Right (in/mile) 64.45 56.00 29.18 182.00 157.66 157.76 37.00
IRI Average (in/mile) 65.27 58.00 27.28 168.00 157.66 157.76 38.00
Rut Left (in) 0.20 0.20 0.04 0.30 155.20 155.30 0.12
Rut Right (in) 0.21 0.21 0.04 0.29 155.30 155.40 0.13
Average Faulting (in) 0.03 0.03 0.04 0.14 155.30 155.40 0.00
Number of Faults 1.21 1.00 1.39 5.00 157.46 157.56 0.00
1/8" - 1/4" 3.03 0.00 17.41 100.00 155.30 155.40 0.00
1/4" - 1/2" 1.01 0.00 5.80 33.30 157.66 157.76 0.00
1/2" + 0.00 0.00 0.00 0.00 N/A N/A 0.00
% o
f Fau
lted
Slab
s
Total 4.04 0.00 18.17 100.00 155.30 155.40 0.00
1 4.30 3.00 4.63 19.00 157.66 157.76 0.00
2 - 3 0.27 0.00 0.67 3.00 154.76 154.86 0.00
Num
ber o
f C
rack
s pe
r Pa
nel
4+ 0.00 0.00 0.00 0.00 N/A N/A 0.00
1 12.55 8.51 12.99 54.16 176.56 176.66 0.00
2 - 3 0.77 0.00 1.92 8.56 154.76 154.86 0.00
# of
Cra
cks
as %
of T
otal
Sl
abs
4+ 0.00 0.00 0.00 0.00 N/A N/A 0.00
1/8" - 1/4" 0.09 0.00 0.49 2.84 155.30 155.40 0.00
1/4" - 1/2" 0.09 0.00 0.50 2.85 157.66 157.76 0.00
1/2" + 0.00 0.00 0.00 0.00 N/A N/A 0.00
Faul
ted
Slab
s as
%
of T
otal
Sla
bs
Total 0.17 0.00 0.69 2.85 157.66 157.76 0.00
% PCCP Crack 13.32 8.51 13.99 57.01 157.66 157.76 0.00
Maximum Rut (mm) 5.58 5.59 1.02 7.62 155.20 155.30 3.56
Maximum Rut (in) 0.22 0.22 0.04 0.30 155.20 155.30 0.14
Age of PCCP 37.00 37.00 0.00 37.00 N/A N/A 37.00
MP Friction Range N/A N/A N/A N/A N/A N/A N/A
E-11

E-12
Southbound Lane 4 Diamond Ground PCCP MP 154.76 to MP 158.40(3.28 lane miles)
Average Median Standard Deviation
Max Value BSRMP ESRMP
Min Value
IRI Left (in/mile) 68.34 55.00 34.42 147.00 157.46 157.56 36.00
IRI Right (in/mile) 60.63 50.00 29.02 148.00 156.24 156.34 35.00
IRI Average (in/mile) 64.14 52.00 30.13 146.00 156.24 156.34 39.00
Rut Left (in) 0.18 0.18 0.03 0.23 155.60 155.70 0.13
Rut Right (in) 0.22 0.20 0.06 0.33 154.56 154.66 0.12
Average Faulting (in) 0.03 0.03 0.04 0.12 157.56 157.66 0.00
Number of Faults 1.29 1.00 1.43 5.00 157.66 157.76 0.00
1/8" - 1/4" 4.86 0.00 14.42 50.00 156.24 156.34 0.00
1/4" - 1/2" 0.00 0.00 0.00 0.00 N/A N/A 0.00
1/2" + 0.00 0.00 0.00 0.00 N/A N/A 0.00
% o
f Fau
lted
Slab
s
Total 4.86 0.00 14.42 50.00 156.24 156.34 0.00
1 1.97 1.00 3.50 19.00 157.56 157.66 0.00
2 - 3 0.06 0.00 0.24 1.00 155.20 155.30 0.00
Num
ber o
f C
rack
s pe
r Pa
nel
4+ 0.00 0.00 0.00 0.00 N/A N/A 0.00
1 6.21 2.86 10.30 54.24 157.56 157.66 0.00
2 - 3 0.16 0.00 0.65 2.84 155.20 155.30 0.00
# of
Cra
cks
as
% o
f Tot
al
Slab
s
4+ 0.00 0.00 0.00 0.00 N/A N/A 0.00
1/8" - 1/4" 0.46 0.00 1.37 5.71 155.94 156.04 0.00
1/4" - 1/2" 0.00 0.00 0.00 0.00 N/A N/A 0.00
1/2" + 0.00 0.00 0.00 0.00 N/A N/A 0.00
Faul
ted
Slab
s as
%
of T
otal
Sla
bs
Total 0.46 0.00 1.37 5.71 155.94 156.04 0.00
% PCCP Crack 6.36 5.35 10.28 54.24 156.56 156.66 0.00
Maximum Rut (mm) 5.65 5.33 1.32 8.40 154.86 154.96 4.06
Maximum Rut (in) 0.22 0.21 0.05 0.37 154.86 154.96 0.16
Age of PCCP 37.00 37.00 0.00 37.00 N/A N/A 37.00
MP Friction Range N/A N/A N/A N/A N/A N/A N/A

Appendix F – Type and Year of Construction PCCP Summary Tables
F-1

Northbound and Southbound 1962 PCCP 0.75', UB 0.75' MP 139.50 to 149.32 ( 29.86 lane miles)
Average Median Standard Deviation
Max Value
Min Value
IRI Left (in/mile) 214.03 190.50 87.61 493.00 39.00
IRI Right (in/mile) 172.21 156.50 59.62 418.00 54.00
IRI Average (in/mile) 192.88 176.00 69.58 411.00 46.00
Rut Left (in) 0.36 0.36 0.17 0.79 0.06
Rut Right (in) 0.39 0.38 0.17 0.74 0.12
Average Faulting (in) 0.12 0.10 0.07 0.72 0.00
Number of Faults 9.93 7.00 8.23 34.00 0.00
1/8" - 1/4" 21.47 14.30 23.03 100.00 0.00 1/4" - 1/2" 5.33 0.00 12.41 75.80 0.00
1/2" + 0.72 0.00 3.90 40.00 0.00
% o
f Fau
lted
Slab
s
Total 27.51 20.00 28.79 100.00 0.00 1 1.78 1.00 2.84 16.00 0.00
2 - 3 0.11 0.00 0.52 6.00 0.00
Num
ber o
f C
rack
s pe
r Pa
nel
4+ 0.04 0.00 0.38 6.00 0.00 1 5.11 2.84 8.12 79.90 0.00
2 - 3 0.32 0.00 1.48 65.70 0.00
# of
Cra
cks
as %
of
Tota
l Sla
bs
4+ 0.10 0.00 1.09 17.00 0.00 1/8" - 1/4" 8.95 2.85 13.28 68.13 0.00 1/4" - 1/2" 3.17 0.00 8.90 71.35 0.00
1/2" + 0.17 0.00 0.75 0.00 0.00
Faul
ted
Slab
s as
%
of T
otal
Sla
bs
Total 12.29 2.86 19.24 79.95 0.00
% PCCP Crack 5.54 2.84 9.14 94.30 0.00
Maximum Rut (mm) 9.55 9.14 4.48 20.07 1.52
Maximum Rut (in) 0.38 0.36 0.18 0.79 0.06
F-2

Northbound and Southbound 1963 PCCP 0.75', UB 0.67 MP 170.50 to MP 170.80 (1.40 lane miles)
Average MedianStandard Deviation
Max Value
Min Value
IRI Left (in/mile) 233.21 231.50 44.39 296.00 148.00
IRI Right (in/mile) 155.21 151.50 22.94 202.00 123.00
IRI Average (in/mile) 194.00 196.00 31.66 249.00 135.00
Rut Left (in) 0.53 0.52 0.08 0.66 0.43
Rut Right (in) 0.51 0.52 0.05 0.58 0.41
Average Faulting (in) 0.12 0.12 0.04 0.19 0.05
Number of Faults 5.79 4.00 3.47 13.00 2.00
1/8" - 1/4" 34.63 24.05 32.64 100.00 0.00 1/4" - 1/2" 2.86 0.00 6.11 20.00 0.00
1/2" + 0.00 0.00 0.00 0.00 0.00
% o
f Fau
lted
Slab
s
Total 37.49 30.00 32.30 100.00 0.00 1 5.07 3.50 5.34 16.00 0.00
2 - 3 0.64 0.00 0.93 3.00 0.00
Num
ber o
f C
rack
s pe
r Pa
nel
4+ 0.00 0.00 0.00 0.00 0.00 1 14.43 9.98 15.17 79.90 0.00
2 - 3 1.83 0.00 2.64 65.70 0.00
# of
Cra
cks
as %
of
Tota
l Sla
bs
4+ 0.00 0.00 0.00 17.00 0.00 1/8" - 1/4" 4.68 5.68 3.28 8.56 0.00 1/4" - 1/2" 0.81 0.00 1.74 5.70 0.00
1/2" + 0.00 0.00 0.00 0.00 0.00
Faul
ted
Slab
s as
%
of T
otal
Sla
bs
Total 5.49 5.69 4.25 14.26 0.00
% PCCP Crack 16.25 12.84 16.54 94.30 0.00
Maximum Rut (mm) 13.92 13.59 1.66 16.76 11.43
Maximum Rut (in) 0.55 0.53 0.07 0.66 0.45
F-3

Northbound and Southbound 1964 PCCP 0.75', UB 0.67 MP 167.18 to MP 168.34 (4.24 lane miles)
Average MedianStandard Deviation
Max Value
Min Value
IRI Left (in/mile) 253.17 245.00 68.31 408.00 130.00
IRI Right (in/mile) 179.49 170.00 40.51 325.00 110.00
IRI Average (in/mile) 216.17 219.00 46.81 366.00 120.00
Rut Left (in) 0.42 0.44 0.13 0.64 0.18
Rut Right (in) 0.46 0.49 0.11 0.64 0.20
Average Faulting (in) 0.12 0.11 0.05 0.33 0.05
Number of Faults 7.74 7.00 4.61 18.00 1.00
1/8" - 1/4" 24.96 27.30 19.28 66.70 0.00 1/4" - 1/2" 3.94 0.00 8.80 44.40 0.00
1/2" + 0.78 0.00 3.76 20.00 0.00
% o
f Fau
lted
Slab
s
Total 29.69 33.30 22.41 66.70 0.00 1 3.11 2.00 3.42 11.00 0.00
2 - 3 0.51 0.00 1.21 6.00 0.00
Num
ber o
f C
rack
s pe
r Pa
nel
4+ 0.02 0.00 0.15 1.00 0.00 1 9.52 5.73 10.58 79.90 0.00
2 - 3 1.70 0.00 3.93 65.70 0.00
# of
Cra
cks
as %
of
Tota
l Sla
bs
4+ 0.06 0.00 0.42 17.00 0.00 1/8" - 1/4" 6.84 5.74 5.83 19.99 0.00 1/4" - 1/2" 1.24 0.00 2.60 11.46 0.00
1/2" + 0.21 0.00 1.01 0.00 0.00
Faul
ted
Slab
s as
%
of T
otal
Sla
bs
Total 8.29 8.56 7.07 22.82 0.00
% PCCP Crack 11.28 5.73 12.87 94.30 0.00
Maximum Rut (mm) 12.53 13.46 2.59 16.26 5.08
Maximum Rut (in) 0.49 0.53 0.10 0.64 0.20
F-4

Northbound 1965 PCCP 0.75', CTB 0.17', UB 0.42' MP 174.64 to MP 177.79 (9.12 lane miles)
Average MedianStandard Deviation
Max Value
Min Value
IRI Left (in/mile) 166.98 152.50 53.66 511.00 86.00
IRI Right (in/mile) 134.53 122.00 38.45 280.00 90.00
IRI Average (in/mile) 150.46 137.00 42.55 307.00 92.00
Rut Left (in) 0.29 0.31 0.10 0.53 0.12
Rut Right (in) 0.31 0.29 0.10 0.59 0.15
Average Faulting (in) 0.09 0.09 0.05 0.24 0.00
Number of Faults 6.68 5.00 5.68 28.00 0.00
1/8" - 1/4" 19.03 12.50 23.06 100.00 0.00 1/4" - 1/2" 3.33 0.00 9.72 50.00 0.00
1/2" + 0.04 0.00 0.41 4.00 0.00
% o
f Fau
lted
Slab
s
Total 22.41 16.70 25.22 100.00 0.00 1 4.90 3.00 5.06 20.00 0.00
2 - 3 0.94 0.00 1.91 9.00 0.00
Num
ber o
f C
rack
s pe
r Pa
nel
4+ 0.04 0.00 0.32 3.00 0.00 1 14.58 9.98 14.63 79.90 0.00
2 - 3 2.75 0.00 5.70 39.90 0.00
# of
Cra
cks
as %
of
Tota
l Sla
bs
4+ 0.12 0.00 0.92 17.00 0.00 1/8" - 1/4" 4.57 2.85 6.73 34.23 0.00 1/4" - 1/2" 1.45 0.00 5.77 39.95 0.00
1/2" + 0.03 0.00 0.32 3.17 0.00
Faul
ted
Slab
s as
%
of T
otal
Sla
bs
Total 6.06 2.85 11.20 71.34 0.00
% PCCP Crack 17.44 11.41 18.09 88.50 0.00
Maximum Rut (mm) 8.38 8.38 2.48 11.94 4.32
Maximum Rut (in) 0.33 0.33 0.10 0.47 0.17
F-5

Northbound and Southbound 1965 PCCP 0.75', UB 0.59' MP 170.90 to MP 177.65 (5.08 lane miles)
Average MedianStandard Deviation
Max Value
Min Value
IRI Left (in/mile) 227.01 209.00 86.13 518.00 93.00
IRI Right (in/mile) 160.70 142.00 55.56 369.00 75.00
IRI Average (in/mile) 193.59 179.00 66.10 425.00 95.00
Rut Left (in) 0.40 0.40 0.15 0.72 0.10
Rut Right (in) 0.42 0.41 0.15 0.74 0.16
Average Faulting (in) 0.13 0.12 0.08 0.61 0.00
Number of Faults 9.23 7.00 7.57 31.00 0.00
1/8" - 1/4" 28.76 28.60 24.25 100.00 0.00 1/4" - 1/2" 7.83 0.00 13.89 61.90 0.00
1/2" + 1.36 0.00 6.28 50.00 0.00
% o
f Fau
lted
Slab
s
Total 37.95 33.30 30.64 100.00 0.00 1 5.43 4.00 5.21 23.00 0.00
2 - 3 1.12 0.00 2.01 14.00 0.00
Num
ber o
f C
rack
s pe
r Pa
nel
4+ 0.14 0.00 0.51 5.00 0.00 1 16.04 11.43 15.34 79.90 0.00
2 - 3 3.51 0.00 7.73 65.70 0.00
# of
Cra
cks
as %
of
Tota
l Sla
bs
4+ 0.40 0.00 1.46 17.00 0.00 1/8" - 1/4" 10.19 5.69 11.70 56.07 0.00 1/4" - 1/2" 3.85 0.00 8.32 48.47 0.00
1/2" + 0.21 0.00 0.90 2.85 0.00
Faul
ted
Slab
s as
%
of T
otal
Sla
bs
Total 14.25 5.71 18.00 85.62 0.00
% PCCP Crack 19.95 14.27 19.33 94.30 0.00
Maximum Rut (mm) 11.19 10.92 3.70 18.80 4.32
Maximum Rut (in) 0.44 0.43 0.15 0.74 0.17
F-6

Northbound and Southbound 1965 PCCP 0.75', UB 0.67 MP 169.18 to MP 170.25 (7.95 lane miles)
Average MedianStandard Deviation
Max Value
Min Value
IRI Left (in/mile) 252.16 238.00 80.83 633.00 115.00
IRI Right (in/mile) 174.53 166.00 43.50 300.00 108.00
IRI Average (in/mile) 213.14 204.00 51.54 452.00 115.00
Rut Left (in) 0.35 0.33 0.12 0.66 0.14
Rut Right (in) 0.39 0.39 0.13 0.62 0.14
Average Faulting (in) 0.13 0.12 0.06 0.35 0.00
Number of Faults 4.74 4.00 3.24 15.00 0.00
1/8" - 1/4" 32.52 28.60 32.27 100.00 0.00 1/4" - 1/2" 3.30 0.00 8.73 50.00 0.00
1/2" + 1.56 0.00 6.34 33.30 0.00
% o
f Fau
lted
Slab
s
Total 37.37 33.30 33.05 100.00 0.00 1 3.31 2.00 4.41 25.00 0.00
2 - 3 0.28 0.00 0.69 3.00 0.00
Num
ber o
f C
rack
s pe
r Pa
nel
4+ 0.27 0.00 1.22 10.00 0.00 1 9.48 5.69 12.53 79.90 0.00
2 - 3 0.87 0.00 2.20 65.70 0.00
# of
Cra
cks
as %
of
Tota
l Sla
bs
4+ 0.77 0.00 3.48 28.43 0.00 1/8" - 1/4" 5.01 2.85 5.87 25.63 0.00 1/4" - 1/2" 0.59 0.00 1.44 8.55 0.00
1/2" + 0.18 0.00 0.69 0.00 0.00
Faul
ted
Slab
s as
%
of T
otal
Sla
bs
Total 5.77 2.85 6.48 25.64 0.00
% PCCP Crack 11.13 8.51 13.16 94.30 0.00
Maximum Rut (mm) 10.59 9.91 2.97 16.76 3.56
Maximum Rut (in) 0.42 0.39 0.12 0.66 0.14
F-7

Northbound Lane 1 1965 PCCP 0.75', UB 0.92' MP 166.21 to MP 167.08 (0.80 lane miles)
Average MedianStandard Deviation
Max Value
Min Value
IRI Left (in/mile) 189.50 188.00 62.02 511.00 101.00
IRI Right (in/mile) 178.88 164.00 59.86 305.00 122.00
IRI Average (in/mile) 183.88 190.50 51.70 261.00 111.00
Rut Left (in) 0.28 0.29 0.11 0.54 0.13
Rut Right (in) 0.30 0.31 0.08 0.40 0.17
Average Faulting (in) 0.14 0.13 0.04 0.22 0.09
Number of Faults 8.13 7.00 3.18 13.00 5.00
1/8" - 1/4" 38.18 41.65 19.15 60.00 15.40 1/4" - 1/2" 4.69 0.00 13.26 37.50 0.00
1/2" + 0.00 0.00 0.00 0.00 0.00
% o
f Fau
lted
Slab
s
Total 42.86 41.65 25.87 87.50 15.40 1 0.75 0.00 1.39 3.00 0.00
2 - 3 0.00 0.00 0.00 0.00 0.00
Num
ber o
f C
rack
s pe
r Pa
nel
4+ 0.00 0.00 0.00 0.00 0.00 1 2.14 0.00 3.95 8.55 0.00
2 - 3 0.00 0.00 0.00 36.90 0.00
# of
Cra
cks
as %
of
Tota
l Sla
bs
4+ 0.00 0.00 0.00 0.00 0.00 1/8" - 1/4" 8.20 7.13 4.42 17.08 2.85 1/4" - 1/2" 1.07 0.00 3.04 8.58 0.00
1/2" + 0.00 0.00 0.00 0.00 0.00
Faul
ted
Slab
s as
%
of T
otal
Sla
bs
Total 9.27 7.13 6.06 20.03 2.85
% PCCP Crack 2.14 0.00 3.95 79.80 0.00
Maximum Rut (mm) 8.00 8.51 2.36 15.00 4.32
Maximum Rut (in) 0.31 0.33 0.09 0.59 0.17
F-8

Northbound 1965 PCCP 0.75', UB 0.92' MP 172.79 to MP 174.54 (6.90 lane miles)
Average MedianStandard Deviation
Max Value
Min Value
IRI Left (in/mile) 196.32 180.00 71.23 511.00 107.00
IRI Right (in/mile) 158.68 142.00 53.18 332.00 103.00
IRI Average (in/mile) 177.25 160.00 59.32 345.00 109.00
Rut Left (in) 0.30 0.28 0.11 0.54 0.11
Rut Right (in) 0.29 0.26 0.08 0.54 0.17
Average Faulting (in) 0.13 0.11 0.05 0.29 0.05
Number of Faults 10.56 9.00 6.83 26.00 1.00
1/8" - 1/4" 27.34 28.60 20.65 75.00 0.00 1/4" - 1/2" 7.36 0.00 13.99 70.80 0.00
1/2" + 1.05 0.00 4.15 25.00 0.00
% o
f Fau
lted
Slab
s
Total 35.75 33.30 26.21 96.10 0.00 1 4.14 2.00 5.17 23.00 0.00
2 - 3 1.68 0.00 3.26 14.00 0.00
Num
ber o
f C
rack
s pe
r Pa
nel
4+ 0.13 0.00 0.41 2.00 0.00 1 12.23 5.71 15.50 79.90 0.00
2 - 3 5.07 0.00 10.06 39.90 0.00
# of
Cra
cks
as %
of
Tota
l Sla
bs
4+ 0.36 0.00 1.17 17.00 0.00 1/8" - 1/4" 10.04 5.71 10.38 37.08 0.00 1/4" - 1/2" 3.57 0.00 8.95 48.47 0.00
1/2" + 0.28 0.00 0.98 5.71 0.00
Faul
ted
Slab
s as
%
of T
otal
Sla
bs
Total 13.89 8.49 16.48 71.25 0.00
% PCCP Crack 17.66 5.71 22.44 88.50 0.00
Maximum Rut (mm) 8.30 7.87 2.33 8.64 4.83
Maximum Rut (in) 0.33 0.31 0.09 0.34 0.19
F-9

Northbound and Southbound 1966 PCCP 0.75', UB 0.67' MP 149.76 to MP 152.59 (16.77 lane miles)
Average MedianStandard Deviation
Max Value
Min Value
IRI Left (in/mile) 161.99 148.00 60.29 354.00 77.00
IRI Right (in/mile) 148.42 128.00 60.60 422.00 76.00
IRI Average (in/mile) 154.99 142.00 55.00 291.00 77.00
Rut Left (in) 0.29 0.31 0.13 0.59 0.09
Rut Right (in) 0.26 0.25 0.12 0.51 0.11
Average Faulting (in) 0.10 0.08 0.09 0.69 0.00
Number of Faults 6.25 5.00 5.18 23.00 0.00
1/8" - 1/4" 14.99 0.00 20.81 100.00 0.00 1/4" - 1/2" 4.94 0.00 14.31 100.00 0.00
1/2" + 1.03 0.00 4.54 33.30 0.00
% o
f Fau
lted
Slab
s
Total 20.95 0.00 27.27 100.00 0.00 1 4.61 2.00 6.23 28.00 0.00
2 - 3 1.10 0.00 2.81 23.00 0.00
Num
ber o
f C
rack
s pe
r Pa
nel
4+ 0.18 0.00 0.82 9.00 0.00 1 13.49 5.71 17.84 79.90 0.00
2 - 3 3.46 0.00 8.93 65.70 0.00
# of
Cra
cks
as %
of
Tota
l Sla
bs
4+ 0.79 0.00 4.73 25.71 0.00 1/8" - 1/4" 4.66 0.00 8.30 45.46 0.00 1/4" - 1/2" 1.51 0.00 5.30 56.71 0.00
1/2" + 0.24 0.00 1.18 11.43 0.00
Faul
ted
Slab
s as
%
of T
otal
Sla
bs
Total 6.41 0.00 12.14 85.07 0.00
% PCCP Crack 17.74 5.71 24.60 94.30 0.00
Maximum Rut (mm) 8.00 8.13 2.95 14.99 2.29
Maximum Rut (in) 0.31 0.32 0.12 0.59 0.09
F-10

Northbound and Southbound 1967 PCCP 0.75', ATB 0.33', UB 0.75' MP 158.46 to MP 162.66 (20.97 lane miles)
Average MedianStandard Deviation
Max Value
Min Value
IRI Left (in/mile) 165.08 159.50 78.87 421.00 40.00
IRI Right (in/mile) 132.93 124.00 64.07 460.00 42.00
IRI Average (in/mile) 148.73 146.00 63.11 434.00 44.00
Rut Left (in) 0.33 0.31 0.16 0.68 0.07
Rut Right (in) 0.31 0.28 0.16 0.64 0.07
Average Faulting (in) 0.08 0.07 0.07 0.47 0.00
Number of Faults 5.38 3.00 6.04 28.00 0.00
1/8" - 1/4" 15.45 0.00 22.51 81.30 0.00 1/4" - 1/2" 3.16 0.00 11.84 100.00 0.00
1/2" + 0.58 0.00 4.22 50.00 0.00
% o
f Fau
lted
Slab
s
Total 19.19 0.00 27.26 100.00 0.00 1 2.69 1.00 4.07 25.00 0.00
2 - 3 0.17 0.00 0.58 5.00 0.00
Num
ber o
f C
rack
s pe
r Pa
nel
4+ 0.04 0.00 0.29 3.00 0.00 1 7.82 2.85 11.70 79.90 0.00
2 - 3 0.59 0.00 2.53 65.70 0.00
# of
Cra
cks
as %
of
Tota
l Sla
bs
4+ 0.12 0.00 0.84 17.00 0.00 1/8" - 1/4" 4.96 0.00 9.56 45.45 0.00 1/4" - 1/2" 0.83 0.00 2.87 28.90 0.00
1/2" + 0.10 0.00 0.54 0.00 0.00
Faul
ted
Slab
s as
%
of T
otal
Sla
bs
Total 5.89 0.00 11.06 57.05 0.00
% PCCP Crack 8.53 2.86 12.76 94.30 0.00
Maximum Rut (mm) 8.98 8.38 3.94 17.27 2.79
Maximum Rut (in) 0.35 0.33 0.16 0.68 0.11
F-11

Northbound and Southbound 1967 PCCP 0.75', UB 0.92' MP 162.70 to MP 166.36 (6.89 lane miles)
Average MedianStandard Deviation
Max Value
Min Value
IRI Left (in/mile) 136.62 122.00 79.21 404.00 37.00
IRI Right (in/mile) 121.15 96.00 71.94 445.00 42.00
IRI Average (in/mile) 128.62 112.50 71.82 424.00 40.00
Rut Left (in) 0.26 0.26 0.09 0.46 0.09
Rut Right (in) 0.24 0.21 0.10 0.54 0.11
Average Faulting (in) 0.09 0.07 0.07 0.41 0.00
Number of Faults 4.95 3.00 5.19 22.00 0.00
1/8" - 1/4" 14.33 0.00 21.99 80.00 0.00 1/4" - 1/2" 3.90 0.00 10.16 50.00 0.00
1/2" + 0.98 0.00 5.94 50.00 0.00
% o
f Fau
lted
Slab
s
Total 19.21 0.00 28.02 100.00 0.00 1 4.39 2.00 5.47 21.00 0.00
2 - 3 0.54 0.00 1.26 8.00 0.00
Num
ber o
f C
rack
s pe
r Pa
nel
4+ 0.11 0.00 0.55 5.00 0.00 1 13.54 5.71 16.81 79.90 0.00
2 - 3 1.73 0.00 3.84 65.70 0.00
# of
Cra
cks
as %
of
Tota
l Sla
bs
4+ 0.35 0.00 1.68 17.00 0.00 1/8" - 1/4" 4.70 0.00 8.50 42.77 0.00 1/4" - 1/2" 1.34 0.00 3.42 17.15 0.00
1/2" + 0.12 0.00 0.64 0.00 0.00
Faul
ted
Slab
s as
%
of T
otal
Sla
bs
Total 6.16 0.00 10.90 54.18 0.00
% PCCP Crack 15.62 8.54 19.09 94.30 0.00
Maximum Rut (mm) 7.36 7.49 2.35 13.72 3.56
Maximum Rut (in) 0.29 0.30 0.09 0.54 0.14
F-12

Southbound 1967 PCCP 0.75', UB 1.08 MP 160.25 to MP 162.72 (7.74 lane miles)
Average MedianStandard Deviation
Max Value
Min Value
IRI Left (in/mile) 108.57 96.00 58.75 316.00 37.00
IRI Right (in/mile) 88.51 83.00 38.79 118.00 42.00
IRI Average (in/mile) 98.28 94.00 46.37 0.00 40.00
Rut Left (in) 0.24 0.21 0.08 0.41 0.10
Rut Right (in) 0.22 0.20 0.07 0.50 0.11
Average Faulting (in) 0.06 0.05 0.07 0.41 0.00
Number of Faults 3.41 2.00 4.09 19.00 0.00
1/8" - 1/4" 8.42 0.00 17.35 75.00 0.00 1/4" - 1/2" 0.47 0.00 2.49 17.60 0.00
1/2" + 1.05 0.00 6.72 50.00 0.00
% o
f Fau
lted
Slab
s
Total 9.95 0.00 19.69 75.00 0.00 1 4.20 2.00 5.44 21.00 0.00
2 - 3 0.48 0.00 1.24 8.00 0.00
Num
ber o
f C
rack
s pe
r Pa
nel
4+ 0.06 0.00 0.29 2.00 0.00 1 12.19 5.68 15.52 59.90 0.00
2 - 3 1.41 0.00 3.57 65.70 0.00
# of
Cra
cks
as %
of
Tota
l Sla
bs
4+ 0.18 0.00 0.84 5.71 0.00 1/8" - 1/4" 2.31 0.00 5.35 28.47 0.00 1/4" - 1/2" 0.18 0.00 1.05 0.00 0.00
1/2" + 0.07 0.00 0.45 0.00 0.00
Faul
ted
Slab
s as
%
of T
otal
Sla
bs
Total 2.57 0.00 5.84 28.47 0.00
% PCCP Crack 13.78 5.68 17.96 94.30 0.00
Maximum Rut (mm) 6.57 5.84 2.04 12.70 3.56
Maximum Rut (in) 0.26 0.23 0.08 0.50 0.14
F-13

F-14
Northbound and Southbound 1969 PCCP 0.75', ATB 0.33', UB 0.58' MP 152.69 to MP 154.14 (8.89 lane miles)
Average MedianStandard Deviation
Max Value
Min Value
IRI Left (in/mile) 141.29 126.50 84.59 340.00 35.00
IRI Right (in/mile) 103.49 100.00 51.53 232.00 36.00
IRI Average (in/mile) 122.15 111.00 66.65 280.00 36.00
Rut Left (in) 0.31 0.27 0.13 0.53 0.08
Rut Right (in) 0.30 0.27 0.13 0.60 0.09
Average Faulting (in) 0.08 0.07 0.06 0.32 0.00
Number of Faults 5.24 3.00 5.75 22.00 0.00
1/8" - 1/4" 14.92 0.00 22.84 100.00 0.00 1/4" - 1/2" 2.91 0.00 8.78 45.50 0.00
1/2" + 0.14 0.00 0.97 8.30 0.00
% o
f Fau
lted
Slab
s
Total 17.97 0.00 27.32 100.00 0.00 1 5.02 3.50 5.34 27.00 0.00
2 - 3 0.54 0.00 1.20 5.00 0.00
Num
ber o
f C
rack
s pe
r Pa
nel
4+ 0.03 0.00 0.17 1.00 0.00 1 10.75 0.00 18.98 79.90 0.00
2 - 3 1.35 0.00 3.30 65.70 0.00
# of
Cra
cks
as %
of
Tota
l Sla
bs
4+ 0.09 0.00 0.49 17.00 0.00 1/8" - 1/4" 5.08 0.00 9.92 43.65 0.00 1/4" - 1/2" 1.31 0.00 4.33 25.68 0.00
1/2" + 0.06 0.00 0.40 0.00 0.00
Faul
ted
Slab
s as
%
of T
otal
Sla
bs
Total 6.45 0.00 12.91 59.66 0.00
% PCCP Crack 18.48 12.82 21.22 94.30 0.00
Maximum Rut (mm) 8.73 7.37 3.33 15.24 3.30
Maximum Rut (in) 0.33 0.28 0.13 0.60 0.12

Appendix G – Map of I-5 Through King County and Sections of Construction
G-1

G-2

G-3

G-4

G-5

G-6

Appendix H – IRI Pavement Distress Plots
H-1

Northbound Lane 1 IRI Value Plots
0
50
100
150
200
250
300
350
400
450
500
550
IRI(i
n/m
ile)
139.
5 - 1
39.6
139.
6 - 1
39.7
139.
7 - 1
39.8
139.
8 - 1
39.9
139.
9 - 1
4014
0 - 1
40.1
140.
2 - 1
40.3
140.
3 - 1
40.4
140.
4 - 1
40.5
140.
5 - 1
40.6
140.
6 - 1
40.7
140.
7 - 1
40.8
140.
8 - 1
40.9
140.
9 - 1
4114
1 - 1
41.1
141.
1 - 1
41.2
141.
3 - 1
41.4
141.
4 - 1
41.5
141.
5 - 1
41.6
141.
7 - 1
41.8
141.
8 - 1
41.9
141.
9 - 1
4214
2.04
- 14
2.14
142.
14 -
142.
2414
2.24
- 14
2.34
142.
34 -
142.
4414
2.44
- 14
2.54
142.
54 -
142.
6414
2.64
- 14
2.74
142.
92 -
143.
0214
3.02
- 14
3.12
143.
12 -
143.
2214
3.22
- 14
3.32
143.
32 -
143.
4214
3.42
- 14
3.52
143.
52 -
143.
6214
3.62
- 14
3.72
143.
72 -
143.
8214
3.82
- 14
3.92
143.
92 -
144.
02
Mile Post
Northbound Lane 1 IRI Values MP 139.50 to MP 144.02
0
50
100
150
200
250
300
350
400
450
500
550
IRI(i
n/m
ile)
144.
02 -
144.
1214
4.12
- 14
4.19
144.
19 -
144.
2914
4.29
- 14
4.39
144.
39 -
144.
4914
4.49
- 14
4.59
Brid
ge -
144.
79 -
144.
8914
4.89
- 14
4.99
144.
99 -
145.
0914
5.09
- 14
5.19
145.
19 -
145.
2914
5.29
- 14
5.39
145.
39 -
145.
4914
5.49
- 14
5.59
145.
59 -
145.
69Br
idge
-
145.
89 -
145.
9914
5.99
- 14
6.09
146.
09 -
146.
1914
6.19
- 14
6.29
146.
29 -
146.
3314
6.33
- 14
6.43
Brid
ge -
146.
53 -
146.
6314
6.63
- 14
6.73
Brid
ge -
146.
93 -
147.
0314
7.03
- 14
7.13
147.
13 -
147.
2314
7.23
- 14
7.33
147.
33 -
147.
4314
7.43
- 14
7.53
147.
53 -
147.
6314
7.63
- 14
7.64
147.
67 -
147.
7714
7.77
- 14
7.87
147.
87 -
147.
9714
7.97
- 14
8.07
148.
07 -
148.
17
Mile Post
Northbound Lane 1 IRI Values MP 144.02 to MP 148.17
H-2

0
50
100
150
200
250
300
350
400
450
500
550
IRI(i
n/m
ile)
148.
17 -
148.
2714
8.27
- 14
8.37
148.
37 -
148.
4714
8.47
- 14
8.57
148.
57 -
148.
6714
8.67
- 14
8.77
148.
77 -
148.
8714
8.87
- 14
8.97
148.
97 -
149.
07Br
idge
-
149.
22 -
149.
3214
9.32
- 14
9.42
149.
42 -
149.
5214
9.52
- 14
9.62
149.
62 -
149.
7214
9.72
- 14
9.82
149.
82 -
149.
9214
9.92
- 15
0.02
150.
02 -
150.
1215
0.12
- 15
0.22
150.
22 -
150.
3215
0.32
- 15
0.42
150.
42 -
150.
5215
0.52
- 15
0.62
150.
62 -
150.
7215
0.72
- 15
0.82
150.
82 -
150.
9215
0.92
- 15
1.02
151.
02 -
151.
1215
1.12
- 15
1.22
151.
22 -
151.
2315
1.23
- 15
1.33
151.
33 -
151.
4315
1.43
- 15
1.53
151.
53 -
151.
6315
1.63
- 15
1.73
151.
73 -
151.
8315
1.83
- 15
1.93
151.
93 -
152.
0315
2.03
- 15
2.13
Mile Post
Northbound Lane 1 IRI Values MP 148.17 to MP 152.13
0
50
100
150
200
250
300
350
400
450
500
550
IRI(i
n/m
ile)
152.
13 -
152.
23Br
idge
-
152.
39 -
152.
4915
2.49
- 15
2.59
152.
59 -
152.
6915
2.69
- 15
2.79
152.
79 -
152.
8915
2.89
- 15
2.99
152.
99 -
153.
0915
3.09
- 15
3.19
153.
19 -
153.
215
3.2
- 153
.315
3.3
- 153
.415
3.4
- 153
.515
3.5
- 153
.6Br
idge
- 15
3.8
- 153
.915
3.9
- 154
154
- 154
.115
4.1
- 154
.14
Diam
ond
Gro
und
-
158.
51 -
158.
6115
8.61
- 15
8.71
158.
71 -
158.
8115
8.81
- 15
8.91
158.
91 -
159.
0115
9.01
- 15
9.1
159.
1 - 1
59.2
159.
2 - 1
59.3
159.
3 - 1
59.4
159.
4 - 1
59.5
159.
5 - 1
59.6
Brid
ge -
159.
71 -
159.
8115
9.81
- 15
9.91
159.
91 -
160.
0116
0.01
- 16
0.11
160.
11 -
160.
2116
0.21
- 16
0.31
160.
31 -
160.
41
Mile Post
Northbound Lane 1 IRI Values MP 152.13 to MP 160.41
H-3

0
50
100
150
200
250
300
350
400
450
500
550
IRI(i
n/m
ile)
160.
41 -
160.
5116
0.51
- 16
0.61
160.
61 -
160.
7116
0.71
- 16
0.75
160.
75 -
160.
8516
0.85
- 16
0.95
160.
95 -
161.
0516
1.05
- 16
1.15
161.
15 -
161.
2516
1.25
- 16
1.35
161.
35 -
161.
4516
1.45
- 16
1.55
Brid
ge -
161.
78 -
161.
8816
1.88
- 16
1.98
161.
98 -
162.
0816
2.08
- 16
2.18
Brid
ge -
162.
36 -
162.
4616
2.46
- 16
2.56
162.
56 -
162.
5716
6.21
- 16
6.31
166.
31 -
166.
4116
6.41
- 16
6.51
166.
51 -
166.
6116
6.61
- 16
6.71
166.
71 -
166.
8116
6.81
- 16
6.91
166.
98 -
167.
0816
7.08
- 16
7.18
167.
18 -
167.
28Br
idge
-
168.
23 -
168.
3316
8.33
- 16
8.34
Brid
ge -
169.
28 -
169.
3816
9.38
- 16
9.48
169.
48 -
169.
5816
9.58
- 16
9.68
169.
68 -
169.
78
Mile Post
Northbound Lane 1 IRI Values MP 160.41 to MP 169.78
0
50
100
150
200
250
300
350
400
450
500
550
IRI(i
n/m
ile)
169.
78 -
169.
8816
9.88
- 16
9.98
169.
98 -
170.
0817
0.08
- 17
0.18
170.
18 -
170.
25Br
idge
- 17
2.49
- 17
2.59
172.
59 -
172.
69Br
idge
- 17
2.89
- 17
2.99
172.
99 -
173.
0917
3.09
- 17
3.19
173.
19 -
173.
2917
3.29
- 17
3.39
173.
39 -
173.
4917
3.49
- 17
3.59
173.
59 -
173.
6917
3.69
- 17
3.79
173.
79 -
173.
8917
3.89
- 17
3.99
173.
99 -
174.
0917
4.09
- 17
4.14
174.
14 -
174.
2417
4.24
- 17
4.34
174.
34 -
174.
4417
4.44
- 17
4.54
174.
54 -
174.
6417
4.64
- 17
4.74
174.
74 -
174.
8417
4.84
- 17
4.94
174.
94 -
175.
0417
5.04
- 17
5.11
Brid
ge -
175.
24 -
175.
3417
5.34
- 17
5.44
Brid
ge -
175.
64 -
175.
7417
5.74
- 17
5.79
Mile Post
Northbound Lane 1 IRI Values MP 169.78 to MP 175.79
H-4

Northbound Lane 2 IRI Value Plots
0
50
100
150
200
250
300
350
400
450
500
550
IRI(i
n/m
ile)
139.
5 - 1
39.6
139.
6 - 1
39.7
139.
7 - 1
39.8
139.
8 - 1
39.9
139.
9 - 1
4014
0 - 1
40.1
140.
1 - 1
40.2
140.
2 - 1
40.3
140.
3 - 1
40.4
140.
4 - 1
40.5
140.
5 - 1
40.6
140.
6 - 1
40.7
140.
7 - 1
40.8
140.
8 - 1
40.9
140.
9 - 1
4114
1 - 1
41.1
141.
1 - 1
41.2
141.
2 - 1
41.3
141.
3 - 1
41.4
141.
4 - 1
41.5
141.
5 - 1
41.6
141.
6 - 1
41.7
141.
7 - 1
41.8
141.
8 - 1
41.9
141.
9 - 1
4214
2.04
- 14
2.14
142.
14 -
142.
2414
2.24
- 14
2.34
142.
34 -
142.
4414
2.44
- 14
2.54
142.
54 -
142.
6414
2.64
- 14
2.74
142.
74 -
142.
7914
2.82
- 14
2.92
142.
92 -
143.
0214
3.02
- 14
3.12
143.
12 -
143.
2214
3.22
- 14
3.32
143.
32 -
143.
4214
3.42
- 14
3.52
143.
52 -
143.
6214
3.62
- 14
3.72
Mile Post
Northbound Lane 2 IRI Values MP 139.50 to MP 143.72
0
50
100
150
200
250
300
350
400
450
500
550
IRI(i
n/m
ile)
143.
72 -
143.
82Br
idge
-
143.
92 -
144.
0214
4.02
- 14
4.12
144.
12 -
144.
1914
4.19
- 14
4.29
144.
29 -
144.
3914
4.39
- 14
4.49
144.
49 -
144.
59Br
idge
-
144.
79 -
144.
8914
4.89
- 14
4.99
144.
99 -
145.
0914
5.09
- 14
5.19
145.
19 -
145.
2914
5.29
- 14
5.39
145.
39 -
145.
4914
5.49
- 14
5.59
145.
59 -
145.
69Br
idge
-
145.
89 -
145.
9914
5.99
- 14
6.09
146.
09 -
146.
1914
6.19
- 14
6.29
146.
29 -
146.
3314
6.33
- 14
6.43
Brid
ge -
146.
53 -
146.
6314
6.63
- 14
6.73
Brid
ge -
146.
93 -
147.
0314
7.03
- 14
7.13
147.
13 -
147.
2314
7.23
- 14
7.33
147.
33 -
147.
4314
7.43
- 14
7.53
147.
53 -
147.
63Br
idge
-
147.
77 -
147.
8714
7.87
- 14
7.97
147.
97 -
148.
0714
8.07
- 14
8.17
Mile Post
Northbound Lane 2 IRI Values MP 143.72 to MP 148.17
H-5

0
50
100
150
200
250
300
350
400
450
500
550
IRI(i
n/m
ile)
148.
17 -
148.
2714
8.27
- 14
8.37
148.
37 -
148.
4714
8.47
- 14
8.57
148.
57 -
148.
6714
8.67
- 14
8.77
148.
77 -
148.
8714
8.87
- 14
8.97
148.
97 -
149.
07Br
idge
-
149.
22 -
149.
3214
9.32
- 14
9.42
149.
42 -
149.
5214
9.52
- 14
9.62
149.
62 -
149.
7214
9.72
- 14
9.82
149.
82 -
149.
9214
9.92
- 15
0.02
150.
02 -
150.
1215
0.12
- 15
0.22
150.
22 -
150.
3215
0.32
- 15
0.42
150.
42 -
150.
5215
0.52
- 15
0.62
150.
62 -
150.
7215
0.72
- 15
0.82
150.
82 -
150.
9215
0.92
- 15
1.02
151.
02 -
151.
1215
1.12
- 15
1.22
151.
22 -
151.
2315
1.23
- 15
1.33
151.
33 -
151.
4315
1.43
- 15
1.53
151.
53 -
151.
6315
1.63
- 15
1.73
151.
73 -
151.
8315
1.83
- 15
1.93
151.
93 -
152.
0315
2.03
- 15
2.13
152.
13 -
152.
23
Mile Post
Northound Lane 2 IRI Values MP 148.17 to MP 152.23
0
50
100
150
200
250
300
350
400
450
500
550
IRI(i
n/m
ile)
152.
39 -
152.
4915
2.49
- 15
2.59
152.
59 -
152.
6915
2.69
- 15
2.79
152.
79 -
152.
8915
2.89
- 15
2.99
152.
99 -
153.
0915
3.09
- 15
3.19
153.
19 -
153.
215
3.2
- 153
.315
3.3
- 153
.415
3.4
- 153
.515
3.5
- 153
.615
3.6
- 153
.715
3.7
- 153
.815
3.8
- 153
.915
3.9
- 154
154
- 154
.115
4.1
- 154
.14
Diam
ond
Gro
und
-
158.
31 -
158.
41Br
idge
-
158.
51 -
158.
6115
8.61
- 15
8.71
158.
71 -
158.
8115
8.81
- 15
8.91
158.
91 -
159.
0115
9.01
- 15
9.1
159.
1 - 1
59.2
159.
2 - 1
59.3
159.
3 - 1
59.4
159.
4 - 1
59.5
159.
5 - 1
59.6
159.
6 - 1
59.6
715
9.71
- 15
9.81
159.
81 -
159.
9115
9.91
- 16
0.01
160.
01 -
160.
1116
0.11
- 16
0.21
160.
21 -
160.
3116
0.31
- 16
0.41
160.
41 -
160.
51
Mile Post
Northbound Lane 2 IRI Values MP 152.39 to MP 160.51
H-6

0
50
100
150
200
250
300
350
400
450
500
550
IRI(i
n/m
ile)
160.
51 -
160.
6116
0.61
- 16
0.71
160.
71 -
160.
7516
0.75
- 16
0.85
160.
85 -
160.
9516
0.95
- 16
1.05
161.
05 -
161.
1516
1.15
- 16
1.25
161.
25 -
161.
3516
1.35
- 16
1.45
161.
45 -
161.
5516
1.55
- 16
1.65
Brid
ge -
161.
78 -
161.
8816
1.88
- 16
1.98
161.
98 -
161.
9916
2 - 1
62.1
Brid
ge -
162.
4 - 1
62.5
162.
5 - 1
62.6
162.
6 - 1
62.7
162.
7 - 1
62.8
162.
8 - 1
62.8
2Br
idge
-
164.
47 -
164.
57Br
idge
-
164.
67 -
164.
7716
4.77
- 16
4.8
164.
95 -
165.
0516
5.05
- 16
5.15
165.
15 -
165.
25Br
idge
-
166.
31 -
166.
4116
6.41
- 16
6.51
166.
51 -
166.
6116
6.61
- 16
6.71
166.
71 -
166.
8116
6.81
- 16
6.91
166.
98 -
167.
0816
7.08
- 16
7.18
167.
18 -
167.
28
Mile Post
Northbound Lane 2 IRI Values MP 160.51 to MP 167.28
0
50
100
150
200
250
300
350
400
450
500
550
IRI(i
n/m
ile)
167.
77 -
167.
8716
7.87
- 16
7.97
167.
97 -
168.
0716
8.07
- 16
8.17
168.
17 -
168.
27Br
idge
-
169.
28 -
169.
3816
9.38
- 16
9.48
169.
48 -
169.
5816
9.58
- 16
9.68
169.
68 -
169.
7816
9.78
- 16
9.88
169.
88 -
169.
9816
9.98
- 17
0.08
170.
08 -
170.
18Br
idge
- 17
0.6
- 170
.717
0.7
- 170
.817
0.8
- 170
.917
0.9
- 171
171
- 171
.117
1.1
- 171
.217
1.2
- 171
.317
1.3
- 171
.417
1.4
- 171
.517
1.5
- 171
.617
1.6
- 171
.717
1.7
- 171
.817
1.8
- 171
.917
1.9
- 172
172
- 172
.117
2.1
- 172
.217
2.2
- 172
.3Br
idge
- 17
2.4
- 172
.517
2.5
- 172
.617
2.6
- 172
.717
2.7
- 172
.76
Brid
ge -
172.
89 -
172.
9917
2.99
- 17
3.09
173.
09 -
173.
19
Mile Post
Northbound Lane 2 IRI Values MP 167.77 to MP 173.19
H-7

0
50
100
150
200
250
300
350
400
450
500
550
IRI(i
n/m
ile)
173.
19 -
173.
29
173.
29 -
173.
39
173.
39 -
173.
49
173.
49 -
173.
59
173.
59 -
173.
69
173.
69 -
173.
79
173.
79 -
173.
89
173.
89 -
173.
99
173.
99 -
174.
09
174.
09 -
174.
14
174.
14 -
174.
24
174.
24 -
174.
34
174.
34 -
174.
44
174.
44 -
174.
54
174.
54 -
174.
64
174.
64 -
174.
74
174.
74 -
174.
84
174.
84 -
174.
94
174.
94 -
175.
04
175.
04 -
175.
11Br
idge
-
175.
24 -
175.
34
175.
34 -
175.
44Br
idge
-
175.
64 -
175.
74
175.
74 -
175.
84
175.
84 -
175.
94
175.
94 -
176.
04
176.
04 -
176.
13Br
idge
-
176.
26 -
176.
36
176.
36 -
176.
46
176.
46 -
176.
56
176.
56 -
176.
6617
6.66
- 17
6.7
176.
7 - 1
76.8
176.
8 - 1
76.9
176.
9 - 1
7717
7 - 1
77.1
177.
1 - 1
77.2
177.
2 - 1
77.3
177.
3 - 1
77.4
177.
4 - 1
77.5
177.
5 - 1
77.6
177.
6 - 1
77.7
177.
7 - 1
77.7
5
Mile Post
Northbound Lane 2 IRI Values MP 173.19 to MP 177.75
Northbound Lane 3 IRI Value Plots
0
50
100
150
200
250
300
350
400
450
500
550
IRI(i
n/m
ile)
139.
5 - 1
39.6
139.
6 - 1
39.7
139.
7 - 1
39.8
139.
8 - 1
39.9
139.
9 - 1
4014
0 - 1
40.1
140.
1 - 1
40.2
140.
2 - 1
40.3
140.
3 - 1
40.4
140.
4 - 1
40.5
140.
5 - 1
40.6
140.
6 - 1
40.7
140.
7 - 1
40.8
140.
8 - 1
40.9
140.
9 - 1
4114
1 - 1
41.1
141.
1 - 1
41.2
141.
2 - 1
41.3
141.
3 - 1
41.4
141.
4 - 1
41.5
141.
5 - 1
41.6
141.
6 - 1
41.7
141.
7 - 1
41.8
141.
8 - 1
41.9
141.
9 - 1
4214
2.04
- 14
2.14
142.
14 -
142.
2414
2.24
- 14
2.34
142.
34 -
142.
4414
2.44
- 14
2.54
142.
54 -
142.
6414
2.64
- 14
2.74
142.
74 -
142.
7914
2.82
- 14
2.92
142.
92 -
143.
0214
3.02
- 14
3.12
143.
12 -
143.
2214
3.22
- 14
3.32
143.
32 -
143.
4214
3.42
- 14
3.52
143.
52 -
143.
6214
3.62
- 14
3.72
143.
72 -
143.
82
Mile Post
Northbound Lane 3 IRI Values MP 139.50 to MP 143.82
H-8

0
50
100
150
200
250
300
350
400
450
500
550
IRI(i
n/m
ile)
143.
82 -
143.
9214
3.92
- 14
4.02
144.
02 -
144.
1214
4.12
- 14
4.19
144.
19 -
144.
2914
4.29
- 14
4.39
144.
39 -
144.
4914
4.49
- 14
4.59
Brid
ge -
144.
79 -
144.
8914
4.89
- 14
4.99
144.
99 -
145.
0914
5.09
- 14
5.19
145.
19 -
145.
2914
5.29
- 14
5.39
145.
39 -
145.
4914
5.49
- 14
5.59
145.
59 -
145.
69Br
idge
-
145.
89 -
145.
9914
5.99
- 14
6.09
146.
09 -
146.
1914
6.19
- 14
6.29
146.
29 -
146.
33Br
idge
-
146.
53 -
146.
6314
6.63
- 14
6.73
Brid
ge -
146.
93 -
147.
0314
7.03
- 14
7.13
147.
13 -
147.
2314
7.23
- 14
7.33
147.
33 -
147.
4314
7.43
- 14
7.53
147.
53 -
147.
6314
7.63
- 14
7.64
Brid
ge -
147.
77 -
147.
8714
7.87
- 14
7.97
147.
97 -
148.
0714
8.07
- 14
8.17
148.
17 -
148.
27
Mile Post
Northbound Lane 3 IRI Values MP 143.82 to MP 148.27
0
50
100
150
200
250
300
350
400
450
500
550
IRI(i
n/m
ile)
148.
27 -
148.
3714
8.37
- 14
8.47
148.
47 -
148.
5714
8.57
- 14
8.67
148.
67 -
148.
7714
8.77
- 14
8.87
148.
87 -
148.
9714
8.97
- 14
9.07
Brid
ge -
149.
32 -
149.
4214
9.42
- 14
9.52
149.
52 -
149.
6214
9.62
- 14
9.72
149.
72 -
149.
8214
9.82
- 14
9.92
149.
92 -
150.
0215
0.02
- 15
0.12
150.
12 -
150.
2215
0.22
- 15
0.32
150.
32 -
150.
4215
0.42
- 15
0.52
150.
52 -
150.
6215
0.62
- 15
0.72
150.
72 -
150.
8215
0.82
- 15
0.92
150.
92 -
151.
0215
1.02
- 15
1.12
151.
12 -
151.
2215
1.22
- 15
1.23
151.
23 -
151.
3315
1.33
- 15
1.43
151.
43 -
151.
5315
1.53
- 15
1.63
151.
63 -
151.
7315
1.73
- 15
1.83
151.
83 -
151.
9315
1.93
- 15
2.03
152.
03 -
152.
1315
2.13
- 15
2.23
Brid
ge -
152.
39 -
152.
4915
2.49
- 15
2.59
152.
59 -
152.
69
Mile Post
Northbound Lane 3 IRI Values MP 148.27 to MP 152.69
H-9

0
50
100
150
200
250
300
350
400
450
500
550
IRI(i
n/m
ile)
152.
69 -
152.
7915
2.79
- 15
2.89
152.
89 -
152.
99
152.
99 -
153.
0915
3.09
- 15
3.19
153.
19 -
153.
215
3.2
- 153
.315
3.3
- 153
.415
3.4
- 153
.515
3.5
- 153
.6Br
idge
- 15
3.8
- 153
.915
3.9
- 154
154
- 154
.115
4.1
- 154
.14
Diam
ond
Gro
und
-
158.
31 -
158.
4115
8.41
- 15
8.51
158.
51 -
158.
6115
8.61
- 15
8.71
158.
71 -
158.
81
158.
81 -
158.
9115
8.91
- 15
9.01
159.
01 -
159.
115
9.1
- 159
.215
9.2
- 159
.315
9.3
- 159
.415
9.4
- 159
.515
9.5
- 159
.6Br
idge
-
159.
81 -
159.
9115
9.91
- 16
0.01
160.
01 -
160.
11
160.
11 -
160.
2116
0.21
- 16
0.31
160.
31 -
160.
41
160.
41 -
160.
5116
0.51
- 16
0.61
160.
61 -
160.
7116
0.71
- 16
0.75
160.
75 -
160.
8516
0.85
- 16
0.95
160.
95 -
161.
05
Mile Post
Northbound Lane 3 IRI Values MP 152.69 to MP 161.05
0
50
100
150
200
250
300
350
400
450
500
550
IRI(i
n/m
ile)
161.
05 -
161.
1516
1.15
- 16
1.25
161.
25 -
161.
3516
1.35
- 16
1.45
161.
45 -
161.
55Br
idge
-
161.
78 -
161.
8816
1.88
- 16
1.98
161.
98 -
162.
0816
2.08
- 16
2.18
162.
18 -
162.
19Br
idge
-
162.
46 -
162.
5616
2.56
- 16
2.66
162.
66 -
162.
76Br
idge
-
164.
37 -
164.
4716
4.47
- 16
4.57
Brid
ge -
164.
67 -
164.
77Br
idge
-
165.
03 -
165.
1316
5.13
- 16
5.23
Brid
ge -
166.
31 -
166.
4116
6.41
- 16
6.51
166.
51 -
166.
6116
6.61
- 16
6.71
166.
71 -
166.
8116
6.81
- 16
6.91
Brid
ge -
167.
08 -
167.
1816
7.18
- 16
7.28
Brid
ge -
167.
77 -
167.
8716
7.87
- 16
7.97
167.
97 -
168.
0716
8.07
- 16
8.17
168.
17 -
168.
2716
8.27
- 16
8.34
Brid
ge -
169.
28 -
169.
3816
9.38
- 16
9.48
Mile Post
Northbound Lane 3 IRI Values MP 161.05 to MP 169.48
H-10

0
50
100
150
200
250
300
350
400
450
500
550
IRI(i
n/m
ile)
169.
48 -
169.
5816
9.58
- 16
9.68
169.
68 -
169.
7816
9.78
- 16
9.88
169.
88 -
169.
9816
9.98
- 17
0.08
170.
08 -
170.
18Br
idge
- 17
0.6
- 170
.717
0.7
- 170
.817
0.8
- 170
.917
0.9
- 171
171
- 171
.117
1.1
- 171
.217
1.2
- 171
.317
1.3
- 171
.417
1.4
- 171
.517
1.5
- 171
.617
1.6
- 171
.717
1.7
- 171
.817
1.8
- 171
.917
1.9
- 172
172
- 172
.117
2.1
- 172
.217
2.2
- 172
.3Br
idge
- 17
2.4
- 172
.517
2.5
- 172
.617
2.6
- 172
.7Br
idge
-
172.
89 -
172.
9917
2.99
- 17
3.09
173.
09 -
173.
1917
3.19
- 17
3.29
173.
29 -
173.
3917
3.39
- 17
3.49
173.
49 -
173.
5917
3.59
- 17
3.69
173.
69 -
173.
7917
3.79
- 17
3.89
173.
89 -
173.
9917
3.99
- 17
4.09
174.
09 -
174.
14
Mile Post
Northbound Lane 3 IRI Values MP 169.48 to MP 174.14
0
50
100
150
200
250
300
350
400
450
500
550
IRI(i
n/m
ile)
174.
14 -
174.
2417
4.24
- 17
4.34
174.
34 -
174.
4417
4.44
- 17
4.54
174.
54 -
174.
6417
4.64
- 17
4.74
174.
74 -
174.
8417
4.84
- 17
4.94
174.
94 -
175.
0417
5.04
- 17
5.11
Brid
ge -
175.
24 -
175.
3417
5.34
- 17
5.44
Brid
ge -
175.
54 -
175.
6417
5.64
- 17
5.74
175.
74 -
175.
8417
5.84
- 17
5.94
175.
94 -
176.
0417
6.04
- 17
6.13
Brid
ge -
176.
26 -
176.
3617
6.36
- 17
6.46
176.
46 -
176.
5617
6.56
- 17
6.66
176.
66 -
176.
717
6.7
- 176
.817
6.8
- 176
.917
6.9
- 177
177
- 177
.117
7.1
- 177
.217
7.2
- 177
.317
7.3
- 177
.417
7.4
- 177
.517
7.5
- 177
.617
7.6
- 177
.7
Mile Post
Northbound Lane 3 IRI Values MP 174.14 to MP 177.70
H-11

Northbound Lane 4 IRI Value Plots
0
50
100
150
200
250
300
350
400
450
500
550
IRI(i
n/m
ile)
139.
6 - 1
39.7
139.
7 - 1
39.8
139.
8 - 1
39.9
139.
9 - 1
4014
0 - 1
40.1
140.
1 - 1
40.2
140.
2 - 1
40.3
140.
3 - 1
40.4
140.
4 - 1
40.5
140.
5 - 1
40.6
140.
6 - 1
40.7
140.
7 - 1
40.8
140.
8 - 1
40.9
140.
9 - 1
4114
1 - 1
41.1
141.
1 - 1
41.2
141.
2 - 1
41.3
141.
3 - 1
41.4
141.
4 - 1
41.5
141.
5 - 1
41.6
141.
6 - 1
41.7
141.
7 - 1
41.8
141.
8 - 1
41.9
141.
9 - 1
4214
2.04
- 14
2.14
142.
14 -
142.
2414
2.24
- 14
2.34
142.
34 -
142.
4414
2.44
- 14
2.54
142.
54 -
142.
6414
2.64
- 14
2.74
142.
74 -
142.
7914
2.82
- 14
2.92
142.
92 -
143.
0214
3.02
- 14
3.12
143.
12 -
143.
2214
3.22
- 14
3.32
143.
32 -
143.
4214
3.42
- 14
3.52
143.
52 -
143.
62
Mile Post
Northbound Lane 4 IRI Values MP 139.50 to MP 143.62
0
50
100
150
200
250
300
350
400
450
500
550
IRI(i
n/m
ile)
143.
62 -
143.
7214
3.72
- 14
3.82
143.
82 -
143.
9214
3.92
- 14
4.02
144.
02 -
144.
1214
4.12
- 14
4.19
144.
19 -
144.
2914
4.29
- 14
4.39
144.
39 -
144.
4914
4.49
- 14
4.59
Brid
ge -
144.
79 -
144.
8914
4.89
- 14
4.99
144.
99 -
145.
0914
5.09
- 14
5.19
145.
19 -
145.
2914
5.29
- 14
5.39
145.
39 -
145.
4914
5.49
- 14
5.59
145.
59 -
145.
69Br
idge
-
145.
89 -
145.
9914
5.99
- 14
6.09
146.
09 -
146.
1914
6.19
- 14
6.29
146.
29 -
146.
33Br
idge
-
146.
53 -
146.
6314
6.63
- 14
6.73
Brid
ge -
146.
93 -
147.
0314
7.03
- 14
7.13
147.
13 -
147.
2314
7.23
- 14
7.33
147.
33 -
147.
4314
7.43
- 14
7.53
147.
53 -
147.
63Br
idge
-
147.
67 -
147.
7714
7.77
- 14
7.87
Mile Post
Northbound Lane 4 IRI Values MP 143.62 to MP 147.87
H-12

0
50
100
150
200
250
300
350
400
450
500
550
IRI(i
n/m
ile)
147.
87 -
147.
9714
7.97
- 14
8.07
148.
07 -
148.
1714
8.17
- 14
8.27
148.
27 -
148.
3714
8.37
- 14
8.47
148.
47 -
148.
5714
8.57
- 14
8.67
148.
67 -
148.
7714
8.77
- 14
8.87
148.
87 -
148.
9714
8.97
- 14
9.07
Brid
ge -
149.
22 -
149.
3214
9.32
- 14
9.42
149.
42 -
149.
5214
9.52
- 14
9.62
149.
62 -
149.
7214
9.72
- 14
9.82
149.
82 -
149.
9214
9.92
- 15
0.02
150.
02 -
150.
1215
0.12
- 15
0.22
150.
22 -
150.
3215
0.32
- 15
0.42
150.
42 -
150.
5215
0.52
- 15
0.62
150.
62 -
150.
7215
0.72
- 15
0.82
150.
82 -
150.
9215
0.92
- 15
1.02
151.
02 -
151.
1215
1.12
- 15
1.22
151.
22 -
151.
3215
1.32
- 15
1.42
151.
42 -
151.
5215
1.52
- 15
1.62
151.
62 -
151.
7215
1.72
- 15
1.82
151.
82 -
151.
9215
1.92
- 15
1.97
Mile Post
Northbound Lane 4 IRI Values MP 147.87 to MP 151.97
0
50
100
150
200
250
300
350
400
450
500
550
IRI(i
n/m
ile)
151.
99 -
152.
0915
2.09
- 15
2.19
152.
19 -
152.
2615
2.29
- 15
2.39
152.
39 -
152.
4915
2.49
- 15
2.59
152.
59 -
152.
6915
2.69
- 15
2.79
152.
79 -
152.
8915
2.89
- 15
2.99
152.
99 -
153.
0915
3.09
- 15
3.19
153.
19 -
153.
215
3.2
- 153
.315
3.3
- 153
.415
3.4
- 153
.515
3.5
- 153
.615
3.6
- 153
.715
3.7
- 153
.815
3.8
- 153
.915
3.9
- 154
154
- 154
.115
4.1
- 154
.14
Diam
ond
Gro
und
-
158.
31 -
158.
4115
8.41
- 15
8.51
158.
51 -
158.
6115
8.61
- 15
8.71
158.
71 -
158.
8115
8.81
- 15
8.91
158.
91 -
159.
0115
9.01
- 15
9.1
159.
1 - 1
59.2
159.
2 - 1
59.3
159.
3 - 1
59.4
159.
4 - 1
59.5
159.
5 - 1
59.6
159.
6 - 1
59.6
715
9.71
- 15
9.81
159.
81 -
159.
9115
9.91
- 16
0.01
Mile Post
Northbound Lane 4 IRI Values MP 151.99 to MP 160.01
H-13

0
50
100
150
200
250
300
350
400
450
500
550
IRI(i
n/m
ile)
160.
01 -
160.
1116
0.11
- 16
0.21
160.
21 -
160.
3116
0.31
- 16
0.41
160.
41 -
160.
5116
0.51
- 16
0.61
160.
61 -
160.
7116
0.71
- 16
0.75
160.
75 -
160.
8516
0.85
- 16
0.95
160.
95 -
161.
0516
1.05
- 16
1.15
161.
15 -
161.
2516
1.25
- 16
1.35
161.
35 -
161.
4516
1.45
- 16
1.55
Brid
ge -
161.
68 -
161.
7816
1.78
- 16
1.88
161.
88 -
161.
9816
1.98
- 16
2.08
162.
08 -
162.
18Br
idge
-
162.
36 -
162.
4616
2.46
- 16
2.56
162.
56 -
162.
6616
2.66
- 16
2.76
162.
76 -
162.
8216
2.96
- 16
3.04
163.
2 - 1
63.2
416
4.37
- 16
4.47
164.
47 -
164.
5716
4.57
- 16
4.67
164.
67 -
164.
7716
4.77
- 16
4.8
164.
93 -
165.
0316
5.03
- 16
5.13
165.
13 -
165.
23Br
idge
-
166.
21 -
166.
3116
6.31
- 16
6.41
Mile Post
Northbound Lane 4 IRI Values MP 160.01 to MP 166.41
0
50
100
150
200
250
300
350
400
450
500
550
IRI(i
n/m
ile)
166.
41 -
166.
51
166.
51 -
166.
61
166.
61 -
166.
71
166.
71 -
166.
81
166.
81 -
166.
91Br
idge
-
167.
08 -
167.
18
167.
18 -
167.
28
167.
28 -
167.
35Br
idge
-
167.
77 -
167.
87
167.
87 -
167.
97
167.
97 -
168.
07
168.
07 -
168.
17
168.
17 -
168.
27Br
idge
-
169.
18 -
169.
28
169.
28 -
169.
38
169.
38 -
169.
48
169.
48 -
169.
58
169.
58 -
169.
68
169.
68 -
169.
78
169.
78 -
169.
88
169.
88 -
169.
98
169.
98 -
170.
08
170.
08 -
170.
18Br
idge
- 17
0.6
- 170
.717
0.7
- 170
.817
0.8
- 170
.917
0.9
- 171
171
- 171
.117
1.1
- 171
.217
1.2
- 171
.317
1.3
- 171
.417
1.4
- 171
.517
1.5
- 171
.617
1.6
- 171
.717
1.7
- 171
.817
1.8
- 171
.917
1.9
- 172
172
- 172
.117
2.1
- 172
.217
2.2
- 172
.3Br
idge
- 17
2.4
- 172
.5
Mile Post
Northbound Lane 4 IRI Values MP 166.41 to MP 172.50
H-14

0
50
100
150
200
250
300
350
400
450
500
550
IRI(i
n/m
ile)
Mile Post
Northbound Lane 4 IRI Values MP 172.50 to MP 177.75
Southbound Lane 1 IRI Value Plots
0
50
100
150
200
250
300
350
400
450
500
550
IRI(i
n/m
ile)
139.
5 - 1
39.6
139.
6 - 1
39.7
139.
7 - 1
39.8
139.
8 - 1
39.9
139.
9 - 1
4014
0 - 1
40.1
140.
1 - 1
40.2
140.
2 - 1
40.3
140.
3 - 1
40.4
140.
4 - 1
40.5
140.
5 - 1
40.6
140.
6 - 1
40.7
140.
7 - 1
40.8
140.
8 - 1
40.9
140.
9 - 1
4114
1 - 1
41.1
141.
1 - 1
41.2
141.
2 - 1
41.3
141.
3 - 1
41.4
141.
4 - 1
41.5
141.
5 - 1
41.6
141.
6 - 1
41.7
141.
7 - 1
41.8
141.
8 - 1
41.9
141.
9 - 1
4214
2.04
- 14
2.09
142.
09 -
142.
1914
2.19
- 14
2.29
142.
29 -
142.
3914
2.39
- 14
2.49
142.
49 -
142.
5914
2.59
- 14
2.69
142.
69 -
142.
7914
2.81
- 14
2.89
142.
89 -
142.
9914
2.99
- 14
3.09
143.
09 -
143.
1914
3.19
- 14
3.29
Mile Post
Southbound Lane 1 IRI Values MP 139.50 to MP 143.29
H-15

0
50
100
150
200
250
300
350
400
450
500
550
IRI(i
n/m
ile)
143.
29 -
143.
3914
3.39
- 14
3.49
143.
49 -
143.
5914
3.59
- 14
3.69
143.
69 -
143.
7914
3.79
- 14
3.89
143.
89 -
143.
9914
3.99
- 14
4.09
144.
09 -
144.
1914
4.19
- 14
4.29
144.
29 -
144.
39DB
R an
d DG
-
146.
21 -
146.
31Br
idge
-
146.
51 -
146.
6114
6.61
- 14
6.71
Brid
ge -
146.
84 -
146.
9414
6.94
- 14
7.04
147.
04 -
147.
1414
7.14
- 14
7.24
147.
24 -
147.
3414
7.34
- 14
7.44
147.
44 -
147.
5414
7.54
- 14
7.58
DBR
and
DG -
149.
76 -
149.
8414
9.84
- 14
9.94
149.
94 -
150.
0415
0.04
- 15
0.14
150.
14 -
150.
2415
0.24
- 15
0.34
150.
34 -
150.
4415
0.44
- 15
0.54
150.
54 -
150.
6415
0.64
- 15
0.74
150.
74 -
150.
8415
0.84
- 15
0.94
Mile Post
Southbound Lane 1 IRI Values MP 143.29 to MP 150.94
0
50
100
150
200
250
300
350
400
450
500
550
IRI(i
n/m
ile)
150.
94 -
151.
0415
1.04
- 15
1.14
151.
14 -
151.
2415
1.24
- 15
1.34
151.
34 -
151.
4415
1.44
- 15
1.54
151.
54 -
151.
6415
1.64
- 15
1.74
151.
74 -
151.
8415
1.84
- 15
1.94
151.
94 -
152.
0415
2.04
- 15
2.14
152.
14 -
152.
15Br
idge
-
152.
35 -
152.
4515
2.45
- 15
2.55
152.
55 -
152.
6515
2.65
- 15
2.75
152.
75 -
152.
8515
2.85
- 15
2.95
152.
95 -
153.
0515
3.05
- 15
3.15
153.
15 -
153.
2415
3.24
- 15
3.34
153.
34 -
153.
4415
3.44
- 15
3.54
153.
54 -
153.
6415
3.64
- 15
3.74
153.
74 -
153.
8415
3.84
- 15
3.94
153.
94 -
154.
0415
4.04
- 15
4.06
Diam
ond
Gro
und
-
158.
46 -
158.
5615
8.56
- 15
8.66
158.
66 -
158.
7615
8.76
- 15
8.86
158.
86 -
158.
96
Mile Post
Southbound Lane 1 IRI Values MP 150.94 to MP 158.96
H-16

0
50
100
150
200
250
300
350
400
450
500
550
IRI(i
n/m
ile)
158.
98 -
159.
0715
9.07
- 15
9.17
159.
17 -
159.
2715
9.27
- 15
9.37
159.
37 -
159.
4715
9.47
- 15
9.57
Brid
ge -
159.
71 -
159.
7515
9.75
- 15
9.85
159.
85 -
159.
9515
9.95
- 16
0.05
Brid
ge -
160.
25 -
160.
3516
0.35
- 16
0.45
160.
45 -
160.
5516
0.55
- 16
0.65
160.
65 -
160.
7516
0.75
- 16
0.85
160.
85 -
160.
9416
0.94
- 16
1.04
161.
04 -
161.
1416
1.14
- 16
1.24
161.
24 -
161.
3416
1.34
- 16
1.44
Brid
ge -
161.
74 -
161.
8416
1.84
- 16
1.94
161.
94 -
162.
0416
2.04
- 16
2.14
162.
14 -
162.
2416
2.37
- 16
2.42
162.
42 -
162.
5216
2.52
- 16
2.62
162.
62 -
162.
7216
2.72
- 16
2.82
165.
83 -
165.
8616
5.86
- 16
5.96
165.
96 -
166.
06
Mile Post
Southbound Lane 1 IRI Values MP 158.98 to MP 166.06
0
50
100
150
200
250
300
350
400
450
500
550
IRI(i
n/m
ile)
166.
06 -
166.
1616
6.16
- 16
6.26
166.
26 -
166.
3616
7.72
- 16
7.74
167.
74 -
167.
8416
7.84
- 16
7.94
167.
94 -
168.
0416
8.04
- 16
8.14
168.
14 -
168.
24Br
idge
-
169.
18 -
169.
2516
9.25
- 16
9.35
169.
35 -
169.
4516
9.45
- 16
9.55
169.
55 -
169.
6516
9.65
- 16
9.75
169.
75 -
169.
8516
9.85
- 16
9.95
169.
95 -
170.
0517
0.05
- 17
0.15
170.
15 -
170.
2517
2.52
- 17
2.54
172.
54 -
172.
6417
2.64
- 17
2.74
Brid
ge -
172.
84 -
172.
9417
2.94
- 17
3.04
173.
04 -
173.
1417
3.14
- 17
3.24
173.
24 -
173.
3417
3.34
- 17
3.44
173.
44 -
173.
5417
3.54
- 17
3.64
173.
64 -
173.
7417
3.74
- 17
3.84
173.
84 -
173.
9417
3.94
- 17
4.04
174.
04 -
174.
14
Mile Post
Southbound Lane 1 IRI Values MP 166.06 to MP 174.14
H-17

Southbound Lane 2 IRI Value Plots
0
50
100
150
200
250
300
350
400
450
500
550
IRI(i
n/m
ile)
139.
5 - 1
39.6
139.
6 - 1
39.7
139.
7 - 1
39.8
139.
8 - 1
39.9
139.
9 - 1
4014
0 - 1
40.1
140.
1 - 1
40.2
140.
2 - 1
40.3
140.
3 - 1
40.4
140.
4 - 1
40.5
140.
5 - 1
40.6
140.
6 - 1
40.7
140.
7 - 1
40.8
140.
8 - 1
40.9
140.
9 - 1
4114
1 - 1
41.1
141.
1 - 1
41.2
141.
2 - 1
41.3
141.
3 - 1
41.4
141.
4 - 1
41.5
141.
5 - 1
41.6
141.
6 - 1
41.7
141.
7 - 1
41.8
141.
8 - 1
41.9
141.
9 - 1
4214
2.04
- 14
2.09
142.
09 -
142.
1914
2.19
- 14
2.29
142.
29 -
142.
3914
2.39
- 14
2.49
142.
49 -
142.
5914
2.59
- 14
2.69
142.
69 -
142.
7914
2.81
- 14
2.89
142.
89 -
142.
9914
2.99
- 14
3.09
143.
09 -
143.
1914
3.19
- 14
3.29
143.
29 -
143.
3914
3.39
- 14
3.49
143.
49 -
143.
5914
3.59
- 14
3.69
Mile Post
Southbound Lane 2 IRI Values MP 139.50 to MP 143.69
0
50
100
150
200
250
300
350
400
450
500
550
IRI(i
n/m
ile)
143.
69 -
143.
7914
3.79
- 14
3.89
143.
89 -
143.
9914
3.99
- 14
4.09
144.
09 -
144.
1914
4.19
- 14
4.29
144.
29 -
144.
39DB
R an
d DG
-
146.
21 -
146.
31Br
idge
-
146.
51 -
146.
6114
6.61
- 14
6.71
Brid
ge -
146.
84 -
146.
9414
6.94
- 14
7.04
147.
04 -
147.
1414
7.14
- 14
7.24
147.
24 -
147.
3414
7.34
- 14
7.44
147.
44 -
147.
5414
7.54
- 14
7.58
DBR
and
DG -
149.
76 -
149.
8414
9.84
- 14
9.94
149.
94 -
150.
0415
0.04
- 15
0.14
150.
14 -
150.
2415
0.24
- 15
0.34
150.
34 -
150.
4415
0.44
- 15
0.54
150.
54 -
150.
6415
0.64
- 15
0.74
150.
74 -
150.
8415
0.84
- 15
0.94
150.
94 -
151.
0415
1.04
- 15
1.14
151.
14 -
151.
2415
1.24
- 15
1.34
151.
34 -
151.
4415
1.44
- 15
1.54
151.
54 -
151.
64
Mile Post
Southbound Lane 2 IRI Values MP 143.69 to MP 151.64
H-18

0
50
100
150
200
250
300
350
400
450
500
550
IRI(i
n/m
ile)
151.
64 -
151.
7415
1.74
- 15
1.84
151.
84 -
151.
9415
1.94
- 15
2.04
152.
04 -
152.
1415
2.14
- 15
2.15
Brid
ge -
152.
35 -
152.
4515
2.45
- 15
2.55
152.
55 -
152.
6515
2.65
- 15
2.75
152.
75 -
152.
8515
2.85
- 15
2.95
152.
95 -
153.
0515
3.05
- 15
3.15
153.
15 -
153.
2415
3.24
- 15
3.34
153.
34 -
153.
4415
3.44
- 15
3.54
153.
54 -
153.
6415
3.64
- 15
3.74
153.
74 -
153.
8415
3.84
- 15
3.94
153.
94 -
154.
0415
4.04
- 15
4.06
Diam
ond
Gro
und
- 15
8.5
- 158
.615
8.6
- 158
.715
8.7
- 158
.815
8.8
- 158
.915
8.9
- 159
159
- 159
.115
9.1
- 159
.17
159.
17 -
159.
2715
9.27
- 15
9.37
159.
37 -
159.
4715
9.47
- 15
9.57
159.
57 -
159.
6715
9.71
- 15
9.75
159.
75 -
159.
8515
9.85
- 15
9.95
Mile Post
Southbound Lane 2 IRI Values MP 151.64 to MP 159.95
0
50
100
150
200
250
300
350
400
450
500
550
IRI(i
n/m
ile)
160.
25 -
160.
3516
0.35
- 16
0.45
160.
45 -
160.
5516
0.55
- 16
0.65
160.
65 -
160.
7516
0.75
- 16
0.85
160.
85 -
160.
9416
0.94
- 16
1.04
161.
04 -
161.
1416
1.14
- 16
1.24
161.
24 -
161.
3416
1.34
- 16
1.44
Brid
ge -
161.
74 -
161.
8416
1.84
- 16
1.94
161.
94 -
162.
0416
2.04
- 16
2.14
Brid
ge -
162.
37 -
162.
4216
2.42
- 16
2.52
162.
52 -
162.
6216
2.62
- 16
2.72
Brid
ge -
165.
53 -
165.
5816
5.58
- 16
5.68
165.
68 -
165.
7816
5.78
- 16
5.88
165.
88 -
165.
9816
5.98
- 16
6.08
166.
08 -
166.
1816
6.18
- 16
6.28
Brid
ge -
167.
72 -
167.
7416
7.74
- 16
7.84
167.
84 -
167.
9416
7.94
- 16
8.04
168.
04 -
168.
1416
8.14
- 16
8.24
Brid
ge -
169.
18 -
169.
25
Mile Post
Southbound Lane 2 IRI Values MP 160.25 to MP 169.25
H-19

0
50
100
150
200
250
300
350
400
450
500
550
IRI(i
n/m
ile)
169.
25 -
169.
3516
9.35
- 16
9.45
169.
45 -
169.
5516
9.55
- 16
9.65
169.
65 -
169.
7516
9.75
- 16
9.85
169.
85 -
169.
9516
9.95
- 17
0.05
170.
05 -
170.
1517
0.15
- 17
0.25
Brid
ge -
170.
59 -
170.
6917
0.69
- 17
0.79
170.
79 -
170.
8917
0.89
- 17
0.99
170.
99 -
171.
0917
1.09
- 17
1.19
171.
19 -
171.
2917
1.29
- 17
1.39
171.
39 -
171.
4917
1.49
- 17
1.59
171.
59 -
171.
6917
1.69
- 17
1.79
171.
79 -
171.
8917
1.89
- 17
1.92
171.
92 -
172.
0217
2.02
- 17
2.12
172.
12 -
172.
2217
2.22
- 17
2.32
172.
32 -
172.
4217
2.42
- 17
2.52
172.
52 -
172.
5417
2.54
- 17
2.64
172.
64 -
172.
74Br
idge
-
172.
84 -
172.
9417
2.94
- 17
3.04
173.
04 -
173.
1417
3.14
- 17
3.24
173.
24 -
173.
3417
3.34
- 17
3.44
Mile Post
Southbound Lane 2 IRI Values MP 169.25 to MP 173.44
0
50
100
150
200
250
300
350
400
450
500
550
IRI(i
n/m
ile)
173.
44 -
173.
5417
3.54
- 17
3.64
173.
64 -
173.
7417
3.74
- 17
3.84
173.
84 -
173.
9417
3.94
- 17
4.04
174.
04 -
174.
1417
4.14
- 17
4.21
174.
21 -
174.
3117
4.31
- 17
4.41
174.
41 -
174.
5117
4.51
- 17
4.61
174.
61 -
174.
7117
4.71
- 17
4.81
174.
81 -
174.
9117
4.91
- 17
5.01
Brid
ge -
175.
23 -
175.
3317
5.33
- 17
5.43
Brid
ge -
175.
53 -
175.
6317
5.63
- 17
5.73
175.
73 -
175.
8317
5.83
- 17
5.93
175.
93 -
176.
03Br
idge
-
176.
16 -
176.
16Br
idge
-
176.
26 -
176.
3617
6.36
- 17
6.46
176.
46 -
176.
5617
6.56
- 17
6.66
176.
66 -
176.
7617
6.76
- 17
6.86
176.
86 -
176.
9617
6.96
- 17
7.05
177.
05 -
177.
1517
7.15
- 17
7.25
177.
25 -
177.
3517
7.35
- 17
7.45
177.
45 -
177.
5517
7.55
- 17
7.65
Mile Post
Southbound Lane 2 IRI Values MP 173.44 to MP 177.65
H-20

Southbound Lane 3 IRI Value Plots
0
50
100
150
200
250
300
350
400
450
500
550
IRI(i
n/m
ile)
139.
5 - 1
39.6
139.
6 - 1
39.7
139.
7 - 1
39.8
139.
8 - 1
39.9
139.
9 - 1
4014
0 - 1
40.1
140.
1 - 1
40.2
140.
2 - 1
40.3
140.
3 - 1
40.4
140.
4 - 1
40.5
140.
5 - 1
40.6
140.
6 - 1
40.7
140.
7 - 1
40.8
140.
8 - 1
40.9
140.
9 - 1
4114
1 - 1
41.1
141.
1 - 1
41.2
141.
2 - 1
41.3
141.
3 - 1
41.4
141.
4 - 1
41.5
141.
5 - 1
41.6
141.
6 - 1
41.7
141.
7 - 1
41.8
141.
8 - 1
41.9
141.
9 - 1
4214
2.04
- 14
2.09
142.
09 -
142.
1914
2.19
- 14
2.29
142.
29 -
142.
3914
2.39
- 14
2.49
142.
49 -
142.
5914
2.59
- 14
2.69
142.
69 -
142.
7914
2.81
- 14
2.89
142.
89 -
142.
9914
2.99
- 14
3.09
143.
09 -
143.
1914
3.19
- 14
3.29
143.
29 -
143.
3914
3.39
- 14
3.49
143.
49 -
143.
5914
3.59
- 14
3.69
Mile Post
Southbound Lane 3 IRI Values MP 139.50 to MP 143.69
0
50
100
150
200
250
300
350
400
450
500
550
IRI(i
n/m
ile)
143.
69 -
143.
7914
3.79
- 14
3.89
143.
89 -
143.
9914
3.99
- 14
4.09
144.
09 -
144.
1914
4.19
- 14
4.29
144.
29 -
144.
39DB
R an
d DG
-
146.
21 -
146.
31Br
idge
-
146.
51 -
146.
6114
6.61
- 14
6.71
146.
71 -
146.
81Br
idge
-
146.
94 -
147.
0414
7.04
- 14
7.14
147.
14 -
147.
2414
7.24
- 14
7.34
147.
34 -
147.
4414
7.44
- 14
7.54
147.
54 -
147.
58DB
R an
d DG
-
149.
76 -
149.
8414
9.84
- 14
9.94
149.
94 -
150.
0415
0.04
- 15
0.14
150.
14 -
150.
2415
0.24
- 15
0.34
150.
34 -
150.
4415
0.44
- 15
0.54
150.
54 -
150.
6415
0.64
- 15
0.74
150.
74 -
150.
8415
0.84
- 15
0.94
150.
94 -
151.
0415
1.04
- 15
1.14
151.
14 -
151.
2415
1.24
- 15
1.34
151.
34 -
151.
4415
1.44
- 15
1.54
151.
54 -
151.
6415
1.64
- 15
1.74
Mile Post
Southbound Lane 3 IRI Values MP 143.69 to MP 151.74
H-21

0
50
100
150
200
250
300
350
400
450
500
550
IRI(i
n/m
ile)
151.
74 -
151.
8415
1.84
- 15
1.94
151.
94 -
152.
0415
2.04
- 15
2.14
152.
14 -
152.
1515
2.15
- 15
2.25
Brid
ge -
152.
35 -
152.
4515
2.45
- 15
2.55
152.
55 -
152.
6515
2.65
- 15
2.75
152.
75 -
152.
8515
2.85
- 15
2.95
152.
95 -
153.
0515
3.05
- 15
3.15
Diam
ond
Gro
und
- 15
8.5
- 158
.615
8.6
- 158
.715
8.7
- 158
.815
8.8
- 158
.915
8.9
- 159
159
- 159
.115
9.1
- 159
.17
159.
17 -
159.
2715
9.27
- 15
9.37
159.
37 -
159.
4715
9.47
- 15
9.57
159.
57 -
159.
67Br
idge
-
159.
75 -
159.
8515
9.85
- 15
9.95
159.
95 -
160.
05Br
idge
-
160.
25 -
160.
3516
0.35
- 16
0.45
160.
45 -
160.
5516
0.55
- 16
0.65
160.
65 -
160.
7516
0.75
- 16
0.85
160.
85 -
160.
9416
0.94
- 16
1.04
161.
04 -
161.
14
Mile Post
Southbound Lane 3 IRI Values MP 151.74 to MP 161.14
0
50
100
150
200
250
300
350
400
450
500
550
IRI(i
n/m
ile)
161.
14 -
161.
2416
1.24
- 16
1.34
161.
34 -
161.
44Br
idge
-
161.
74 -
161.
8416
1.84
- 16
1.94
161.
94 -
162.
0416
2.04
- 16
2.14
162.
14 -
162.
24Br
idge
-
162.
42 -
162.
5216
2.52
- 16
2.62
162.
62 -
162.
7216
2.72
- 16
2.82
Brie
ge -
164.
33 -
164.
416
4.4
- 164
.516
4.5
- 164
.6Br
idge
- 16
4.7
- 164
.8Br
idge
-
164.
98 -
165.
0816
5.08
- 16
5.18
165.
18 -
165.
28Br
idge
-
165.
48 -
165.
5816
5.58
- 16
5.68
165.
68 -
165.
7816
5.78
- 16
5.88
165.
88 -
165.
9816
5.98
- 16
6.08
166.
08 -
166.
1816
6.18
- 16
6.28
166.
28 -
166.
36Br
idge
-
167.
74 -
167.
8416
7.84
- 16
7.94
167.
94 -
168.
0416
8.04
- 16
8.14
168.
14 -
168.
24Br
idge
-
169.
18 -
169.
25
Mile Post
Southbound Lane 3 IRI Values MP 161.24 to MP 169.25
H-22

0
50
100
150
200
250
300
350
400
450
500
550
IRI(i
n/m
ile)
169.
25 -
169.
3516
9.35
- 16
9.45
169.
45 -
169.
5516
9.55
- 16
9.65
169.
65 -
169.
7516
9.75
- 16
9.85
169.
85 -
169.
9516
9.95
- 17
0.05
170.
05 -
170.
1517
0.15
- 17
0.25
Brid
ge -
170.
59 -
170.
6917
0.69
- 17
0.79
170.
79 -
170.
8917
0.89
- 17
0.99
170.
99 -
171.
0917
1.09
- 17
1.19
171.
19 -
171.
2917
1.29
- 17
1.39
171.
39 -
171.
4917
1.49
- 17
1.59
171.
59 -
171.
6917
1.69
- 17
1.79
171.
79 -
171.
8917
1.89
- 17
1.92
171.
92 -
172.
0217
2.02
- 17
2.12
172.
12 -
172.
2217
2.22
- 17
2.32
172.
32 -
172.
4217
2.42
- 17
2.52
172.
52 -
172.
5417
2.54
- 17
2.64
172.
64 -
172.
74Br
idge
-
172.
84 -
172.
9417
2.94
- 17
3.04
173.
04 -
173.
1417
3.14
- 17
3.24
173.
24 -
173.
3417
3.34
- 17
3.44
173.
44 -
173.
54
Mile Post
Southbound Lane 3 IRI Values MP 169.25 to MP 173.54
0
50
100
150
200
250
300
350
400
450
500
550
IRI(i
n/m
ile)
173.
54 -
173.
6417
3.64
- 17
3.74
173.
74 -
173.
8417
3.84
- 17
3.94
173.
94 -
174.
0417
4.04
- 17
4.14
174.
14 -
174.
2117
4.21
- 17
4.31
174.
31 -
174.
4117
4.41
- 17
4.51
174.
51 -
174.
6117
4.61
- 17
4.71
174.
71 -
174.
8117
4.81
- 17
4.91
174.
91 -
175.
01Br
idge
-
175.
23 -
175.
3317
5.33
- 17
5.43
Brid
ge -
175.
53 -
175.
6317
5.63
- 17
5.73
175.
73 -
175.
8317
5.83
- 17
5.93
175.
93 -
176.
03Br
idge
-
176.
16 -
176.
16Br
idge
-
176.
26 -
176.
3617
6.36
- 17
6.46
176.
46 -
176.
5617
6.56
- 17
6.66
176.
66 -
176.
7617
6.76
- 17
6.86
176.
86 -
176.
9617
6.96
- 17
7.05
177.
05 -
177.
1517
7.15
- 17
7.25
177.
25 -
177.
3517
7.35
- 17
7.45
177.
45 -
177.
5517
7.55
- 17
7.65
Mile Post
Southbound Lane 3 IRI Values MP 173.54 to MP 177.65
H-23

Southbound Lane 4 IRI Value Plots
0
50
100
150
200
250
300
350
400
450
500
550
IRI(i
n/m
ile)
139.
5 - 1
39.6
139.
6 - 1
39.7
139.
7 - 1
39.8
139.
8 - 1
39.9
139.
9 - 1
4014
0 - 1
40.1
140.
1 - 1
40.2
140.
2 - 1
40.3
140.
3 - 1
40.4
140.
4 - 1
40.5
140.
5 - 1
40.6
140.
6 - 1
40.7
140.
7 - 1
40.8
140.
8 - 1
40.9
140.
9 - 1
4114
1 - 1
41.1
141.
1 - 1
41.2
141.
2 - 1
41.3
141.
3 - 1
41.4
141.
4 - 1
41.5
141.
5 - 1
41.6
141.
6 - 1
41.7
141.
7 - 1
41.8
141.
8 - 1
41.9
141.
9 - 1
4214
2.04
- 14
2.09
142.
09 -
142.
1914
2.19
- 14
2.29
142.
29 -
142.
3914
2.39
- 14
2.49
142.
49 -
142.
5914
2.59
- 14
2.69
142.
69 -
142.
7914
2.81
- 14
2.89
142.
89 -
142.
9914
2.99
- 14
3.09
143.
09 -
143.
1914
3.19
- 14
3.29
143.
29 -
143.
3914
3.39
- 14
3.49
Mile Post
Southbound Lane 4 IRI Values MP 139.50 to MP 143.49
0
50
100
150
200
250
300
350
400
450
500
550
IRI(i
n/m
ile)
143.
49 -
143.
5914
3.59
- 14
3.69
143.
69 -
143.
7914
3.79
- 14
3.89
143.
89 -
143.
9914
3.99
- 14
4.09
144.
09 -
144.
1914
4.19
- 14
4.29
144.
29 -
144.
39DB
R an
d DG
-
146.
21 -
146.
31Br
idge
-
146.
51 -
146.
6114
6.61
- 14
6.71
Brid
ge -
146.
84 -
146.
9414
6.94
- 14
7.04
147.
04 -
147.
1414
7.14
- 14
7.24
147.
24 -
147.
3414
7.34
- 14
7.44
147.
44 -
147.
5414
7.54
- 14
7.59
DBR
and
DG -
149.
76 -
149.
8414
9.84
- 14
9.94
149.
94 -
150.
0415
0.04
- 15
0.14
150.
14 -
150.
2415
0.24
- 15
0.34
150.
34 -
150.
4415
0.44
- 15
0.54
150.
54 -
150.
6415
0.64
- 15
0.74
150.
74 -
150.
8415
0.84
- 15
0.94
150.
94 -
151.
0415
1.04
- 15
1.14
151.
14 -
151.
2415
1.24
- 15
1.34
Mile Post
Southbound Lane 4 IRI Values MP 143.49 to MP 151.34
H-24

0
50
100
150
200
250
300
350
400
450
500
550
IRI(i
n/m
ile)
151.
34 -
151.
4415
1.44
- 15
1.54
151.
54 -
151.
6415
1.64
- 15
1.74
151.
74 -
151.
8415
1.84
- 15
1.94
151.
94 -
152.
0415
2.04
- 15
2.14
152.
14 -
152.
15Br
idge
-
152.
35 -
152.
4515
2.45
- 15
2.55
152.
55 -
152.
6515
2.65
- 15
2.75
152.
75 -
152.
8515
2.85
- 15
2.95
152.
95 -
153.
0515
3.05
- 15
3.15
153.
15 -
153.
2415
3.24
- 15
3.34
153.
34 -
153.
4415
3.44
- 15
3.54
153.
54 -
153.
6415
3.64
- 15
3.74
153.
74 -
153.
8415
3.84
- 15
3.94
153.
94 -
154.
0415
4.04
- 15
4.06
Diam
ond
Gro
nd -
158.
5 - 1
58.6
158.
6 - 1
58.7
158.
7 - 1
58.8
158.
8 - 1
58.9
158.
9 - 1
5915
9 - 1
59.1
159.
1 - 1
59.1
715
9.17
- 15
9.27
159.
27 -
159.
3715
9.37
- 15
9.47
159.
47 -
159.
57
Mile Post
Southbound Lane 4 IRI Values MP 151.34 to MP 159.57
0
50
100
150
200
250
300
350
400
450
500
550
IRI(i
n/m
ile)
159.
71 -
159.
7515
9.75
- 15
9.85
159.
85 -
159.
95Br
idge
-
160.
25 -
160.
3516
0.35
- 16
0.45
160.
45 -
160.
5516
0.55
- 16
0.65
160.
65 -
160.
7516
0.75
- 16
0.85
160.
85 -
160.
9416
0.94
- 16
1.04
161.
04 -
161.
1416
1.14
- 16
1.24
161.
24 -
161.
3416
1.34
- 16
1.44
Brid
ge -
161.
74 -
161.
8416
1.84
- 16
1.94
161.
94 -
162.
0416
2.04
- 16
2.14
Brid
ge -
162.
37 -
162.
4216
2.42
- 16
2.52
162.
52 -
162.
6216
2.62
- 16
2.72
Brid
ge -
164.
33 -
164.
416
4.4
- 164
.516
4.5
- 164
.616
4.6
- 164
.7Br
idge
-
164.
93 -
164.
9816
4.98
- 16
5.08
165.
08 -
165.
18Br
idge
-
165.
44 -
165.
4816
5.48
- 16
5.58
165.
58 -
165.
68
Mile Post
Southbound Lane 4 IRI Values MP 159.71 to MP 165.68
H-25

0
50
100
150
200
250
300
350
400
450
500
550
IRI(i
n/m
ile)
165.
68 -
165.
7816
5.78
- 16
5.88
165.
88 -
165.
9816
5.98
- 16
6.08
166.
08 -
166.
1816
6.18
- 16
6.28
Brid
ge -
167.
72 -
167.
7416
7.74
- 16
7.84
167.
84 -
167.
9416
7.94
- 16
8.04
168.
04 -
168.
1416
8.14
- 16
8.24
Brid
ge -
169.
18 -
169.
2516
9.25
- 16
9.35
169.
35 -
169.
4516
9.45
- 16
9.55
169.
55 -
169.
6516
9.65
- 16
9.75
169.
75 -
169.
8516
9.85
- 16
9.95
169.
95 -
170.
0517
0.05
- 17
0.15
170.
15 -
170.
25Br
idge
-
170.
59 -
170.
6917
0.69
- 17
0.79
170.
79 -
170.
8917
0.89
- 17
0.99
170.
99 -
171.
0917
1.09
- 17
1.19
171.
19 -
171.
2917
1.29
- 17
1.39
171.
39 -
171.
4917
1.49
- 17
1.59
171.
59 -
171.
6917
1.69
- 17
1.79
171.
79 -
171.
8917
1.89
- 17
1.92
Mile Post
Southbound Lane 4 IRI Values MP 165.68 to MP 171.92
0
50
100
150
200
250
300
350
400
450
500
550
IRI(i
n/m
ile)
171.
92 -
172.
0217
2.02
- 17
2.12
172.
12 -
172.
2217
2.22
- 17
2.32
172.
32 -
172.
4217
2.42
- 17
2.52
172.
52 -
172.
5417
2.54
- 17
2.64
172.
64 -
172.
74Br
idge
-
172.
84 -
172.
9417
2.94
- 17
3.04
173.
04 -
173.
1417
3.14
- 17
3.24
173.
24 -
173.
3417
3.34
- 17
3.44
173.
44 -
173.
5417
3.54
- 17
3.64
173.
64 -
173.
7417
3.74
- 17
3.84
173.
84 -
173.
9417
3.94
- 17
4.04
174.
04 -
174.
1417
4.14
- 17
4.21
174.
21 -
174.
3117
4.31
- 17
4.41
174.
41 -
174.
5117
4.51
- 17
4.61
174.
61 -
174.
7117
4.71
- 17
4.81
174.
81 -
174.
9117
4.91
- 17
5.01
Brid
ge -
175.
23 -
175.
3317
5.33
- 17
5.43
Brid
ge -
175.
53 -
175.
6317
5.63
- 17
5.73
175.
73 -
175.
8317
5.83
- 17
5.93
Mile Post
Southbound Lane 4 IRI Values MP 171.92 to MP 175.93
H-26

0
50
100
150
200
250
300
350
400
450
500
550
IRI(i
n/m
ile)
175.
93 -
176.
0317
6.03
- 17
6.13
176.
16 -
176.
16
Brid
ge -
176.
26 -
176.
3617
6.36
- 17
6.46
176.
46 -
176.
5617
6.56
- 17
6.66
176.
66 -
176.
7617
6.76
- 17
6.86
176.
86 -
176.
9617
6.96
- 17
7.05
177.
05 -
177.
1517
7.15
- 17
7.25
177.
25 -
177.
3517
7.35
- 17
7.45
177.
45 -
177.
5517
7.55
- 17
7.65
Mile Post
Southbound Lane 4 IRI Values MP 175.93 to MP 177.65
H-27

Appendix I – Average Faulting Distress Plots
I-1

Northbound Lane 1 Faulting Plots
0.00
0.05
0.10
0.15
0.20
0.25
0.30
0.35
0.40
0.45
0.50
Ave
rage
Fau
lting
(in)
139.
5 - 1
39.6
139.
6 - 1
39.7
139.
7 - 1
39.8
139.
8 - 1
39.9
139.
9 - 1
4014
0 - 1
40.1
140.
2 - 1
40.3
140.
3 - 1
40.4
140.
4 - 1
40.5
140.
5 - 1
40.6
140.
6 - 1
40.7
140.
7 - 1
40.8
140.
8 - 1
40.9
140.
9 - 1
4114
1 - 1
41.1
141.
1 - 1
41.2
141.
3 - 1
41.4
141.
4 - 1
41.5
141.
5 - 1
41.6
141.
7 - 1
41.8
141.
8 - 1
41.9
141.
9 - 1
4214
2.04
- 14
2.14
142.
14 -
142.
2414
2.24
- 14
2.34
142.
34 -
142.
4414
2.44
- 14
2.54
142.
54 -
142.
6414
2.64
- 14
2.74
142.
92 -
143.
0214
3.02
- 14
3.12
143.
12 -
143.
2214
3.22
- 14
3.32
143.
32 -
143.
4214
3.42
- 14
3.52
143.
52 -
143.
6214
3.62
- 14
3.72
143.
72 -
143.
8214
3.82
- 14
3.92
Mile Post
Northbound Lane 1 Faulting MP 139.50 to MP 143.92
0.00
0.05
0.10
0.15
0.20
0.25
0.30
0.35
0.40
0.45
0.50
Ave
rage
Fau
lting
(in)
143.
92 -
144.
0214
4.02
- 14
4.12
144.
12 -
144.
1914
4.19
- 14
4.29
144.
29 -
144.
3914
4.39
- 14
4.49
144.
49 -
144.
59Br
idge
-
144.
79 -
144.
8914
4.89
- 14
4.99
144.
99 -
145.
0914
5.09
- 14
5.19
145.
19 -
145.
2914
5.29
- 14
5.39
145.
39 -
145.
4914
5.49
- 14
5.59
145.
59 -
145.
69Br
idge
-
145.
89 -
145.
9914
5.99
- 14
6.09
146.
09 -
146.
1914
6.19
- 14
6.29
146.
29 -
146.
3314
6.33
- 14
6.43
Brid
ge -
146.
53 -
146.
6314
6.63
- 14
6.73
Brid
ge -
146.
93 -
147.
0314
7.03
- 14
7.13
147.
13 -
147.
2314
7.23
- 14
7.33
147.
33 -
147.
4314
7.43
- 14
7.53
147.
53 -
147.
6314
7.63
- 14
7.64
147.
67 -
147.
7714
7.77
- 14
7.87
147.
87 -
147.
9714
7.97
- 14
8.07
148.
07 -
148.
17
Mile Post
Northbound Lane 1 Faulting MP 143.92 to MP 148.17
I-2

0.00
0.05
0.10
0.15
0.20
0.25
0.30
0.35
0.40
0.45
0.50
Ave
rage
Fau
ling(
in)
148.
17 -
148.
2714
8.27
- 14
8.37
148.
37 -
148.
4714
8.47
- 14
8.57
148.
57 -
148.
6714
8.67
- 14
8.77
148.
77 -
148.
8714
8.87
- 14
8.97
148.
97 -
149.
07Br
idge
-
149.
22 -
149.
3214
9.32
- 14
9.42
149.
42 -
149.
5214
9.52
- 14
9.62
149.
62 -
149.
7214
9.72
- 14
9.82
149.
82 -
149.
9214
9.92
- 15
0.02
150.
02 -
150.
1215
0.12
- 15
0.22
150.
22 -
150.
3215
0.32
- 15
0.42
150.
42 -
150.
5215
0.52
- 15
0.62
150.
62 -
150.
7215
0.72
- 15
0.82
150.
82 -
150.
9215
0.92
- 15
1.02
151.
02 -
151.
1215
1.12
- 15
1.22
151.
22 -
151.
2315
1.23
- 15
1.33
151.
33 -
151.
4315
1.43
- 15
1.53
151.
53 -
151.
6315
1.63
- 15
1.73
151.
73 -
151.
8315
1.83
- 15
1.93
151.
93 -
152.
0315
2.03
- 15
2.13
Mile Post
Northbound Lane 1 Faulting MP 148.17 to MP 152.13
0.00
0.05
0.10
0.15
0.20
0.25
0.30
0.35
0.40
0.45
0.50
Ave
rage
Fau
lting
(in)
152.
13 -
152.
23Br
idge
-
152.
39 -
152.
4915
2.49
- 15
2.59
152.
59 -
152.
6915
2.69
- 15
2.79
152.
79 -
152.
8915
2.89
- 15
2.99
152.
99 -
153.
0915
3.09
- 15
3.19
153.
19 -
153.
215
3.2
- 153
.315
3.3
- 153
.415
3.4
- 153
.515
3.5
- 153
.6Br
idge
- 15
3.8
- 153
.915
3.9
- 154
154
- 154
.115
4.1
- 154
.14
Diam
ond
Gro
und
-
158.
51 -
158.
6115
8.61
- 15
8.71
158.
71 -
158.
8115
8.81
- 15
8.91
158.
91 -
159.
0115
9.01
- 15
9.1
159.
1 - 1
59.2
159.
2 - 1
59.3
159.
3 - 1
59.4
159.
4 - 1
59.5
159.
5 - 1
59.6
Brid
ge -
159.
71 -
159.
8115
9.81
- 15
9.91
159.
91 -
160.
0116
0.01
- 16
0.11
160.
11 -
160.
2116
0.21
- 16
0.31
160.
31 -
160.
41
Mile Post
Northbound Lane 1 Faulting MP 152.13 to MP 160.41
I-3

0.00
0.05
0.10
0.15
0.20
0.25
0.30
0.35
0.40
0.45
0.50
Ave
rage
Fau
lting
(in)
160.
41 -
160.
5116
0.51
- 16
0.61
160.
61 -
160.
7116
0.71
- 16
0.75
160.
75 -
160.
8516
0.85
- 16
0.95
160.
95 -
161.
0516
1.05
- 16
1.15
161.
15 -
161.
2516
1.25
- 16
1.35
161.
35 -
161.
4516
1.45
- 16
1.55
Brid
ge -
161.
78 -
161.
8816
1.88
- 16
1.98
161.
98 -
162.
0816
2.08
- 16
2.18
Brid
ge -
162.
36 -
162.
4616
2.46
- 16
2.56
162.
56 -
162.
5716
6.21
- 16
6.31
166.
31 -
166.
4116
6.41
- 16
6.51
166.
51 -
166.
6116
6.61
- 16
6.71
166.
71 -
166.
8116
6.81
- 16
6.91
166.
98 -
167.
0816
7.08
- 16
7.18
167.
18 -
167.
28Br
idge
-
168.
23 -
168.
3316
8.33
- 16
8.34
Brid
ge -
169.
28 -
169.
3816
9.38
- 16
9.48
169.
48 -
169.
5816
9.58
- 16
9.68
169.
68 -
169.
78
Mile Post
Northbound Lane 1 Faulting MP 160.41 to MP 169.78
0.00
0.05
0.10
0.15
0.20
0.25
0.30
0.35
0.40
0.45
0.50
Ave
rage
Fau
lting
(in)
169.
78 -
169.
8816
9.88
- 16
9.98
169.
98 -
170.
0817
0.08
- 17
0.18
170.
18 -
170.
25Br
idge
- 17
2.49
- 17
2.59
172.
59 -
172.
69Br
idge
- 17
2.89
- 17
2.99
172.
99 -
173.
0917
3.09
- 17
3.19
173.
19 -
173.
2917
3.29
- 17
3.39
173.
39 -
173.
4917
3.49
- 17
3.59
173.
59 -
173.
6917
3.69
- 17
3.79
173.
79 -
173.
8917
3.89
- 17
3.99
173.
99 -
174.
0917
4.09
- 17
4.14
174.
14 -
174.
2417
4.24
- 17
4.34
174.
34 -
174.
4417
4.44
- 17
4.54
174.
54 -
174.
6417
4.64
- 17
4.74
174.
74 -
174.
8417
4.84
- 17
4.94
174.
94 -
175.
0417
5.04
- 17
5.11
Brid
ge -
175.
24 -
175.
3417
5.34
- 17
5.44
Brid
ge -
175.
64 -
175.
7417
5.74
- 17
5.79
Mile Post
Northbound Lane 1 Faulting MP 169.78 to MP 175.79
I-4

Northbound Lane 2 Faulting Plots
0.00
0.05
0.10
0.15
0.20
0.25
0.30
0.35
0.40
0.45
0.50
Ave
rage
Fau
lting
(in)
139.
5 - 1
39.6
139.
6 - 1
39.7
139.
7 - 1
39.8
139.
8 - 1
39.9
139.
9 - 1
4014
0 - 1
40.1
140.
1 - 1
40.2
140.
2 - 1
40.3
140.
3 - 1
40.4
140.
4 - 1
40.5
140.
5 - 1
40.6
140.
6 - 1
40.7
140.
7 - 1
40.8
140.
8 - 1
40.9
140.
9 - 1
4114
1 - 1
41.1
141.
1 - 1
41.2
141.
2 - 1
41.3
141.
3 - 1
41.4
141.
4 - 1
41.5
141.
5 - 1
41.6
141.
6 - 1
41.7
141.
7 - 1
41.8
141.
8 - 1
41.9
141.
9 - 1
4214
2.04
- 14
2.14
142.
14 -
142.
2414
2.24
- 14
2.34
142.
34 -
142.
4414
2.44
- 14
2.54
142.
54 -
142.
6414
2.64
- 14
2.74
142.
74 -
142.
7914
2.82
- 14
2.92
142.
92 -
143.
0214
3.02
- 14
3.12
143.
12 -
143.
2214
3.22
- 14
3.32
143.
32 -
143.
4214
3.42
- 14
3.52
143.
52 -
143.
6214
3.62
- 14
3.72
Mile Post
Northbound Lane 2 Faulting MP 139.50 to MP 143.72
0.00
0.05
0.10
0.15
0.20
0.25
0.30
0.35
0.40
0.45
0.50
Ave
rage
Fau
lting
(in)
143.
72 -
143.
82Br
idge
-
143.
92 -
144.
0214
4.02
- 14
4.12
144.
12 -
144.
1914
4.19
- 14
4.29
144.
29 -
144.
3914
4.39
- 14
4.49
144.
49 -
144.
59Br
idge
-
144.
79 -
144.
8914
4.89
- 14
4.99
144.
99 -
145.
0914
5.09
- 14
5.19
145.
19 -
145.
2914
5.29
- 14
5.39
145.
39 -
145.
4914
5.49
- 14
5.59
145.
59 -
145.
69Br
idge
-
145.
89 -
145.
9914
5.99
- 14
6.09
146.
09 -
146.
1914
6.19
- 14
6.29
146.
29 -
146.
3314
6.33
- 14
6.43
Brid
ge -
146.
53 -
146.
6314
6.63
- 14
6.73
Brid
ge -
146.
93 -
147.
0314
7.03
- 14
7.13
147.
13 -
147.
2314
7.23
- 14
7.33
147.
33 -
147.
4314
7.43
- 14
7.53
147.
53 -
147.
63Br
idge
-
147.
77 -
147.
8714
7.87
- 14
7.97
147.
97 -
148.
0714
8.07
- 14
8.17
Mile Post
Northbound Lane 2 Faulting MP 143.72 to MP 148.17
I-5

0.00
0.05
0.10
0.15
0.20
0.25
0.30
0.35
0.40
0.45
0.50
Ave
rage
Fau
lting
(in)
148.
17 -
148.
2714
8.27
- 14
8.37
148.
37 -
148.
4714
8.47
- 14
8.57
148.
57 -
148.
6714
8.67
- 14
8.77
148.
77 -
148.
8714
8.87
- 14
8.97
148.
97 -
149.
07Br
idge
-
149.
22 -
149.
3214
9.32
- 14
9.42
149.
42 -
149.
5214
9.52
- 14
9.62
149.
62 -
149.
7214
9.72
- 14
9.82
149.
82 -
149.
9214
9.92
- 15
0.02
150.
02 -
150.
1215
0.12
- 15
0.22
150.
22 -
150.
3215
0.32
- 15
0.42
150.
42 -
150.
5215
0.52
- 15
0.62
150.
62 -
150.
7215
0.72
- 15
0.82
150.
82 -
150.
9215
0.92
- 15
1.02
151.
02 -
151.
1215
1.12
- 15
1.22
151.
22 -
151.
2315
1.23
- 15
1.33
151.
33 -
151.
4315
1.43
- 15
1.53
151.
53 -
151.
6315
1.63
- 15
1.73
151.
73 -
151.
8315
1.83
- 15
1.93
151.
93 -
152.
0315
2.03
- 15
2.13
152.
13 -
152.
23
Mile Post
Northbound Lane 2 Faulting MP 148.17 to MP 153.23
0.00
0.05
0.10
0.15
0.20
0.25
0.30
0.35
0.40
0.45
0.50
Ave
rage
Fau
lting
(in)
152.
39 -
152.
4915
2.49
- 15
2.59
152.
59 -
152.
69
152.
69 -
152.
7915
2.79
- 15
2.89
152.
89 -
152.
9915
2.99
- 15
3.09
153.
09 -
153.
1915
3.19
- 15
3.2
153.
2 - 1
53.3
153.
3 - 1
53.4
153.
4 - 1
53.5
153.
5 - 1
53.6
153.
6 - 1
53.7
153.
7 - 1
53.8
153.
8 - 1
53.9
153.
9 - 1
5415
4 - 1
54.1
154.
1 - 1
54.1
4
Diam
ond
Gro
und
-
158.
31 -
158.
41Br
idge
-
158.
51 -
158.
6115
8.61
- 15
8.71
158.
71 -
158.
8115
8.81
- 15
8.91
158.
91 -
159.
0115
9.01
- 15
9.1
159.
1 - 1
59.2
159.
2 - 1
59.3
159.
3 - 1
59.4
159.
4 - 1
59.5
159.
5 - 1
59.6
159.
6 - 1
59.6
715
9.71
- 15
9.81
159.
81 -
159.
9115
9.91
- 16
0.01
160.
01 -
160.
1116
0.11
- 16
0.21
160.
21 -
160.
3116
0.31
- 16
0.41
160.
41 -
160.
51
Mile Post
Northbound Lane 2 Faulting MP 152.39 to MP 160.51
I-6

0.00
0.05
0.10
0.15
0.20
0.25
0.30
0.35
0.40
0.45
0.50
Ave
rage
Fau
lting
(in)
160.
51 -
160.
6116
0.61
- 16
0.71
160.
71 -
160.
7516
0.75
- 16
0.85
160.
85 -
160.
9516
0.95
- 16
1.05
161.
05 -
161.
1516
1.15
- 16
1.25
161.
25 -
161.
3516
1.35
- 16
1.45
161.
45 -
161.
5516
1.55
- 16
1.65
Brid
ge -
161.
78 -
161.
8816
1.88
- 16
1.98
161.
98 -
161.
9916
2 - 1
62.1
Brid
ge -
162.
4 - 1
62.5
162.
5 - 1
62.6
162.
6 - 1
62.7
162.
7 - 1
62.8
162.
8 - 1
62.8
2Br
idge
-
164.
47 -
164.
57Br
idge
-
164.
67 -
164.
7716
4.77
- 16
4.8
164.
95 -
165.
0516
5.05
- 16
5.15
165.
15 -
165.
25Br
idge
-
166.
31 -
166.
4116
6.41
- 16
6.51
166.
51 -
166.
6116
6.61
- 16
6.71
166.
71 -
166.
8116
6.81
- 16
6.91
166.
98 -
167.
0816
7.08
- 16
7.18
167.
18 -
167.
28
Mile Post
Northbound Lane 2 Faulting MP 160.51 to MP 167.24
0.00
0.05
0.10
0.15
0.20
0.25
0.30
0.35
0.40
0.45
0.50
Ave
rage
Fau
lting
(in)
167.
77 -
167.
8716
7.87
- 16
7.97
167.
97 -
168.
0716
8.07
- 16
8.17
168.
17 -
168.
27Br
idge
-
169.
28 -
169.
3816
9.38
- 16
9.48
169.
48 -
169.
5816
9.58
- 16
9.68
169.
68 -
169.
7816
9.78
- 16
9.88
169.
88 -
169.
9816
9.98
- 17
0.08
170.
08 -
170.
18Br
idge
- 17
0.6
- 170
.717
0.7
- 170
.817
0.8
- 170
.917
0.9
- 171
171
- 171
.117
1.1
- 171
.217
1.2
- 171
.317
1.3
- 171
.417
1.4
- 171
.517
1.5
- 171
.617
1.6
- 171
.717
1.7
- 171
.817
1.8
- 171
.917
1.9
- 172
172
- 172
.117
2.1
- 172
.217
2.2
- 172
.3Br
idge
- 17
2.4
- 172
.517
2.5
- 172
.617
2.6
- 172
.717
2.7
- 172
.76
Brid
ge -
172.
89 -
172.
9917
2.99
- 17
3.09
173.
09 -
173.
19
Mile Post
Northbound Lane 2 Faulting MP 167.77 to MP 173.19
I-7

0.00
0.05
0.10
0.15
0.20
0.25
0.30
0.35
0.40
0.45
0.50
Ave
rage
Fau
lting
(in)
173.
19 -
173.
29
173.
29 -
173.
39
173.
39 -
173.
49
173.
49 -
173.
59
173.
59 -
173.
69
173.
69 -
173.
79
173.
79 -
173.
89
173.
89 -
173.
99
173.
99 -
174.
09
174.
09 -
174.
14
174.
14 -
174.
24
174.
24 -
174.
34
174.
34 -
174.
44
174.
44 -
174.
54
174.
54 -
174.
64
174.
64 -
174.
74
174.
74 -
174.
84
174.
84 -
174.
94
174.
94 -
175.
04
175.
04 -
175.
11Br
idge
-
175.
24 -
175.
34
175.
34 -
175.
44Br
idge
-
175.
64 -
175.
74
175.
74 -
175.
84
175.
84 -
175.
94
175.
94 -
176.
04
176.
04 -
176.
13Br
idge
-
176.
26 -
176.
36
176.
36 -
176.
46
176.
46 -
176.
56
176.
56 -
176.
6617
6.66
- 17
6.7
176.
7 - 1
76.8
176.
8 - 1
76.9
176.
9 - 1
7717
7 - 1
77.1
177.
1 - 1
77.2
177.
2 - 1
77.3
177.
3 - 1
77.4
177.
4 - 1
77.5
177.
5 - 1
77.6
177.
6 - 1
77.7
177.
7 - 1
77.7
5
Mile Post
Northbound Lane 2 Faulting MP 173.19 to MP 177.75
Northbound Lane 3 Faulting Plots
0.00
0.05
0.10
0.15
0.20
0.25
0.30
0.35
0.40
0.45
0.50
Ave
rage
Fau
lting
(in)
139.
5 - 1
39.6
139.
6 - 1
39.7
139.
7 - 1
39.8
139.
8 - 1
39.9
139.
9 - 1
4014
0 - 1
40.1
140.
1 - 1
40.2
140.
2 - 1
40.3
140.
3 - 1
40.4
140.
4 - 1
40.5
140.
5 - 1
40.6
140.
6 - 1
40.7
140.
7 - 1
40.8
140.
8 - 1
40.9
140.
9 - 1
4114
1 - 1
41.1
141.
1 - 1
41.2
141.
2 - 1
41.3
141.
3 - 1
41.4
141.
4 - 1
41.5
141.
5 - 1
41.6
141.
6 - 1
41.7
141.
7 - 1
41.8
141.
8 - 1
41.9
141.
9 - 1
4214
2.04
- 14
2.14
142.
14 -
142.
2414
2.24
- 14
2.34
142.
34 -
142.
4414
2.44
- 14
2.54
142.
54 -
142.
6414
2.64
- 14
2.74
142.
74 -
142.
7914
2.82
- 14
2.92
142.
92 -
143.
0214
3.02
- 14
3.12
143.
12 -
143.
2214
3.22
- 14
3.32
143.
32 -
143.
4214
3.42
- 14
3.52
143.
52 -
143.
6214
3.62
- 14
3.72
143.
72 -
143.
82
Mile Post
Northbound Lane 3 Faulting MP 139.5 to MP 143.82
I-8

0.00
0.05
0.10
0.15
0.20
0.25
0.30
0.35
0.40
0.45
0.50
Ave
rage
Fau
lting
(in)
143.
82 -
143.
9214
3.92
- 14
4.02
144.
02 -
144.
1214
4.12
- 14
4.19
144.
19 -
144.
2914
4.29
- 14
4.39
144.
39 -
144.
4914
4.49
- 14
4.59
Brid
ge -
144.
79 -
144.
8914
4.89
- 14
4.99
144.
99 -
145.
0914
5.09
- 14
5.19
145.
19 -
145.
2914
5.29
- 14
5.39
145.
39 -
145.
4914
5.49
- 14
5.59
145.
59 -
145.
69Br
idge
-
145.
89 -
145.
9914
5.99
- 14
6.09
146.
09 -
146.
1914
6.19
- 14
6.29
146.
29 -
146.
33Br
idge
-
146.
53 -
146.
6314
6.63
- 14
6.73
Brid
ge -
146.
93 -
147.
0314
7.03
- 14
7.13
147.
13 -
147.
2314
7.23
- 14
7.33
147.
33 -
147.
4314
7.43
- 14
7.53
147.
53 -
147.
6314
7.63
- 14
7.64
Brid
ge -
147.
77 -
147.
8714
7.87
- 14
7.97
147.
97 -
148.
0714
8.07
- 14
8.17
148.
17 -
148.
27
Mile Post
Northbound Lane 3 Faulting MP 143.82 to MP 148.27
0.00
0.05
0.10
0.15
0.20
0.25
0.30
0.35
0.40
0.45
0.50
Ave
rage
Fau
lting
(in)
148.
27 -
148.
3714
8.37
- 14
8.47
148.
47 -
148.
5714
8.57
- 14
8.67
148.
67 -
148.
7714
8.77
- 14
8.87
148.
87 -
148.
9714
8.97
- 14
9.07
Brid
ge -
149.
32 -
149.
4214
9.42
- 14
9.52
149.
52 -
149.
6214
9.62
- 14
9.72
149.
72 -
149.
8214
9.82
- 14
9.92
149.
92 -
150.
0215
0.02
- 15
0.12
150.
12 -
150.
2215
0.22
- 15
0.32
150.
32 -
150.
4215
0.42
- 15
0.52
150.
52 -
150.
6215
0.62
- 15
0.72
150.
72 -
150.
8215
0.82
- 15
0.92
150.
92 -
151.
0215
1.02
- 15
1.12
151.
12 -
151.
2215
1.22
- 15
1.23
151.
23 -
151.
3315
1.33
- 15
1.43
151.
43 -
151.
5315
1.53
- 15
1.63
151.
63 -
151.
7315
1.73
- 15
1.83
151.
83 -
151.
9315
1.93
- 15
2.03
152.
03 -
152.
1315
2.13
- 15
2.23
Brid
ge -
152.
39 -
152.
4915
2.49
- 15
2.59
152.
59 -
152.
69
Mile Post
Northbound Lane 3 Faulting MP 148.27 to MP 152.69
I-9

0.00
0.05
0.10
0.15
0.20
0.25
0.30
0.35
0.40
0.45
0.50
Ave
rage
Fau
lting
(in)
152.
69 -
152.
7915
2.79
- 15
2.89
152.
89 -
152.
99
152.
99 -
153.
0915
3.09
- 15
3.19
153.
19 -
153.
215
3.2
- 153
.315
3.3
- 153
.415
3.4
- 153
.515
3.5
- 153
.6Br
idge
- 15
3.8
- 153
.915
3.9
- 154
154
- 154
.115
4.1
- 154
.14
Diam
ond
Gro
und
-
158.
31 -
158.
4115
8.41
- 15
8.51
158.
51 -
158.
6115
8.61
- 15
8.71
158.
71 -
158.
81
158.
81 -
158.
9115
8.91
- 15
9.01
159.
01 -
159.
115
9.1
- 159
.215
9.2
- 159
.315
9.3
- 159
.415
9.4
- 159
.515
9.5
- 159
.6Br
idge
-
159.
81 -
159.
9115
9.91
- 16
0.01
160.
01 -
160.
11
160.
11 -
160.
2116
0.21
- 16
0.31
160.
31 -
160.
41
160.
41 -
160.
5116
0.51
- 16
0.61
160.
61 -
160.
7116
0.71
- 16
0.75
160.
75 -
160.
8516
0.85
- 16
0.95
160.
95 -
161.
05
Mile Post
Northbound Lane 3 Faulting MP 152.69 to MP 161.05
0.00
0.05
0.10
0.15
0.20
0.25
0.30
0.35
0.40
0.45
0.50
Ave
rage
Fau
lting
(in)
161.
05 -
161.
1516
1.15
- 16
1.25
161.
25 -
161.
3516
1.35
- 16
1.45
161.
45 -
161.
55Br
idge
-
161.
78 -
161.
8816
1.88
- 16
1.98
161.
98 -
162.
0816
2.08
- 16
2.18
162.
18 -
162.
19Br
idge
-
162.
46 -
162.
5616
2.56
- 16
2.66
162.
66 -
162.
76Br
idge
-
164.
37 -
164.
4716
4.47
- 16
4.57
Brid
ge -
164.
67 -
164.
77Br
idge
-
165.
03 -
165.
1316
5.13
- 16
5.23
Brid
ge -
166.
31 -
166.
4116
6.41
- 16
6.51
166.
51 -
166.
6116
6.61
- 16
6.71
166.
71 -
166.
8116
6.81
- 16
6.91
Brid
ge -
167.
08 -
167.
1816
7.18
- 16
7.28
Brid
ge -
167.
77 -
167.
8716
7.87
- 16
7.97
167.
97 -
168.
0716
8.07
- 16
8.17
168.
17 -
168.
2716
8.27
- 16
8.34
Brid
ge -
169.
28 -
169.
3816
9.38
- 16
9.48
Mile Post
Northbound Lane 3 Faulting MP 161.05 to MP 169.48
I-10

0.00
0.05
0.10
0.15
0.20
0.25
0.30
0.35
0.40
0.45
0.50
Ave
rage
Fau
lting
(in)
169.
48 -
169.
5816
9.58
- 16
9.68
169.
68 -
169.
7816
9.78
- 16
9.88
169.
88 -
169.
9816
9.98
- 17
0.08
170.
08 -
170.
18Br
idge
- 17
0.6
- 170
.717
0.7
- 170
.817
0.8
- 170
.917
0.9
- 171
171
- 171
.117
1.1
- 171
.217
1.2
- 171
.317
1.3
- 171
.417
1.4
- 171
.517
1.5
- 171
.617
1.6
- 171
.717
1.7
- 171
.817
1.8
- 171
.917
1.9
- 172
172
- 172
.117
2.1
- 172
.217
2.2
- 172
.3Br
idge
- 17
2.4
- 172
.517
2.5
- 172
.617
2.6
- 172
.7Br
idge
-
172.
89 -
172.
9917
2.99
- 17
3.09
173.
09 -
173.
1917
3.19
- 17
3.29
173.
29 -
173.
3917
3.39
- 17
3.49
173.
49 -
173.
5917
3.59
- 17
3.69
173.
69 -
173.
7917
3.79
- 17
3.89
173.
89 -
173.
9917
3.99
- 17
4.09
174.
09 -
174.
14
Mile Post
Northbound Lane 3 Faulting MP 169.48 to MP 174.14
0.00
0.05
0.10
0.15
0.20
0.25
0.30
0.35
0.40
0.45
0.50
Ave
rage
Fau
lting
(in)
174.
14 -
174.
2417
4.24
- 17
4.34
174.
34 -
174.
4417
4.44
- 17
4.54
174.
54 -
174.
6417
4.64
- 17
4.74
174.
74 -
174.
8417
4.84
- 17
4.94
174.
94 -
175.
0417
5.04
- 17
5.11
Brid
ge -
175.
24 -
175.
3417
5.34
- 17
5.44
Brid
ge -
175.
54 -
175.
6417
5.64
- 17
5.74
175.
74 -
175.
8417
5.84
- 17
5.94
175.
94 -
176.
0417
6.04
- 17
6.13
Brid
ge -
176.
26 -
176.
3617
6.36
- 17
6.46
176.
46 -
176.
5617
6.56
- 17
6.66
176.
66 -
176.
717
6.7
- 176
.817
6.8
- 176
.917
6.9
- 177
177
- 177
.117
7.1
- 177
.217
7.2
- 177
.317
7.3
- 177
.417
7.4
- 177
.517
7.5
- 177
.617
7.6
- 177
.7
Mile Post
Northbound Lane 3 Faulting MP 174.14 to MP 177.70
I-11

Northbound Lane 4 Faulting Plots
0.00
0.05
0.10
0.15
0.20
0.25
0.30
0.35
0.40
0.45
0.50
Ave
rage
Fau
lting
(in)
139.
5 - 1
39.6
139.
6 - 1
39.7
139.
7 - 1
39.8
139.
8 - 1
39.9
139.
9 - 1
4014
0 - 1
40.1
140.
1 - 1
40.2
140.
2 - 1
40.3
140.
3 - 1
40.4
140.
4 - 1
40.5
140.
5 - 1
40.6
140.
6 - 1
40.7
140.
7 - 1
40.8
140.
8 - 1
40.9
140.
9 - 1
4114
1 - 1
41.1
141.
1 - 1
41.2
141.
2 - 1
41.3
141.
3 - 1
41.4
141.
4 - 1
41.5
141.
5 - 1
41.6
141.
6 - 1
41.7
141.
7 - 1
41.8
141.
8 - 1
41.9
141.
9 - 1
4214
2.04
- 14
2.14
142.
14 -
142.
2414
2.24
- 14
2.34
142.
34 -
142.
4414
2.44
- 14
2.54
142.
54 -
142.
6414
2.64
- 14
2.74
142.
74 -
142.
7914
2.82
- 14
2.92
142.
92 -
143.
0214
3.02
- 14
3.12
143.
12 -
143.
2214
3.22
- 14
3.32
143.
32 -
143.
4214
3.42
- 14
3.52
143.
52 -
143.
62
Mile Post
Northbound Lane 4 Faulting MP 139.50 to MP 143.62
0.00
0.05
0.10
0.15
0.20
0.25
0.30
0.35
0.40
0.45
0.50
Ave
rage
Fau
lting
(in)
143.
62 -
143.
7214
3.72
- 14
3.82
143.
82 -
143.
9214
3.92
- 14
4.02
144.
02 -
144.
1214
4.12
- 14
4.19
144.
19 -
144.
2914
4.29
- 14
4.39
144.
39 -
144.
4914
4.49
- 14
4.59
Brid
ge -
144.
79 -
144.
8914
4.89
- 14
4.99
144.
99 -
145.
0914
5.09
- 14
5.19
145.
19 -
145.
2914
5.29
- 14
5.39
145.
39 -
145.
4914
5.49
- 14
5.59
145.
59 -
145.
69Br
idge
-
145.
89 -
145.
9914
5.99
- 14
6.09
146.
09 -
146.
1914
6.19
- 14
6.29
146.
29 -
146.
33Br
idge
-
146.
53 -
146.
6314
6.63
- 14
6.73
Brid
ge -
146.
93 -
147.
0314
7.03
- 14
7.13
147.
13 -
147.
2314
7.23
- 14
7.33
147.
33 -
147.
4314
7.43
- 14
7.53
147.
53 -
147.
63Br
idge
-
147.
67 -
147.
7714
7.77
- 14
7.87
Mile Post
Northbound Lane 4 Faulting MP 143.62 to MP 147.87
I-12

0.00
0.05
0.10
0.15
0.20
0.25
0.30
0.35
0.40
0.45
0.50
Ave
rage
Fau
lting
(in)
147.
87 -
147.
9714
7.97
- 14
8.07
148.
07 -
148.
1714
8.17
- 14
8.27
148.
27 -
148.
3714
8.37
- 14
8.47
148.
47 -
148.
5714
8.57
- 14
8.67
148.
67 -
148.
7714
8.77
- 14
8.87
148.
87 -
148.
9714
8.97
- 14
9.07
Brid
ge -
149.
22 -
149.
3214
9.32
- 14
9.42
149.
42 -
149.
5214
9.52
- 14
9.62
149.
62 -
149.
7214
9.72
- 14
9.82
149.
82 -
149.
9214
9.92
- 15
0.02
150.
02 -
150.
1215
0.12
- 15
0.22
150.
22 -
150.
3215
0.32
- 15
0.42
150.
42 -
150.
5215
0.52
- 15
0.62
150.
62 -
150.
7215
0.72
- 15
0.82
150.
82 -
150.
9215
0.92
- 15
1.02
151.
02 -
151.
1215
1.12
- 15
1.22
151.
22 -
151.
3215
1.32
- 15
1.42
151.
42 -
151.
5215
1.52
- 15
1.62
151.
62 -
151.
7215
1.72
- 15
1.82
151.
82 -
151.
9215
1.92
- 15
1.97
Mile Post
Northbound Lane 4 Faulting MP 147.87 to MP 151.97
0.00
0.05
0.10
0.15
0.20
0.25
0.30
0.35
0.40
0.45
0.50
Ave
rage
Fau
lting
(in)
151.
99 -
152.
0915
2.09
- 15
2.19
152.
19 -
152.
2615
2.29
- 15
2.39
152.
39 -
152.
4915
2.49
- 15
2.59
152.
59 -
152.
6915
2.69
- 15
2.79
152.
79 -
152.
8915
2.89
- 15
2.99
152.
99 -
153.
0915
3.09
- 15
3.19
153.
19 -
153.
215
3.2
- 153
.315
3.3
- 153
.415
3.4
- 153
.515
3.5
- 153
.615
3.6
- 153
.715
3.7
- 153
.815
3.8
- 153
.915
3.9
- 154
154
- 154
.115
4.1
- 154
.14
Diam
ond
Gro
und
-
158.
31 -
158.
4115
8.41
- 15
8.51
158.
51 -
158.
6115
8.61
- 15
8.71
158.
71 -
158.
8115
8.81
- 15
8.91
158.
91 -
159.
0115
9.01
- 15
9.1
159.
1 - 1
59.2
159.
2 - 1
59.3
159.
3 - 1
59.4
159.
4 - 1
59.5
159.
5 - 1
59.6
159.
6 - 1
59.6
715
9.71
- 15
9.81
159.
81 -
159.
9115
9.91
- 16
0.01
Mile Post
Northbound Lane 4 Faulting MP 151.99 to MP 160.01
I-13

0.00
0.05
0.10
0.15
0.20
0.25
0.30
0.35
0.40
0.45
0.50
Ave
rage
Fau
lting
(in)
160.
01 -
160.
1116
0.11
- 16
0.21
160.
21 -
160.
3116
0.31
- 16
0.41
160.
41 -
160.
5116
0.51
- 16
0.61
160.
61 -
160.
7116
0.71
- 16
0.75
160.
75 -
160.
8516
0.85
- 16
0.95
160.
95 -
161.
0516
1.05
- 16
1.15
161.
15 -
161.
2516
1.25
- 16
1.35
161.
35 -
161.
4516
1.45
- 16
1.55
Brid
ge -
161.
68 -
161.
7816
1.78
- 16
1.88
161.
88 -
161.
9816
1.98
- 16
2.08
162.
08 -
162.
18Br
idge
-
162.
36 -
162.
4616
2.46
- 16
2.56
162.
56 -
162.
6616
2.66
- 16
2.76
162.
76 -
162.
8216
2.96
- 16
3.04
163.
2 - 1
63.2
416
4.37
- 16
4.47
164.
47 -
164.
5716
4.57
- 16
4.67
164.
67 -
164.
7716
4.77
- 16
4.8
164.
93 -
165.
0316
5.03
- 16
5.13
165.
13 -
165.
23Br
idge
-
166.
21 -
166.
3116
6.31
- 16
6.41
Mile Post
Northbound Lane 4 Faulting MP 160.01 to MP 166.41
0.00
0.05
0.10
0.15
0.20
0.25
0.30
0.35
0.40
0.45
0.50
Ave
rage
Fau
lting
(in)
166.
41 -
166.
51
166.
51 -
166.
61
166.
61 -
166.
71
166.
71 -
166.
81
166.
81 -
166.
91Br
idge
-
167.
08 -
167.
18
167.
18 -
167.
28
167.
28 -
167.
35Br
idge
-
167.
77 -
167.
87
167.
87 -
167.
97
167.
97 -
168.
07
168.
07 -
168.
17
168.
17 -
168.
27Br
idge
-
169.
18 -
169.
28
169.
28 -
169.
38
169.
38 -
169.
48
169.
48 -
169.
58
169.
58 -
169.
68
169.
68 -
169.
78
169.
78 -
169.
88
169.
88 -
169.
98
169.
98 -
170.
08
170.
08 -
170.
18Br
idge
- 17
0.6
- 170
.717
0.7
- 170
.817
0.8
- 170
.917
0.9
- 171
171
- 171
.117
1.1
- 171
.217
1.2
- 171
.317
1.3
- 171
.417
1.4
- 171
.517
1.5
- 171
.617
1.6
- 171
.717
1.7
- 171
.817
1.8
- 171
.917
1.9
- 172
172
- 172
.117
2.1
- 172
.217
2.2
- 172
.3Br
idge
- 17
2.4
- 172
.5
Mile Post
Northbound Lane 4 Faulting MP 166.41 to MP 172.50
I-14

0.00
0.05
0.10
0.15
0.20
0.25
0.30
0.35
0.40
0.45
0.50
Ave
rage
Fau
lting
(in)
Mile Post
Northbound Lane 4 Faulting MP 172.50 to MP 177.75
Southbound Lane 1 Faulting Plots
0.00
0.05
0.10
0.15
0.20
0.25
0.30
0.35
0.40
0.45
0.50
Ave
rage
Fau
lting
(in)
139.
5 - 1
39.6
139.
6 - 1
39.7
139.
7 - 1
39.8
139.
8 - 1
39.9
139.
9 - 1
4014
0 - 1
40.1
140.
1 - 1
40.2
140.
2 - 1
40.3
140.
3 - 1
40.4
140.
4 - 1
40.5
140.
5 - 1
40.6
140.
6 - 1
40.7
140.
7 - 1
40.8
140.
8 - 1
40.9
140.
9 - 1
4114
1 - 1
41.1
141.
1 - 1
41.2
141.
2 - 1
41.3
141.
3 - 1
41.4
141.
4 - 1
41.5
141.
5 - 1
41.6
141.
6 - 1
41.7
141.
7 - 1
41.8
141.
8 - 1
41.9
141.
9 - 1
4214
2.04
- 14
2.09
142.
09 -
142.
1914
2.19
- 14
2.29
142.
29 -
142.
3914
2.39
- 14
2.49
142.
49 -
142.
5914
2.59
- 14
2.69
142.
69 -
142.
7914
2.81
- 14
2.89
142.
89 -
142.
9914
2.99
- 14
3.09
143.
09 -
143.
1914
3.19
- 14
3.29
Mile Post
Southbound Lane 1 Faulting MP 139.50 to MP 143.29
I-15

0.00
0.05
0.10
0.15
0.20
0.25
0.30
0.35
0.40
0.45
0.50
Ave
rage
Fau
lting
(in)
139.
5 - 1
39.6
139.
6 - 1
39.7
139.
7 - 1
39.8
139.
8 - 1
39.9
139.
9 - 1
4014
0 - 1
40.1
140.
1 - 1
40.2
140.
2 - 1
40.3
140.
3 - 1
40.4
140.
4 - 1
40.5
140.
5 - 1
40.6
140.
6 - 1
40.7
140.
7 - 1
40.8
140.
8 - 1
40.9
140.
9 - 1
4114
1 - 1
41.1
141.
1 - 1
41.2
141.
2 - 1
41.3
141.
3 - 1
41.4
141.
4 - 1
41.5
141.
5 - 1
41.6
141.
6 - 1
41.7
141.
7 - 1
41.8
141.
8 - 1
41.9
141.
9 - 1
4214
2.04
- 14
2.09
142.
09 -
142.
1914
2.19
- 14
2.29
142.
29 -
142.
3914
2.39
- 14
2.49
142.
49 -
142.
5914
2.59
- 14
2.69
142.
69 -
142.
7914
2.81
- 14
2.89
142.
89 -
142.
9914
2.99
- 14
3.09
143.
09 -
143.
1914
3.19
- 14
3.29
Mile Post
Southbound Lane 1 Faulting MP 139.50 to MP 143.29
0.00
0.05
0.10
0.15
0.20
0.25
0.30
0.35
0.40
0.45
0.50
Ave
rage
Fau
lting
(in)
143.
29 -
143.
3914
3.39
- 14
3.49
143.
49 -
143.
5914
3.59
- 14
3.69
143.
69 -
143.
7914
3.79
- 14
3.89
143.
89 -
143.
9914
3.99
- 14
4.09
144.
09 -
144.
1914
4.19
- 14
4.29
144.
29 -
144.
39DB
R an
d DG
-
146.
21 -
146.
31Br
idge
-
146.
51 -
146.
6114
6.61
- 14
6.71
Brid
ge -
146.
84 -
146.
9414
6.94
- 14
7.04
147.
04 -
147.
1414
7.14
- 14
7.24
147.
24 -
147.
3414
7.34
- 14
7.44
147.
44 -
147.
5414
7.54
- 14
7.58
DBR
and
DG -
149.
76 -
149.
8414
9.84
- 14
9.94
149.
94 -
150.
0415
0.04
- 15
0.14
150.
14 -
150.
2415
0.24
- 15
0.34
150.
34 -
150.
4415
0.44
- 15
0.54
150.
54 -
150.
6415
0.64
- 15
0.74
150.
74 -
150.
8415
0.84
- 15
0.94
Mile Post
Southbound Lane 1 Faulting MP 143.29 to MP 150.94
I-16

0.00
0.05
0.10
0.15
0.20
0.25
0.30
0.35
0.40
0.45
0.50
Ave
rage
Fau
lting
(in)
150.
94 -
151.
0415
1.04
- 15
1.14
151.
14 -
151.
2415
1.24
- 15
1.34
151.
34 -
151.
4415
1.44
- 15
1.54
151.
54 -
151.
6415
1.64
- 15
1.74
151.
74 -
151.
8415
1.84
- 15
1.94
151.
94 -
152.
0415
2.04
- 15
2.14
152.
14 -
152.
15Br
idge
-
152.
35 -
152.
4515
2.45
- 15
2.55
152.
55 -
152.
6515
2.65
- 15
2.75
152.
75 -
152.
8515
2.85
- 15
2.95
152.
95 -
153.
0515
3.05
- 15
3.15
153.
15 -
153.
2415
3.24
- 15
3.34
153.
34 -
153.
4415
3.44
- 15
3.54
153.
54 -
153.
6415
3.64
- 15
3.74
153.
74 -
153.
8415
3.84
- 15
3.94
153.
94 -
154.
0415
4.04
- 15
4.06
Diam
ond
Gro
und
-
158.
46 -
158.
5615
8.56
- 15
8.66
158.
66 -
158.
7615
8.76
- 15
8.86
158.
86 -
158.
96
Mile Post
Southbound Lane 1 Faulting MP 150.94 to MP 158.96
0.00
0.05
0.10
0.15
0.20
0.25
0.30
0.35
0.40
0.45
0.50
Ave
rage
Fau
lting
(in)
158.
98 -
159.
0715
9.07
- 15
9.17
159.
17 -
159.
2715
9.27
- 15
9.37
159.
37 -
159.
4715
9.47
- 15
9.57
Brid
ge -
159.
71 -
159.
7515
9.75
- 15
9.85
159.
85 -
159.
9515
9.95
- 16
0.05
Brid
ge -
160.
25 -
160.
3516
0.35
- 16
0.45
160.
45 -
160.
5516
0.55
- 16
0.65
160.
65 -
160.
7516
0.75
- 16
0.85
160.
85 -
160.
9416
0.94
- 16
1.04
161.
04 -
161.
1416
1.14
- 16
1.24
161.
24 -
161.
3416
1.34
- 16
1.44
Brid
ge -
161.
74 -
161.
8416
1.84
- 16
1.94
161.
94 -
162.
0416
2.04
- 16
2.14
162.
14 -
162.
2416
2.37
- 16
2.42
162.
42 -
162.
5216
2.52
- 16
2.62
162.
62 -
162.
7216
2.72
- 16
2.82
165.
83 -
165.
8616
5.86
- 16
5.96
165.
96 -
166.
06
Mile Post
Southbound Lane 1 Faulting MP 158.98 to MP 166.06
I-17

0.00
0.05
0.10
0.15
0.20
0.25
0.30
0.35
0.40
0.45
0.50
Ave
rage
Fau
lting
(in)
166.
06 -
166.
1616
6.16
- 16
6.26
166.
26 -
166.
3616
7.72
- 16
7.74
167.
74 -
167.
8416
7.84
- 16
7.94
167.
94 -
168.
0416
8.04
- 16
8.14
168.
14 -
168.
24Br
idge
-
169.
18 -
169.
2516
9.25
- 16
9.35
169.
35 -
169.
4516
9.45
- 16
9.55
169.
55 -
169.
6516
9.65
- 16
9.75
169.
75 -
169.
8516
9.85
- 16
9.95
169.
95 -
170.
0517
0.05
- 17
0.15
170.
15 -
170.
2517
2.52
- 17
2.54
172.
54 -
172.
6417
2.64
- 17
2.74
Brid
ge -
172.
84 -
172.
9417
2.94
- 17
3.04
173.
04 -
173.
1417
3.14
- 17
3.24
173.
24 -
173.
3417
3.34
- 17
3.44
173.
44 -
173.
5417
3.54
- 17
3.64
173.
64 -
173.
7417
3.74
- 17
3.84
173.
84 -
173.
9417
3.94
- 17
4.04
174.
04 -
174.
14
Mile Post
Southbound Lane 1 Faulting MP 166.06 to MP 174.14
Southbound Lane 2 Faulting Plots
0.00
0.05
0.10
0.15
0.20
0.25
0.30
0.35
0.40
0.45
0.50
Ave
rage
Fau
lting
(in)
139.
5 - 1
39.6
139.
6 - 1
39.7
139.
7 - 1
39.8
139.
8 - 1
39.9
139.
9 - 1
4014
0 - 1
40.1
140.
1 - 1
40.2
140.
2 - 1
40.3
140.
3 - 1
40.4
140.
4 - 1
40.5
140.
5 - 1
40.6
140.
6 - 1
40.7
140.
7 - 1
40.8
140.
8 - 1
40.9
140.
9 - 1
4114
1 - 1
41.1
141.
1 - 1
41.2
141.
2 - 1
41.3
141.
3 - 1
41.4
141.
4 - 1
41.5
141.
5 - 1
41.6
141.
6 - 1
41.7
141.
7 - 1
41.8
141.
8 - 1
41.9
141.
9 - 1
4214
2.04
- 14
2.09
142.
09 -
142.
1914
2.19
- 14
2.29
142.
29 -
142.
3914
2.39
- 14
2.49
142.
49 -
142.
5914
2.59
- 14
2.69
142.
69 -
142.
7914
2.81
- 14
2.89
142.
89 -
142.
9914
2.99
- 14
3.09
143.
09 -
143.
1914
3.19
- 14
3.29
143.
29 -
143.
3914
3.39
- 14
3.49
143.
49 -
143.
5914
3.59
- 14
3.69
Mile Post
Southbound Lane 2 Faulting MP 139.50 to MP 143.69
I-18

0.00
0.05
0.10
0.15
0.20
0.25
0.30
0.35
0.40
0.45
0.50
Ave
rage
Fau
lting
(in)
143.
69 -
143.
7914
3.79
- 14
3.89
143.
89 -
143.
9914
3.99
- 14
4.09
144.
09 -
144.
1914
4.19
- 14
4.29
144.
29 -
144.
39DB
R an
d DG
-
146.
21 -
146.
31Br
idge
-
146.
51 -
146.
6114
6.61
- 14
6.71
Brid
ge -
146.
84 -
146.
9414
6.94
- 14
7.04
147.
04 -
147.
1414
7.14
- 14
7.24
147.
24 -
147.
3414
7.34
- 14
7.44
147.
44 -
147.
5414
7.54
- 14
7.58
DBR
and
DG -
149.
76 -
149.
8414
9.84
- 14
9.94
149.
94 -
150.
0415
0.04
- 15
0.14
150.
14 -
150.
2415
0.24
- 15
0.34
150.
34 -
150.
4415
0.44
- 15
0.54
150.
54 -
150.
6415
0.64
- 15
0.74
150.
74 -
150.
8415
0.84
- 15
0.94
150.
94 -
151.
0415
1.04
- 15
1.14
151.
14 -
151.
2415
1.24
- 15
1.34
151.
34 -
151.
4415
1.44
- 15
1.54
151.
54 -
151.
64
Mile Post
Southbound Lane 2 Faulting MP 143.69 to MP 151.64
0.00
0.05
0.10
0.15
0.20
0.25
0.30
0.35
0.40
0.45
0.50
Ave
rage
Fau
lting
(in)
151.
64 -
151.
7415
1.74
- 15
1.84
151.
84 -
151.
9415
1.94
- 15
2.04
152.
04 -
152.
1415
2.14
- 15
2.15
Brid
ge -
152.
35 -
152.
4515
2.45
- 15
2.55
152.
55 -
152.
6515
2.65
- 15
2.75
152.
75 -
152.
8515
2.85
- 15
2.95
152.
95 -
153.
0515
3.05
- 15
3.15
153.
15 -
153.
2415
3.24
- 15
3.34
153.
34 -
153.
4415
3.44
- 15
3.54
153.
54 -
153.
6415
3.64
- 15
3.74
153.
74 -
153.
8415
3.84
- 15
3.94
153.
94 -
154.
0415
4.04
- 15
4.06
Diam
ond
Gro
und
- 15
8.5
- 158
.615
8.6
- 158
.715
8.7
- 158
.815
8.8
- 158
.915
8.9
- 159
159
- 159
.115
9.1
- 159
.17
159.
17 -
159.
2715
9.27
- 15
9.37
159.
37 -
159.
4715
9.47
- 15
9.57
159.
57 -
159.
6715
9.71
- 15
9.75
159.
75 -
159.
8515
9.85
- 15
9.95
Mile Post
Southbound Lane 2 Faulting MP 151.64 to MP 159.95
I-19

0.00
0.05
0.10
0.15
0.20
0.25
0.30
0.35
0.40
0.45
0.50
Ave
rage
Fau
lting
(in)
160.
25 -
160.
3516
0.35
- 16
0.45
160.
45 -
160.
5516
0.55
- 16
0.65
160.
65 -
160.
7516
0.75
- 16
0.85
160.
85 -
160.
9416
0.94
- 16
1.04
161.
04 -
161.
1416
1.14
- 16
1.24
161.
24 -
161.
3416
1.34
- 16
1.44
Brid
ge -
161.
74 -
161.
8416
1.84
- 16
1.94
161.
94 -
162.
0416
2.04
- 16
2.14
Brid
ge -
162.
37 -
162.
4216
2.42
- 16
2.52
162.
52 -
162.
6216
2.62
- 16
2.72
Brid
ge -
165.
53 -
165.
5816
5.58
- 16
5.68
165.
68 -
165.
7816
5.78
- 16
5.88
165.
88 -
165.
9816
5.98
- 16
6.08
166.
08 -
166.
1816
6.18
- 16
6.28
Brid
ge -
167.
72 -
167.
7416
7.74
- 16
7.84
167.
84 -
167.
9416
7.94
- 16
8.04
168.
04 -
168.
1416
8.14
- 16
8.24
Brid
ge -
169.
18 -
169.
25
Mile Post
Southbound Lane 2 Faulting MP 160.25 to MP 169.25
0.00
0.05
0.10
0.15
0.20
0.25
0.30
0.35
0.40
0.45
0.50
Ave
rage
Fau
lting
(in)
169.
25 -
169.
3516
9.35
- 16
9.45
169.
45 -
169.
5516
9.55
- 16
9.65
169.
65 -
169.
7516
9.75
- 16
9.85
169.
85 -
169.
9516
9.95
- 17
0.05
170.
05 -
170.
1517
0.15
- 17
0.25
Brid
ge -
170.
59 -
170.
6917
0.69
- 17
0.79
170.
79 -
170.
8917
0.89
- 17
0.99
170.
99 -
171.
0917
1.09
- 17
1.19
171.
19 -
171.
2917
1.29
- 17
1.39
171.
39 -
171.
4917
1.49
- 17
1.59
171.
59 -
171.
6917
1.69
- 17
1.79
171.
79 -
171.
8917
1.89
- 17
1.92
171.
92 -
172.
0217
2.02
- 17
2.12
172.
12 -
172.
2217
2.22
- 17
2.32
172.
32 -
172.
4217
2.42
- 17
2.52
172.
52 -
172.
5417
2.54
- 17
2.64
172.
64 -
172.
74Br
idge
-
172.
84 -
172.
9417
2.94
- 17
3.04
173.
04 -
173.
1417
3.14
- 17
3.24
173.
24 -
173.
3417
3.34
- 17
3.44
Mile Post
Southbound Lane 2 Faulting MP 169.25 to MP 173.44
I-20

0.00
0.05
0.10
0.15
0.20
0.25
0.30
0.35
0.40
0.45
0.50
Ave
rage
Fau
lting
(in)
173.
44 -
173.
5417
3.54
- 17
3.64
173.
64 -
173.
7417
3.74
- 17
3.84
173.
84 -
173.
9417
3.94
- 17
4.04
174.
04 -
174.
1417
4.14
- 17
4.21
174.
21 -
174.
3117
4.31
- 17
4.41
174.
41 -
174.
5117
4.51
- 17
4.61
174.
61 -
174.
7117
4.71
- 17
4.81
174.
81 -
174.
9117
4.91
- 17
5.01
Brid
ge -
175.
23 -
175.
3317
5.33
- 17
5.43
Brid
ge -
175.
53 -
175.
6317
5.63
- 17
5.73
175.
73 -
175.
8317
5.83
- 17
5.93
175.
93 -
176.
03Br
idge
-
176.
16 -
176.
16Br
idge
-
176.
26 -
176.
3617
6.36
- 17
6.46
176.
46 -
176.
5617
6.56
- 17
6.66
176.
66 -
176.
7617
6.76
- 17
6.86
176.
86 -
176.
9617
6.96
- 17
7.05
177.
05 -
177.
1517
7.15
- 17
7.25
177.
25 -
177.
3517
7.35
- 17
7.45
177.
45 -
177.
5517
7.55
- 17
7.65
Mile Post
Southbound Lane 2 Faulting MP 173.44 to MP 177.65
Southbound Lane 3 Faulting Plots
0.00
0.05
0.10
0.15
0.20
0.25
0.30
0.35
0.40
0.45
0.50
Ave
rage
Fau
lting
(in)
139.
5 - 1
39.6
139.
6 - 1
39.7
139.
7 - 1
39.8
139.
8 - 1
39.9
139.
9 - 1
4014
0 - 1
40.1
140.
1 - 1
40.2
140.
2 - 1
40.3
140.
3 - 1
40.4
140.
4 - 1
40.5
140.
5 - 1
40.6
140.
6 - 1
40.7
140.
7 - 1
40.8
140.
8 - 1
40.9
140.
9 - 1
4114
1 - 1
41.1
141.
1 - 1
41.2
141.
2 - 1
41.3
141.
3 - 1
41.4
141.
4 - 1
41.5
141.
5 - 1
41.6
141.
6 - 1
41.7
141.
7 - 1
41.8
141.
8 - 1
41.9
141.
9 - 1
4214
2.04
- 14
2.09
142.
09 -
142.
1914
2.19
- 14
2.29
142.
29 -
142.
3914
2.39
- 14
2.49
142.
49 -
142.
5914
2.59
- 14
2.69
142.
69 -
142.
7914
2.81
- 14
2.89
142.
89 -
142.
9914
2.99
- 14
3.09
143.
09 -
143.
1914
3.19
- 14
3.29
143.
29 -
143.
3914
3.39
- 14
3.49
143.
49 -
143.
5914
3.59
- 14
3.69
Mile Post
Southbound Lane 3 Faulting MP 139.50 to MP 143.69
I-21

0.00
0.05
0.10
0.15
0.20
0.25
0.30
0.35
0.40
0.45
0.50
Ave
rage
Fau
lting
(in)
143.
69 -
143.
7914
3.79
- 14
3.89
143.
89 -
143.
9914
3.99
- 14
4.09
144.
09 -
144.
1914
4.19
- 14
4.29
144.
29 -
144.
39DB
R an
d DG
-
146.
21 -
146.
31Br
idge
-
146.
51 -
146.
6114
6.61
- 14
6.71
146.
71 -
146.
81Br
idge
-
146.
94 -
147.
0414
7.04
- 14
7.14
147.
14 -
147.
2414
7.24
- 14
7.34
147.
34 -
147.
4414
7.44
- 14
7.54
147.
54 -
147.
58DB
R an
d DG
-
149.
76 -
149.
8414
9.84
- 14
9.94
149.
94 -
150.
0415
0.04
- 15
0.14
150.
14 -
150.
2415
0.24
- 15
0.34
150.
34 -
150.
4415
0.44
- 15
0.54
150.
54 -
150.
6415
0.64
- 15
0.74
150.
74 -
150.
8415
0.84
- 15
0.94
150.
94 -
151.
0415
1.04
- 15
1.14
151.
14 -
151.
2415
1.24
- 15
1.34
151.
34 -
151.
4415
1.44
- 15
1.54
151.
54 -
151.
6415
1.64
- 15
1.74
Mile Post
Southbound Lane 3 Faulting MP 143.69 to MP 151.74
0.00
0.05
0.10
0.15
0.20
0.25
0.30
0.35
0.40
0.45
0.50
Ave
rage
Fau
lting
(in)
151.
74 -
151.
8415
1.84
- 15
1.94
151.
94 -
152.
0415
2.04
- 15
2.14
152.
14 -
152.
1515
2.15
- 15
2.25
Brid
ge -
152.
35 -
152.
4515
2.45
- 15
2.55
152.
55 -
152.
6515
2.65
- 15
2.75
152.
75 -
152.
8515
2.85
- 15
2.95
152.
95 -
153.
0515
3.05
- 15
3.15
Diam
ond
Gro
und
- 15
8.5
- 158
.615
8.6
- 158
.715
8.7
- 158
.815
8.8
- 158
.915
8.9
- 159
159
- 159
.115
9.1
- 159
.17
159.
17 -
159.
2715
9.27
- 15
9.37
159.
37 -
159.
4715
9.47
- 15
9.57
159.
57 -
159.
67Br
idge
-
159.
75 -
159.
8515
9.85
- 15
9.95
159.
95 -
160.
05Br
idge
-
160.
25 -
160.
3516
0.35
- 16
0.45
160.
45 -
160.
5516
0.55
- 16
0.65
160.
65 -
160.
7516
0.75
- 16
0.85
160.
85 -
160.
9416
0.94
- 16
1.04
161.
04 -
161.
14
Mile Post
Southbound Lane 3 Faulting MP 151.74 to MP 161.14
I-22

0.00
0.05
0.10
0.15
0.20
0.25
0.30
0.35
0.40
0.45
0.50
Ave
rage
Fau
lting
(in)
161.
14 -
161.
2416
1.24
- 16
1.34
161.
34 -
161.
44Br
idge
-
161.
74 -
161.
8416
1.84
- 16
1.94
161.
94 -
162.
0416
2.04
- 16
2.14
162.
14 -
162.
24Br
idge
-
162.
42 -
162.
5216
2.52
- 16
2.62
162.
62 -
162.
7216
2.72
- 16
2.82
Brie
ge -
164.
33 -
164.
416
4.4
- 164
.516
4.5
- 164
.6Br
idge
- 16
4.7
- 164
.8Br
idge
-
164.
98 -
165.
0816
5.08
- 16
5.18
165.
18 -
165.
28Br
idge
-
165.
48 -
165.
5816
5.58
- 16
5.68
165.
68 -
165.
7816
5.78
- 16
5.88
165.
88 -
165.
9816
5.98
- 16
6.08
166.
08 -
166.
1816
6.18
- 16
6.28
166.
28 -
166.
36Br
idge
-
167.
74 -
167.
8416
7.84
- 16
7.94
167.
94 -
168.
0416
8.04
- 16
8.14
168.
14 -
168.
24Br
idge
-
169.
18 -
169.
25
Mile Post
Southbound Lane 3 Faulting MP 161.14 to MP 169.25
0.00
0.05
0.10
0.15
0.20
0.25
0.30
0.35
0.40
0.45
0.50
Ave
rage
Fau
lting
(in)
169.
25 -
169.
3516
9.35
- 16
9.45
169.
45 -
169.
5516
9.55
- 16
9.65
169.
65 -
169.
7516
9.75
- 16
9.85
169.
85 -
169.
9516
9.95
- 17
0.05
170.
05 -
170.
1517
0.15
- 17
0.25
Brid
ge -
170.
59 -
170.
6917
0.69
- 17
0.79
170.
79 -
170.
8917
0.89
- 17
0.99
170.
99 -
171.
0917
1.09
- 17
1.19
171.
19 -
171.
2917
1.29
- 17
1.39
171.
39 -
171.
4917
1.49
- 17
1.59
171.
59 -
171.
6917
1.69
- 17
1.79
171.
79 -
171.
8917
1.89
- 17
1.92
171.
92 -
172.
0217
2.02
- 17
2.12
172.
12 -
172.
2217
2.22
- 17
2.32
172.
32 -
172.
4217
2.42
- 17
2.52
172.
52 -
172.
5417
2.54
- 17
2.64
172.
64 -
172.
74Br
idge
-
172.
84 -
172.
9417
2.94
- 17
3.04
173.
04 -
173.
1417
3.14
- 17
3.24
173.
24 -
173.
3417
3.34
- 17
3.44
173.
44 -
173.
54
Mile Post
Southbound Lane 3 Faulting MP 169.25 to MP 173.54
I-23

0.00
0.05
0.10
0.15
0.20
0.25
0.30
0.35
0.40
0.45
0.50
Ave
rage
Fau
lting
(in)
173.
54 -
173.
6417
3.64
- 17
3.74
173.
74 -
173.
8417
3.84
- 17
3.94
173.
94 -
174.
0417
4.04
- 17
4.14
174.
14 -
174.
2117
4.21
- 17
4.31
174.
31 -
174.
4117
4.41
- 17
4.51
174.
51 -
174.
6117
4.61
- 17
4.71
174.
71 -
174.
8117
4.81
- 17
4.91
174.
91 -
175.
01Br
idge
-
175.
23 -
175.
3317
5.33
- 17
5.43
Brid
ge -
175.
53 -
175.
6317
5.63
- 17
5.73
175.
73 -
175.
8317
5.83
- 17
5.93
175.
93 -
176.
03Br
idge
-
176.
16 -
176.
16Br
idge
-
176.
26 -
176.
3617
6.36
- 17
6.46
176.
46 -
176.
5617
6.56
- 17
6.66
176.
66 -
176.
7617
6.76
- 17
6.86
176.
86 -
176.
9617
6.96
- 17
7.05
177.
05 -
177.
1517
7.15
- 17
7.25
177.
25 -
177.
3517
7.35
- 17
7.45
177.
45 -
177.
5517
7.55
- 17
7.65
Mile Post
Southbound Lane 3 Faulting MP 173.54 to MP 177.65
Southbound Lane 4 Faulting Plots
0.00
0.05
0.10
0.15
0.20
0.25
0.30
0.35
0.40
0.45
0.50
Ave
rage
Fau
lting
(in)
139.
5 - 1
39.6
139.
6 - 1
39.7
139.
7 - 1
39.8
139.
8 - 1
39.9
139.
9 - 1
4014
0 - 1
40.1
140.
1 - 1
40.2
140.
2 - 1
40.3
140.
3 - 1
40.4
140.
4 - 1
40.5
140.
5 - 1
40.6
140.
6 - 1
40.7
140.
7 - 1
40.8
140.
8 - 1
40.9
140.
9 - 1
4114
1 - 1
41.1
141.
1 - 1
41.2
141.
2 - 1
41.3
141.
3 - 1
41.4
141.
4 - 1
41.5
141.
5 - 1
41.6
141.
6 - 1
41.7
141.
7 - 1
41.8
141.
8 - 1
41.9
141.
9 - 1
4214
2.04
- 14
2.09
142.
09 -
142.
1914
2.19
- 14
2.29
142.
29 -
142.
3914
2.39
- 14
2.49
142.
49 -
142.
5914
2.59
- 14
2.69
142.
69 -
142.
7914
2.81
- 14
2.89
142.
89 -
142.
9914
2.99
- 14
3.09
143.
09 -
143.
1914
3.19
- 14
3.29
143.
29 -
143.
3914
3.39
- 14
3.49
Mile Post
Southbound Lane 4 Faulting MP 139.50 to MP 143.49
I-24
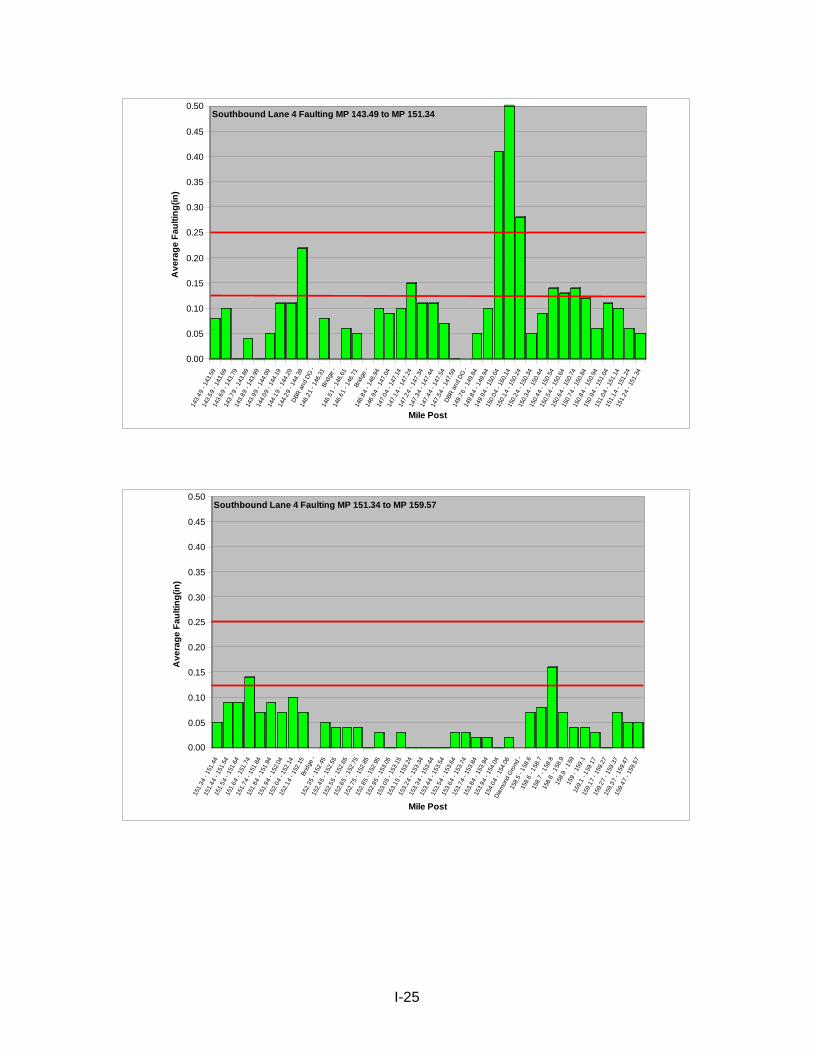
0.00
0.05
0.10
0.15
0.20
0.25
0.30
0.35
0.40
0.45
0.50
Ave
rage
Fau
lting
(in)
143.
49 -
143.
5914
3.59
- 14
3.69
143.
69 -
143.
7914
3.79
- 14
3.89
143.
89 -
143.
9914
3.99
- 14
4.09
144.
09 -
144.
1914
4.19
- 14
4.29
144.
29 -
144.
39DB
R an
d DG
-
146.
21 -
146.
31Br
idge
-
146.
51 -
146.
6114
6.61
- 14
6.71
Brid
ge -
146.
84 -
146.
9414
6.94
- 14
7.04
147.
04 -
147.
1414
7.14
- 14
7.24
147.
24 -
147.
3414
7.34
- 14
7.44
147.
44 -
147.
5414
7.54
- 14
7.59
DBR
and
DG -
149.
76 -
149.
8414
9.84
- 14
9.94
149.
94 -
150.
0415
0.04
- 15
0.14
150.
14 -
150.
2415
0.24
- 15
0.34
150.
34 -
150.
4415
0.44
- 15
0.54
150.
54 -
150.
6415
0.64
- 15
0.74
150.
74 -
150.
8415
0.84
- 15
0.94
150.
94 -
151.
0415
1.04
- 15
1.14
151.
14 -
151.
2415
1.24
- 15
1.34
Mile Post
Southbound Lane 4 Faulting MP 143.49 to MP 151.34
0.00
0.05
0.10
0.15
0.20
0.25
0.30
0.35
0.40
0.45
0.50
Ave
rage
Fau
lting
(in)
151.
34 -
151.
4415
1.44
- 15
1.54
151.
54 -
151.
6415
1.64
- 15
1.74
151.
74 -
151.
8415
1.84
- 15
1.94
151.
94 -
152.
0415
2.04
- 15
2.14
152.
14 -
152.
15Br
idge
-
152.
35 -
152.
4515
2.45
- 15
2.55
152.
55 -
152.
6515
2.65
- 15
2.75
152.
75 -
152.
8515
2.85
- 15
2.95
152.
95 -
153.
0515
3.05
- 15
3.15
153.
15 -
153.
2415
3.24
- 15
3.34
153.
34 -
153.
4415
3.44
- 15
3.54
153.
54 -
153.
6415
3.64
- 15
3.74
153.
74 -
153.
8415
3.84
- 15
3.94
153.
94 -
154.
0415
4.04
- 15
4.06
Diam
ond
Gro
nd -
158.
5 - 1
58.6
158.
6 - 1
58.7
158.
7 - 1
58.8
158.
8 - 1
58.9
158.
9 - 1
5915
9 - 1
59.1
159.
1 - 1
59.1
715
9.17
- 15
9.27
159.
27 -
159.
3715
9.37
- 15
9.47
159.
47 -
159.
57
Mile Post
Southbound Lane 4 Faulting MP 151.34 to MP 159.57
I-25

0.00
0.05
0.10
0.15
0.20
0.25
0.30
0.35
0.40
0.45
0.50
Ave
rage
Fau
lting
(in)
159.
71 -
159.
7515
9.75
- 15
9.85
159.
85 -
159.
95Br
idge
-
160.
25 -
160.
3516
0.35
- 16
0.45
160.
45 -
160.
5516
0.55
- 16
0.65
160.
65 -
160.
7516
0.75
- 16
0.85
160.
85 -
160.
9416
0.94
- 16
1.04
161.
04 -
161.
1416
1.14
- 16
1.24
161.
24 -
161.
3416
1.34
- 16
1.44
Brid
ge -
161.
74 -
161.
8416
1.84
- 16
1.94
161.
94 -
162.
0416
2.04
- 16
2.14
Brid
ge -
162.
37 -
162.
4216
2.42
- 16
2.52
162.
52 -
162.
6216
2.62
- 16
2.72
Brid
ge -
164.
33 -
164.
416
4.4
- 164
.516
4.5
- 164
.616
4.6
- 164
.7Br
idge
-
164.
93 -
164.
9816
4.98
- 16
5.08
165.
08 -
165.
18Br
idge
-
165.
44 -
165.
4816
5.48
- 16
5.58
165.
58 -
165.
68
Mile Post
Southbound Lane 4 Faulting MP 159.71 to MP 165.68
0.00
0.05
0.10
0.15
0.20
0.25
0.30
0.35
0.40
0.45
0.50
Ave
rage
Fau
lting
(in)
165.
68 -
165.
7816
5.78
- 16
5.88
165.
88 -
165.
9816
5.98
- 16
6.08
166.
08 -
166.
1816
6.18
- 16
6.28
Brid
ge -
167.
72 -
167.
7416
7.74
- 16
7.84
167.
84 -
167.
9416
7.94
- 16
8.04
168.
04 -
168.
1416
8.14
- 16
8.24
Brid
ge -
169.
18 -
169.
2516
9.25
- 16
9.35
169.
35 -
169.
4516
9.45
- 16
9.55
169.
55 -
169.
6516
9.65
- 16
9.75
169.
75 -
169.
8516
9.85
- 16
9.95
169.
95 -
170.
0517
0.05
- 17
0.15
170.
15 -
170.
25Br
idge
-
170.
59 -
170.
6917
0.69
- 17
0.79
170.
79 -
170.
8917
0.89
- 17
0.99
170.
99 -
171.
0917
1.09
- 17
1.19
171.
19 -
171.
2917
1.29
- 17
1.39
171.
39 -
171.
4917
1.49
- 17
1.59
171.
59 -
171.
6917
1.69
- 17
1.79
171.
79 -
171.
8917
1.89
- 17
1.92
Mile Post
Southbound Lane 4 Faulting MP 165.68 to MP 171.92
I-26

0.00
0.05
0.10
0.15
0.20
0.25
0.30
0.35
0.40
0.45
0.50
Ave
rage
Fau
lting
(in)
171.
92 -
172.
0217
2.02
- 17
2.12
172.
12 -
172.
2217
2.22
- 17
2.32
172.
32 -
172.
4217
2.42
- 17
2.52
172.
52 -
172.
5417
2.54
- 17
2.64
172.
64 -
172.
74Br
idge
-
172.
84 -
172.
9417
2.94
- 17
3.04
173.
04 -
173.
1417
3.14
- 17
3.24
173.
24 -
173.
3417
3.34
- 17
3.44
173.
44 -
173.
5417
3.54
- 17
3.64
173.
64 -
173.
7417
3.74
- 17
3.84
173.
84 -
173.
9417
3.94
- 17
4.04
174.
04 -
174.
1417
4.14
- 17
4.21
174.
21 -
174.
3117
4.31
- 17
4.41
174.
41 -
174.
5117
4.51
- 17
4.61
174.
61 -
174.
7117
4.71
- 17
4.81
174.
81 -
174.
9117
4.91
- 17
5.01
Brid
ge -
175.
23 -
175.
3317
5.33
- 17
5.43
Brid
ge -
175.
53 -
175.
6317
5.63
- 17
5.73
175.
73 -
175.
8317
5.83
- 17
5.93
Mile Post
Southbound Lane 4 Faulting MP 171.92 to MP 175.93
0.00
0.05
0.10
0.15
0.20
0.25
0.30
0.35
0.40
0.45
0.50
Ave
rage
Fau
lting
(in)
175.
93 -
176.
0317
6.03
- 17
6.13
176.
16 -
176.
16
Brid
ge -
176.
26 -
176.
3617
6.36
- 17
6.46
176.
46 -
176.
5617
6.56
- 17
6.66
176.
66 -
176.
7617
6.76
- 17
6.86
176.
86 -
176.
9617
6.96
- 17
7.05
177.
05 -
177.
1517
7.15
- 17
7.25
177.
25 -
177.
3517
7.35
- 17
7.45
177.
45 -
177.
5517
7.55
- 17
7.65
Mile Post
Southbound Lane 4 Faulting MP 175.93 to MP 177.65
I-27

Appendix J – Wheel Path Wear Distress Plots
J-1

Northbound Lane 1 Wheel Path Wear Plots
0.00
0.05
0.10
0.15
0.20
0.25
0.30
0.35
0.40
0.45
0.50
0.55
0.60
0.65
0.70
0.75
0.80W
heel
Pat
h W
ear D
epth
(in)
139.
5 - 1
39.6
197
0
139.
6 - 1
39.7
197
0
139.
7 - 1
39.8
197
0
139.
8 - 1
39.9
197
0
139.
9 - 1
40 1
970
140
- 140
.1 1
970
140.
2 - 1
40.3
197
0
140.
3 - 1
40.4
197
0
140.
4 - 1
40.5
197
0
140.
5 - 1
40.6
197
0
140.
6 - 1
40.7
197
0
140.
7 - 1
40.8
197
0
140.
8 - 1
40.9
197
0
140.
9 - 1
41 1
970
141
- 141
.1 1
970
141.
1 - 1
41.2
197
0
141.
3 - 1
41.4
197
0
141.
4 - 1
41.5
197
0
141.
5 - 1
41.6
197
0
141.
7 - 1
41.8
197
0
141.
8 - 1
41.9
197
0
141.
9 - 1
42 1
970
142.
04 -
142.
14 1
970
142.
14 -
142.
24 1
970
142.
24 -
142.
34 1
970
142.
34 -
142.
44 1
970
142.
44 -
142.
54 1
970
142.
54 -
142.
64 1
970
142.
64 -
142.
74 1
970
142.
92 -
143.
02 1
970
143.
02 -
143.
12 1
970
143.
12 -
143.
22 1
970
143.
22 -
143.
32 1
970
143.
32 -
143.
42 1
970
143.
42 -
143.
52 1
970
143.
52 -
143.
62 1
970
143.
62 -
143.
72 1
970
143.
72 -
143.
82 1
970
143.
82 -
143.
92 1
970
143.
92 -
144.
02 1
970
Mile Post
Northbound Lane 1 Wheel Path Wear MP 139.5 to MP 144.02
0.00
0.05
0.10
0.15
0.20
0.25
0.30
0.35
0.40
0.45
0.50
0.55
0.60
0.65
0.70
0.75
0.80
Whe
el P
ath
Wea
r Dep
th (i
n)
144.
02 -
144.
12 1
970
144.
12 -
144.
19 1
970
144.
19 -
144.
29 1
970
144.
29 -
144.
39 1
970
144.
39 -
144.
49 1
970
144.
49 -
144.
59 1
970
Brid
ge -
144.
79 -
144.
89 1
970
144.
89 -
144.
99 1
970
144.
99 -
145.
09 1
970
145.
09 -
145.
19 1
970
145.
19 -
145.
29 1
970
145.
29 -
145.
39 1
970
145.
39 -
145.
49 1
970
145.
49 -
145.
59 1
970
145.
59 -
145.
69 1
970
Brid
ge -
145.
89 -
145.
99 1
970
145.
99 -
146.
09 1
970
146.
09 -
146.
19 1
970
146.
19 -
146.
29 1
970
146.
29 -
146.
33 1
970
146.
33 -
146.
43 1
970
Brid
ge -
146.
53 -
146.
63 1
970
146.
63 -
146.
73 1
970
Brid
ge -
146.
93 -
147.
03 1
970
147.
03 -
147.
13 1
970
147.
13 -
147.
23 1
970
147.
23 -
147.
33 1
970
147.
33 -
147.
43 1
970
147.
43 -
147.
53 1
970
147.
53 -
147.
63 1
970
147.
63 -
147.
64 1
970
147.
67 -
147.
77 1
970
147.
77 -
147.
87 1
970
147.
87 -
147.
97 1
970
147.
97 -
148.
07 1
970
148.
07 -
148.
17 1
970
Mile Post
Northbound Lane 1 Wheel Path Wear MP 144.02 to MP 148.17
J-2

0.00
0.05
0.10
0.15
0.20
0.25
0.30
0.35
0.40
0.45
0.50
0.55
0.60
0.65
0.70
0.75
0.80
Whe
el P
ath
Wea
r Dep
th(in
)14
8.17
- 14
8.27
197
0
148.
27 -
148.
37 1
970
148.
37 -
148.
47 1
970
148.
47 -
148.
57 1
970
148.
57 -
148.
67 1
970
148.
67 -
148.
77 1
970
148.
77 -
148.
87 1
970
148.
87 -
148.
97 1
970
148.
97 -
149.
07 1
970
Brid
ge -
149.
22 -
149.
32 1
970
149.
32 -
149.
42 1
970
149.
42 -
149.
52 1
970
149.
52 -
149.
62 1
970
149.
62 -
149.
72 1
970
149.
72 -
149.
82 1
970
149.
82 -
149.
92 1
970
149.
92 -
150.
02 1
970
150.
02 -
150.
12 1
970
150.
12 -
150.
22 1
970
150.
22 -
150.
32 1
970
150.
32 -
150.
42 1
970
150.
42 -
150.
52 1
970
150.
52 -
150.
62 1
970
150.
62 -
150.
72 1
970
150.
72 -
150.
82 1
970
150.
82 -
150.
92 1
970
150.
92 -
151.
02 1
970
151.
02 -
151.
12 1
970
151.
12 -
151.
22 1
970
151.
22 -
151.
23 1
970
151.
23 -
151.
33 1
970
151.
33 -
151.
43 1
970
151.
43 -
151.
53 1
970
151.
53 -
151.
63 1
970
151.
63 -
151.
73 1
970
151.
73 -
151.
83 1
970
151.
83 -
151.
93 1
970
151.
93 -
152.
03 1
970
152.
03 -
152.
13 1
970
Mile Post
Northbound Lane 1 Wheel Path Wear MP 148.17 to MP152.13
0.00
0.05
0.10
0.15
0.20
0.25
0.30
0.35
0.40
0.45
0.50
0.55
0.60
0.65
0.70
0.75
0.80
Whe
el P
ath
Wea
r Dep
th(in
)15
2.13
- 15
2.23
197
0Br
idge
- 1
970
152.
39 -
152.
49 1
970
152.
49 -
152.
59 1
970
152.
59 -
152.
69 1
970
152.
69 -
152.
79 1
969
152.
79 -
152.
89 1
969
152.
89 -
152.
99 1
969
152.
99 -
153.
09 1
969
153.
09 -
153.
19 1
969
153.
19 -
153.
2 1
969
153.
2 - 1
53.3
196
9
153.
3 - 1
53.4
196
9
153.
4 - 1
53.5
196
9
153.
5 - 1
53.6
196
9Br
idge
-
153.
8 - 1
53.9
196
9
153.
9 - 1
54 1
969
154
- 154
.1 1
969
154.
1 - 1
54.1
4 1
969
Diam
ond
Gro
und
-
158.
51 -
158.
61 1
967
158.
61 -
158.
71 1
967
158.
71 -
158.
81 1
967
158.
81 -
158.
91 1
967
158.
91 -
159.
01 1
967
159.
01 -
159.
1 1
967
159.
1 - 1
59.2
196
7
159.
2 - 1
59.3
196
7
159.
3 - 1
59.4
196
7
159.
4 - 1
59.5
196
7
159.
5 - 1
59.6
196
7Br
idge
-
159.
71 -
159.
81 1
967
159.
81 -
159.
91 1
967
159.
91 -
160.
01 1
967
160.
01 -
160.
11 1
967
160.
11 -
160.
21 1
967
160.
21 -
160.
31 1
967
160.
31 -
160.
41 1
967
Mile Post
Norhtbound Lane 1 Wheel Path Wear MP 152.13 to 160.41
J-3

0.00
0.05
0.10
0.15
0.20
0.25
0.30
0.35
0.40
0.45
0.50
0.55
0.60
0.65
0.70
0.75
0.80
Whe
el P
ath
Wea
r Dep
th(in
)16
0.41
- 16
0.51
196
7
160.
51 -
160.
61 1
967
160.
61 -
160.
71 1
967
160.
71 -
160.
75 1
967
160.
75 -
160.
85 1
967
160.
85 -
160.
95 1
967
160.
95 -
161.
05 1
967
161.
05 -
161.
15 1
967
161.
15 -
161.
25 1
967
161.
25 -
161.
35 1
967
161.
35 -
161.
45 1
967
161.
45 -
161.
55 1
967
Brid
ge -
161.
78 -
161.
88 1
967
161.
88 -
161.
98 1
967
161.
98 -
162.
08 1
967
162.
08 -
162.
18 1
967
Brid
ge -
162.
36 -
162.
46 1
967
162.
46 -
162.
56 1
967
162.
56 -
162.
57 1
967
166.
21 -
166.
31 1
965
166.
31 -
166.
41 1
965
166.
41 -
166.
51 1
965
166.
51 -
166.
61 1
965
166.
61 -
166.
71 1
965
166.
71 -
166.
81 1
965
166.
81 -
166.
91 1
965
166.
98 -
167.
08 1
965
167.
08 -
167.
18 1
964
167.
18 -
167.
28 1
964
Brid
ge -
168.
23 -
168.
33 1
964
168.
33 -
168.
34 1
964
Brid
ge -
169.
28 -
169.
38 1
965
169.
38 -
169.
48 1
965
169.
48 -
169.
58 1
965
169.
58 -
169.
68 1
965
169.
68 -
169.
78 1
965
Mile Post
Norhtbound Lane 1 Wheel Path Wear MP 160.41 to MP 169.78
0.00
0.05
0.10
0.15
0.20
0.25
0.30
0.35
0.40
0.45
0.50
0.55
0.60
0.65
0.70
0.75
0.80
Whe
el P
ath
Wea
r Dep
th(in
)16
9.78
- 16
9.88
196
5
169.
88 -
169.
98 1
965
169.
98 -
170.
08 1
965
170.
08 -
170.
18 1
965
170.
18 -
170.
25 1
965
Brid
ge -
172.
49 -
172.
59 1
965
172.
59 -
172.
69 1
965
Brid
ge -
172.
89 -
172.
99 1
965
172.
99 -
173.
09 1
965
173.
09 -
173.
19 1
965
173.
19 -
173.
29 1
965
173.
29 -
173.
39 1
965
173.
39 -
173.
49 1
965
173.
49 -
173.
59 1
965
173.
59 -
173.
69 1
965
173.
69 -
173.
79 1
965
173.
79 -
173.
89 1
965
173.
89 -
173.
99 1
965
173.
99 -
174.
09 1
965
174.
09 -
174.
14 1
965
174.
14 -
174.
24 1
965
174.
24 -
174.
34 1
965
174.
34 -
174.
44 1
965
174.
44 -
174.
54 1
965
174.
54 -
174.
64 1
965
174.
64 -
174.
74 1
965
174.
74 -
174.
84 1
965
174.
84 -
174.
94 1
965
174.
94 -
175.
04 1
965
175.
04 -
175.
11 1
965
Brid
ge -
175.
24 -
175.
34 1
965
175.
34 -
175.
44 1
965
Brid
ge -
175.
64 -
175.
74 1
965
175.
74 -
175.
79 1
965
Mile Post
Northbound Lane 1 Wheel Path Wear MP 169.78 to MP 175.79
J-4

Northbound Lane 2 Wheel Path Wear Plots
0.000.05
0.100.15
0.200.25
0.300.35
0.400.45
0.500.55
0.600.65
0.700.75
0.80
Whe
el P
ath
Wea
r Dep
th(in
)13
9.5
- 139
.6 1
962
139.
6 - 1
39.7
196
2
139.
7 - 1
39.8
196
2
139.
8 - 1
39.9
196
2
139.
9 - 1
40 1
962
140
- 140
.1 1
962
140.
1 - 1
40.2
196
2
140.
2 - 1
40.3
196
2
140.
3 - 1
40.4
196
2
140.
4 - 1
40.5
196
2
140.
5 - 1
40.6
196
2
140.
6 - 1
40.7
196
2
140.
7 - 1
40.8
196
2
140.
8 - 1
40.9
196
2
140.
9 - 1
41 1
962
141
- 141
.1 1
962
141.
1 - 1
41.2
196
2
141.
2 - 1
41.3
196
2
141.
3 - 1
41.4
196
2
141.
4 - 1
41.5
196
2
141.
5 - 1
41.6
196
2
141.
6 - 1
41.7
196
2
141.
7 - 1
41.8
196
2
141.
8 - 1
41.9
196
2
141.
9 - 1
42 1
962
142.
04 -
142.
14 1
962
142.
14 -
142.
24 1
962
142.
24 -
142.
34 1
962
142.
34 -
142.
44 1
962
142.
44 -
142.
54 1
962
142.
54 -
142.
64 1
962
142.
64 -
142.
74 1
962
142.
74 -
142.
79 1
962
142.
82 -
142.
92 1
962
142.
92 -
143.
02 1
962
143.
02 -
143.
12 1
962
143.
12 -
143.
22 1
962
143.
22 -
143.
32 1
962
143.
32 -
143.
42 1
962
143.
42 -
143.
52 1
962
143.
52 -
143.
62 1
962
143.
62 -
143.
72 1
962
Mile Post
Northbound Lane 2 Wheel Path Wear MP 139.5 to MP 143.72
0.000.05
0.100.15
0.200.25
0.300.35
0.400.45
0.500.55
0.600.65
0.700.75
0.80
Whe
el P
ath
Wea
r Dep
th(in
)14
3.72
- 14
3.82
196
2Br
idge
-
143.
92 -
144.
02 1
962
144.
02 -
144.
12 1
962
144.
12 -
144.
19 1
962
144.
19 -
144.
29 1
962
144.
29 -
144.
39 1
962
144.
39 -
144.
49 1
962
144.
49 -
144.
59 1
962
Brid
ge -
144.
79 -
144.
89 1
962
144.
89 -
144.
99 1
962
144.
99 -
145.
09 1
962
145.
09 -
145.
19 1
962
145.
19 -
145.
29 1
962
145.
29 -
145.
39 1
962
145.
39 -
145.
49 1
962
145.
49 -
145.
59 1
962
145.
59 -
145.
69 1
962
Brid
ge -
145.
89 -
145.
99 1
962
145.
99 -
146.
09 1
962
146.
09 -
146.
19 1
962
146.
19 -
146.
29 1
962
146.
29 -
146.
33 1
962
146.
33 -
146.
43 1
962
Brid
ge -
146.
53 -
146.
63 1
962
146.
63 -
146.
73 1
962
Brid
ge -
146.
93 -
147.
03 1
962
147.
03 -
147.
13 1
962
147.
13 -
147.
23 1
962
147.
23 -
147.
33 1
962
147.
33 -
147.
43 1
962
147.
43 -
147.
53 1
962
147.
53 -
147.
63 1
962
Brid
ge -
147.
77 -
147.
87 1
962
147.
87 -
147.
97 1
962
147.
97 -
148.
07 1
962
148.
07 -
148.
17 1
962
Mile Post
Northbound Lane 2 Wheel Path Wear MP143.72 to MP 148.17
J-5

0.000.05
0.100.15
0.200.25
0.300.35
0.400.45
0.500.55
0.600.65
0.700.75
0.80
Whe
el P
ath
Wea
r Dep
th(in
)14
8.17
- 14
8.27
196
2
148.
27 -
148.
37 1
962
148.
37 -
148.
47 1
962
148.
47 -
148.
57 1
962
148.
57 -
148.
67 1
962
148.
67 -
148.
77 1
962
148.
77 -
148.
87 1
962
148.
87 -
148.
97 1
962
148.
97 -
149.
07 1
962
Brid
ge -
149.
22 -
149.
32 1
962
149.
32 -
149.
42 1
962
149.
42 -
149.
52 1
966
149.
52 -
149.
62 1
966
149.
62 -
149.
72 1
966
149.
72 -
149.
82 1
966
149.
82 -
149.
92 1
966
149.
92 -
150.
02 1
966
150.
02 -
150.
12 1
966
150.
12 -
150.
22 1
966
150.
22 -
150.
32 1
966
150.
32 -
150.
42 1
966
150.
42 -
150.
52 1
966
150.
52 -
150.
62 1
966
150.
62 -
150.
72 1
966
150.
72 -
150.
82 1
966
150.
82 -
150.
92 1
966
150.
92 -
151.
02 1
966
151.
02 -
151.
12 1
966
151.
12 -
151.
22 1
966
151.
22 -
151.
23 1
966
151.
23 -
151.
33 1
966
151.
33 -
151.
43 1
966
151.
43 -
151.
53 1
966
151.
53 -
151.
63 1
966
151.
63 -
151.
73 1
966
151.
73 -
151.
83 1
966
151.
83 -
151.
93 1
966
151.
93 -
152.
03 1
966
152.
03 -
152.
13 1
966
152.
13 -
152.
23 1
966
Mile Post
Northbound Lane Wheel Path Wear MP 148.17 to MP 152.23
0.000.050.100.150.200.250.300.350.400.450.500.550.600.650.700.750.80
Whe
el P
ath
Wea
r Dep
th(in
)15
2.39
- 15
2.49
196
6
152.
49 -
152.
59 1
966
152.
59 -
152.
69 1
969
152.
69 -
152.
79 1
969
152.
79 -
152.
89 1
969
152.
89 -
152.
99 1
969
152.
99 -
153.
09 1
969
153.
09 -
153.
19 1
969
153.
19 -
153.
2 1
969
153.
2 - 1
53.3
196
9
153.
3 - 1
53.4
196
9
153.
4 - 1
53.5
196
9
153.
5 - 1
53.6
196
9
153.
6 - 1
53.7
196
9
153.
7 - 1
53.8
196
9
153.
8 - 1
53.9
196
9
153.
9 - 1
54 1
969
154
- 154
.1 1
969
154.
1 - 1
54.1
4 1
969
Diam
ond
Gro
und
-
158.
31 -
158.
41 1
967
Brid
ge -
158.
51 -
158.
61 1
967
158.
61 -
158.
71 1
967
158.
71 -
158.
81 1
967
158.
81 -
158.
91 1
967
158.
91 -
159.
01 1
967
159.
01 -
159.
1 1
967
159.
1 - 1
59.2
196
7
159.
2 - 1
59.3
196
7
159.
3 - 1
59.4
196
7
159.
4 - 1
59.5
196
7
159.
5 - 1
59.6
196
7
159.
6 - 1
59.6
7 1
967
159.
71 -
159.
81 1
967
159.
81 -
159.
91 1
967
159.
91 -
160.
01 1
967
160.
01 -
160.
11 1
967
160.
11 -
160.
21 1
967
160.
21 -
160.
31 1
967
160.
31 -
160.
41 1
967
160.
41 -
160.
51 1
967
Mile Post
Northbound Lane 2 Path Wear MP 152.39 to MP 160.51
J-6

0.000.05
0.100.15
0.200.25
0.300.35
0.400.45
0.500.55
0.600.65
0.700.75
0.80
Whe
el P
ath
Wea
r Dep
th(in
)16
0.51
- 16
0.61
196
7
160.
61 -
160.
71 1
967
160.
71 -
160.
75 1
967
160.
75 -
160.
85 1
967
160.
85 -
160.
95 1
967
160.
95 -
161.
05 1
967
161.
05 -
161.
15 1
967
161.
15 -
161.
25 1
967
161.
25 -
161.
35 1
967
161.
35 -
161.
45 1
967
161.
45 -
161.
55 1
967
161.
55 -
161.
65 1
967
Brid
ge -
161.
78 -
161.
88 1
967
161.
88 -
161.
98 1
967
161.
98 -
161.
99 1
967
162
- 162
.1 1
967
Brid
ge -
162.
4 - 1
62.5
196
7
162.
5 - 1
62.6
196
7
162.
6 - 1
62.7
196
7
162.
7 - 1
62.8
196
7
162.
8 - 1
62.8
2 1
967
Brid
ge -
164.
47 -
164.
57 1
967
Brid
ge -
164.
67 -
164.
77 1
967
164.
77 -
164.
8 1
967
164.
95 -
165.
05 1
967
165.
05 -
165.
15 1
967
165.
15 -
165.
25 1
967
Brid
ge -
166.
31 -
166.
41 1
965
166.
41 -
166.
51 1
965
166.
51 -
166.
61 1
965
166.
61 -
166.
71 1
965
166.
71 -
166.
81 1
965
166.
81 -
166.
91 1
965
166.
98 -
167.
08 1
965
167.
08 -
167.
18 1
964
167.
18 -
167.
28 1
964
Brid
ge -
Mile Post
Northbound Lane 2 Wheel Path Wear MP 160.51 to MP 167.28
0.000.05
0.100.15
0.200.25
0.300.35
0.400.45
0.500.55
0.600.65
0.700.75
0.80
Whe
el P
ath
Wea
r Dep
th(in
)16
7.77
- 16
7.87
196
4
167.
87 -
167.
97 1
964
167.
97 -
168.
07 1
964
168.
07 -
168.
17 1
964
168.
17 -
168.
27 1
964
Brid
ge -
169.
28 -
169.
38 1
965
169.
38 -
169.
48 1
965
169.
48 -
169.
58 1
965
169.
58 -
169.
68 1
965
169.
68 -
169.
78 1
965
169.
78 -
169.
88 1
965
169.
88 -
169.
98 1
965
169.
98 -
170.
08 1
965
170.
08 -
170.
18 1
965
Brid
ge -
170.
6 - 1
70.7
196
3
170.
7 - 1
70.8
196
3
170.
8 - 1
70.9
196
3
170.
9 - 1
71 1
965
171
- 171
.1 1
965
171.
1 - 1
71.2
196
5
171.
2 - 1
71.3
196
5
171.
3 - 1
71.4
196
5
171.
4 - 1
71.5
196
5
171.
5 - 1
71.6
196
5
171.
6 - 1
71.7
196
5
171.
7 - 1
71.8
196
5
171.
8 - 1
71.9
196
5
171.
9 - 1
72 1
965
172
- 172
.1 1
965
172.
1 - 1
72.2
196
5
172.
2 - 1
72.3
196
5Br
idge
-
172.
4 - 1
72.5
196
5
172.
5 - 1
72.6
196
5
172.
6 - 1
72.7
196
5
172.
7 - 1
72.7
6 1
965
Brid
ge -
172.
89 -
172.
99 1
965
172.
99 -
173.
09 1
965
173.
09 -
173.
19 1
965
Mile Post
Northbound Lane 2 Wheel Path Wear MP 167.77 to MP 173.19
J-7

0.00
0.05
0.10
0.15
0.20
0.25
0.30
0.35
0.40
0.45
0.50
0.55
0.60
0.65
0.70
0.75
0.80
Whe
el P
ath
Wea
r Dep
th(in
)
Mile Post
Northbound Lane 2 Wheel Path Wear MP 173.19 to MP 177.75
Northbound Lane 3 Wheel Path Wear Plots
0.00
0.050.10
0.150.20
0.250.30
0.350.40
0.45
0.500.55
0.600.65
0.700.75
0.80
Whe
el P
ath
Wea
r Dep
th(in
)13
9.5
- 139
.6 1
962
139.
6 - 1
39.7
196
2
139.
7 - 1
39.8
196
2
139.
8 - 1
39.9
196
2
139.
9 - 1
40 1
962
140
- 140
.1 1
962
140.
1 - 1
40.2
196
2
140.
2 - 1
40.3
196
2
140.
3 - 1
40.4
196
2
140.
4 - 1
40.5
196
2
140.
5 - 1
40.6
196
2
140.
6 - 1
40.7
196
2
140.
7 - 1
40.8
196
2
140.
8 - 1
40.9
196
2
140.
9 - 1
41 1
962
141
- 141
.1 1
962
141.
1 - 1
41.2
196
2
141.
2 - 1
41.3
196
2
141.
3 - 1
41.4
196
2
141.
4 - 1
41.5
196
2
141.
5 - 1
41.6
196
2
141.
6 - 1
41.7
196
2
141.
7 - 1
41.8
196
2
141.
8 - 1
41.9
196
2
141.
9 - 1
42 1
962
142.
04 -
142.
14 1
962
142.
14 -
142.
24 1
962
142.
24 -
142.
34 1
962
142.
34 -
142.
44 1
962
142.
44 -
142.
54 1
962
142.
54 -
142.
64 1
962
142.
64 -
142.
74 1
962
142.
74 -
142.
79 1
962
142.
82 -
142.
92 1
962
142.
92 -
143.
02 1
962
143.
02 -
143.
12 1
962
143.
12 -
143.
22 1
962
143.
22 -
143.
32 1
962
143.
32 -
143.
42 1
962
143.
42 -
143.
52 1
962
143.
52 -
143.
62 1
962
143.
62 -
143.
72 1
962
143.
72 -
143.
82 1
962
Mile Post
Northbound Lane 3 Wheel Path Wear MP 139.50 to MP 143.82
J-8

0.000.05
0.100.15
0.200.25
0.300.35
0.400.45
0.500.55
0.600.65
0.700.75
0.80
Whe
el P
ath
Wea
r Dep
th(in
)14
3.82
- 14
3.92
196
2
143.
92 -
144.
02 1
962
144.
02 -
144.
12 1
962
144.
12 -
144.
19 1
962
144.
19 -
144.
29 1
962
144.
29 -
144.
39 1
962
144.
39 -
144.
49 1
962
144.
49 -
144.
59 1
962
Brid
ge -
144.
79 -
144.
89 1
962
144.
89 -
144.
99 1
962
144.
99 -
145.
09 1
962
145.
09 -
145.
19 1
962
145.
19 -
145.
29 1
962
145.
29 -
145.
39 1
962
145.
39 -
145.
49 1
962
145.
49 -
145.
59 1
962
145.
59 -
145.
69 1
962
Brid
ge -
145.
89 -
145.
99 1
962
145.
99 -
146.
09 1
962
146.
09 -
146.
19 1
962
146.
19 -
146.
29 1
962
146.
29 -
146.
33 1
962
Brid
ge -
146.
53 -
146.
63 1
962
146.
63 -
146.
73 1
962
Brid
ge -
146.
93 -
147.
03 1
962
147.
03 -
147.
13 1
962
147.
13 -
147.
23 1
962
147.
23 -
147.
33 1
962
147.
33 -
147.
43 1
962
147.
43 -
147.
53 1
962
147.
53 -
147.
63 1
962
147.
63 -
147.
64 1
962
Brid
ge -
147.
77 -
147.
87 1
962
147.
87 -
147.
97 1
962
147.
97 -
148.
07 1
962
148.
07 -
148.
17 1
962
148.
17 -
148.
27 1
962
Mile Post
Northbound Lane 3 Wheel Path Wear MP 143.82 to MP 148.27
0.000.05
0.100.15
0.200.25
0.300.35
0.400.45
0.500.55
0.600.65
0.700.75
0.80
Whe
el P
ath
Wea
r Dep
th(in
)14
8.27
- 14
8.37
196
2
148.
37 -
148.
47 1
962
148.
47 -
148.
57 1
962
148.
57 -
148.
67 1
962
148.
67 -
148.
77 1
962
148.
77 -
148.
87 1
962
148.
87 -
148.
97 1
962
148.
97 -
149.
07 1
962
Brid
ge -
149.
32 -
149.
42 1
962
149.
42 -
149.
52 1
966
149.
52 -
149.
62 1
966
149.
62 -
149.
72 1
966
149.
72 -
149.
82 1
966
149.
82 -
149.
92 1
966
149.
92 -
150.
02 1
966
150.
02 -
150.
12 1
966
150.
12 -
150.
22 1
966
150.
22 -
150.
32 1
966
150.
32 -
150.
42 1
966
150.
42 -
150.
52 1
966
150.
52 -
150.
62 1
966
150.
62 -
150.
72 1
966
150.
72 -
150.
82 1
966
150.
82 -
150.
92 1
966
150.
92 -
151.
02 1
966
151.
02 -
151.
12 1
966
151.
12 -
151.
22 1
966
151.
22 -
151.
23 1
966
151.
23 -
151.
33 1
966
151.
33 -
151.
43 1
966
151.
43 -
151.
53 1
966
151.
53 -
151.
63 1
966
151.
63 -
151.
73 1
966
151.
73 -
151.
83 1
966
151.
83 -
151.
93 1
966
151.
93 -
152.
03 1
966
152.
03 -
152.
13 1
966
152.
13 -
152.
23 1
966
Brid
ge -
152.
39 -
152.
49 1
966
152.
49 -
152.
59 1
966
152.
59 -
152.
69 1
966
Mile Post
Northbound Lane 3 Wheel Path Wear MP 148.27 to MP 152.69
J-9

0.000.05
0.100.15
0.200.25
0.300.35
0.400.45
0.500.55
0.600.65
0.700.75
0.80
Whe
el P
ath
Wea
r Dep
th(in
)15
2.69
- 15
2.79
196
9
152.
79 -
152.
89 1
969
152.
89 -
152.
99 1
969
152.
99 -
153.
09 1
969
153.
09 -
153.
19 1
969
153.
19 -
153.
2 1
969
153.
2 - 1
53.3
196
9
153.
3 - 1
53.4
196
9
153.
4 - 1
53.5
196
9
153.
5 - 1
53.6
196
9Br
idge
-
153.
8 - 1
53.9
196
9
153.
9 - 1
54 1
969
154
- 154
.1 1
969
154.
1 - 1
54.1
4 1
969
Diam
ond
Gro
und
-
158.
31 -
158.
41 1
969
158.
41 -
158.
51 1
967
158.
51 -
158.
61 1
967
158.
61 -
158.
71 1
967
158.
71 -
158.
81 1
967
158.
81 -
158.
91 1
967
158.
91 -
159.
01 1
967
159.
01 -
159.
1 1
967
159.
1 - 1
59.2
196
7
159.
2 - 1
59.3
196
7
159.
3 - 1
59.4
196
7
159.
4 - 1
59.5
196
7
159.
5 - 1
59.6
196
7Br
idge
-
159.
81 -
159.
91 1
967
159.
91 -
160.
01 1
967
160.
01 -
160.
11 1
967
160.
11 -
160.
21 1
967
160.
21 -
160.
31 1
967
160.
31 -
160.
41 1
967
160.
41 -
160.
51 1
967
160.
51 -
160.
61 1
967
160.
61 -
160.
71 1
967
160.
71 -
160.
75 1
967
160.
75 -
160.
85 1
967
160.
85 -
160.
95 1
967
160.
95 -
161.
05 1
967
Mile Post
Northbound Lane 3 Wheel Path Wear MP 152.69 to MP 161.05
0.000.05
0.100.15
0.200.25
0.300.35
0.400.45
0.500.55
0.600.65
0.700.75
0.80
Whe
el P
ath
Wea
r Dep
th(in
)16
1.05
- 16
1.15
196
7
161.
15 -
161.
25 1
967
161.
25 -
161.
35 1
967
161.
35 -
161.
45 1
967
161.
45 -
161.
55 1
967
Brid
ge -
161.
78 -
161.
88 1
967
161.
88 -
161.
98 1
967
161.
98 -
162.
08 1
967
162.
08 -
162.
18 1
967
162.
18 -
162.
19 1
967
Brid
ge -
162.
46 -
162.
56 1
967
162.
56 -
162.
66 1
967
162.
66 -
162.
76 1
967
Brid
ge -
164.
37 -
164.
47 1
967
164.
47 -
164.
57 1
967
Brid
ge -
164.
67 -
164.
77 1
967
Brid
ge -
165.
03 -
165.
13 1
967
165.
13 -
165.
23 1
967
Brid
ge -
166.
31 -
166.
41 1
965
166.
41 -
166.
51 1
965
166.
51 -
166.
61 1
965
166.
61 -
166.
71 1
965
166.
71 -
166.
81 1
965
166.
81 -
166.
91 1
965
Brid
ge -
167.
08 -
167.
18 1
964
167.
18 -
167.
28 1
964
Brid
ge -
167.
77 -
167.
87 1
964
167.
87 -
167.
97 1
964
167.
97 -
168.
07 1
964
168.
07 -
168.
17 1
964
168.
17 -
168.
27 1
964
168.
27 -
168.
34 1
964
Brid
ge -
169.
28 -
169.
38 1
965
169.
38 -
169.
48 1
965
Mile Post
Northbound Lane 3 Wheel Path Wear MP 161.05 to MP 169.48
J-10

0.000.05
0.100.15
0.200.25
0.300.35
0.400.45
0.500.55
0.600.65
0.700.75
0.80
Whe
el P
ath
Wea
r Dep
th(in
)16
9.48
- 16
9.58
196
5
169.
58 -
169.
68 1
965
169.
68 -
169.
78 1
965
169.
78 -
169.
88 1
965
169.
88 -
169.
98 1
965
169.
98 -
170.
08 1
965
170.
08 -
170.
18 1
965
Brid
ge -
170.
6 - 1
70.7
196
3
170.
7 - 1
70.8
196
3
170.
8 - 1
70.9
196
3
170.
9 - 1
71 1
965
171
- 171
.1 1
965
171.
1 - 1
71.2
196
5
171.
2 - 1
71.3
196
5
171.
3 - 1
71.4
196
5
171.
4 - 1
71.5
196
5
171.
5 - 1
71.6
196
5
171.
6 - 1
71.7
196
5
171.
7 - 1
71.8
196
5
171.
8 - 1
71.9
196
5
171.
9 - 1
72 1
965
172
- 172
.1 1
965
172.
1 - 1
72.2
196
5
172.
2 - 1
72.3
196
5Br
idge
-
172.
4 - 1
72.5
196
5
172.
5 - 1
72.6
196
5
172.
6 - 1
72.7
196
5Br
idge
-
172.
89 -
172.
99 1
965
172.
99 -
173.
09 1
965
173.
09 -
173.
19 1
965
173.
19 -
173.
29 1
965
173.
29 -
173.
39 1
965
173.
39 -
173.
49 1
965
173.
49 -
173.
59 1
965
173.
59 -
173.
69 1
965
173.
69 -
173.
79 1
965
173.
79 -
173.
89 1
965
173.
89 -
173.
99 1
965
173.
99 -
174.
09 1
965
174.
09 -
174.
14 1
965
Mile Post
Northbound Lane 3 Wheel Path Wear MP 169.48 to MP 174.14
0.000.05
0.100.15
0.200.25
0.300.35
0.400.45
0.500.55
0.600.65
0.700.75
0.80
Whe
el P
ath
Wea
r Dep
th(in
)17
4.14
- 17
4.24
196
5
174.
24 -
174.
34 1
965
174.
34 -
174.
44 1
965
174.
44 -
174.
54 1
965
174.
54 -
174.
64 1
965
174.
64 -
174.
74 1
965
174.
74 -
174.
84 1
965
174.
84 -
174.
94 1
965
174.
94 -
175.
04 1
965
175.
04 -
175.
11 1
965
Brid
ge -
175.
24 -
175.
34 1
965
175.
34 -
175.
44 1
965
Brid
ge -
175.
54 -
175.
64 1
965
175.
64 -
175.
74 1
965
175.
74 -
175.
84 1
965
175.
84 -
175.
94 1
965
175.
94 -
176.
04 1
965
176.
04 -
176.
13 1
965
Brid
ge -
176.
26 -
176.
36 1
965
176.
36 -
176.
46 1
965
176.
46 -
176.
56 1
965
176.
56 -
176.
66 1
965
176.
66 -
176.
7 1
965
176.
7 - 1
76.8
196
5
176.
8 - 1
76.9
196
5
176.
9 - 1
77 1
965
177
- 177
.1 1
965
177.
1 - 1
77.2
196
5
177.
2 - 1
77.3
196
5
177.
3 - 1
77.4
196
5
177.
4 - 1
77.5
196
5
177.
5 - 1
77.6
196
5
177.
6 - 1
77.7
196
5
Mile Post
Northbound Lane 3 Wheel Path Wear MP 174.14 to MP 177.7
J-11

Northbound Lane 4 Wheel Path Wear Plots
0.000.05
0.100.15
0.200.25
0.300.35
0.400.45
0.500.55
0.600.65
0.700.75
0.80
Whe
el P
ath
Wea
r Dep
th(in
)13
9.5
- 139
.6 1
962
139.
6 - 1
39.7
196
2
139.
7 - 1
39.8
196
2
139.
8 - 1
39.9
196
2
139.
9 - 1
40 1
962
140
- 140
.1 1
962
140.
1 - 1
40.2
196
2
140.
2 - 1
40.3
196
2
140.
3 - 1
40.4
196
2
140.
4 - 1
40.5
196
2
140.
5 - 1
40.6
196
2
140.
6 - 1
40.7
196
2
140.
7 - 1
40.8
196
2
140.
8 - 1
40.9
196
2
140.
9 - 1
41 1
962
141
- 141
.1 1
962
141.
1 - 1
41.2
196
2
141.
2 - 1
41.3
196
2
141.
3 - 1
41.4
196
2
141.
4 - 1
41.5
196
2
141.
5 - 1
41.6
196
2
141.
6 - 1
41.7
196
2
141.
7 - 1
41.8
196
2
141.
8 - 1
41.9
196
2
141.
9 - 1
42 1
962
142.
04 -
142.
14 1
962
142.
14 -
142.
24 1
962
142.
24 -
142.
34 1
962
142.
34 -
142.
44 1
962
142.
44 -
142.
54 1
962
142.
54 -
142.
64 1
962
142.
64 -
142.
74 1
962
142.
74 -
142.
79 1
962
142.
82 -
142.
92 1
962
142.
92 -
143.
02 1
962
143.
02 -
143.
12 1
962
143.
12 -
143.
22 1
962
143.
22 -
143.
32 1
962
143.
32 -
143.
42 1
962
143.
42 -
143.
52 1
962
143.
52 -
143.
62 1
962
Mile Post
Northbound Lane 4 Wheel Path Wear MP 139.50 to MP 143.62
0.00
0.05
0.100.15
0.200.25
0.300.35
0.400.45
0.500.55
0.600.65
0.700.75
0.80
Whe
el P
ath
Wea
r Dep
th(in
)14
3.62
- 14
3.72
196
2
143.
72 -
143.
82 1
962
143.
82 -
143.
92 1
962
143.
92 -
144.
02 1
962
144.
02 -
144.
12 1
962
144.
12 -
144.
19 1
962
144.
19 -
144.
29 1
962
144.
29 -
144.
39 1
962
144.
39 -
144.
49 1
962
144.
49 -
144.
59 1
962
Brid
ge -
144.
79 -
144.
89 1
962
144.
89 -
144.
99 1
962
144.
99 -
145.
09 1
962
145.
09 -
145.
19 1
962
145.
19 -
145.
29 1
962
145.
29 -
145.
39 1
962
145.
39 -
145.
49 1
962
145.
49 -
145.
59 1
962
145.
59 -
145.
69 1
962
Brid
ge -
145.
89 -
145.
99 1
962
145.
99 -
146.
09 1
962
146.
09 -
146.
19 1
962
146.
19 -
146.
29 1
962
146.
29 -
146.
33 1
962
Brid
ge -
146.
53 -
146.
63 1
962
146.
63 -
146.
73 1
962
Brid
ge -
146.
93 -
147.
03 1
962
147.
03 -
147.
13 1
962
147.
13 -
147.
23 1
962
147.
23 -
147.
33 1
962
147.
33 -
147.
43 1
962
147.
43 -
147.
53 1
962
147.
53 -
147.
63 1
962
Brid
ge -
147.
67 -
147.
77 1
962
147.
77 -
147.
87 1
962
Mile Post
Norhtbound Lane 4 Wheel Path Wear MP 143.62 to MP 147.87
J-12

0.000.05
0.100.15
0.20
0.250.30
0.35
0.400.45
0.50
0.550.60
0.650.70
0.75
0.80
Whe
el P
ath
Wea
r Dep
th(in
)14
7.87
- 14
7.97
196
2
147.
97 -
148.
07 1
962
148.
07 -
148.
17 1
962
148.
17 -
148.
27 1
962
148.
27 -
148.
37 1
962
148.
37 -
148.
47 1
962
148.
47 -
148.
57 1
962
148.
57 -
148.
67 1
962
148.
67 -
148.
77 1
962
148.
77 -
148.
87 1
962
148.
87 -
148.
97 1
962
148.
97 -
149.
07 1
962
Brid
ge -
149.
22 -
149.
32 1
962
149.
32 -
149.
42 1
966
149.
42 -
149.
52 1
966
149.
52 -
149.
62 1
966
149.
62 -
149.
72 1
966
149.
72 -
149.
82 1
966
149.
82 -
149.
92 1
966
149.
92 -
150.
02 1
966
150.
02 -
150.
12 1
966
150.
12 -
150.
22 1
966
150.
22 -
150.
32 1
966
150.
32 -
150.
42 1
966
150.
42 -
150.
52 1
966
150.
52 -
150.
62 1
966
150.
62 -
150.
72 1
966
150.
72 -
150.
82 1
966
150.
82 -
150.
92 1
966
150.
92 -
151.
02 1
966
151.
02 -
151.
12 1
966
151.
12 -
151.
22 1
966
151.
22 -
151.
32 1
966
151.
32 -
151.
42 1
966
151.
42 -
151.
52 1
966
151.
52 -
151.
62 1
966
151.
62 -
151.
72 1
966
151.
72 -
151.
82 1
966
151.
82 -
151.
92 1
966
151.
92 -
151.
97 1
966
Mile Post
Northbound Lane 4 Wheel Path Wear MP 147.97 to MP 151.97
0.000.05
0.100.15
0.200.25
0.300.35
0.400.45
0.500.55
0.600.65
0.700.75
0.80
Whe
el P
ath
Wea
r Dep
th(in
)15
1.99
- 15
2.09
196
6
152.
09 -
152.
19 1
966
152.
19 -
152.
26 1
966
152.
29 -
152.
39 1
966
152.
39 -
152.
49 1
966
152.
49 -
152.
59 1
966
152.
59 -
152.
69 1
966
152.
69 -
152.
79 1
969
152.
79 -
152.
89 1
969
152.
89 -
152.
99 1
969
152.
99 -
153.
09 1
969
153.
09 -
153.
19 1
969
153.
19 -
153.
2 1
969
153.
2 - 1
53.3
196
9
153.
3 - 1
53.4
196
9
153.
4 - 1
53.5
196
9
153.
5 - 1
53.6
196
9
153.
6 - 1
53.7
196
9
153.
7 - 1
53.8
196
9
153.
8 - 1
53.9
196
9
153.
9 - 1
54 1
969
154
- 154
.1 1
969
154.
1 - 1
54.1
4 1
969
Diam
ond
Gro
und
-
158.
31 -
158.
41 1
967
158.
41 -
158.
51 1
967
158.
51 -
158.
61 1
967
158.
61 -
158.
71 1
967
158.
71 -
158.
81 1
967
158.
81 -
158.
91 1
967
158.
91 -
159.
01 1
967
159.
01 -
159.
1 1
967
159.
1 - 1
59.2
196
7
159.
2 - 1
59.3
196
7
159.
3 - 1
59.4
196
7
159.
4 - 1
59.5
196
7
159.
5 - 1
59.6
196
7
159.
6 - 1
59.6
7 1
967
159.
71 -
159.
81 1
967
159.
81 -
159.
91 1
967
159.
91 -
160.
01 1
967
Mile Post
Northbound Lane 4 Wheel Path Wear MP 151.99 to MP 160.01
J-13

0.000.05
0.100.15
0.200.25
0.300.35
0.400.45
0.500.55
0.600.65
0.700.75
0.80
Whe
el P
ath
Wea
r Dep
th(in
)16
0.01
- 16
0.11
196
7
160.
11 -
160.
21 1
967
160.
21 -
160.
31 1
967
160.
31 -
160.
41 1
967
160.
41 -
160.
51 1
967
160.
51 -
160.
61 1
967
160.
61 -
160.
71 1
967
160.
71 -
160.
75 1
967
160.
75 -
160.
85 1
967
160.
85 -
160.
95 1
967
160.
95 -
161.
05 1
967
161.
05 -
161.
15 1
967
161.
15 -
161.
25 1
967
161.
25 -
161.
35 1
967
161.
35 -
161.
45 1
967
161.
45 -
161.
55 1
967
Brid
ge -
161.
68 -
161.
78 1
967
161.
78 -
161.
88 1
967
161.
88 -
161.
98 1
967
161.
98 -
162.
08 1
967
162.
08 -
162.
18 1
967
Brid
ge -
162.
36 -
162.
46 1
967
162.
46 -
162.
56 1
967
162.
56 -
162.
66 1
967
162.
66 -
162.
76 1
967
162.
76 -
162.
82 1
967
162.
96 -
163.
04 1
967
163.
2 - 1
63.2
4 1
967
164.
37 -
164.
47 1
967
164.
47 -
164.
57 1
967
164.
57 -
164.
67 1
967
164.
67 -
164.
77 1
967
164.
77 -
164.
8 1
967
164.
93 -
165.
03 1
967
165.
03 -
165.
13 1
967
165.
13 -
165.
23 1
967
Brid
ge -
166.
21 -
166.
31 1
965
166.
31 -
166.
41 1
965
Mile Post
Northbound Lane 4 Wheel Path Wear MP 160.01 to MP 166.41
0.00
0.05
0.10
0.15
0.20
0.25
0.30
0.35
0.40
0.45
0.50
0.55
0.60
0.65
0.70
0.75
0.80
Whe
el P
ath
Wea
r Dep
th(in
)
Mile Post
Northbound Lane 4 Wheel Path Wear MP 166.41 to MP 172.50
J-14

0.00
0.05
0.10
0.15
0.20
0.25
0.30
0.35
0.40
0.45
0.50
0.55
0.60
0.65
0.70
0.75
0.80
Whe
el P
ath
Wea
r Dep
th(in
)
Mile Post
Northbound Lane 4 Wheel Path Wear MP 172.50 to MP 177.75
Southbound Lane 1 Wheel Path Wear Plots
0.000.05
0.100.15
0.200.25
0.300.35
0.400.45
0.500.55
0.600.65
0.700.75
0.80
Whe
el P
ath
Wea
r Dep
th(in
)13
9.5
- 139
.6 1
970
139.
6 - 1
39.7
197
0
139.
7 - 1
39.8
197
0
139.
8 - 1
39.9
197
0
139.
9 - 1
40 1
970
140
- 140
.1 1
970
140.
1 - 1
40.2
197
0
140.
2 - 1
40.3
197
0
140.
3 - 1
40.4
197
0
140.
4 - 1
40.5
197
0
140.
5 - 1
40.6
197
0
140.
6 - 1
40.7
197
0
140.
7 - 1
40.8
197
0
140.
8 - 1
40.9
197
0
140.
9 - 1
41 1
970
141
- 141
.1 1
970
141.
1 - 1
41.2
197
0
141.
2 - 1
41.3
197
0
141.
3 - 1
41.4
197
0
141.
4 - 1
41.5
197
0
141.
5 - 1
41.6
197
0
141.
6 - 1
41.7
197
0
141.
7 - 1
41.8
197
0
141.
8 - 1
41.9
197
0
141.
9 - 1
42 1
970
142.
04 -
142.
09 1
962
142.
09 -
142.
19 1
962
142.
19 -
142.
29 1
962
142.
29 -
142.
39 1
962
142.
39 -
142.
49 1
962
142.
49 -
142.
59 1
962
142.
59 -
142.
69 1
962
142.
69 -
142.
79 1
962
142.
81 -
142.
89 1
962
142.
89 -
142.
99 1
962
142.
99 -
143.
09 1
962
143.
09 -
143.
19 1
962
143.
19 -
143.
29 1
970
Mile Post
Southbound Lane 1 Wheel Path Wear MP 139.50 to MP 143.29
J-15

0.000.05
0.100.15
0.200.25
0.300.35
0.400.45
0.500.55
0.600.65
0.700.75
0.80
Whe
el P
ath
Wea
r Dep
th(in
)14
3.29
- 14
3.39
197
0
143.
39 -
143.
49 1
970
143.
49 -
143.
59 1
970
143.
59 -
143.
69 1
970
143.
69 -
143.
79 1
970
143.
79 -
143.
89 1
970
143.
89 -
143.
99 1
970
143.
99 -
144.
09 1
970
144.
09 -
144.
19 1
970
144.
19 -
144.
29 1
970
144.
29 -
144.
39 1
970
DBR
and
DG -
146.
21 -
146.
31 1
970
Brid
ge -
146.
51 -
146.
61 1
970
146.
61 -
146.
71 1
970
Brid
ge -
146.
84 -
146.
94 1
970
146.
94 -
147.
04 1
970
147.
04 -
147.
14 1
970
147.
14 -
147.
24 1
970
147.
24 -
147.
34 1
970
147.
34 -
147.
44 1
970
147.
44 -
147.
54 1
970
147.
54 -
147.
58 1
970
DBR
and
DG -
149.
76 -
149.
84 1
970
149.
84 -
149.
94 1
970
149.
94 -
150.
04 1
970
150.
04 -
150.
14 1
970
150.
14 -
150.
24 1
970
150.
24 -
150.
34 1
970
150.
34 -
150.
44 1
970
150.
44 -
150.
54 1
970
150.
54 -
150.
64 1
970
150.
64 -
150.
74 1
970
150.
74 -
150.
84 1
970
150.
84 -
150.
94 1
970
Mile Post
Southbound Lane 1 Wheel Path Wear MP 143.29 to MP 150.94
0.000.05
0.100.15
0.200.25
0.300.35
0.400.45
0.500.55
0.600.65
0.700.75
0.80
Whe
el P
ath
Wea
r Dep
th(in
)15
0.94
- 15
1.04
197
0
151.
04 -
151.
14 1
970
151.
14 -
151.
24 1
970
151.
24 -
151.
34 1
970
151.
34 -
151.
44 1
970
151.
44 -
151.
54 1
970
151.
54 -
151.
64 1
970
151.
64 -
151.
74 1
970
151.
74 -
151.
84 1
970
151.
84 -
151.
94 1
970
151.
94 -
152.
04 1
970
152.
04 -
152.
14 1
970
152.
14 -
152.
15 1
970
Brid
ge -
152.
35 -
152.
45 1
970
152.
45 -
152.
55 1
970
152.
55 -
152.
65 1
970
152.
65 -
152.
75 1
970
152.
75 -
152.
85 1
970
152.
85 -
152.
95 1
970
152.
95 -
153.
05 1
970
153.
05 -
153.
15 1
970
153.
15 -
153.
24 1
969
153.
24 -
153.
34 1
969
153.
34 -
153.
44 1
969
153.
44 -
153.
54 1
969
153.
54 -
153.
64 1
969
153.
64 -
153.
74 1
969
153.
74 -
153.
84 1
969
153.
84 -
153.
94 1
969
153.
94 -
154.
04 1
969
154.
04 -
154.
06 1
969
Diam
ond
Gro
und
-
158.
46 -
158.
56 1
967
158.
56 -
158.
66 1
967
158.
66 -
158.
76 1
967
158.
76 -
158.
86 1
967
158.
86 -
158.
96 1
967
Mile Post
Southbound Lane 1 Wheel Path Wear MP 150.94 to MP 158.96
J-16

0.000.05
0.100.15
0.200.25
0.300.35
0.400.45
0.500.55
0.600.65
0.700.75
0.80
Whe
el P
ath
Wea
r Dep
th(in
)15
8.98
- 15
9.07
196
7
159.
07 -
159.
17 1
967
159.
17 -
159.
27 1
967
159.
27 -
159.
37 1
967
159.
37 -
159.
47 1
967
159.
47 -
159.
57 1
967
Brid
ge -
159.
71 -
159.
75 1
967
159.
75 -
159.
85 1
967
159.
85 -
159.
95 1
967
159.
95 -
160.
05 1
967
Brid
ge -
160.
25 -
160.
35 1
967
160.
35 -
160.
45 1
967
160.
45 -
160.
55 1
967
160.
55 -
160.
65 1
967
160.
65 -
160.
75 1
967
160.
75 -
160.
85 1
967
160.
85 -
160.
94 1
967
160.
94 -
161.
04 1
967
161.
04 -
161.
14 1
967
161.
14 -
161.
24 1
967
161.
24 -
161.
34 1
967
161.
34 -
161.
44 1
967
Brid
ge -
161.
74 -
161.
84 1
967
161.
84 -
161.
94 1
967
161.
94 -
162.
04 1
967
162.
04 -
162.
14 1
967
162.
14 -
162.
24 1
967
162.
37 -
162.
42 1
967
162.
42 -
162.
52 1
967
162.
52 -
162.
62 1
967
162.
62 -
162.
72 1
967
162.
72 -
162.
82 1
967
165.
83 -
165.
86 1
967
165.
86 -
165.
96 1
967
165.
96 -
166.
06 1
967
Mile Post
Southbound Lane 1 Wheel Path Wear MP 158.98 to MP 166.06
0.000.05
0.100.15
0.200.25
0.300.35
0.400.45
0.500.55
0.600.65
0.700.75
0.80
Whe
el P
ath
Wea
r Dep
th(in
)16
6.06
- 16
6.16
196
7
166.
16 -
166.
26 1
967
166.
26 -
166.
36 1
967
167.
72 -
167.
74 1
964
167.
74 -
167.
84 1
964
167.
84 -
167.
94 1
964
167.
94 -
168.
04 1
964
168.
04 -
168.
14 1
964
168.
14 -
168.
24 1
964
Brid
ge -
169.
18 -
169.
25 1
965
169.
25 -
169.
35 1
965
169.
35 -
169.
45 1
965
169.
45 -
169.
55 1
965
169.
55 -
169.
65 1
965
169.
65 -
169.
75 1
965
169.
75 -
169.
85 1
965
169.
85 -
169.
95 1
965
169.
95 -
170.
05 1
965
170.
05 -
170.
15 1
965
170.
15 -
170.
25 1
965
172.
52 -
172.
54 1
963
172.
54 -
172.
64 1
963
172.
64 -
172.
74 1
963
Brid
ge -
172.
84 -
172.
94 1
965
172.
94 -
173.
04 1
965
173.
04 -
173.
14 1
965
173.
14 -
173.
24 1
965
173.
24 -
173.
34 1
965
173.
34 -
173.
44 1
965
173.
44 -
173.
54 1
965
173.
54 -
173.
64 1
965
173.
64 -
173.
74 1
965
173.
74 -
173.
84 1
965
173.
84 -
173.
94 1
965
173.
94 -
174.
04 1
965
174.
04 -
174.
14 1
965
Mile Post
Southbound Lane 1 Wheel Path Wear MP 166.06 to MP 174.14
J-17

Southbound Lane 2 Wheel Path Wear Plots
0.000.05
0.100.15
0.200.25
0.300.35
0.400.45
0.500.55
0.600.65
0.700.75
0.80
Whe
el P
ath
Wea
r Dep
th(in
)13
9.5
- 139
.6 1
962
139.
6 - 1
39.7
196
2
139.
7 - 1
39.8
196
2
139.
8 - 1
39.9
196
2
139.
9 - 1
40 1
962
140
- 140
.1 1
962
140.
1 - 1
40.2
196
2
140.
2 - 1
40.3
196
2
140.
3 - 1
40.4
196
2
140.
4 - 1
40.5
196
2
140.
5 - 1
40.6
196
2
140.
6 - 1
40.7
196
2
140.
7 - 1
40.8
196
2
140.
8 - 1
40.9
196
2
140.
9 - 1
41 1
962
141
- 141
.1 1
962
141.
1 - 1
41.2
196
2
141.
2 - 1
41.3
196
2
141.
3 - 1
41.4
196
2
141.
4 - 1
41.5
196
2
141.
5 - 1
41.6
196
2
141.
6 - 1
41.7
196
2
141.
7 - 1
41.8
196
2
141.
8 - 1
41.9
196
2
141.
9 - 1
42 1
962
142.
04 -
142.
09 1
962
142.
09 -
142.
19 1
962
142.
19 -
142.
29 1
962
142.
29 -
142.
39 1
962
142.
39 -
142.
49 1
962
142.
49 -
142.
59 1
962
142.
59 -
142.
69 1
962
142.
69 -
142.
79 1
962
142.
81 -
142.
89 1
962
142.
89 -
142.
99 1
962
142.
99 -
143.
09 1
962
143.
09 -
143.
19 1
962
143.
19 -
143.
29 1
962
143.
29 -
143.
39 1
962
143.
39 -
143.
49 1
962
143.
49 -
143.
59 1
962
143.
59 -
143.
69 1
962
Mile Post
Southbound Lane 2 Wheel Path Wear MP 139.50 to MP 143.69
0.000.05
0.100.15
0.200.25
0.300.35
0.400.45
0.500.55
0.600.65
0.700.75
0.80
Whe
el P
ath
Wea
r Dep
th(in
)14
3.69
- 14
3.79
196
2
143.
79 -
143.
89 1
962
143.
89 -
143.
99 1
962
143.
99 -
144.
09 1
962
144.
09 -
144.
19 1
962
144.
19 -
144.
29 1
962
144.
29 -
144.
39 1
962
DBR
and
DG -
146.
21 -
146.
31 1
962
Brid
ge -
146.
51 -
146.
61 1
962
146.
61 -
146.
71 1
962
Brid
ge -
146.
84 -
146.
94 1
962
146.
94 -
147.
04 1
962
147.
04 -
147.
14 1
962
147.
14 -
147.
24 1
962
147.
24 -
147.
34 1
962
147.
34 -
147.
44 1
962
147.
44 -
147.
54 1
962
147.
54 -
147.
58 1
962
DBR
and
DG -
149.
76 -
149.
84 1
966
149.
84 -
149.
94 1
966
149.
94 -
150.
04 1
966
150.
04 -
150.
14 1
966
150.
14 -
150.
24 1
966
150.
24 -
150.
34 1
966
150.
34 -
150.
44 1
966
150.
44 -
150.
54 1
966
150.
54 -
150.
64 1
966
150.
64 -
150.
74 1
966
150.
74 -
150.
84 1
966
150.
84 -
150.
94 1
966
150.
94 -
151.
04 1
966
151.
04 -
151.
14 1
966
151.
14 -
151.
24 1
966
151.
24 -
151.
34 1
966
151.
34 -
151.
44 1
966
151.
44 -
151.
54 1
966
151.
54 -
151.
64 1
966
Mile Post
Southbound Lane 2 Wheel Path Wear MP 143.69 to MP 151.64
J-18

0.000.05
0.100.15
0.200.25
0.300.35
0.400.45
0.500.55
0.600.65
0.700.75
0.80
Whe
el P
ath
Wea
r Dep
th(in
)15
1.64
- 15
1.74
196
6
151.
74 -
151.
84 1
966
151.
84 -
151.
94 1
966
151.
94 -
152.
04 1
966
152.
04 -
152.
14 1
966
152.
14 -
152.
15 1
966
Brid
ge -
152.
35 -
152.
45 1
966
152.
45 -
152.
55 1
966
152.
55 -
152.
65 1
966
152.
65 -
152.
75 1
966
152.
75 -
152.
85 1
966
152.
85 -
152.
95 1
966
152.
95 -
153.
05 1
966
153.
05 -
153.
15 1
966
153.
15 -
153.
24 1
969
153.
24 -
153.
34 1
969
153.
34 -
153.
44 1
969
153.
44 -
153.
54 1
969
153.
54 -
153.
64 1
969
153.
64 -
153.
74 1
969
153.
74 -
153.
84 1
969
153.
84 -
153.
94 1
969
153.
94 -
154.
04 1
969
154.
04 -
154.
06 1
969
Diam
ond
Gro
und
-
158.
5 - 1
58.6
196
7
158.
6 - 1
58.7
196
7
158.
7 - 1
58.8
196
7
158.
8 - 1
58.9
196
7
158.
9 - 1
59 1
967
159
- 159
.1 1
967
159.
1 - 1
59.1
7 1
967
159.
17 -
159.
27 1
967
159.
27 -
159.
37 1
967
159.
37 -
159.
47 1
967
159.
47 -
159.
57 1
967
159.
57 -
159.
67 1
967
159.
71 -
159.
75 1
967
159.
75 -
159.
85 1
967
159.
85 -
159.
95 1
967
Mile Post
Southbound Lane 2 Wheel Path Wear MP 151.64 to MP 159.95
0.00
0.05
0.100.15
0.200.25
0.300.35
0.400.45
0.500.55
0.600.65
0.700.75
0.80
Whe
el P
ath
Wea
r Dep
th(in
)16
0.25
- 16
0.35
196
7
160.
35 -
160.
45 1
967
160.
45 -
160.
55 1
967
160.
55 -
160.
65 1
967
160.
65 -
160.
75 1
967
160.
75 -
160.
85 1
967
160.
85 -
160.
94 1
967
160.
94 -
161.
04 1
967
161.
04 -
161.
14 1
967
161.
14 -
161.
24 1
967
161.
24 -
161.
34 1
967
161.
34 -
161.
44 1
967
Brid
ge -
161.
74 -
161.
84 1
967
161.
84 -
161.
94 1
967
161.
94 -
162.
04 1
967
162.
04 -
162.
14 1
967
Brid
ge -
162.
37 -
162.
42 1
967
162.
42 -
162.
52 1
967
162.
52 -
162.
62 1
967
162.
62 -
162.
72 1
967
Brid
ge -
165.
53 -
165.
58 1
967
165.
58 -
165.
68 1
967
165.
68 -
165.
78 1
967
165.
78 -
165.
88 1
967
165.
88 -
165.
98 1
967
165.
98 -
166.
08 1
967
166.
08 -
166.
18 1
967
166.
18 -
166.
28 1
967
Brid
ge -
167.
72 -
167.
74 1
964
167.
74 -
167.
84 1
964
167.
84 -
167.
94 1
964
167.
94 -
168.
04 1
964
168.
04 -
168.
14 1
964
168.
14 -
168.
24 1
964
Brid
ge -
169.
18 -
169.
25 1
965
Mile Post
Southbound Lane 2 Wheel Path Wear MP 160.25 to MP 169.25
J-19

0.000.05
0.100.15
0.200.25
0.300.35
0.400.45
0.500.55
0.600.65
0.700.75
0.80
Whe
el P
ath
Wea
r Dep
th(in
)16
9.25
- 16
9.35
196
5
169.
35 -
169.
45 1
965
169.
45 -
169.
55 1
965
169.
55 -
169.
65 1
965
169.
65 -
169.
75 1
965
169.
75 -
169.
85 1
965
169.
85 -
169.
95 1
965
169.
95 -
170.
05 1
965
170.
05 -
170.
15 1
965
170.
15 -
170.
25 1
965
Brid
ge -
170.
59 -
170.
69 1
963
170.
69 -
170.
79 1
963
170.
79 -
170.
89 1
963
170.
89 -
170.
99 1
965
170.
99 -
171.
09 1
965
171.
09 -
171.
19 1
965
171.
19 -
171.
29 1
965
171.
29 -
171.
39 1
965
171.
39 -
171.
49 1
965
171.
49 -
171.
59 1
965
171.
59 -
171.
69 1
965
171.
69 -
171.
79 1
965
171.
79 -
171.
89 1
965
171.
89 -
171.
92 1
965
171.
92 -
172.
02 1
965
172.
02 -
172.
12 1
965
172.
12 -
172.
22 1
965
172.
22 -
172.
32 1
965
172.
32 -
172.
42 1
965
172.
42 -
172.
52 1
965
172.
52 -
172.
54 1
965
172.
54 -
172.
64 1
965
172.
64 -
172.
74 1
965
Brid
ge -
172.
84 -
172.
94 1
965
172.
94 -
173.
04 1
965
173.
04 -
173.
14 1
965
173.
14 -
173.
24 1
965
173.
24 -
173.
34 1
965
173.
34 -
173.
44 1
965
Mile Post
Southbound Lane 2 Wheel Path Wear MP 169.25 MP 173.44
0.000.050.100.150.200.250.300.350.400.450.500.550.600.650.700.750.80
Whe
el P
ath
Wea
r Dep
th(in
)17
3.44
- 17
3.54
196
5
173.
54 -
173.
64 1
965
173.
64 -
173.
74 1
965
173.
74 -
173.
84 1
965
173.
84 -
173.
94 1
965
173.
94 -
174.
04 1
965
174.
04 -
174.
14 1
965
174.
14 -
174.
21 1
965
174.
21 -
174.
31 1
965
174.
31 -
174.
41 1
965
174.
41 -
174.
51 1
965
174.
51 -
174.
61 1
965
174.
61 -
174.
71 1
965
174.
71 -
174.
81 1
965
174.
81 -
174.
91 1
965
174.
91 -
175.
01 1
965
Brid
ge -
175.
23 -
175.
33 1
965
175.
33 -
175.
43 1
965
Brid
ge -
175.
53 -
175.
63 1
965
175.
63 -
175.
73 1
965
175.
73 -
175.
83 1
965
175.
83 -
175.
93 1
965
175.
93 -
176.
03 1
965
Brid
ge -
176.
26 -
176.
36 1
965
176.
36 -
176.
46 1
965
176.
46 -
176.
56 1
965
176.
56 -
176.
66 1
965
176.
66 -
176.
76 1
965
176.
76 -
176.
86 1
965
176.
86 -
176.
96 1
965
176.
96 -
177.
05 1
965
177.
05 -
177.
15 1
965
177.
15 -
177.
25 1
965
177.
25 -
177.
35 1
965
177.
35 -
177.
45 1
965
177.
45 -
177.
55 1
965
177.
55 -
177.
65 1
965
Mile Post
Southbound Lane 2 Wheel Path Wear MP 173.44 to MP 177.65
J-20

Southbound Lane 3 Wheel Path Wear Plots
0.000.05
0.100.15
0.200.25
0.300.35
0.400.45
0.500.55
0.600.65
0.700.75
0.80
Whe
el P
ath
Wea
r Dep
th(in
)13
9.5
- 139
.6 1
962
139.
6 - 1
39.7
196
2
139.
7 - 1
39.8
196
2
139.
8 - 1
39.9
196
2
139.
9 - 1
40 1
962
140
- 140
.1 1
962
140.
1 - 1
40.2
196
2
140.
2 - 1
40.3
196
2
140.
3 - 1
40.4
196
2
140.
4 - 1
40.5
196
2
140.
5 - 1
40.6
196
2
140.
6 - 1
40.7
196
2
140.
7 - 1
40.8
196
2
140.
8 - 1
40.9
196
2
140.
9 - 1
41 1
962
141
- 141
.1 1
962
141.
1 - 1
41.2
196
2
141.
2 - 1
41.3
196
2
141.
3 - 1
41.4
196
2
141.
4 - 1
41.5
196
2
141.
5 - 1
41.6
196
2
141.
6 - 1
41.7
196
2
141.
7 - 1
41.8
196
2
141.
8 - 1
41.9
196
2
141.
9 - 1
42 1
962
142.
04 -
142.
09 1
962
142.
09 -
142.
19 1
962
142.
19 -
142.
29 1
962
142.
29 -
142.
39 1
962
142.
39 -
142.
49 1
962
142.
49 -
142.
59 1
962
142.
59 -
142.
69 1
962
142.
69 -
142.
79 1
962
142.
81 -
142.
89 1
962
142.
89 -
142.
99 1
962
142.
99 -
143.
09 1
962
143.
09 -
143.
19 1
962
143.
19 -
143.
29 1
962
143.
29 -
143.
39 1
962
143.
39 -
143.
49 1
962
143.
49 -
143.
59 1
962
143.
59 -
143.
69 1
962
Mile Post
Southbound Lane 3 Wheel Path Wear MP 139.50 to MP 143.69
0.000.05
0.100.15
0.200.25
0.300.35
0.400.45
0.500.55
0.600.65
0.700.75
0.80
Whe
el P
ath
Wea
r Dep
th(in
)14
3.69
- 14
3.79
196
2
143.
79 -
143.
89 1
962
143.
89 -
143.
99 1
962
143.
99 -
144.
09 1
962
144.
09 -
144.
19 1
962
144.
19 -
144.
29 1
962
144.
29 -
144.
39 1
962
DBR
and
DG -
146.
21 -
146.
31 1
962
Brid
ge -
146.
51 -
146.
61 1
962
146.
61 -
146.
71 1
962
146.
71 -
146.
81 1
962
Brid
ge -
146.
94 -
147.
04 1
962
147.
04 -
147.
14 1
962
147.
14 -
147.
24 1
962
147.
24 -
147.
34 1
962
147.
34 -
147.
44 1
962
147.
44 -
147.
54 1
962
147.
54 -
147.
58 1
962
DBR
and
DG -
149.
76 -
149.
84 1
966
149.
84 -
149.
94 1
966
149.
94 -
150.
04 1
966
150.
04 -
150.
14 1
966
150.
14 -
150.
24 1
966
150.
24 -
150.
34 1
966
150.
34 -
150.
44 1
966
150.
44 -
150.
54 1
966
150.
54 -
150.
64 1
966
150.
64 -
150.
74 1
966
150.
74 -
150.
84 1
966
150.
84 -
150.
94 1
966
150.
94 -
151.
04 1
966
151.
04 -
151.
14 1
966
151.
14 -
151.
24 1
966
151.
24 -
151.
34 1
966
151.
34 -
151.
44 1
966
151.
44 -
151.
54 1
966
151.
54 -
151.
64 1
966
151.
64 -
151.
74 1
966
Mile Post
Southbound Lane 3 Wheel Path Wear MP 143.69 to MP 151.74
J-21

0.000.05
0.100.15
0.200.25
0.300.35
0.400.45
0.500.55
0.600.65
0.700.75
0.80
Whe
el P
ath
Wea
r Dep
th(in
)15
1.74
- 15
1.84
196
6
151.
84 -
151.
94 1
966
151.
94 -
152.
04 1
966
152.
04 -
152.
14 1
966
152.
14 -
152.
15 1
966
152.
15 -
152.
25 1
966
Brid
ge -
152.
35 -
152.
45 1
966
152.
45 -
152.
55 1
966
152.
55 -
152.
65 1
966
152.
65 -
152.
75 1
966
152.
75 -
152.
85 1
966
152.
85 -
152.
95 1
966
152.
95 -
153.
05 1
966
153.
05 -
153.
15 1
966
Diam
ond
Gro
und
-
158.
5 - 1
58.6
196
7
158.
6 - 1
58.7
196
7
158.
7 - 1
58.8
196
7
158.
8 - 1
58.9
196
7
158.
9 - 1
59 1
967
159
- 159
.1 1
967
159.
1 - 1
59.1
7 1
967
159.
17 -
159.
27 1
967
159.
27 -
159.
37 1
967
159.
37 -
159.
47 1
967
159.
47 -
159.
57 1
967
159.
57 -
159.
67 1
967
Brid
ge -
159.
75 -
159.
85 1
967
159.
85 -
159.
95 1
967
159.
95 -
160.
05 1
967
Brid
ge -
160.
25 -
160.
35 1
967
160.
35 -
160.
45 1
967
160.
45 -
160.
55 1
967
160.
55 -
160.
65 1
967
160.
65 -
160.
75 1
967
160.
75 -
160.
85 1
967
160.
85 -
160.
94 1
967
160.
94 -
161.
04 1
967
161.
04 -
161.
14 1
967
Mile Post
Southbound Lane 3 Wheel Path Wear MP 151.74 to MP 161.14
0.000.05
0.100.15
0.200.25
0.300.35
0.400.45
0.500.55
0.600.65
0.700.75
0.80
Whe
el P
ath
Wea
r Dep
th(in
)16
1.14
- 16
1.24
196
7
161.
24 -
161.
34 1
967
161.
34 -
161.
44 1
967
Brid
ge -
161.
74 -
161.
84 1
967
161.
84 -
161.
94 1
967
161.
94 -
162.
04 1
967
162.
04 -
162.
14 1
967
162.
14 -
162.
24 1
967
Brid
ge -
162.
42 -
162.
52 1
967
162.
52 -
162.
62 1
967
162.
62 -
162.
72 1
967
162.
72 -
162.
82 1
967
Brie
ge -
164.
33 -
164.
4 1
967
164.
4 - 1
64.5
196
7
164.
5 - 1
64.6
196
7Br
idge
-
164.
7 - 1
64.8
196
7Br
idge
-
164.
98 -
165.
08 1
967
165.
08 -
165.
18 1
967
165.
18 -
165.
28 1
967
Brid
ge -
165.
48 -
165.
58 1
967
165.
58 -
165.
68 1
967
165.
68 -
165.
78 1
967
165.
78 -
165.
88 1
967
165.
88 -
165.
98 1
967
165.
98 -
166.
08 1
967
166.
08 -
166.
18 1
967
166.
18 -
166.
28 1
967
166.
28 -
166.
36 1
967
Brid
ge -
167.
74 -
167.
84 1
964
167.
84 -
167.
94 1
964
167.
94 -
168.
04 1
964
168.
04 -
168.
14 1
964
168.
14 -
168.
24 1
964
Brid
ge -
169.
18 -
169.
25 1
965
Mile Post
Southbound Lane 3 Wheel Path Wear MP 161.14 to MP 169.25
J-22

0.000.05
0.100.15
0.200.25
0.300.35
0.400.45
0.500.55
0.600.65
0.700.75
0.80
Whe
el P
ath
Wea
r Dep
th(in
)16
9.25
- 16
9.35
196
5
169.
35 -
169.
45 1
965
169.
45 -
169.
55 1
965
169.
55 -
169.
65 1
965
169.
65 -
169.
75 1
965
169.
75 -
169.
85 1
965
169.
85 -
169.
95 1
965
169.
95 -
170.
05 1
965
170.
05 -
170.
15 1
965
170.
15 -
170.
25 1
965
Brid
ge -
170.
59 -
170.
69 1
963
170.
69 -
170.
79 1
963
170.
79 -
170.
89 1
963
170.
89 -
170.
99 1
965
170.
99 -
171.
09 1
965
171.
09 -
171.
19 1
965
171.
19 -
171.
29 1
965
171.
29 -
171.
39 1
965
171.
39 -
171.
49 1
965
171.
49 -
171.
59 1
965
171.
59 -
171.
69 1
965
171.
69 -
171.
79 1
965
171.
79 -
171.
89 1
965
171.
89 -
171.
92 1
965
171.
92 -
172.
02 1
965
172.
02 -
172.
12 1
965
172.
12 -
172.
22 1
965
172.
22 -
172.
32 1
965
172.
32 -
172.
42 1
965
172.
42 -
172.
52 1
965
172.
52 -
172.
54 1
965
172.
54 -
172.
64 1
965
172.
64 -
172.
74 1
965
Brid
ge -
172.
84 -
172.
94 1
965
172.
94 -
173.
04 1
965
173.
04 -
173.
14 1
965
173.
14 -
173.
24 1
965
173.
24 -
173.
34 1
965
173.
34 -
173.
44 1
965
173.
44 -
173.
54 1
965
Mile Post
Southbound Lane 3 Wheel Path Wear MP 169.25 to MP 173.54
0.000.05
0.100.15
0.200.25
0.300.35
0.400.45
0.500.55
0.600.65
0.700.75
0.80
Whe
el P
ath
Wea
r Dep
th(in
)17
3.54
- 17
3.64
196
5
173.
64 -
173.
74 1
965
173.
74 -
173.
84 1
965
173.
84 -
173.
94 1
965
173.
94 -
174.
04 1
965
174.
04 -
174.
14 1
965
174.
14 -
174.
21 1
965
174.
21 -
174.
31 1
965
174.
31 -
174.
41 1
965
174.
41 -
174.
51 1
965
174.
51 -
174.
61 1
965
174.
61 -
174.
71 1
965
174.
71 -
174.
81 1
965
174.
81 -
174.
91 1
965
174.
91 -
175.
01 1
965
Brid
ge -
175.
23 -
175.
33 1
965
175.
33 -
175.
43 1
965
Brid
ge -
175.
53 -
175.
63 1
965
175.
63 -
175.
73 1
965
175.
73 -
175.
83 1
965
175.
83 -
175.
93 1
965
175.
93 -
176.
03 1
965
Brid
ge -
176.
26 -
176.
36 1
965
176.
36 -
176.
46 1
965
176.
46 -
176.
56 1
965
176.
56 -
176.
66 1
965
176.
66 -
176.
76 1
965
176.
76 -
176.
86 1
965
176.
86 -
176.
96 1
965
176.
96 -
177.
05 1
965
177.
05 -
177.
15 1
965
177.
15 -
177.
25 1
965
177.
25 -
177.
35 1
965
177.
35 -
177.
45 1
965
177.
45 -
177.
55 1
965
177.
55 -
177.
65 1
965
Mile Post
Southbound Lane 3 Wheel Path Wear MP 173.54 to MP 177.65
J-23

Southbound Lane 4 Wheel Path Wear Plots
0.00
0.05
0.100.15
0.200.25
0.300.35
0.400.45
0.500.55
0.600.65
0.700.75
0.80
Whe
el P
ath
Wea
r Dep
th(in
)13
9.5
- 139
.6 1
962
139.
6 - 1
39.7
196
2
139.
7 - 1
39.8
196
2
139.
8 - 1
39.9
196
2
139.
9 - 1
40 1
962
140
- 140
.1 1
962
140.
1 - 1
40.2
196
2
140.
2 - 1
40.3
196
2
140.
3 - 1
40.4
196
2
140.
4 - 1
40.5
196
2
140.
5 - 1
40.6
196
2
140.
6 - 1
40.7
196
2
140.
7 - 1
40.8
196
2
140.
8 - 1
40.9
196
2
140.
9 - 1
41 1
962
141
- 141
.1 1
962
141.
1 - 1
41.2
196
2
141.
2 - 1
41.3
196
2
141.
3 - 1
41.4
196
2
141.
4 - 1
41.5
196
2
141.
5 - 1
41.6
196
2
141.
6 - 1
41.7
196
2
141.
7 - 1
41.8
196
2
141.
8 - 1
41.9
196
2
141.
9 - 1
42 1
962
142.
04 -
142.
09 1
962
142.
09 -
142.
19 1
962
142.
19 -
142.
29 1
962
142.
29 -
142.
39 1
962
142.
39 -
142.
49 1
962
142.
49 -
142.
59 1
962
142.
59 -
142.
69 1
962
142.
69 -
142.
79 1
962
142.
81 -
142.
89 1
962
142.
89 -
142.
99 1
962
142.
99 -
143.
09 1
962
143.
09 -
143.
19 1
962
143.
19 -
143.
29 1
962
143.
29 -
143.
39 1
962
143.
39 -
143.
49 1
962
Mile Post
Southbound Lane 4 Wheel Path Wear MP 139.50 to MP 143.49
0.00
0.05
0.100.15
0.200.25
0.300.35
0.400.45
0.500.55
0.600.65
0.700.75
0.80
Whe
el P
ath
Wea
r Dep
th(in
)14
3.49
- 14
3.59
196
2
143.
59 -
143.
69 1
962
143.
69 -
143.
79 1
962
143.
79 -
143.
89 1
962
143.
89 -
143.
99 1
962
143.
99 -
144.
09 1
962
144.
09 -
144.
19 1
962
144.
19 -
144.
29 1
962
144.
29 -
144.
39 1
962
DBR
and
DG -
146.
21 -
146.
31 1
962
Brid
ge -
146.
51 -
146.
61 1
962
146.
61 -
146.
71 1
962
Brid
ge -
146.
84 -
146.
94 1
962
146.
94 -
147.
04 1
962
147.
04 -
147.
14 1
962
147.
14 -
147.
24 1
962
147.
24 -
147.
34 1
962
147.
34 -
147.
44 1
962
147.
44 -
147.
54 1
962
147.
54 -
147.
59 1
962
DBR
and
DG -
149.
76 -
149.
84 1
966
149.
84 -
149.
94 1
966
149.
94 -
150.
04 1
966
150.
04 -
150.
14 1
966
150.
14 -
150.
24 1
966
150.
24 -
150.
34 1
966
150.
34 -
150.
44 1
966
150.
44 -
150.
54 1
966
150.
54 -
150.
64 1
966
150.
64 -
150.
74 1
966
150.
74 -
150.
84 1
966
150.
84 -
150.
94 1
966
150.
94 -
151.
04 1
966
151.
04 -
151.
14 1
966
151.
14 -
151.
24 1
966
151.
24 -
151.
34 1
966
Mile Post
Southbound Lane 4 Wheel Path Wear MP 143.49 to MP 151.34
J-24

0.00
0.05
0.100.15
0.200.25
0.300.35
0.400.45
0.500.55
0.600.65
0.700.75
0.80
Whe
el P
ath
Wea
r Dep
th(in
)15
1.34
- 15
1.44
196
6
151.
44 -
151.
54 1
966
151.
54 -
151.
64 1
966
151.
64 -
151.
74 1
966
151.
74 -
151.
84 1
966
151.
84 -
151.
94 1
966
151.
94 -
152.
04 1
966
152.
04 -
152.
14 1
966
152.
14 -
152.
15 1
966
Brid
ge -
152.
35 -
152.
45 1
966
152.
45 -
152.
55 1
966
152.
55 -
152.
65 1
966
152.
65 -
152.
75 1
966
152.
75 -
152.
85 1
966
152.
85 -
152.
95 1
966
152.
95 -
153.
05 1
966
153.
05 -
153.
15 1
966
153.
15 -
153.
24 1
969
153.
24 -
153.
34 1
969
153.
34 -
153.
44 1
969
153.
44 -
153.
54 1
969
153.
54 -
153.
64 1
969
153.
64 -
153.
74 1
969
153.
74 -
153.
84 1
969
153.
84 -
153.
94 1
969
153.
94 -
154.
04 1
969
154.
04 -
154.
06 1
969
Diam
ond
Gro
nd -
158.
5 - 1
58.6
196
7
158.
6 - 1
58.7
196
7
158.
7 - 1
58.8
196
7
158.
8 - 1
58.9
196
7
158.
9 - 1
59 1
967
159
- 159
.1 1
967
159.
1 - 1
59.1
7 1
967
159.
17 -
159.
27 1
967
159.
27 -
159.
37 1
967
159.
37 -
159.
47 1
967
159.
47 -
159.
57 1
967
Mile Post
Southbound Lane 4 Wheel Path Wear MP 151.34 to MP 159.57
0.000.05
0.100.15
0.200.25
0.300.35
0.400.45
0.500.55
0.600.65
0.700.75
0.80
Whe
el P
ath
Wea
r Dep
th(in
)15
9.71
- 15
9.75
196
7
159.
75 -
159.
85 1
967
159.
85 -
159.
95 1
967
Brid
ge -
160.
25 -
160.
35 1
967
160.
35 -
160.
45 1
967
160.
45 -
160.
55 1
967
160.
55 -
160.
65 1
967
160.
65 -
160.
75 1
967
160.
75 -
160.
85 1
967
160.
85 -
160.
94 1
967
160.
94 -
161.
04 1
967
161.
04 -
161.
14 1
967
161.
14 -
161.
24 1
967
161.
24 -
161.
34 1
967
161.
34 -
161.
44 1
967
Brid
ge -
161.
74 -
161.
84 1
967
161.
84 -
161.
94 1
967
161.
94 -
162.
04 1
967
162.
04 -
162.
14 1
967
Brid
ge -
162.
37 -
162.
42 1
967
162.
42 -
162.
52 1
967
162.
52 -
162.
62 1
967
162.
62 -
162.
72 1
967
Brid
ge -
164.
33 -
164.
4 1
967
164.
4 - 1
64.5
196
7
164.
5 - 1
64.6
196
7
164.
6 - 1
64.7
196
7Br
idge
-
164.
93 -
164.
98 1
967
164.
98 -
165.
08 1
967
165.
08 -
165.
18 1
967
Brid
ge -
165.
44 -
165.
48 1
967
165.
48 -
165.
58 1
967
165.
58 -
165.
68 1
967
Mile Post
Southbound Lane 4 Wheel Path Wear MP 159.71 to MP 165.68
J-25

0.00
0.05
0.100.15
0.200.25
0.300.35
0.400.45
0.500.55
0.600.65
0.700.75
0.80
Whe
el P
ath
Wea
r Dep
th(in
)16
5.68
- 16
5.78
196
7
165.
78 -
165.
88 1
967
165.
88 -
165.
98 1
967
165.
98 -
166.
08 1
967
166.
08 -
166.
18 1
967
166.
18 -
166.
28 1
967
Brid
ge -
167.
72 -
167.
74 1
964
167.
74 -
167.
84 1
964
167.
84 -
167.
94 1
964
167.
94 -
168.
04 1
964
168.
04 -
168.
14 1
964
168.
14 -
168.
24 1
964
Brid
ge -
169.
18 -
169.
25 1
965
169.
25 -
169.
35 1
965
169.
35 -
169.
45 1
965
169.
45 -
169.
55 1
965
169.
55 -
169.
65 1
965
169.
65 -
169.
75 1
965
169.
75 -
169.
85 1
965
169.
85 -
169.
95 1
965
169.
95 -
170.
05 1
965
170.
05 -
170.
15 1
965
170.
15 -
170.
25 1
965
Brid
ge -
170.
59 -
170.
69 1
963
170.
69 -
170.
79 1
963
170.
79 -
170.
89 1
963
170.
89 -
170.
99 1
965
170.
99 -
171.
09 1
965
171.
09 -
171.
19 1
965
171.
19 -
171.
29 1
965
171.
29 -
171.
39 1
965
171.
39 -
171.
49 1
965
171.
49 -
171.
59 1
965
171.
59 -
171.
69 1
965
171.
69 -
171.
79 1
965
171.
79 -
171.
89 1
965
171.
89 -
171.
92 1
965
Mile Post
Southbound Lane 4 Wheel Path Wear MP 165.68 to MP 171.92
0.00
0.05
0.100.15
0.200.25
0.300.35
0.400.45
0.500.55
0.600.65
0.70
0.750.80
Whe
el P
ath
Wea
r Dep
th(in
)17
1.92
- 17
2.02
196
5
172.
02 -
172.
12 1
965
172.
12 -
172.
22 1
965
172.
22 -
172.
32 1
965
172.
32 -
172.
42 1
965
172.
42 -
172.
52 1
965
172.
52 -
172.
54 1
965
172.
54 -
172.
64 1
965
172.
64 -
172.
74 1
965
Brid
ge -
172.
84 -
172.
94 1
965
172.
94 -
173.
04 1
965
173.
04 -
173.
14 1
965
173.
14 -
173.
24 1
965
173.
24 -
173.
34 1
965
173.
34 -
173.
44 1
965
173.
44 -
173.
54 1
965
173.
54 -
173.
64 1
965
173.
64 -
173.
74 1
965
173.
74 -
173.
84 1
965
173.
84 -
173.
94 1
965
173.
94 -
174.
04 1
965
174.
04 -
174.
14 1
965
174.
14 -
174.
21 1
965
174.
21 -
174.
31 1
965
174.
31 -
174.
41 1
965
174.
41 -
174.
51 1
965
174.
51 -
174.
61 1
965
174.
61 -
174.
71 1
965
174.
71 -
174.
81 1
965
174.
81 -
174.
91 1
965
174.
91 -
175.
01 1
965
Brid
ge -
175.
23 -
175.
33 1
965
175.
33 -
175.
43 1
965
Brid
ge -
175.
53 -
175.
63 1
965
175.
63 -
175.
73 1
965
175.
73 -
175.
83 1
965
175.
83 -
175.
93 1
965
Mile Post
Southbound Lane 4 Wheel Path Wear MP 165.68 to MP 171.92
J-26

0.000.05
0.100.15
0.200.25
0.30
0.350.40
0.450.50
0.550.60
0.65
0.700.75
0.80
Whe
el P
ath
Wea
r Dep
th(in
)17
5.93
- 17
6.03
196
517
6.03
- 17
6.13
196
517
6.16
- 17
6.16
196
5
Brid
ge -
17
6.26
- 17
6.36
196
517
6.36
- 17
6.46
196
517
6.46
- 17
6.56
196
517
6.56
- 17
6.66
196
517
6.66
- 17
6.76
196
517
6.76
- 17
6.86
196
517
6.86
- 17
6.96
196
517
6.96
- 17
7.05
196
517
7.05
- 17
7.15
196
517
7.15
- 17
7.25
196
517
7.25
- 17
7.35
196
517
7.35
- 17
7.45
196
517
7.45
- 17
7.55
196
517
7.55
- 17
7.65
196
5
Mile Post
Southbound Lane 4 Wheel Path Wear MP 175.93 to MP 177.65
J-27

Appendix K- Number of Cracks per Section Distress Plots
K-1

Northbound Lane 1 Cracked Panel Plots
139.
5 - 1
39.6
139.
6 - 1
39.7
139.
7 - 1
39.8
139.
8 - 1
39.9
139.
9 - 1
4014
0 - 1
40.1
140.
2 - 1
40.3
140.
3 - 1
40.4
140.
4 - 1
40.5
140.
5 - 1
40.6
140.
6 - 1
40.7
140.
7 - 1
40.8
140.
8 - 1
40.9
140.
9 - 1
4114
1 - 1
41.1
141.
1 - 1
41.2
141.
3 - 1
41.4
141.
4 - 1
41.5
141.
5 - 1
41.6
141.
7 - 1
41.8
141.
8 - 1
41.9
141.
9 - 1
4214
2.04
- 14
2.14
142.
14 -
142.
2414
2.24
- 14
2.34
142.
34 -
142.
4414
2.44
- 14
2.54
142.
54 -
142.
6414
2.64
- 14
2.74
142.
92 -
143.
0214
3.02
- 14
3.12
143.
12 -
143.
2214
3.22
- 14
3.32
143.
32 -
143.
4214
3.42
- 14
3.52
143.
52 -
143.
6214
3.62
- 14
3.72
143.
72 -
143.
8214
3.82
- 14
3.92
02468
10121416182022242628303234
Num
ber o
f Cra
cked
Pan
els
Mile Post
Nourthbound Lane 1 Panel Cracking MP 139.50 to MP 143.92
# of Panels w/ 4+ Cracks# of Panels w/ 2-3 Cracks# of Panels w/ 1 CrackTotal # of Cracked Panels
143.
92 -
144.
02
144.
02 -
144.
12
144.
12 -
144.
19
144.
19 -
144.
29
144.
29 -
144.
39
144.
39 -
144.
49
144.
49 -
144.
59Br
idge
-
144.
79 -
144.
89
144.
89 -
144.
99
144.
99 -
145.
09
145.
09 -
145.
19
145.
19 -
145.
29
145.
29 -
145.
39
145.
39 -
145.
49
145.
49 -
145.
5914
5.59
- 14
5.69
Brid
ge -
145.
89 -
145.
99
145.
99 -
146.
0914
6.09
- 14
6.19
146.
19 -
146.
2914
6.29
- 14
6.33
146.
33 -
146.
43Br
idge
-
146.
53 -
146.
6314
6.63
- 14
6.73
Brid
ge -
146.
93 -
147.
0314
7.03
- 14
7.13
147.
13 -
147.
2314
7.23
- 14
7.33
147.
33 -
147.
4314
7.43
- 14
7.53
147.
53 -
147.
6314
7.63
- 14
7.64
147.
67 -
147.
7714
7.77
- 14
7.87
147.
87 -
147.
9714
7.97
- 14
8.07
148.
07 -
148.
17
02468
10121416182022242628303234
Num
ber o
f Cra
cked
Pan
els
Mile Post
Northbound Lane 1 Panel Cracking MP 143.92 to MP 148.17
# of Panels w/ 4+ Cracks# of Panels w/ 2-3 Cracks# of Panels w/ 1 CracksTotal # of Cracked Panels
K-2

148.
17 -
148.
27
148.
27 -
148.
37
148.
37 -
148.
47
148.
47 -
148.
57
148.
57 -
148.
67
148.
67 -
148.
77
148.
77 -
148.
87
148.
87 -
148.
97
148.
97 -
149.
07Br
idge
-
149.
22 -
149.
32
149.
32 -
149.
42
149.
42 -
149.
52
149.
52 -
149.
62
149.
62 -
149.
72
149.
72 -
149.
82
149.
82 -
149.
92
149.
92 -
150.
02
150.
02 -
150.
1215
0.12
- 15
0.22
150.
22 -
150.
3215
0.32
- 15
0.42
150.
42 -
150.
5215
0.52
- 15
0.62
150.
62 -
150.
7215
0.72
- 15
0.82
150.
82 -
150.
9215
0.92
- 15
1.02
151.
02 -
151.
1215
1.12
- 15
1.22
151.
22 -
151.
2315
1.23
- 15
1.33
151.
33 -
151.
4315
1.43
- 15
1.53
151.
53 -
151.
6315
1.63
- 15
1.73
151.
73 -
151.
8315
1.83
- 15
1.93
151.
93 -
152.
0315
2.03
- 15
2.13
02468
10121416182022242628303234
Num
ber o
f Cra
cked
Pan
els
Mile Post
Northbound Lane 1 Cracked Panels MP 148.17 to MP 152.13
# of Panels w/ 4+ Cracks# of Panels w/ 2-3 Cracks# of Panels w/ 1 CrackTotal # of Cracked Panels
152.
13 -
152.
23Br
idge
-
152.
39 -
152.
49
152.
49 -
152.
59
152.
59 -
152.
69
152.
69 -
152.
79
152.
79 -
152.
89
152.
89 -
152.
99
152.
99 -
153.
09
153.
09 -
153.
1915
3.19
- 15
3.2
153.
2 - 1
53.3
153.
3 - 1
53.4
153.
4 - 1
53.5
153.
5 - 1
53.6
Brid
ge -
153.
8 - 1
53.9
153.
9 - 1
5415
4 - 1
54.1
154.
1 - 1
54.1
4
Diam
ond
Gro
und
-
158.
51 -
158.
61
158.
61 -
158.
71
158.
71 -
158.
8115
8.81
- 15
8.91
158.
91 -
159.
0115
9.01
- 15
9.1
159.
1 - 1
59.2
159.
2 - 1
59.3
159.
3 - 1
59.4
159.
4 - 1
59.5
159.
5 - 1
59.6
Brid
ge -
159.
71 -
159.
8115
9.81
- 15
9.91
159.
91 -
160.
0116
0.01
- 16
0.11
160.
11 -
160.
2116
0.21
- 16
0.31
160.
31 -
160.
41
02468
10121416182022242628303234
Num
ber o
f Cra
cked
Pan
els
Mile Post
Northbound Lane 1 Cracked Panels MP 152.13 to MP 160.41
# of Panels w/ 4+ Cracks# of Panels w/ 2-3 Cracks# of Panels w/ 1 CrackTotal # of Cracked Panels
K-3

160.
41 -
160.
51
160.
51 -
160.
61
160.
61 -
160.
71
160.
71 -
160.
75
160.
75 -
160.
85
160.
85 -
160.
95
160.
95 -
161.
05
161.
05 -
161.
15
161.
15 -
161.
25
161.
25 -
161.
35
161.
35 -
161.
45
161.
45 -
161.
55Br
idge
-
161.
78 -
161.
88
161.
88 -
161.
98
161.
98 -
162.
08
162.
08 -
162.
18Br
idge
-
162.
36 -
162.
4616
2.46
- 16
2.56
162.
56 -
162.
5716
6.21
- 16
6.31
166.
31 -
166.
4116
6.41
- 16
6.51
166.
51 -
166.
6116
6.61
- 16
6.71
166.
71 -
166.
8116
6.81
- 16
6.91
166.
98 -
167.
0816
7.08
- 16
7.18
167.
18 -
167.
28Br
idge
-
168.
23 -
168.
3316
8.33
- 16
8.34
Brid
ge -
169.
28 -
169.
3816
9.38
- 16
9.48
169.
48 -
169.
5816
9.58
- 16
9.68
169.
68 -
169.
78
02468
10121416182022242628303234
Num
ber o
f Cra
cked
Pan
els
Mile Post
Northbound Lane 1 Cracked Panels MP 160.41 to MP 169.78
# of Panels w/ 4+ Cracks# of Panels w/ 2-3 Cracks# of Panels w/ 1 CrackTotal # of Cracked Panels
169.
78 -
169.
88
169.
88 -
169.
98
169.
98 -
170.
08
170.
08 -
170.
18
170.
18 -
170.
25Br
idge
-
172.
49 -
172.
59
172.
59 -
172.
69Br
idge
-
172.
89 -
172.
99
172.
99 -
173.
0917
3.09
- 17
3.19
173.
19 -
173.
2917
3.29
- 17
3.39
173.
39 -
173.
4917
3.49
- 17
3.59
173.
59 -
173.
6917
3.69
- 17
3.79
173.
79 -
173.
8917
3.89
- 17
3.99
173.
99 -
174.
0917
4.09
- 17
4.14
174.
14 -
174.
2417
4.24
- 17
4.34
174.
34 -
174.
4417
4.44
- 17
4.54
174.
54 -
174.
6417
4.64
- 17
4.74
174.
74 -
174.
8417
4.84
- 17
4.94
174.
94 -
175.
0417
5.04
- 17
5.11
Brid
ge -
175.
24 -
175.
3417
5.34
- 17
5.44
Brid
ge -
175.
64 -
175.
7417
5.74
- 17
5.79
02468
10121416182022242628303234
Num
ber o
f Cra
cked
Pan
els
Mile Post
Northbound Lane 1 Cracked Panels MP 169.88 to MP 175.79
# of Panels w/ 4+ Cracks# of Panels w/ 2-3 # of Panels w/ 1 CrackTotal # of Cracked Panels
K-4

Northbound Lane 2 Cracked Panel Plots
02468
10121416182022242628303234
Num
ber o
f Cra
cked
Pan
els
Mile Post
Northbould Lane 2 Cracked Panels MP 139.50 to MP 143.72
# of Panels w/ 4+ Cracks# of Panels w/ 2-3 Cracks# of Panels w/ 1 CrackTotal # of Cracked Panels
02468
10121416182022242628303234
Num
ber o
f Cra
cked
Pan
els
Mile Post
Northbound Lane 2 Cracked Panels MP 143.72 to MP 148.17
# of Panels w/ 4+ Cracks# of Panels w/ 2-3 Cracks# of Panels w/ 1 CrackTotal # of Cracked Panels
K-5

148.
17 -
148.
27
148.
27 -
148.
37
148.
37 -
148.
47
148.
47 -
148.
57
148.
57 -
148.
67
148.
67 -
148.
77
148.
77 -
148.
87
148.
87 -
148.
97
148.
97 -
149.
07Br
idge
-
149.
22 -
149.
32
149.
32 -
149.
42
149.
42 -
149.
52
149.
52 -
149.
62
149.
62 -
149.
72
149.
72 -
149.
8214
9.82
- 14
9.92
149.
92 -
150.
02
150.
02 -
150.
12
150.
12 -
150.
2215
0.22
- 15
0.32
150.
32 -
150.
4215
0.42
- 15
0.52
150.
52 -
150.
6215
0.62
- 15
0.72
150.
72 -
150.
8215
0.82
- 15
0.92
150.
92 -
151.
0215
1.02
- 15
1.12
151.
12 -
151.
2215
1.22
- 15
1.23
151.
23 -
151.
3315
1.33
- 15
1.43
151.
43 -
151.
5315
1.53
- 15
1.63
151.
63 -
151.
7315
1.73
- 15
1.83
151.
83 -
151.
9315
1.93
- 15
2.03
152.
03 -
152.
1315
2.13
- 15
2.23
02468
10121416182022242628303234
Num
ber o
f Cra
cked
Pan
els
Mile Post
Northbound Lane 2 Cracked Panels MP 148.17 to MP 152.23
# of Panels w/ 4+ Cracks# of Panels w/ 2-3 Cracks# of Panels w/ 1 CrackTotal # of Cracked Panels
02468
10121416182022242628303234
Num
ber o
f Cra
cked
Pan
els
Mile Post
Northbound Lane 2 Cracked Panels MP 152.39 to MP 160.51
# of Panels w/ 4+ Cracks# of Panels w/ 2-3 Cracks# of Panels w/ 1CrackTotal # of Cracked Panels
K-6

160.
51 -
160.
61
160.
61 -
160.
71
160.
71 -
160.
75
160.
75 -
160.
85
160.
85 -
160.
95
160.
95 -
161.
05
161.
05 -
161.
15
161.
15 -
161.
25
161.
25 -
161.
35
161.
35 -
161.
45
161.
45 -
161.
55
161.
55 -
161.
65Br
idge
-
161.
78 -
161.
88
161.
88 -
161.
98
161.
98 -
161.
9916
2 - 1
62.1
Brid
ge -
162.
4 - 1
62.5
162.
5 - 1
62.6
162.
6 - 1
62.7
162.
7 - 1
62.8
162.
8 - 1
62.8
2Br
idge
-
164.
47 -
164.
57Br
idge
-
164.
67 -
164.
7716
4.77
- 16
4.8
164.
95 -
165.
0516
5.05
- 16
5.15
165.
15 -
165.
25Br
idge
-
166.
31 -
166.
4116
6.41
- 16
6.51
166.
51 -
166.
6116
6.61
- 16
6.71
166.
71 -
166.
8116
6.81
- 16
6.91
166.
98 -
167.
0816
7.08
- 16
7.18
167.
18 -
167.
28
02468
10121416182022242628303234
Num
ber o
f Cra
cked
Pan
els
Mile Post
Northbound Lane 2 Cracked Panels MP 160.51 to MP 167.28
# of Panels w/ 4+ Cracks# of Panels w/ 2-3 Cracks# of Panels w/ 1 CrackTotal # of Cracked Panels
02468
10121416182022242628303234
Num
ber o
f Cra
cked
Pan
els
Mile Post
Northbound Lane 2 Cracked Panels MP 167.77 to MP 173.19
# of Panels w/ 4+ Cracks# of Panels w/ 2-3 Cracks# of Panels w/ 1 CrackTotal # of Cracked Panels
K-7

02468
10121416182022242628303234
Num
ber o
f Cra
cked
Pan
els
Mile Post
Northbound Lane 2 Cracked Panels MP 173.19 to MP 177.75
# of Panels w/ 4+ Cracks# of Panels w/ 2-3 Cracks# of Panels w/ 1 CrackTotal # of Cracked Panels
Northbound Lane 3 Cracked Panel Plots
02468
10121416182022242628303234
Num
ber o
f Cra
cked
Pan
els
Mile Post
Northbound Lane 3 Cracked Panels 3 MP 139.50 to MP 143.82
# of Panels w/ 4+ Cracks# of Panels w/ 2-3 Cracks# of Panels w/ 1 CrackTotal # of Cracked Panels
K-8

02468
10121416182022242628303234
Num
ber o
f Cra
cked
Pan
els
Mile Post
Northbound Lane 3 Cracked Panels MP 143.82 to MP 148.27
# of Panels w/ 4+ Cracks# of Panels w/ 2-3 Cracks# of Panels w/ 1 CrackTotal # of Cracked Panels
02468
10121416182022242628303234
Num
ber o
f Cra
cked
Pan
els
Mile Post
Northbound Lane 3 Cracked Panels MP 148.27 to MP 152.69
# of Panels w/ 4+ Cracks# of Panels w/ 2-3 Cracks# of Panels w/ 1 CrackTotal # of Cracked Panels
K-9

02468
10121416182022242628303234
Num
ber o
f Cra
cked
Pan
els
Mile Post
Northbound Lane 3 Cracked Panels MP 152.69 to MP 161.05
# of Panels w/ 4+ Cracks# of Panels w/ 2-3 Cracks# of Panels w/ 1 CrackTotal # of Cracked Panels
02468
10121416182022242628303234
Num
ber o
f Cra
cked
Pan
els
Mile Post
Northbound Lane 3 Cracked Panels MP 161.05 to MP 169.48
# of Panels w/ 4+ Cracks# of Panels w/ 2-3 Cracks# of Panels w/ 1 CrackTotal # of Cracked Panels
K-10

02468
10121416182022242628303234
Num
ber o
f Cra
cked
Pan
els
Mile Post
Northbound Lane 3 Cracked Panels MP 169.48 to MP 174.14
# of Panels w/ 4+ Cracks# of Panels w/ 2-3 Cracks# of Panels w/ 1 CrackTotal # of Cracked Panels
02468
10121416182022242628303234
Num
ber o
f Cra
cked
Pan
els
Mile Post
Northbound Lane 3 Cracked Panels MP 174.14 to MP 177.70
# of Panels w/ 4+ Cracks# of Panels w/ 2-3 Cracks# of Panels w/ 1 CrackTotal # of Cracked Panels
K-11

Northbound Lane 4 Cracked Panel Plots
02468
10121416182022242628303234
Num
ber o
f Cra
cked
Pan
els
Mile Post
Northbound Lane 4 Cracked Panels MP 139.50 to MP 143.62
# of Panels w/ 4+ Cracks# of Panels w/ 2-3 Cracks# of Panels w/ 1 CrackTotal # of Cracked Panels
02468
10121416182022242628303234
Num
ber o
f Cra
cked
Pan
els
Mile Post
Northbound Lane 4 Cracked Panels MP 143.62 to MP 147.87
# of Panels w/ 4+ Cracks# of Panels w/ 2-3 Cracks# of Panels w/ 1 CrackTotal # of Cracked Panels
K-12

02468
10121416182022242628303234
Num
ber o
f Cra
cked
Pan
els
Mile Post
Northbound Lane 4 Cracked Panels MP 147.87 to MP 151.97
# of Panels w/ 4+ Cracks# of Panels w/ 2-3 Cracks# of Panels w/ 1 CrackTotal # of Cracked Panels
02468
10121416182022242628303234
Num
ber o
f Cra
cked
Pan
els
Mile Post
Northbound Lane 4 Cracked Panels MP 151.99 to MP 160.01
# of Panels w/ 4+ Cracks# of Panels w/ 2-3 Caacks# of Panels w/ 1 CrackTotal # of Cracked Panels
K-13

02468
10121416182022242628303234
Num
ber o
f Cra
cked
Pan
els
Mile Post
Northbound Lane 4 Cracked Panels MP 160.01 to MP 166.41
# of Panels w/ 4+ Cracks# of Panels w/ 2-3 Cracks# of Panels w/ 1 CrackTotal # of Cracked Panels
02468
10121416182022242628303234
Num
ber o
f Cra
cked
Pan
els
Mile Post
Northbound Lane 4 Cracked Panels MP 166.41 to MP 172.50
# of Panels w/ 4+ Cracks# of Panels w/ 2-3 Cracks# of Panels w/ 1 CrackTotal # of Cracked Panels
K-14

02468
10121416182022242628303234
Num
ber o
f Cra
cked
Pan
els
Mile Post
Northbound Lane 4 Cracked Panels MP 172.50 to MP 177.75
# of Panels w/ 4+ Cracks# of Panels w/ 2-3 Cracks# of Panels w/ 1 CrackTotal # of Cracked Panels
Southbound Lane 1 Cracked Panel Plots
02468
10121416182022242628303234
Num
ber o
f Cra
cked
Pan
els
Mile Post
Southbound Lane 1 Cracked Panels MP 139.50 to MP 143.29
# of Panels w/ 4+ Cracks# of Panels w/ 2-3 Cracks# of Panels w/ 1 CrackTotal # of Cracked Panels
K-15

02468
10121416182022242628303234
Num
ber o
f Cra
cked
Pan
els
Mile Post
Southbound Lane 1 Cracked Panels MP 143.29 to MP 150.94
# of Panels w/ 4+ Cracks# of Panels w/ 2-3 Cracks# of Panels w/ 1 CrackTotal # of Cracked Panels
02468
10121416182022242628303234
Num
ber o
f Cra
cked
Pan
els
Mile Post
Southbound Lane 1 Cracked Panels MP 150.94 to MP 158.96
# of Panels w/ 4+ Cracks# of Panels w/ 2-3 Cracks# of Panels w/ 1 CrackTotal # of Cracked Panels
K-16

02468
10121416182022242628303234
Num
ber o
f Cra
cked
Pan
els
Mile Post
Southbound Lane 1 Cracked Panels MP 158.98 to MP 166.06
# of Panels w/ 4+ Cracks# of Panels w/ 2-3# of Panels w/ 1 CrackTotal # of Cracked Panels
02468
10121416182022242628303234
Num
ber o
f Cra
cked
Pan
els
Mile Post
Southbound Lane 1 Cracked Panels MP 166.06 to MP 174.14
# of Panels w/ 4+ Cracks# of Panels w/ 2-3 Cracks# of Panels w/ 1 CrackTotal # of Cracked Panels
K-17

Southbound Lane 2 Cracked Panel Plots
02468
10121416182022242628303234
Num
ber o
f Cra
cked
Pan
els
Mile Post
Southbound Lane 2 Cracked Panels MP 139.50 to MP 143.69
# of Panels w/ 4+ Cracks# of Panels w/ 2-3 Cracks# of Panels w/ 1 CrackTotal # of Cracked Panels
02468
10121416182022242628303234
Num
ber o
f Cra
cked
Pan
els
Mile Post
Southbound Lane 2 Cracked Panels MP 143.69 to MP 151.64
# of Panels w/ 4+ Cracks# of Panels w/ 2-3 Cracks# of Panels w/ 1 CrackTotal # of Cracked Panels
K-18

02468
10121416182022242628303234
Num
ber o
f Cra
cked
Pan
el
Mile Post
Southbound Lane 2 Cracked Panels MP 151.64 to MP 159.95
# of Panels w/ 4+ Cracks# of Panels w/ 2-3 Cracks# of Panels w/ 1 CrackTotal # of Cracked Panels
02468
10121416182022242628303234
Num
ber o
f Cra
cked
Pan
els
Mile Post
Southbound Lane 2 Cracked Panels MP 160.25 to MP 169.25
# of Panels w/ 4+ Cracks# of Panels w/ 2-3 Cracks# of Panels w/ 1 CrackTotal # of Cracked Panels
K-19
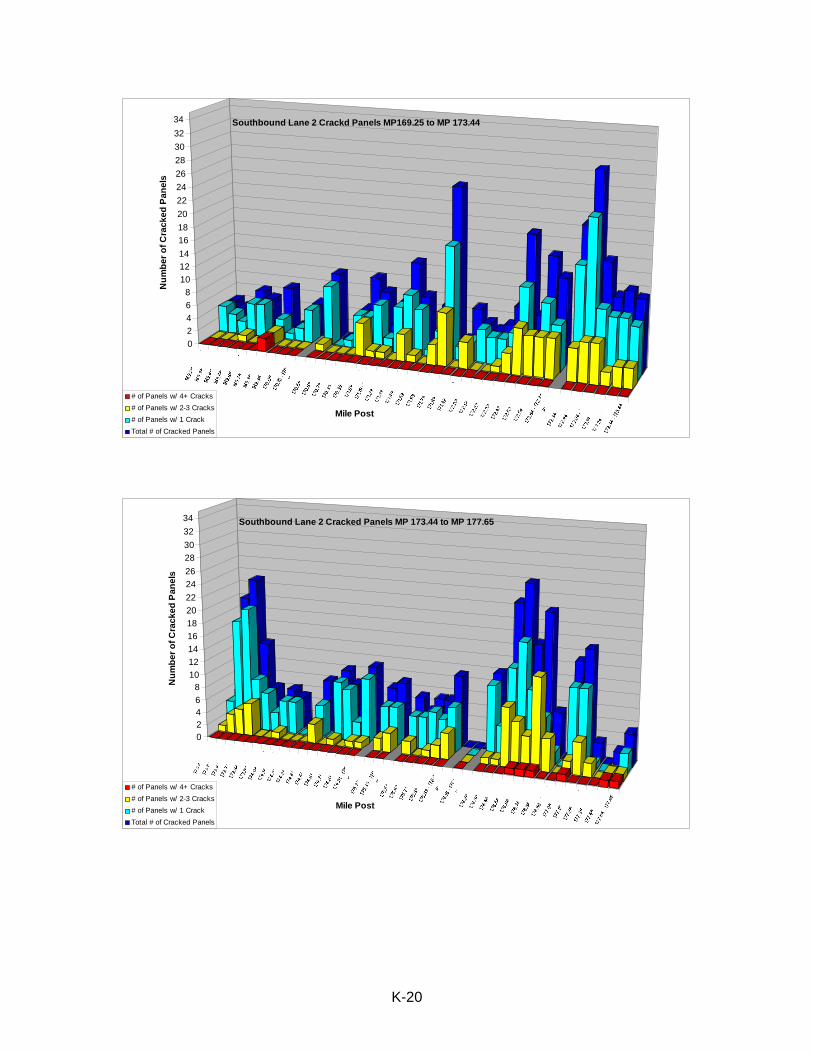
02468
10121416182022242628303234
Num
ber o
f Cra
cked
Pan
els
Mile Post
Southbound Lane 2 Crackd Panels MP169.25 to MP 173.44
# of Panels w/ 4+ Cracks# of Panels w/ 2-3 Cracks# of Panels w/ 1 CrackTotal # of Cracked Panels
02468
10121416182022242628303234
Num
ber o
f Cra
cked
Pan
els
Mile Post
Southbound Lane 2 Cracked Panels MP 173.44 to MP 177.65
# of Panels w/ 4+ Cracks# of Panels w/ 2-3 Cracks# of Panels w/ 1 CrackTotal # of Cracked Panels
K-20

Southbound Lane 3 Cracked Panel Plots
02468
10121416182022242628303234
Num
ber o
f Cra
cked
Pan
els
Mile Post
Southbound Lane 3 Cracked Panels MP 139.50 to MP 143.69
# of Panels w/ 4+ Cracks# of Panels w/ 2-3 Cracks# of Panels w/ 1 CrackTotal # of Cracked Panels
02468
10121416182022242628303234
Num
ber o
f Cra
cked
Pan
els
Mile Post
Southbound Lane 3 Cracked Panels MP 143.69 to MP 151.74
# of Panels w/ 4+ Cracks# of Panels w/ 2-3 Cracks# of Panels w/ 1 CrackTotal # of Cracked Panels
K-21

02468
10121416182022242628303234
Num
ber o
f Cra
cked
Pan
els
Mile Post
Southbound Lane 3 Cracked Panels MP 151.74 to MP 161.14
# of Panels w/ 4+ Cracks# of Panels w/ 2-3 Cracks# of Panels w/ 1 CrackTotal # of Cracked Panels
02468
10121416182022242628303234
Num
ber o
f Cra
cked
Pan
els
Mile Post
Southbound Lane 3 Cracked Panels MP 161.24 to MP 169.25
# of Panels w/ 4+ Cracks# of Panels w/ 2-3 Cracks# of Panels w/ 1 CrackTotal # of Cracked Panels
K-22

02468
10121416182022242628303234
Num
ber o
f Cra
cked
Pan
els
Mile Post
Southbound Lane 3 Cracked Panels MP 169.25 to MP 173.54
# of Panels w/ 4+ Cracks# of Panels w/ 2-3 Cracks# of Panels w/ 1 CrackTotal # of Cracked Panels
02468
10121416182022242628303234
Num
ber o
f Cra
cked
Pan
els
Mile Post
Southbound Lane 3 Cracked Panels MP 173.54 to MP 177.65
# of Panels w/ 4+ Cracks# of Panels w/ 2-3 Cracks# of Panels w/ 1 CrackTotal # of Cracked Panels
K-23

Southbound Lane 4 Cracked Panel Plots
02468
10121416182022242628303234
Num
ber o
f Cra
cked
Pan
els
Mile Post
Southboud Lane 4 Cracked Panels MP 139.50 to MP 143.49
# of Panels w/ 4+ Cracks# of Panels w/ 2-3 Cracks# of Panels w/ 1 CrackTotal # of Cracked Panels
02468
10121416182022242628303234
Num
ber o
f Cra
cked
Pan
els
Mile Post
Southbound Lane 4 Cracked Panels MP 143.49 to MP 151.34
# of Panels w/ 4+ Cracks# of Panels w/ 2-3 Cracks# of Panels w/ 1 CrackTotal # of Cracked Panels
K-24

02468
10121416182022242628303234
Num
ber o
f Cra
cked
Pan
els
Mile Post
Southbound Lane 4 Cracked Panels MP 151.34 to MP 159.57
# of Panels w/ 4+ Cracks# of Panels w/ 2-3 Cracks# of Panels w/ 1 CrackTotal # of Cracked Panels
02468
10121416182022242628303234
Num
ber o
f Cra
cked
Pan
els
Mile Post
Southbound Lane 4 Cracked Panels MP 159.71 to MP 165.68
# of Panels w/ 4+ Cracks# of Panels w/ 2-3 Cracks# of Panels w/ 1 CrackTotal # of Cracked Panels
K-25

02468
10121416182022242628303234
Num
ber o
f Cra
cked
Pan
els
Mile Post
Southbound Lane 4 Cracked Panels MP 165.68 to MP 171.92
# of Panels w/ 4+ Cracks# of Panels w/ 2-3 Cracks# of Panels w/ 1 CrackTotal # of Cracked Panels
02468
10121416182022242628303234
Num
ber o
f Cra
cked
Pan
els
Mile Post
Southbound Lane 4 Cracked Panels MP 171.92 to MP 175.93
# of Panels w/ 4+ Cracks# of Panels w/ 2-3 Cracks# of Panels w/ 1 CrackTotal # of Cracked Panels
K-26

02468
10121416182022242628303234
Num
ber o
f Cra
cked
Pan
els
Mile Post
Southbound Lane 4 Cracked Panels MP 175.93 to MP 177.65
# of Panels w/ 4+ Cracks# of Panels w/ 2-3 Cracks"# of Panels w/ 1 CrackTotal # of Cracked Panels
K-27

Appendix L – Percentage of Cracked Panels Distress Plots
L-1

Northbound Lane 1 Percentage of Cracked Panel Plots
0
10
20
30
40
50
60
70
80
90
100
Perc
enta
ge o
f Cra
cked
Pan
els
139.
5 - 1
39.6
139.
6 - 1
39.7
139.
7 - 1
39.8
139.
8 - 1
39.9
139.
9 - 1
4014
0 - 1
40.1
140.
2 - 1
40.3
140.
3 - 1
40.4
140.
4 - 1
40.5
140.
5 - 1
40.6
140.
6 - 1
40.7
140.
7 - 1
40.8
140.
8 - 1
40.9
140.
9 - 1
4114
1 - 1
41.1
141.
1 - 1
41.2
141.
3 - 1
41.4
141.
4 - 1
41.5
141.
5 - 1
41.6
141.
7 - 1
41.8
141.
8 - 1
41.9
141.
9 - 1
4214
2.04
- 14
2.14
142.
14 -
142.
2414
2.24
- 14
2.34
142.
34 -
142.
4414
2.44
- 14
2.54
142.
54 -
142.
6414
2.64
- 14
2.74
142.
92 -
143.
0214
3.02
- 14
3.12
143.
12 -
143.
2214
3.22
- 14
3.32
143.
32 -
143.
4214
3.42
- 14
3.52
143.
52 -
143.
6214
3.62
- 14
3.72
143.
72 -
143.
8214
3.82
- 14
3.92
Mile Post
Northtbound Lane 1 Percentage of Cracked Panels MP 139.5 to MP 144.02
0
10
20
30
40
50
60
70
80
90
100
Perc
enta
ge o
f Cra
cked
Pan
els
143.
92 -
144.
0214
4.02
- 14
4.12
144.
12 -
144.
1914
4.19
- 14
4.29
144.
29 -
144.
3914
4.39
- 14
4.49
144.
49 -
144.
59Br
idge
-
144.
79 -
144.
8914
4.89
- 14
4.99
144.
99 -
145.
0914
5.09
- 14
5.19
145.
19 -
145.
2914
5.29
- 14
5.39
145.
39 -
145.
4914
5.49
- 14
5.59
145.
59 -
145.
69Br
idge
-
145.
89 -
145.
9914
5.99
- 14
6.09
146.
09 -
146.
1914
6.19
- 14
6.29
146.
29 -
146.
3314
6.33
- 14
6.43
Brid
ge -
146.
53 -
146.
6314
6.63
- 14
6.73
Brid
ge -
146.
93 -
147.
0314
7.03
- 14
7.13
147.
13 -
147.
2314
7.23
- 14
7.33
147.
33 -
147.
4314
7.43
- 14
7.53
147.
53 -
147.
6314
7.63
- 14
7.64
147.
67 -
147.
7714
7.77
- 14
7.87
147.
87 -
147.
9714
7.97
- 14
8.07
148.
07 -
148.
17
Mile Post
Northbound Lane 1 Percentage of Cracked Panels MP 143.92 to MP 148.17
L-2

0
10
20
30
40
50
60
70
80
90
100
Perc
enta
ge o
f Cra
cked
Pan
els
148.
17 -
148.
2714
8.27
- 14
8.37
148.
37 -
148.
4714
8.47
- 14
8.57
148.
57 -
148.
6714
8.67
- 14
8.77
148.
77 -
148.
8714
8.87
- 14
8.97
148.
97 -
149.
07Br
idge
-
149.
22 -
149.
3214
9.32
- 14
9.42
149.
42 -
149.
5214
9.52
- 14
9.62
149.
62 -
149.
7214
9.72
- 14
9.82
149.
82 -
149.
9214
9.92
- 15
0.02
150.
02 -
150.
1215
0.12
- 15
0.22
150.
22 -
150.
3215
0.32
- 15
0.42
150.
42 -
150.
5215
0.52
- 15
0.62
150.
62 -
150.
7215
0.72
- 15
0.82
150.
82 -
150.
9215
0.92
- 15
1.02
151.
02 -
151.
1215
1.12
- 15
1.22
151.
22 -
151.
2315
1.23
- 15
1.33
151.
33 -
151.
4315
1.43
- 15
1.53
151.
53 -
151.
6315
1.63
- 15
1.73
151.
73 -
151.
8315
1.83
- 15
1.93
151.
93 -
152.
0315
2.03
- 15
2.13
Mile Post
Northbound Lane 1 Percentage of Cracked Panels MP 148.17 to MP 152.13
0
10
20
30
40
50
60
70
80
90
100
Perc
enta
ge o
f Cra
cked
Pan
els
152.
13 -
152.
23Br
idge
-
152.
39 -
152.
4915
2.49
- 15
2.59
152.
59 -
152.
6915
2.69
- 15
2.79
152.
79 -
152.
8915
2.89
- 15
2.99
152.
99 -
153.
0915
3.09
- 15
3.19
153.
19 -
153.
215
3.2
- 153
.315
3.3
- 153
.415
3.4
- 153
.515
3.5
- 153
.6Br
idge
- 15
3.8
- 153
.915
3.9
- 154
154
- 154
.115
4.1
- 154
.14
Diam
ond
Gro
und
-
158.
51 -
158.
6115
8.61
- 15
8.71
158.
71 -
158.
8115
8.81
- 15
8.91
158.
91 -
159.
0115
9.01
- 15
9.1
159.
1 - 1
59.2
159.
2 - 1
59.3
159.
3 - 1
59.4
159.
4 - 1
59.5
159.
5 - 1
59.6
Brid
ge -
159.
71 -
159.
8115
9.81
- 15
9.91
159.
91 -
160.
0116
0.01
- 16
0.11
160.
11 -
160.
2116
0.21
- 16
0.31
160.
31 -
160.
41
Mile Post
Northbound Lane 1 Percentage of Cracked Panels MP 152.13 to MP 160.41
L-3

0
10
20
30
40
50
60
70
80
90
100
Perc
enta
ge o
f Cra
cked
Pan
els
160.
41 -
160.
5116
0.51
- 16
0.61
160.
61 -
160.
7116
0.71
- 16
0.75
160.
75 -
160.
8516
0.85
- 16
0.95
160.
95 -
161.
0516
1.05
- 16
1.15
161.
15 -
161.
2516
1.25
- 16
1.35
161.
35 -
161.
4516
1.45
- 16
1.55
Brid
ge -
161.
78 -
161.
8816
1.88
- 16
1.98
161.
98 -
162.
0816
2.08
- 16
2.18
Brid
ge -
162.
36 -
162.
4616
2.46
- 16
2.56
162.
56 -
162.
5716
6.21
- 16
6.31
166.
31 -
166.
4116
6.41
- 16
6.51
166.
51 -
166.
6116
6.61
- 16
6.71
166.
71 -
166.
8116
6.81
- 16
6.91
166.
98 -
167.
0816
7.08
- 16
7.18
167.
18 -
167.
28Br
idge
-
168.
23 -
168.
3316
8.33
- 16
8.34
Brid
ge -
169.
28 -
169.
3816
9.38
- 16
9.48
169.
48 -
169.
5816
9.58
- 16
9.68
169.
68 -
169.
78
Mile Post
Northbound Lane 1 Percentage of Cracked Panels MP 160.41 to MP 169.78
0
10
20
30
40
50
60
70
80
90
100
Perc
enta
ge o
f Cra
cked
Pan
els
169.
78 -
169.
8816
9.88
- 16
9.98
169.
98 -
170.
0817
0.08
- 17
0.18
170.
18 -
170.
25Br
idge
- 17
2.49
- 17
2.59
172.
59 -
172.
69Br
idge
- 17
2.89
- 17
2.99
172.
99 -
173.
0917
3.09
- 17
3.19
173.
19 -
173.
2917
3.29
- 17
3.39
173.
39 -
173.
4917
3.49
- 17
3.59
173.
59 -
173.
6917
3.69
- 17
3.79
173.
79 -
173.
8917
3.89
- 17
3.99
173.
99 -
174.
0917
4.09
- 17
4.14
174.
14 -
174.
2417
4.24
- 17
4.34
174.
34 -
174.
4417
4.44
- 17
4.54
174.
54 -
174.
6417
4.64
- 17
4.74
174.
74 -
174.
8417
4.84
- 17
4.94
174.
94 -
175.
0417
5.04
- 17
5.11
Brid
ge -
175.
24 -
175.
3417
5.34
- 17
5.44
Brid
ge -
175.
64 -
175.
7417
5.74
- 17
5.79
Mile Post
Northbound Lane 1 Percentage of Cracked Panels MP 169.78 to MP 175.79
L-4

Northbound Lane 2 Percentage of Cracked Panel Plots
0
10
20
30
40
50
60
70
80
90
100
Perc
enta
ge o
f Cra
cked
Pan
els
139.
5 - 1
39.6
139.
6 - 1
39.7
139.
7 - 1
39.8
139.
8 - 1
39.9
139.
9 - 1
4014
0 - 1
40.1
140.
1 - 1
40.2
140.
2 - 1
40.3
140.
3 - 1
40.4
140.
4 - 1
40.5
140.
5 - 1
40.6
140.
6 - 1
40.7
140.
7 - 1
40.8
140.
8 - 1
40.9
140.
9 - 1
4114
1 - 1
41.1
141.
1 - 1
41.2
141.
2 - 1
41.3
141.
3 - 1
41.4
141.
4 - 1
41.5
141.
5 - 1
41.6
141.
6 - 1
41.7
141.
7 - 1
41.8
141.
8 - 1
41.9
141.
9 - 1
4214
2.04
- 14
2.14
142.
14 -
142.
2414
2.24
- 14
2.34
142.
34 -
142.
4414
2.44
- 14
2.54
142.
54 -
142.
6414
2.64
- 14
2.74
142.
74 -
142.
7914
2.82
- 14
2.92
142.
92 -
143.
0214
3.02
- 14
3.12
143.
12 -
143.
2214
3.22
- 14
3.32
143.
32 -
143.
4214
3.42
- 14
3.52
143.
52 -
143.
6214
3.62
- 14
3.72
Mile Post
Northbound Lane 2 Percentage of Cracked Panels MP 139.5 to MP 143.72
0
10
20
30
40
50
60
70
80
90
100
Perc
enta
ge o
f Cra
cked
Pan
els
143.
72 -
143.
8214
3.92
- 14
4.02
144.
12 -
144.
1914
4.29
- 14
4.39
144.
49 -
144.
5914
4.79
- 14
4.89
144.
99 -
145.
0914
5.19
- 14
5.29
145.
39 -
145.
4914
5.59
- 14
5.69
145.
89 -
145.
9914
6.09
- 14
6.19
146.
29 -
146.
33Br
idge
- 14
6.63
- 14
6.73
146.
93 -
147.
0314
7.13
- 14
7.23
147.
33 -
147.
4314
7.53
- 14
7.63
147.
77 -
147.
8714
7.97
- 14
8.07
Mile Post
Northbound Lane 2 Percentage of Cracked Panels MP 143.72 to MP 148.17
L-5

0
10
20
30
40
50
60
70
80
90
100
Perc
enta
ge o
f Cra
cked
Pan
els
148.
17 -
148.
2714
8.27
- 14
8.37
148.
37 -
148.
4714
8.47
- 14
8.57
148.
57 -
148.
6714
8.67
- 14
8.77
148.
77 -
148.
8714
8.87
- 14
8.97
148.
97 -
149.
07Br
idge
-
149.
22 -
149.
3214
9.32
- 14
9.42
149.
42 -
149.
5214
9.52
- 14
9.62
149.
62 -
149.
7214
9.72
- 14
9.82
149.
82 -
149.
9214
9.92
- 15
0.02
150.
02 -
150.
1215
0.12
- 15
0.22
150.
22 -
150.
3215
0.32
- 15
0.42
150.
42 -
150.
5215
0.52
- 15
0.62
150.
62 -
150.
7215
0.72
- 15
0.82
150.
82 -
150.
9215
0.92
- 15
1.02
151.
02 -
151.
1215
1.12
- 15
1.22
151.
22 -
151.
2315
1.23
- 15
1.33
151.
33 -
151.
4315
1.43
- 15
1.53
151.
53 -
151.
6315
1.63
- 15
1.73
151.
73 -
151.
8315
1.83
- 15
1.93
151.
93 -
152.
0315
2.03
- 15
2.13
152.
13 -
152.
23
Mile Post
Northbound Lane 2 Percentage of Cracked Panels MP 148.17 to MP 152.23
0
10
20
30
40
50
60
70
80
90
100
Perc
enta
ge o
f Cra
cked
Pan
els
152.
39 -
152.
4915
2.49
- 15
2.59
152.
59 -
152.
6915
2.69
- 15
2.79
152.
79 -
152.
8915
2.89
- 15
2.99
152.
99 -
153.
0915
3.09
- 15
3.19
153.
19 -
153.
215
3.2
- 153
.315
3.3
- 153
.415
3.4
- 153
.515
3.5
- 153
.615
3.6
- 153
.715
3.7
- 153
.815
3.8
- 153
.915
3.9
- 154
154
- 154
.115
4.1
- 154
.14
Diam
ond
Gro
und
-
158.
31 -
158.
41Br
idge
-
158.
51 -
158.
6115
8.61
- 15
8.71
158.
71 -
158.
8115
8.81
- 15
8.91
158.
91 -
159.
0115
9.01
- 15
9.1
159.
1 - 1
59.2
159.
2 - 1
59.3
159.
3 - 1
59.4
159.
4 - 1
59.5
159.
5 - 1
59.6
159.
6 - 1
59.6
715
9.71
- 15
9.81
159.
81 -
159.
9115
9.91
- 16
0.01
160.
01 -
160.
1116
0.11
- 16
0.21
160.
21 -
160.
3116
0.31
- 16
0.41
160.
41 -
160.
51
Mile Post
Northbound Lane 2 Percentage of Cracked Panels MP 152.39 to MP 160.51
L-6

0
10
20
30
40
50
60
70
80
90
100
Perc
enta
ge o
f Cra
cked
Pan
els
160.
51 -
160.
6116
0.61
- 16
0.71
160.
71 -
160.
7516
0.75
- 16
0.85
160.
85 -
160.
9516
0.95
- 16
1.05
161.
05 -
161.
1516
1.15
- 16
1.25
161.
25 -
161.
3516
1.35
- 16
1.45
161.
45 -
161.
5516
1.55
- 16
1.65
Brid
ge -
161.
78 -
161.
8816
1.88
- 16
1.98
161.
98 -
161.
9916
2 - 1
62.1
Brid
ge -
162.
4 - 1
62.5
162.
5 - 1
62.6
162.
6 - 1
62.7
162.
7 - 1
62.8
162.
8 - 1
62.8
2Br
idge
-
164.
47 -
164.
57Br
idge
-
164.
67 -
164.
7716
4.77
- 16
4.8
164.
95 -
165.
0516
5.05
- 16
5.15
165.
15 -
165.
25Br
idge
-
166.
31 -
166.
4116
6.41
- 16
6.51
166.
51 -
166.
6116
6.61
- 16
6.71
166.
71 -
166.
8116
6.81
- 16
6.91
166.
98 -
167.
0816
7.08
- 16
7.18
167.
18 -
167.
28
Mile Post
Northbound Lane 2 Percentage of Cracked Panels MP 160.51 to MP 167.28
0
10
20
30
40
50
60
70
80
90
100
Perc
enta
ge o
f Cra
cked
Pan
els
167.
77 -
167.
8716
7.87
- 16
7.97
167.
97 -
168.
0716
8.07
- 16
8.17
168.
17 -
168.
27Br
idge
-
169.
28 -
169.
3816
9.38
- 16
9.48
169.
48 -
169.
5816
9.58
- 16
9.68
169.
68 -
169.
7816
9.78
- 16
9.88
169.
88 -
169.
9816
9.98
- 17
0.08
170.
08 -
170.
18Br
idge
- 17
0.6
- 170
.717
0.7
- 170
.817
0.8
- 170
.917
0.9
- 171
171
- 171
.117
1.1
- 171
.217
1.2
- 171
.317
1.3
- 171
.417
1.4
- 171
.517
1.5
- 171
.617
1.6
- 171
.717
1.7
- 171
.817
1.8
- 171
.917
1.9
- 172
172
- 172
.117
2.1
- 172
.217
2.2
- 172
.3Br
idge
- 17
2.4
- 172
.517
2.5
- 172
.617
2.6
- 172
.717
2.7
- 172
.76
Brid
ge -
172.
89 -
172.
9917
2.99
- 17
3.09
173.
09 -
173.
19
Mile Post
Northbound Lane 2 Percentage of Cracked Panels MP 167.77 to MP 173.19
L-7

0
10
20
30
40
50
60
70
80
90
100
Perc
enta
ge o
f Cra
cked
Pan
els
167.
77 -
167.
8716
7.87
- 16
7.97
167.
97 -
168.
0716
8.07
- 16
8.17
168.
17 -
168.
27Br
idge
-
169.
28 -
169.
3816
9.38
- 16
9.48
169.
48 -
169.
5816
9.58
- 16
9.68
169.
68 -
169.
7816
9.78
- 16
9.88
169.
88 -
169.
9816
9.98
- 17
0.08
170.
08 -
170.
18Br
idge
- 17
0.6
- 170
.717
0.7
- 170
.817
0.8
- 170
.917
0.9
- 171
171
- 171
.117
1.1
- 171
.217
1.2
- 171
.317
1.3
- 171
.417
1.4
- 171
.517
1.5
- 171
.617
1.6
- 171
.717
1.7
- 171
.817
1.8
- 171
.917
1.9
- 172
172
- 172
.117
2.1
- 172
.217
2.2
- 172
.3Br
idge
- 17
2.4
- 172
.517
2.5
- 172
.617
2.6
- 172
.717
2.7
- 172
.76
Brid
ge -
172.
89 -
172.
9917
2.99
- 17
3.09
173.
09 -
173.
19
Mile Post
Northbound Lane 2 Percentage of Cracked Panels MP 173.19 to MP 177.75
Northbound Lane 3 Percentage of Cracked Panels Plots
0
10
20
30
40
50
60
70
80
90
100
Perc
enta
ge o
f Cra
cked
Pan
els
139.
5 - 1
39.6
139.
6 - 1
39.7
139.
7 - 1
39.8
139.
8 - 1
39.9
139.
9 - 1
4014
0 - 1
40.1
140.
1 - 1
40.2
140.
2 - 1
40.3
140.
3 - 1
40.4
140.
4 - 1
40.5
140.
5 - 1
40.6
140.
6 - 1
40.7
140.
7 - 1
40.8
140.
8 - 1
40.9
140.
9 - 1
4114
1 - 1
41.1
141.
1 - 1
41.2
141.
2 - 1
41.3
141.
3 - 1
41.4
141.
4 - 1
41.5
141.
5 - 1
41.6
141.
6 - 1
41.7
141.
7 - 1
41.8
141.
8 - 1
41.9
141.
9 - 1
4214
2.04
- 14
2.14
142.
14 -
142.
2414
2.24
- 14
2.34
142.
34 -
142.
4414
2.44
- 14
2.54
142.
54 -
142.
6414
2.64
- 14
2.74
142.
74 -
142.
7914
2.82
- 14
2.92
142.
92 -
143.
0214
3.02
- 14
3.12
143.
12 -
143.
2214
3.22
- 14
3.32
143.
32 -
143.
4214
3.42
- 14
3.52
143.
52 -
143.
6214
3.62
- 14
3.72
143.
72 -
143.
82
Mile Post
Northbound Lane 3 Percentage of Cracked Panels MP 139.5 to MP 143.82
L-8

0
10
20
30
40
50
60
70
80
90
100
Perc
enta
ge o
f Cra
cked
Pan
els
143.
82 -
143.
9214
3.92
- 14
4.02
144.
02 -
144.
1214
4.12
- 14
4.19
144.
19 -
144.
2914
4.29
- 14
4.39
144.
39 -
144.
4914
4.49
- 14
4.59
Brid
ge -
144.
79 -
144.
8914
4.89
- 14
4.99
144.
99 -
145.
0914
5.09
- 14
5.19
145.
19 -
145.
2914
5.29
- 14
5.39
145.
39 -
145.
4914
5.49
- 14
5.59
145.
59 -
145.
69Br
idge
-
145.
89 -
145.
9914
5.99
- 14
6.09
146.
09 -
146.
1914
6.19
- 14
6.29
146.
29 -
146.
33Br
idge
-
146.
53 -
146.
6314
6.63
- 14
6.73
Brid
ge -
146.
93 -
147.
0314
7.03
- 14
7.13
147.
13 -
147.
2314
7.23
- 14
7.33
147.
33 -
147.
4314
7.43
- 14
7.53
147.
53 -
147.
6314
7.63
- 14
7.64
Brid
ge -
147.
77 -
147.
8714
7.87
- 14
7.97
147.
97 -
148.
0714
8.07
- 14
8.17
148.
17 -
148.
27
Mile Post
Northbound Lane 3 Percentage of Cracked Panels MP 143.82 to MP 148.27
0
10
20
30
40
50
60
70
80
90
100
Perc
enta
ge o
f Cra
cked
Pan
els
148.
27 -
148.
3714
8.37
- 14
8.47
148.
47 -
148.
5714
8.57
- 14
8.67
148.
67 -
148.
7714
8.77
- 14
8.87
148.
87 -
148.
9714
8.97
- 14
9.07
Brid
ge -
149.
32 -
149.
4214
9.42
- 14
9.52
149.
52 -
149.
6214
9.62
- 14
9.72
149.
72 -
149.
8214
9.82
- 14
9.92
149.
92 -
150.
0215
0.02
- 15
0.12
150.
12 -
150.
2215
0.22
- 15
0.32
150.
32 -
150.
4215
0.42
- 15
0.52
150.
52 -
150.
6215
0.62
- 15
0.72
150.
72 -
150.
8215
0.82
- 15
0.92
150.
92 -
151.
0215
1.02
- 15
1.12
151.
12 -
151.
2215
1.22
- 15
1.23
151.
23 -
151.
3315
1.33
- 15
1.43
151.
43 -
151.
5315
1.53
- 15
1.63
151.
63 -
151.
7315
1.73
- 15
1.83
151.
83 -
151.
9315
1.93
- 15
2.03
152.
03 -
152.
1315
2.13
- 15
2.23
Brid
ge -
152.
39 -
152.
4915
2.49
- 15
2.59
152.
59 -
152.
69
Mile Post
Northbound Lane 3 Percentage of Cracked Panels MP 148.27 to MP 152.69
L-9

0
10
20
30
40
50
60
70
80
90
100
Perc
enta
ge o
f Cra
cked
Pan
els
152.
69 -
152.
7915
2.79
- 15
2.89
152.
89 -
152.
99
152.
99 -
153.
0915
3.09
- 15
3.19
153.
19 -
153.
215
3.2
- 153
.315
3.3
- 153
.415
3.4
- 153
.515
3.5
- 153
.6Br
idge
- 15
3.8
- 153
.915
3.9
- 154
154
- 154
.115
4.1
- 154
.14
Diam
ond
Gro
und
-
158.
31 -
158.
4115
8.41
- 15
8.51
158.
51 -
158.
6115
8.61
- 15
8.71
158.
71 -
158.
81
158.
81 -
158.
9115
8.91
- 15
9.01
159.
01 -
159.
115
9.1
- 159
.215
9.2
- 159
.315
9.3
- 159
.415
9.4
- 159
.515
9.5
- 159
.6Br
idge
-
159.
81 -
159.
91
159.
91 -
160.
0116
0.01
- 16
0.11
160.
11 -
160.
2116
0.21
- 16
0.31
160.
31 -
160.
4116
0.41
- 16
0.51
160.
51 -
160.
6116
0.61
- 16
0.71
160.
71 -
160.
75
160.
75 -
160.
8516
0.85
- 16
0.95
160.
95 -
161.
05
Mile Post
Northbound Lane 3 Percentage of Cracked Panels MP 152.69 to MP 161.05
0
10
20
30
40
50
60
70
80
90
100
Perc
enta
ge o
f Cra
cked
Pan
els
161.
05 -
161.
1516
1.15
- 16
1.25
161.
25 -
161.
3516
1.35
- 16
1.45
161.
45 -
161.
55Br
idge
-
161.
78 -
161.
8816
1.88
- 16
1.98
161.
98 -
162.
0816
2.08
- 16
2.18
162.
18 -
162.
19Br
idge
-
162.
46 -
162.
5616
2.56
- 16
2.66
162.
66 -
162.
76Br
idge
-
164.
37 -
164.
4716
4.47
- 16
4.57
Brid
ge -
164.
67 -
164.
77Br
idge
-
165.
03 -
165.
1316
5.13
- 16
5.23
Brid
ge -
166.
31 -
166.
4116
6.41
- 16
6.51
166.
51 -
166.
6116
6.61
- 16
6.71
166.
71 -
166.
8116
6.81
- 16
6.91
Brid
ge -
167.
08 -
167.
1816
7.18
- 16
7.28
Brid
ge -
167.
77 -
167.
8716
7.87
- 16
7.97
167.
97 -
168.
0716
8.07
- 16
8.17
168.
17 -
168.
2716
8.27
- 16
8.34
Brid
ge -
169.
28 -
169.
3816
9.38
- 16
9.48
Mile Post
Northbound Lane 3 Percentage of Cracked Panels MP 161.05 to MP 169.48
L-10

0
10
20
30
40
50
60
70
80
90
100
Perc
enta
ge o
f Cra
cked
Pan
els
169.
48 -
169.
5816
9.58
- 16
9.68
169.
68 -
169.
7816
9.78
- 16
9.88
169.
88 -
169.
9816
9.98
- 17
0.08
170.
08 -
170.
18Br
idge
- 17
0.6
- 170
.717
0.7
- 170
.817
0.8
- 170
.917
0.9
- 171
171
- 171
.117
1.1
- 171
.217
1.2
- 171
.317
1.3
- 171
.417
1.4
- 171
.517
1.5
- 171
.617
1.6
- 171
.717
1.7
- 171
.817
1.8
- 171
.917
1.9
- 172
172
- 172
.117
2.1
- 172
.217
2.2
- 172
.3Br
idge
- 17
2.4
- 172
.517
2.5
- 172
.617
2.6
- 172
.7Br
idge
-
172.
89 -
172.
9917
2.99
- 17
3.09
173.
09 -
173.
1917
3.19
- 17
3.29
173.
29 -
173.
3917
3.39
- 17
3.49
173.
49 -
173.
5917
3.59
- 17
3.69
173.
69 -
173.
7917
3.79
- 17
3.89
173.
89 -
173.
9917
3.99
- 17
4.09
174.
09 -
174.
14
Mile Post
Northbound Lane 3 Percentage of Cracked Panels MP 169.48 to MP 174.14
0
10
20
30
40
50
60
70
80
90
100
Perc
enta
ge o
f Cra
cked
Pan
els
174.
14 -
174.
2417
4.24
- 17
4.34
174.
34 -
174.
4417
4.44
- 17
4.54
174.
54 -
174.
6417
4.64
- 17
4.74
174.
74 -
174.
8417
4.84
- 17
4.94
174.
94 -
175.
0417
5.04
- 17
5.11
Brid
ge -
175.
24 -
175.
3417
5.34
- 17
5.44
Brid
ge -
175.
54 -
175.
6417
5.64
- 17
5.74
175.
74 -
175.
8417
5.84
- 17
5.94
175.
94 -
176.
0417
6.04
- 17
6.13
Brid
ge -
176.
26 -
176.
3617
6.36
- 17
6.46
176.
46 -
176.
5617
6.56
- 17
6.66
176.
66 -
176.
717
6.7
- 176
.817
6.8
- 176
.917
6.9
- 177
177
- 177
.117
7.1
- 177
.217
7.2
- 177
.317
7.3
- 177
.417
7.4
- 177
.517
7.5
- 177
.617
7.6
- 177
.7
Mile Post
Northbound Lane 3 Percentage of Cracked Panels MP 174.14 to MP 177.7
L-11

Northbound Lane 4 Percentage of Cracked Panels Plots
0
10
20
30
40
50
60
70
80
90
100
Perc
enta
ge o
f Cra
cked
Pan
els
139.
5 - 1
39.6
139.
6 - 1
39.7
139.
7 - 1
39.8
139.
8 - 1
39.9
139.
9 - 1
4014
0 - 1
40.1
140.
1 - 1
40.2
140.
2 - 1
40.3
140.
3 - 1
40.4
140.
4 - 1
40.5
140.
5 - 1
40.6
140.
6 - 1
40.7
140.
7 - 1
40.8
140.
8 - 1
40.9
140.
9 - 1
4114
1 - 1
41.1
141.
1 - 1
41.2
141.
2 - 1
41.3
141.
3 - 1
41.4
141.
4 - 1
41.5
141.
5 - 1
41.6
141.
6 - 1
41.7
141.
7 - 1
41.8
141.
8 - 1
41.9
141.
9 - 1
4214
2.04
- 14
2.14
142.
14 -
142.
2414
2.24
- 14
2.34
142.
34 -
142.
4414
2.44
- 14
2.54
142.
54 -
142.
6414
2.64
- 14
2.74
142.
74 -
142.
7914
2.82
- 14
2.92
142.
92 -
143.
0214
3.02
- 14
3.12
143.
12 -
143.
2214
3.22
- 14
3.32
143.
32 -
143.
4214
3.42
- 14
3.52
143.
52 -
143.
62
Mile Post
Northbound Lane 4 Percentage of Cracked Panels MP 139.5 to MP 143.62
0
10
20
30
40
50
60
70
80
90
100
Perc
enta
ge o
f Cra
cked
Pan
els
143.
62 -
143.
7214
3.72
- 14
3.82
143.
82 -
143.
9214
3.92
- 14
4.02
144.
02 -
144.
1214
4.12
- 14
4.19
144.
19 -
144.
2914
4.29
- 14
4.39
144.
39 -
144.
4914
4.49
- 14
4.59
Brid
ge -
144.
79 -
144.
8914
4.89
- 14
4.99
144.
99 -
145.
0914
5.09
- 14
5.19
145.
19 -
145.
2914
5.29
- 14
5.39
145.
39 -
145.
4914
5.49
- 14
5.59
145.
59 -
145.
69Br
idge
-
145.
89 -
145.
9914
5.99
- 14
6.09
146.
09 -
146.
1914
6.19
- 14
6.29
146.
29 -
146.
33Br
idge
-
146.
53 -
146.
6314
6.63
- 14
6.73
Brid
ge -
146.
93 -
147.
0314
7.03
- 14
7.13
147.
13 -
147.
2314
7.23
- 14
7.33
147.
33 -
147.
4314
7.43
- 14
7.53
147.
53 -
147.
63Br
idge
-
147.
67 -
147.
7714
7.77
- 14
7.87
Mile Post
Northbound Lane 4 Percentage of Cracked Panels MP 143.62 to MP 147.87
L-12

0
10
20
30
40
50
60
70
80
90
100
Perc
enta
ge o
f Cra
cked
Pan
els
147.
87 -
147.
9714
7.97
- 14
8.07
148.
07 -
148.
1714
8.17
- 14
8.27
148.
27 -
148.
3714
8.37
- 14
8.47
148.
47 -
148.
5714
8.57
- 14
8.67
148.
67 -
148.
7714
8.77
- 14
8.87
148.
87 -
148.
9714
8.97
- 14
9.07
Brid
ge -
149.
22 -
149.
3214
9.32
- 14
9.42
149.
42 -
149.
5214
9.52
- 14
9.62
149.
62 -
149.
7214
9.72
- 14
9.82
149.
82 -
149.
9214
9.92
- 15
0.02
150.
02 -
150.
1215
0.12
- 15
0.22
150.
22 -
150.
3215
0.32
- 15
0.42
150.
42 -
150.
5215
0.52
- 15
0.62
150.
62 -
150.
7215
0.72
- 15
0.82
150.
82 -
150.
9215
0.92
- 15
1.02
151.
02 -
151.
1215
1.12
- 15
1.22
151.
22 -
151.
3215
1.32
- 15
1.42
151.
42 -
151.
5215
1.52
- 15
1.62
151.
62 -
151.
7215
1.72
- 15
1.82
151.
82 -
151.
9215
1.92
- 15
1.97
Mile Post
Northbound Lane 4 Percentage of Cracked Panels MP 147.87 to MP 151.97
0
10
20
30
40
50
60
70
80
90
100
Perc
enta
ge o
f Cra
cked
Pan
els
151.
99 -
152.
0915
2.09
- 15
2.19
152.
19 -
152.
2615
2.29
- 15
2.39
152.
39 -
152.
4915
2.49
- 15
2.59
152.
59 -
152.
6915
2.69
- 15
2.79
152.
79 -
152.
8915
2.89
- 15
2.99
152.
99 -
153.
0915
3.09
- 15
3.19
153.
19 -
153.
215
3.2
- 153
.315
3.3
- 153
.415
3.4
- 153
.515
3.5
- 153
.615
3.6
- 153
.715
3.7
- 153
.815
3.8
- 153
.915
3.9
- 154
154
- 154
.115
4.1
- 154
.14
Diam
ond
Gro
und
-
158.
31 -
158.
4115
8.41
- 15
8.51
158.
51 -
158.
6115
8.61
- 15
8.71
158.
71 -
158.
8115
8.81
- 15
8.91
158.
91 -
159.
0115
9.01
- 15
9.1
159.
1 - 1
59.2
159.
2 - 1
59.3
159.
3 - 1
59.4
159.
4 - 1
59.5
159.
5 - 1
59.6
159.
6 - 1
59.6
715
9.71
- 15
9.81
159.
81 -
159.
9115
9.91
- 16
0.01
Mile Post
Northbound Lane 4 Percentage of Cracked Panels MP 151.99 to MP 160.01
L-13

0
10
20
30
40
50
60
70
80
90
100
Perc
enta
ge o
f Cra
cked
Pan
els
160.
01 -
160.
1116
0.11
- 16
0.21
160.
21 -
160.
3116
0.31
- 16
0.41
160.
41 -
160.
5116
0.51
- 16
0.61
160.
61 -
160.
7116
0.71
- 16
0.75
160.
75 -
160.
8516
0.85
- 16
0.95
160.
95 -
161.
0516
1.05
- 16
1.15
161.
15 -
161.
2516
1.25
- 16
1.35
161.
35 -
161.
4516
1.45
- 16
1.55
Brid
ge -
161.
68 -
161.
7816
1.78
- 16
1.88
161.
88 -
161.
9816
1.98
- 16
2.08
162.
08 -
162.
18Br
idge
-
162.
36 -
162.
4616
2.46
- 16
2.56
162.
56 -
162.
6616
2.66
- 16
2.76
162.
76 -
162.
8216
2.96
- 16
3.04
163.
2 - 1
63.2
416
4.37
- 16
4.47
164.
47 -
164.
5716
4.57
- 16
4.67
164.
67 -
164.
7716
4.77
- 16
4.8
164.
93 -
165.
0316
5.03
- 16
5.13
165.
13 -
165.
23Br
idge
-
166.
21 -
166.
3116
6.31
- 16
6.41
Mile Post
Northbound Lane 4 Percentage of Cracked Panels MP 160.01 to MP 166.41
0
10
20
30
40
50
60
70
80
90
100
Perc
enta
ge o
f Cra
cked
Pan
els
166.
41 -
166.
51
166.
51 -
166.
61
166.
61 -
166.
7116
6.71
- 16
6.81
166.
81 -
166.
91Br
idge
-
167.
08 -
167.
18
167.
18 -
167.
28
167.
28 -
167.
35Br
idge
-
167.
77 -
167.
87
167.
87 -
167.
97
167.
97 -
168.
07
168.
07 -
168.
1716
8.17
- 16
8.27
Brid
ge -
169.
18 -
169.
28
169.
28 -
169.
38
169.
38 -
169.
48
169.
48 -
169.
5816
9.58
- 16
9.68
169.
68 -
169.
78
169.
78 -
169.
88
169.
88 -
169.
98
169.
98 -
170.
08
170.
08 -
170.
18Br
idge
- 17
0.6
- 170
.717
0.7
- 170
.817
0.8
- 170
.917
0.9
- 171
171
- 171
.117
1.1
- 171
.217
1.2
- 171
.317
1.3
- 171
.417
1.4
- 171
.517
1.5
- 171
.617
1.6
- 171
.717
1.7
- 171
.817
1.8
- 171
.917
1.9
- 172
172
- 172
.117
2.1
- 172
.217
2.2
- 172
.3Br
idge
- 17
2.4
- 172
.5
Mile Post
Northbound Lane 4 Percentage of Cracked Panels MP 166.41 to MP 172.5
L-14

0
10
20
30
40
50
60
70
80
90
100
Perc
enta
ge o
f Cra
cked
Pan
els
172.
5 - 1
72.6
172.
7 - 1
72.7
617
2.89
- 17
2.99
173.
09 -
173.
1917
3.29
- 17
3.39
173.
49 -
173.
5917
3.69
- 17
3.79
173.
89 -
173.
9917
4.09
- 17
4.14
174.
24 -
174.
3417
4.44
- 17
4.54
174.
64 -
174.
7417
4.84
- 17
4.94
175.
04 -
175.
1117
5.24
- 17
5.34
175.
44 -
175.
5417
5.64
- 17
5.74
175.
84 -
175.
9417
6.04
- 17
6.13
176.
26 -
176.
3617
6.46
- 17
6.56
176.
66 -
176.
717
6.8
- 176
.917
7 - 1
77.1
177.
2 - 1
77.3
177.
4 - 1
77.5
177.
6 - 1
77.7
Mile Post
Northbound Lane 4 Percentage of Cracked Panels MP 172.5 to MP 177.75
Southbound Lane 1 Percentage of Cracked Panels Plots
0
10
20
30
40
50
60
70
80
90
100
Perc
enta
ge o
f Cra
cked
Pan
els
139.
5 - 1
39.6
139.
6 - 1
39.7
139.
7 - 1
39.8
139.
8 - 1
39.9
139.
9 - 1
4014
0 - 1
40.1
140.
1 - 1
40.2
140.
2 - 1
40.3
140.
3 - 1
40.4
140.
4 - 1
40.5
140.
5 - 1
40.6
140.
6 - 1
40.7
140.
7 - 1
40.8
140.
8 - 1
40.9
140.
9 - 1
4114
1 - 1
41.1
141.
1 - 1
41.2
141.
2 - 1
41.3
141.
3 - 1
41.4
141.
4 - 1
41.5
141.
5 - 1
41.6
141.
6 - 1
41.7
141.
7 - 1
41.8
141.
8 - 1
41.9
141.
9 - 1
4214
2.04
- 14
2.09
142.
09 -
142.
1914
2.19
- 14
2.29
142.
29 -
142.
3914
2.39
- 14
2.49
142.
49 -
142.
5914
2.59
- 14
2.69
142.
69 -
142.
7914
2.81
- 14
2.89
142.
89 -
142.
9914
2.99
- 14
3.09
143.
09 -
143.
1914
3.19
- 14
3.29
Mile Post
Southbound Lane 1 Percentage of Cracked Panels MP 139.5 to MP 143.29
L-15

0
10
20
30
40
50
60
70
80
90
100
Perc
enta
ge o
f Cra
cked
Pan
els
143.
29 -
143.
3914
3.39
- 14
3.49
143.
49 -
143.
5914
3.59
- 14
3.69
143.
69 -
143.
7914
3.79
- 14
3.89
143.
89 -
143.
9914
3.99
- 14
4.09
144.
09 -
144.
1914
4.19
- 14
4.29
144.
29 -
144.
39DB
R an
d DG
-
146.
21 -
146.
31Br
idge
- 14
6.51
- 14
6.61
146.
61 -
146.
71Br
idge
- 14
6.84
- 14
6.94
146.
94 -
147.
0414
7.04
- 14
7.14
147.
14 -
147.
2414
7.24
- 14
7.34
147.
34 -
147.
4414
7.44
- 14
7.54
147.
54 -
147.
58DB
R an
d DG
-
149.
76 -
149.
8414
9.84
- 14
9.94
149.
94 -
150.
0415
0.04
- 15
0.14
150.
14 -
150.
2415
0.24
- 15
0.34
150.
34 -
150.
4415
0.44
- 15
0.54
150.
54 -
150.
6415
0.64
- 15
0.74
150.
74 -
150.
8415
0.84
- 15
0.94
Mile Post
Southbound Lane 1 Percentage of Cracked Panels MP 143.29 to MP 150.94
0
10
20
30
40
50
60
70
80
90
100
Perc
enta
ge o
f Cra
cked
Pan
els
150.
94 -
151.
0415
1.04
- 15
1.14
151.
14 -
151.
2415
1.24
- 15
1.34
151.
34 -
151.
4415
1.44
- 15
1.54
151.
54 -
151.
6415
1.64
- 15
1.74
151.
74 -
151.
8415
1.84
- 15
1.94
151.
94 -
152.
0415
2.04
- 15
2.14
152.
14 -
152.
15Br
idge
-
152.
35 -
152.
4515
2.45
- 15
2.55
152.
55 -
152.
6515
2.65
- 15
2.75
152.
75 -
152.
8515
2.85
- 15
2.95
152.
95 -
153.
0515
3.05
- 15
3.15
153.
15 -
153.
2415
3.24
- 15
3.34
153.
34 -
153.
4415
3.44
- 15
3.54
153.
54 -
153.
6415
3.64
- 15
3.74
153.
74 -
153.
8415
3.84
- 15
3.94
153.
94 -
154.
0415
4.04
- 15
4.06
Diam
ond
Gro
und
-
158.
46 -
158.
5615
8.56
- 15
8.66
158.
66 -
158.
7615
8.76
- 15
8.86
158.
86 -
158.
96
Mile Post
Southbound Lane 1 Percentage of Cracked Panels MP 150.94 to MP 158.96
L-16

0
10
20
30
40
50
60
70
80
90
100
Perc
enta
ge o
f Cra
cked
Pan
els
158.
98 -
159.
0715
9.07
- 15
9.17
159.
17 -
159.
2715
9.27
- 15
9.37
159.
37 -
159.
4715
9.47
- 15
9.57
Brid
ge -
159.
71 -
159.
7515
9.75
- 15
9.85
159.
85 -
159.
9515
9.95
- 16
0.05
Brid
ge -
160.
25 -
160.
3516
0.35
- 16
0.45
160.
45 -
160.
5516
0.55
- 16
0.65
160.
65 -
160.
7516
0.75
- 16
0.85
160.
85 -
160.
9416
0.94
- 16
1.04
161.
04 -
161.
1416
1.14
- 16
1.24
161.
24 -
161.
3416
1.34
- 16
1.44
Brid
ge -
161.
74 -
161.
8416
1.84
- 16
1.94
161.
94 -
162.
0416
2.04
- 16
2.14
162.
14 -
162.
2416
2.37
- 16
2.42
162.
42 -
162.
5216
2.52
- 16
2.62
162.
62 -
162.
7216
2.72
- 16
2.82
165.
83 -
165.
8616
5.86
- 16
5.96
165.
96 -
166.
06
Mile Post
Southbound Lane 1 Percentage of Cracked Panels MP 158.98 to MP 166.06
0
10
20
30
40
50
60
70
80
90
100
Perc
enta
ge o
f Cra
cked
Pan
els
166.
06 -
166.
1616
6.16
- 16
6.26
166.
26 -
166.
3616
7.72
- 16
7.74
167.
74 -
167.
8416
7.84
- 16
7.94
167.
94 -
168.
0416
8.04
- 16
8.14
168.
14 -
168.
24Br
idge
- 16
9.18
- 16
9.25
169.
25 -
169.
3516
9.35
- 16
9.45
169.
45 -
169.
5516
9.55
- 16
9.65
169.
65 -
169.
7516
9.75
- 16
9.85
169.
85 -
169.
9516
9.95
- 17
0.05
170.
05 -
170.
1517
0.15
- 17
0.25
172.
52 -
172.
5417
2.54
- 17
2.64
172.
64 -
172.
74Br
idge
- 17
2.84
- 17
2.94
172.
94 -
173.
0417
3.04
- 17
3.14
173.
14 -
173.
2417
3.24
- 17
3.34
173.
34 -
173.
4417
3.44
- 17
3.54
173.
54 -
173.
6417
3.64
- 17
3.74
173.
74 -
173.
8417
3.84
- 17
3.94
173.
94 -
174.
0417
4.04
- 17
4.14
Mile Post
Southbound Lane 1 Percentage of Cracked Panels MP 166.06 to MP 174.14
L-17

Southbound Lane 2 Percentage of Cracked Panels Plots
0
10
20
30
40
50
60
70
80
90
100
Perc
enta
ge o
f Cra
cked
Pan
els
139.
5 - 1
39.6
139.
6 - 1
39.7
139.
7 - 1
39.8
139.
8 - 1
39.9
139.
9 - 1
4014
0 - 1
40.1
140.
1 - 1
40.2
140.
2 - 1
40.3
140.
3 - 1
40.4
140.
4 - 1
40.5
140.
5 - 1
40.6
140.
6 - 1
40.7
140.
7 - 1
40.8
140.
8 - 1
40.9
140.
9 - 1
4114
1 - 1
41.1
141.
1 - 1
41.2
141.
2 - 1
41.3
141.
3 - 1
41.4
141.
4 - 1
41.5
141.
5 - 1
41.6
141.
6 - 1
41.7
141.
7 - 1
41.8
141.
8 - 1
41.9
141.
9 - 1
4214
2.04
- 14
2.09
142.
09 -
142.
1914
2.19
- 14
2.29
142.
29 -
142.
3914
2.39
- 14
2.49
142.
49 -
142.
5914
2.59
- 14
2.69
142.
69 -
142.
7914
2.81
- 14
2.89
142.
89 -
142.
9914
2.99
- 14
3.09
143.
09 -
143.
1914
3.19
- 14
3.29
143.
29 -
143.
3914
3.39
- 14
3.49
143.
49 -
143.
5914
3.59
- 14
3.69
Mile Post
Southbound Lane 2 Percentage of Cracked Panels MP 139.5 to MP 143.69
0
10
20
30
40
50
60
70
80
90
100
Perc
enta
ge o
f Cra
cked
Pan
els
143.
69 -
143.
7914
3.79
- 14
3.89
143.
89 -
143.
9914
3.99
- 14
4.09
144.
09 -
144.
1914
4.19
- 14
4.29
144.
29 -
144.
39DB
R an
d DG
-
146.
21 -
146.
31Br
idge
-
146.
51 -
146.
6114
6.61
- 14
6.71
Brid
ge -
146.
84 -
146.
9414
6.94
- 14
7.04
147.
04 -
147.
1414
7.14
- 14
7.24
147.
24 -
147.
3414
7.34
- 14
7.44
147.
44 -
147.
5414
7.54
- 14
7.58
DBR
and
DG -
149.
76 -
149.
8414
9.84
- 14
9.94
149.
94 -
150.
0415
0.04
- 15
0.14
150.
14 -
150.
2415
0.24
- 15
0.34
150.
34 -
150.
4415
0.44
- 15
0.54
150.
54 -
150.
6415
0.64
- 15
0.74
150.
74 -
150.
8415
0.84
- 15
0.94
150.
94 -
151.
0415
1.04
- 15
1.14
151.
14 -
151.
2415
1.24
- 15
1.34
151.
34 -
151.
4415
1.44
- 15
1.54
151.
54 -
151.
64
Mile Post
Southbound Lane 2 Percentage of Cracked Panels MP 143.69 to MP 151.64
L-18

0
10
20
30
40
50
60
70
80
90
100
Perc
enta
ge o
f Cra
cked
Pan
els
151.
64 -
151.
7415
1.74
- 15
1.84
151.
84 -
151.
9415
1.94
- 15
2.04
152.
04 -
152.
1415
2.14
- 15
2.15
Brid
ge -
152.
35 -
152.
4515
2.45
- 15
2.55
152.
55 -
152.
6515
2.65
- 15
2.75
152.
75 -
152.
8515
2.85
- 15
2.95
152.
95 -
153.
0515
3.05
- 15
3.15
153.
15 -
153.
2415
3.24
- 15
3.34
153.
34 -
153.
4415
3.44
- 15
3.54
153.
54 -
153.
6415
3.64
- 15
3.74
153.
74 -
153.
8415
3.84
- 15
3.94
153.
94 -
154.
0415
4.04
- 15
4.06
Diam
ond
Gro
und
- 15
8.5
- 158
.615
8.6
- 158
.715
8.7
- 158
.815
8.8
- 158
.915
8.9
- 159
159
- 159
.115
9.1
- 159
.17
159.
17 -
159.
2715
9.27
- 15
9.37
159.
37 -
159.
4715
9.47
- 15
9.57
159.
57 -
159.
6715
9.71
- 15
9.75
159.
75 -
159.
8515
9.85
- 15
9.95
Mile Post
Southbound Lane 2 Percentage of Cracked Panels MP 151.64 to MP 159.95
0
10
20
30
40
50
60
70
80
90
100
Perc
enta
ge o
f Cra
cked
Pan
els
160.
25 -
160.
3516
0.35
- 16
0.45
160.
45 -
160.
5516
0.55
- 16
0.65
160.
65 -
160.
7516
0.75
- 16
0.85
160.
85 -
160.
9416
0.94
- 16
1.04
161.
04 -
161.
1416
1.14
- 16
1.24
161.
24 -
161.
3416
1.34
- 16
1.44
Brid
ge -
161.
74 -
161.
8416
1.84
- 16
1.94
161.
94 -
162.
0416
2.04
- 16
2.14
Brid
ge -
162.
37 -
162.
4216
2.42
- 16
2.52
162.
52 -
162.
6216
2.62
- 16
2.72
Brid
ge -
165.
53 -
165.
5816
5.58
- 16
5.68
165.
68 -
165.
7816
5.78
- 16
5.88
165.
88 -
165.
9816
5.98
- 16
6.08
166.
08 -
166.
1816
6.18
- 16
6.28
Brid
ge -
167.
72 -
167.
7416
7.74
- 16
7.84
167.
84 -
167.
9416
7.94
- 16
8.04
168.
04 -
168.
1416
8.14
- 16
8.24
Brid
ge -
169.
18 -
169.
25
Mile Post
Southbound Lane 2 Percentage of Cracked Panels MP 160.25 to MP 169.25
L-19

0
10
20
30
40
50
60
70
80
90
100
Perc
enta
ge o
f Cra
cked
Pan
els
169.
25 -
169.
3516
9.35
- 16
9.45
169.
45 -
169.
5516
9.55
- 16
9.65
169.
65 -
169.
7516
9.75
- 16
9.85
169.
85 -
169.
9516
9.95
- 17
0.05
170.
05 -
170.
1517
0.15
- 17
0.25
Brid
ge -
170.
59 -
170.
6917
0.69
- 17
0.79
170.
79 -
170.
8917
0.89
- 17
0.99
170.
99 -
171.
0917
1.09
- 17
1.19
171.
19 -
171.
2917
1.29
- 17
1.39
171.
39 -
171.
4917
1.49
- 17
1.59
171.
59 -
171.
6917
1.69
- 17
1.79
171.
79 -
171.
8917
1.89
- 17
1.92
171.
92 -
172.
0217
2.02
- 17
2.12
172.
12 -
172.
2217
2.22
- 17
2.32
172.
32 -
172.
4217
2.42
- 17
2.52
172.
52 -
172.
5417
2.54
- 17
2.64
172.
64 -
172.
74Br
idge
-
172.
84 -
172.
9417
2.94
- 17
3.04
173.
04 -
173.
1417
3.14
- 17
3.24
173.
24 -
173.
3417
3.34
- 17
3.44
Mile Post
Southbound Lane 2 Percentage of Cracked Panels MP 169.25 to MP 173.44
0
10
20
30
40
50
60
70
80
90
100
Perc
enta
ge o
f Cra
cked
Pan
els
173.
44 -
173.
5417
3.54
- 17
3.64
173.
64 -
173.
7417
3.74
- 17
3.84
173.
84 -
173.
9417
3.94
- 17
4.04
174.
04 -
174.
1417
4.14
- 17
4.21
174.
21 -
174.
3117
4.31
- 17
4.41
174.
41 -
174.
5117
4.51
- 17
4.61
174.
61 -
174.
7117
4.71
- 17
4.81
174.
81 -
174.
9117
4.91
- 17
5.01
Brid
ge -
175.
23 -
175.
3317
5.33
- 17
5.43
Brid
ge -
175.
53 -
175.
6317
5.63
- 17
5.73
175.
73 -
175.
8317
5.83
- 17
5.93
175.
93 -
176.
03Br
idge
-
176.
16 -
176.
16Br
idge
-
176.
26 -
176.
3617
6.36
- 17
6.46
176.
46 -
176.
5617
6.56
- 17
6.66
176.
66 -
176.
7617
6.76
- 17
6.86
176.
86 -
176.
9617
6.96
- 17
7.05
177.
05 -
177.
1517
7.15
- 17
7.25
177.
25 -
177.
3517
7.35
- 17
7.45
177.
45 -
177.
5517
7.55
- 17
7.65
Mile Post
Southbound Lane 2 Percentage of Cracked Panels MP 173.44 to MP 177.65
L-20

Southbound Lane 3 Percentage of Cracked Panels Plots
0
10
20
30
40
50
60
70
80
90
100
Perc
enta
ge o
f Cra
cked
Pan
els
139.
5 - 1
39.6
139.
6 - 1
39.7
139.
7 - 1
39.8
139.
8 - 1
39.9
139.
9 - 1
4014
0 - 1
40.1
140.
1 - 1
40.2
140.
2 - 1
40.3
140.
3 - 1
40.4
140.
4 - 1
40.5
140.
5 - 1
40.6
140.
6 - 1
40.7
140.
7 - 1
40.8
140.
8 - 1
40.9
140.
9 - 1
4114
1 - 1
41.1
141.
1 - 1
41.2
141.
2 - 1
41.3
141.
3 - 1
41.4
141.
4 - 1
41.5
141.
5 - 1
41.6
141.
6 - 1
41.7
141.
7 - 1
41.8
141.
8 - 1
41.9
141.
9 - 1
4214
2.04
- 14
2.09
142.
09 -
142.
1914
2.19
- 14
2.29
142.
29 -
142.
3914
2.39
- 14
2.49
142.
49 -
142.
5914
2.59
- 14
2.69
142.
69 -
142.
7914
2.81
- 14
2.89
142.
89 -
142.
9914
2.99
- 14
3.09
143.
09 -
143.
1914
3.19
- 14
3.29
143.
29 -
143.
3914
3.39
- 14
3.49
143.
49 -
143.
5914
3.59
- 14
3.69
Mile Post
Southbound Lane 3 Percentage of Cracked Panels MP 139.5 to MP 143.69
0
10
20
30
40
50
60
70
80
90
100
Perc
enta
ge o
f Cra
cked
Pan
els
143.
69 -
143.
7914
3.79
- 14
3.89
143.
89 -
143.
9914
3.99
- 14
4.09
144.
09 -
144.
1914
4.19
- 14
4.29
144.
29 -
144.
39DB
R an
d DG
-
146.
21 -
146.
31Br
idge
-
146.
51 -
146.
6114
6.61
- 14
6.71
146.
71 -
146.
81Br
idge
-
146.
94 -
147.
0414
7.04
- 14
7.14
147.
14 -
147.
2414
7.24
- 14
7.34
147.
34 -
147.
4414
7.44
- 14
7.54
147.
54 -
147.
58DB
R an
d DG
-
149.
76 -
149.
8414
9.84
- 14
9.94
149.
94 -
150.
0415
0.04
- 15
0.14
150.
14 -
150.
2415
0.24
- 15
0.34
150.
34 -
150.
4415
0.44
- 15
0.54
150.
54 -
150.
6415
0.64
- 15
0.74
150.
74 -
150.
8415
0.84
- 15
0.94
150.
94 -
151.
0415
1.04
- 15
1.14
151.
14 -
151.
2415
1.24
- 15
1.34
151.
34 -
151.
4415
1.44
- 15
1.54
151.
54 -
151.
6415
1.64
- 15
1.74
Mile Post
Southbound Lane 3 Percentage of Cracked Panels MP 143.69 to MP 151.74
L-21

0
10
20
30
40
50
60
70
80
90
100
Perc
enta
ge o
f Cra
cked
Pan
els
151.
74 -
151.
8415
1.84
- 15
1.94
151.
94 -
152.
0415
2.04
- 15
2.14
152.
14 -
152.
1515
2.15
- 15
2.25
Brid
ge -
152.
35 -
152.
4515
2.45
- 15
2.55
152.
55 -
152.
6515
2.65
- 15
2.75
152.
75 -
152.
8515
2.85
- 15
2.95
152.
95 -
153.
0515
3.05
- 15
3.15
Diam
ond
Gro
und
- 15
8.5
- 158
.615
8.6
- 158
.715
8.7
- 158
.815
8.8
- 158
.915
8.9
- 159
159
- 159
.115
9.1
- 159
.17
159.
17 -
159.
2715
9.27
- 15
9.37
159.
37 -
159.
4715
9.47
- 15
9.57
159.
57 -
159.
67Br
idge
-
159.
75 -
159.
8515
9.85
- 15
9.95
159.
95 -
160.
05Br
idge
-
160.
25 -
160.
3516
0.35
- 16
0.45
160.
45 -
160.
5516
0.55
- 16
0.65
160.
65 -
160.
7516
0.75
- 16
0.85
160.
85 -
160.
9416
0.94
- 16
1.04
161.
04 -
161.
14
Mile Post
Southbound Lane 3 Percentage of Cracked Panels MP 151.74 to MP 161.14
0
10
20
30
40
50
60
70
80
90
100
Perc
enta
ge o
f Cra
cked
Pan
els
161.
14 -
161.
2416
1.24
- 16
1.34
161.
34 -
161.
44Br
idge
-
161.
74 -
161.
8416
1.84
- 16
1.94
161.
94 -
162.
0416
2.04
- 16
2.14
162.
14 -
162.
24Br
idge
-
162.
42 -
162.
5216
2.52
- 16
2.62
162.
62 -
162.
7216
2.72
- 16
2.82
Brie
ge -
164.
33 -
164.
416
4.4
- 164
.516
4.5
- 164
.6Br
idge
- 16
4.7
- 164
.8Br
idge
-
164.
98 -
165.
0816
5.08
- 16
5.18
165.
18 -
165.
28Br
idge
-
165.
48 -
165.
5816
5.58
- 16
5.68
165.
68 -
165.
7816
5.78
- 16
5.88
165.
88 -
165.
9816
5.98
- 16
6.08
166.
08 -
166.
1816
6.18
- 16
6.28
166.
28 -
166.
36Br
idge
-
167.
74 -
167.
8416
7.84
- 16
7.94
167.
94 -
168.
0416
8.04
- 16
8.14
168.
14 -
168.
24Br
idge
-
169.
18 -
169.
25
Mile Post
Southbound Lane 3 Percentage of Cracked Panels MP 161.14 to MP 169.25
L-22

0
10
20
30
40
50
60
70
80
90
100
Perc
enta
ge o
f Cra
cked
Pan
els
169.
25 -
169.
3516
9.35
- 16
9.45
169.
45 -
169.
5516
9.55
- 16
9.65
169.
65 -
169.
7516
9.75
- 16
9.85
169.
85 -
169.
9516
9.95
- 17
0.05
170.
05 -
170.
1517
0.15
- 17
0.25
Brid
ge -
170.
59 -
170.
6917
0.69
- 17
0.79
170.
79 -
170.
8917
0.89
- 17
0.99
170.
99 -
171.
0917
1.09
- 17
1.19
171.
19 -
171.
2917
1.29
- 17
1.39
171.
39 -
171.
4917
1.49
- 17
1.59
171.
59 -
171.
6917
1.69
- 17
1.79
171.
79 -
171.
8917
1.89
- 17
1.92
171.
92 -
172.
0217
2.02
- 17
2.12
172.
12 -
172.
2217
2.22
- 17
2.32
172.
32 -
172.
4217
2.42
- 17
2.52
172.
52 -
172.
5417
2.54
- 17
2.64
172.
64 -
172.
74Br
idge
-
172.
84 -
172.
9417
2.94
- 17
3.04
173.
04 -
173.
1417
3.14
- 17
3.24
173.
24 -
173.
3417
3.34
- 17
3.44
173.
44 -
173.
54
Mile Post
Southbound Lane 3 Percentage of Cracked Panels MP 169.25 to MP 173.54
0
10
20
30
40
50
60
70
80
90
100
Perc
enta
ge o
f Cra
cked
Pan
els
173.
54 -
173.
6417
3.64
- 17
3.74
173.
74 -
173.
8417
3.84
- 17
3.94
173.
94 -
174.
0417
4.04
- 17
4.14
174.
14 -
174.
2117
4.21
- 17
4.31
174.
31 -
174.
4117
4.41
- 17
4.51
174.
51 -
174.
6117
4.61
- 17
4.71
174.
71 -
174.
8117
4.81
- 17
4.91
174.
91 -
175.
01Br
idge
-
175.
23 -
175.
3317
5.33
- 17
5.43
Brid
ge -
175.
53 -
175.
6317
5.63
- 17
5.73
175.
73 -
175.
8317
5.83
- 17
5.93
175.
93 -
176.
03Br
idge
-
176.
16 -
176.
16Br
idge
-
176.
26 -
176.
3617
6.36
- 17
6.46
176.
46 -
176.
5617
6.56
- 17
6.66
176.
66 -
176.
7617
6.76
- 17
6.86
176.
86 -
176.
9617
6.96
- 17
7.05
177.
05 -
177.
1517
7.15
- 17
7.25
177.
25 -
177.
3517
7.35
- 17
7.45
177.
45 -
177.
5517
7.55
- 17
7.65
Mile Post
Southbound Lane 3 Percentage of Cracked Panels MP 173.54 to MP 177.65
L-23

Southbound Lane 4 Percentage of Cracked Panels Plots
0
10
20
30
40
50
60
70
80
90
100
Perc
enta
ge o
f Cra
cked
Pan
els
139.
5 - 1
39.6
139.
6 - 1
39.7
139.
7 - 1
39.8
139.
8 - 1
39.9
139.
9 - 1
4014
0 - 1
40.1
140.
1 - 1
40.2
140.
2 - 1
40.3
140.
3 - 1
40.4
140.
4 - 1
40.5
140.
5 - 1
40.6
140.
6 - 1
40.7
140.
7 - 1
40.8
140.
8 - 1
40.9
140.
9 - 1
4114
1 - 1
41.1
141.
1 - 1
41.2
141.
2 - 1
41.3
141.
3 - 1
41.4
141.
4 - 1
41.5
141.
5 - 1
41.6
141.
6 - 1
41.7
141.
7 - 1
41.8
141.
8 - 1
41.9
141.
9 - 1
4214
2.04
- 14
2.09
142.
09 -
142.
1914
2.19
- 14
2.29
142.
29 -
142.
3914
2.39
- 14
2.49
142.
49 -
142.
5914
2.59
- 14
2.69
142.
69 -
142.
7914
2.81
- 14
2.89
142.
89 -
142.
9914
2.99
- 14
3.09
143.
09 -
143.
1914
3.19
- 14
3.29
143.
29 -
143.
3914
3.39
- 14
3.49
Mile Post
Southbound Lane 4 Percentage of Cracked Panels MP 139.5 to MP 143.49
0
10
20
30
40
50
60
70
80
90
100
Perc
enta
ge o
f Cra
cked
Pan
els
143.
49 -
143.
5914
3.59
- 14
3.69
143.
69 -
143.
7914
3.79
- 14
3.89
143.
89 -
143.
9914
3.99
- 14
4.09
144.
09 -
144.
1914
4.19
- 14
4.29
144.
29 -
144.
39DB
R an
d DG
-
146.
21 -
146.
31Br
idge
-
146.
51 -
146.
6114
6.61
- 14
6.71
Brid
ge -
146.
84 -
146.
9414
6.94
- 14
7.04
147.
04 -
147.
1414
7.14
- 14
7.24
147.
24 -
147.
3414
7.34
- 14
7.44
147.
44 -
147.
5414
7.54
- 14
7.59
DBR
and
DG -
149.
76 -
149.
8414
9.84
- 14
9.94
149.
94 -
150.
0415
0.04
- 15
0.14
150.
14 -
150.
2415
0.24
- 15
0.34
150.
34 -
150.
4415
0.44
- 15
0.54
150.
54 -
150.
6415
0.64
- 15
0.74
150.
74 -
150.
8415
0.84
- 15
0.94
150.
94 -
151.
0415
1.04
- 15
1.14
151.
14 -
151.
2415
1.24
- 15
1.34
Mile Post
Southbound Lane 4 Percentage of Cracked Panels MP 143.49 to MP 151.34
L-24

0
10
20
30
40
50
60
70
80
90
100
Perc
enta
ge o
f Cra
cked
Pan
els
151.
34 -
151.
4415
1.44
- 15
1.54
151.
54 -
151.
6415
1.64
- 15
1.74
151.
74 -
151.
8415
1.84
- 15
1.94
151.
94 -
152.
0415
2.04
- 15
2.14
152.
14 -
152.
15Br
idge
-
152.
35 -
152.
4515
2.45
- 15
2.55
152.
55 -
152.
6515
2.65
- 15
2.75
152.
75 -
152.
8515
2.85
- 15
2.95
152.
95 -
153.
0515
3.05
- 15
3.15
153.
15 -
153.
2415
3.24
- 15
3.34
153.
34 -
153.
4415
3.44
- 15
3.54
153.
54 -
153.
6415
3.64
- 15
3.74
153.
74 -
153.
8415
3.84
- 15
3.94
153.
94 -
154.
0415
4.04
- 15
4.06
Diam
ond
Gro
nd -
158.
5 - 1
58.6
158.
6 - 1
58.7
158.
7 - 1
58.8
158.
8 - 1
58.9
158.
9 - 1
5915
9 - 1
59.1
159.
1 - 1
59.1
715
9.17
- 15
9.27
159.
27 -
159.
3715
9.37
- 15
9.47
159.
47 -
159.
57
Mile Post
Southbound Lane 4 Percentage of Cracked Panels MP 151.34 to MP 159.57
0
10
20
30
40
50
60
70
80
90
100
Perc
enta
ge o
f Cra
cked
Pan
els
159.
71 -
159.
7515
9.75
- 15
9.85
159.
85 -
159.
95Br
idge
-
160.
25 -
160.
3516
0.35
- 16
0.45
160.
45 -
160.
5516
0.55
- 16
0.65
160.
65 -
160.
7516
0.75
- 16
0.85
160.
85 -
160.
9416
0.94
- 16
1.04
161.
04 -
161.
1416
1.14
- 16
1.24
161.
24 -
161.
3416
1.34
- 16
1.44
Brid
ge -
161.
74 -
161.
8416
1.84
- 16
1.94
161.
94 -
162.
0416
2.04
- 16
2.14
Brid
ge -
162.
37 -
162.
4216
2.42
- 16
2.52
162.
52 -
162.
6216
2.62
- 16
2.72
Brid
ge -
164.
33 -
164.
416
4.4
- 164
.516
4.5
- 164
.616
4.6
- 164
.7Br
idge
- 16
4.93
- 16
4.98
164.
98 -
165.
0816
5.08
- 16
5.18
Brid
ge -
165.
44 -
165.
4816
5.48
- 16
5.58
165.
58 -
165.
68
Mile Post
Southbound Lane 4 Percentage of Cracked Panels MP 159.71 to MP 165.68
L-25

0
10
20
30
40
50
60
70
80
90
100
Perc
enta
ge o
f Cra
cked
Pan
els
165.
68 -
165.
7816
5.78
- 16
5.88
165.
88 -
165.
9816
5.98
- 16
6.08
166.
08 -
166.
1816
6.18
- 16
6.28
Brid
ge -
167.
72 -
167.
7416
7.74
- 16
7.84
167.
84 -
167.
9416
7.94
- 16
8.04
168.
04 -
168.
1416
8.14
- 16
8.24
Brid
ge -
169.
18 -
169.
2516
9.25
- 16
9.35
169.
35 -
169.
4516
9.45
- 16
9.55
169.
55 -
169.
6516
9.65
- 16
9.75
169.
75 -
169.
8516
9.85
- 16
9.95
169.
95 -
170.
0517
0.05
- 17
0.15
170.
15 -
170.
25Br
idge
-
170.
59 -
170.
6917
0.69
- 17
0.79
170.
79 -
170.
8917
0.89
- 17
0.99
170.
99 -
171.
0917
1.09
- 17
1.19
171.
19 -
171.
2917
1.29
- 17
1.39
171.
39 -
171.
4917
1.49
- 17
1.59
171.
59 -
171.
6917
1.69
- 17
1.79
171.
79 -
171.
8917
1.89
- 17
1.92
Mile Post
Southbound Lane 4 Percentage of Cracked Panels MP 165.68 to MP 171.92
0
10
20
30
40
50
60
70
80
90
100
Perc
enta
ge o
f Cra
cked
Pan
els
171.
92 -
172.
0217
2.02
- 17
2.12
172.
12 -
172.
2217
2.22
- 17
2.32
172.
32 -
172.
4217
2.42
- 17
2.52
172.
52 -
172.
5417
2.54
- 17
2.64
172.
64 -
172.
74Br
idge
-
172.
84 -
172.
9417
2.94
- 17
3.04
173.
04 -
173.
1417
3.14
- 17
3.24
173.
24 -
173.
3417
3.34
- 17
3.44
173.
44 -
173.
5417
3.54
- 17
3.64
173.
64 -
173.
7417
3.74
- 17
3.84
173.
84 -
173.
9417
3.94
- 17
4.04
174.
04 -
174.
1417
4.14
- 17
4.21
174.
21 -
174.
3117
4.31
- 17
4.41
174.
41 -
174.
5117
4.51
- 17
4.61
174.
61 -
174.
7117
4.71
- 17
4.81
174.
81 -
174.
9117
4.91
- 17
5.01
Brid
ge -
175.
23 -
175.
3317
5.33
- 17
5.43
Brid
ge -
175.
53 -
175.
6317
5.63
- 17
5.73
175.
73 -
175.
8317
5.83
- 17
5.93
Mile Post
Southbound Lane 4 Percentage of Cracked Panels MP 171.92 to MP 175.93
L-26

0
10
20
30
40
50
60
70
80
90
100
Perc
enta
ge o
f Cra
cked
Pan
els
175.
93 -
176.
0317
6.03
- 17
6.13
176.
16 -
176.
16
Brid
ge -
176.
26 -
176.
3617
6.36
- 17
6.46
176.
46 -
176.
5617
6.56
- 17
6.66
176.
66 -
176.
7617
6.76
- 17
6.86
176.
86 -
176.
9617
6.96
- 17
7.05
177.
05 -
177.
1517
7.15
- 17
7.25
177.
25 -
177.
3517
7.35
- 17
7.45
177.
45 -
177.
5517
7.55
- 17
7.65
Mile Post
Southbound Lane 4 Percentage of Cracked Panels MP 175.93 to MP 177.65
L-27

Appendix M – Percentage of Panels with Two or More Cracks Distress Plots
M-1

Northbound Lane 1 Percentage of Panels with 2 or More Cracks Plots
05
101520253035404550556065707580859095
100
Per
cent
age
of P
anel
s w
ith 2
or M
ore
Cra
cks
139.
5 - 1
39.6
139.
6 - 1
39.7
139.
7 - 1
39.8
139.
8 - 1
39.9
139.
9 - 1
4014
0 - 1
40.1
140.
2 - 1
40.3
140.
3 - 1
40.4
140.
4 - 1
40.5
140.
5 - 1
40.6
140.
6 - 1
40.7
140.
7 - 1
40.8
140.
8 - 1
40.9
140.
9 - 1
4114
1 - 1
41.1
141.
1 - 1
41.2
141.
3 - 1
41.4
141.
4 - 1
41.5
141.
5 - 1
41.6
141.
7 - 1
41.8
141.
8 - 1
41.9
141.
9 - 1
4214
2.04
- 14
2.14
142.
14 -
142.
2414
2.24
- 14
2.34
142.
34 -
142.
4414
2.44
- 14
2.54
142.
54 -
142.
6414
2.64
- 14
2.74
142.
92 -
143.
0214
3.02
- 14
3.12
143.
12 -
143.
2214
3.22
- 14
3.32
143.
32 -
143.
4214
3.42
- 14
3.52
143.
52 -
143.
6214
3.62
- 14
3.72
143.
72 -
143.
8214
3.82
- 14
3.92
Mile Post
Northbound Lane 1 Percentage of Panels with 2 or More Cracks MP 139.5 to MP 143.92
05
101520253035404550556065707580859095
100
Perc
enta
ge o
f Pan
els
with
2 o
r Mor
e C
rack
s14
3.92
- 14
4.02
144.
02 -
144.
1214
4.12
- 14
4.19
144.
19 -
144.
2914
4.29
- 14
4.39
144.
39 -
144.
4914
4.49
- 14
4.59
Brid
ge -
144.
79 -
144.
8914
4.89
- 14
4.99
144.
99 -
145.
0914
5.09
- 14
5.19
145.
19 -
145.
2914
5.29
- 14
5.39
145.
39 -
145.
4914
5.49
- 14
5.59
145.
59 -
145.
69Br
idge
-
145.
89 -
145.
9914
5.99
- 14
6.09
146.
09 -
146.
1914
6.19
- 14
6.29
146.
29 -
146.
3314
6.33
- 14
6.43
Brid
ge -
146.
53 -
146.
6314
6.63
- 14
6.73
Brid
ge -
146.
93 -
147.
0314
7.03
- 14
7.13
147.
13 -
147.
2314
7.23
- 14
7.33
147.
33 -
147.
4314
7.43
- 14
7.53
147.
53 -
147.
6314
7.63
- 14
7.64
147.
67 -
147.
7714
7.77
- 14
7.87
147.
87 -
147.
9714
7.97
- 14
8.07
148.
07 -
148.
17
Mile Post
Northbound Lane 1 Percentage of Panels with 2 or More Cracks MP 143.92 to MP 148.17
M-2

05
101520253035404550556065707580859095
100
Perc
enta
ge o
f Pan
els
with
2 o
r Mor
e C
rack
s
148.
17 -
148.
2714
8.27
- 14
8.37
148.
37 -
148.
4714
8.47
- 14
8.57
148.
57 -
148.
6714
8.67
- 14
8.77
148.
77 -
148.
8714
8.87
- 14
8.97
148.
97 -
149.
07Br
idge
-
149.
22 -
149.
3214
9.32
- 14
9.42
149.
42 -
149.
5214
9.52
- 14
9.62
149.
62 -
149.
7214
9.72
- 14
9.82
149.
82 -
149.
9214
9.92
- 15
0.02
150.
02 -
150.
1215
0.12
- 15
0.22
150.
22 -
150.
3215
0.32
- 15
0.42
150.
42 -
150.
5215
0.52
- 15
0.62
150.
62 -
150.
7215
0.72
- 15
0.82
150.
82 -
150.
9215
0.92
- 15
1.02
151.
02 -
151.
1215
1.12
- 15
1.22
151.
22 -
151.
2315
1.23
- 15
1.33
151.
33 -
151.
4315
1.43
- 15
1.53
151.
53 -
151.
6315
1.63
- 15
1.73
151.
73 -
151.
8315
1.83
- 15
1.93
151.
93 -
152.
0315
2.03
- 15
2.13
Mile Post
Northbound Lane 1 Percentage of Panels with 2 or More Cracks MP 148.17 to MP 152.13
05
101520253035404550556065707580859095
100
Perc
enta
ge o
f Pan
els
with
2 o
r Mor
e C
rack
s15
2.13
- 15
2.23
Brid
ge -
152.
39 -
152.
4915
2.49
- 15
2.59
152.
59 -
152.
6915
2.69
- 15
2.79
152.
79 -
152.
8915
2.89
- 15
2.99
152.
99 -
153.
0915
3.09
- 15
3.19
153.
19 -
153.
215
3.2
- 153
.315
3.3
- 153
.415
3.4
- 153
.515
3.5
- 153
.6Br
idge
- 15
3.8
- 153
.915
3.9
- 154
154
- 154
.115
4.1
- 154
.14
Diam
ond
Gro
und
-
158.
51 -
158.
6115
8.61
- 15
8.71
158.
71 -
158.
8115
8.81
- 15
8.91
158.
91 -
159.
0115
9.01
- 15
9.1
159.
1 - 1
59.2
159.
2 - 1
59.3
159.
3 - 1
59.4
159.
4 - 1
59.5
159.
5 - 1
59.6
Brid
ge -
159.
71 -
159.
8115
9.81
- 15
9.91
159.
91 -
160.
0116
0.01
- 16
0.11
160.
11 -
160.
2116
0.21
- 16
0.31
160.
31 -
160.
41
Mile Post
Northbound Lane 1 Percentage of Panels with 2 or More Cracks MP 152.13 to MP 160.41
M-3

05
101520253035404550556065707580859095
100
Perc
enta
ge o
f Pan
els
with
2 o
r Mor
e C
rack
s16
0.41
- 16
0.51
160.
51 -
160.
6116
0.61
- 16
0.71
160.
71 -
160.
7516
0.75
- 16
0.85
160.
85 -
160.
9516
0.95
- 16
1.05
161.
05 -
161.
1516
1.15
- 16
1.25
161.
25 -
161.
3516
1.35
- 16
1.45
161.
45 -
161.
55Br
idge
-
161.
78 -
161.
8816
1.88
- 16
1.98
161.
98 -
162.
0816
2.08
- 16
2.18
Brid
ge -
162.
36 -
162.
4616
2.46
- 16
2.56
162.
56 -
162.
5716
6.21
- 16
6.31
166.
31 -
166.
4116
6.41
- 16
6.51
166.
51 -
166.
6116
6.61
- 16
6.71
166.
71 -
166.
8116
6.81
- 16
6.91
166.
98 -
167.
0816
7.08
- 16
7.18
167.
18 -
167.
28Br
idge
-
168.
23 -
168.
3316
8.33
- 16
8.34
Brid
ge -
169.
28 -
169.
3816
9.38
- 16
9.48
169.
48 -
169.
5816
9.58
- 16
9.68
169.
68 -
169.
78
Mile Post
Northbound Lane 1 Percentage of Panels with 2 or More Cracks MP 160.41 to MP 169.78
05
101520253035404550556065707580859095
100
Perc
enta
ge o
f Pan
els
with
2 o
r Mor
e C
rack
s16
9.78
- 16
9.88
169.
88 -
169.
9816
9.98
- 17
0.08
170.
08 -
170.
1817
0.18
- 17
0.25
Brid
ge -
172.
49 -
172.
5917
2.59
- 17
2.69
Brid
ge -
172.
89 -
172.
9917
2.99
- 17
3.09
173.
09 -
173.
1917
3.19
- 17
3.29
173.
29 -
173.
3917
3.39
- 17
3.49
173.
49 -
173.
5917
3.59
- 17
3.69
173.
69 -
173.
7917
3.79
- 17
3.89
173.
89 -
173.
9917
3.99
- 17
4.09
174.
09 -
174.
1417
4.14
- 17
4.24
174.
24 -
174.
3417
4.34
- 17
4.44
174.
44 -
174.
5417
4.54
- 17
4.64
174.
64 -
174.
7417
4.74
- 17
4.84
174.
84 -
174.
9417
4.94
- 17
5.04
175.
04 -
175.
11Br
idge
-
175.
24 -
175.
3417
5.34
- 17
5.44
Brid
ge -
175.
64 -
175.
7417
5.74
- 17
5.79
Mile Post
Northbound Lane 1 Percentage of Panels with 2 or More Cracks MP 169.78 to MP 175.79
M-4

Northbound Lane 2 Percentage of Panels with 2 or More Cracks Plots
05
101520253035404550556065707580859095
100
Per
cent
age
of P
anel
s w
ith 2
or M
ore
Cra
cks
139.
5 - 1
39.6
139.
6 - 1
39.7
139.
7 - 1
39.8
139.
8 - 1
39.9
139.
9 - 1
4014
0 - 1
40.1
140.
1 - 1
40.2
140.
2 - 1
40.3
140.
3 - 1
40.4
140.
4 - 1
40.5
140.
5 - 1
40.6
140.
6 - 1
40.7
140.
7 - 1
40.8
140.
8 - 1
40.9
140.
9 - 1
4114
1 - 1
41.1
141.
1 - 1
41.2
141.
2 - 1
41.3
141.
3 - 1
41.4
141.
4 - 1
41.5
141.
5 - 1
41.6
141.
6 - 1
41.7
141.
7 - 1
41.8
141.
8 - 1
41.9
141.
9 - 1
4214
2.04
- 14
2.14
142.
14 -
142.
2414
2.24
- 14
2.34
142.
34 -
142.
4414
2.44
- 14
2.54
142.
54 -
142.
6414
2.64
- 14
2.74
142.
74 -
142.
7914
2.82
- 14
2.92
142.
92 -
143.
0214
3.02
- 14
3.12
143.
12 -
143.
2214
3.22
- 14
3.32
143.
32 -
143.
4214
3.42
- 14
3.52
143.
52 -
143.
6214
3.62
- 14
3.72
Mile Post
Northbound Lane 2 Percentage of Panels with 2 or More Cracks MP 139.5 to MP 143.72
05
101520253035404550556065707580859095
100
Perc
enta
ge o
f Pan
els
with
2 o
r Mor
e C
rack
s14
3.72
- 14
3.82
Brid
ge -
143.
92 -
144.
0214
4.02
- 14
4.12
144.
12 -
144.
1914
4.19
- 14
4.29
144.
29 -
144.
3914
4.39
- 14
4.49
144.
49 -
144.
59Br
idge
-
144.
79 -
144.
8914
4.89
- 14
4.99
144.
99 -
145.
0914
5.09
- 14
5.19
145.
19 -
145.
2914
5.29
- 14
5.39
145.
39 -
145.
4914
5.49
- 14
5.59
145.
59 -
145.
69Br
idge
-
145.
89 -
145.
9914
5.99
- 14
6.09
146.
09 -
146.
1914
6.19
- 14
6.29
146.
29 -
146.
3314
6.33
- 14
6.43
Brid
ge -
146.
53 -
146.
6314
6.63
- 14
6.73
Brid
ge -
146.
93 -
147.
0314
7.03
- 14
7.13
147.
13 -
147.
2314
7.23
- 14
7.33
147.
33 -
147.
4314
7.43
- 14
7.53
147.
53 -
147.
63Br
idge
-
147.
77 -
147.
8714
7.87
- 14
7.97
147.
97 -
148.
0714
8.07
- 14
8.17
Mile Post
Northbound Lane 2 Percentage of Panels with 2 or More Cracks MP 143.72 to MP 148.17
M-5

05
101520253035404550556065707580859095
100
Perc
enta
ge o
f Pan
els
with
2 o
r Mor
e C
rack
s14
8.17
- 14
8.27
148.
27 -
148.
3714
8.37
- 14
8.47
148.
47 -
148.
5714
8.57
- 14
8.67
148.
67 -
148.
7714
8.77
- 14
8.87
148.
87 -
148.
9714
8.97
- 14
9.07
Brid
ge -
149.
22 -
149.
3214
9.32
- 14
9.42
149.
42 -
149.
5214
9.52
- 14
9.62
149.
62 -
149.
7214
9.72
- 14
9.82
149.
82 -
149.
9214
9.92
- 15
0.02
150.
02 -
150.
1215
0.12
- 15
0.22
150.
22 -
150.
3215
0.32
- 15
0.42
150.
42 -
150.
5215
0.52
- 15
0.62
150.
62 -
150.
7215
0.72
- 15
0.82
150.
82 -
150.
9215
0.92
- 15
1.02
151.
02 -
151.
1215
1.12
- 15
1.22
151.
22 -
151.
2315
1.23
- 15
1.33
151.
33 -
151.
4315
1.43
- 15
1.53
151.
53 -
151.
6315
1.63
- 15
1.73
151.
73 -
151.
8315
1.83
- 15
1.93
151.
93 -
152.
0315
2.03
- 15
2.13
152.
13 -
152.
23Br
idge
-
Mile Post
Northbound Lane 2 Percentage of Panels with 2 or More Cracks MP 148.17 to MP 152.23
05
101520253035404550556065707580859095
100
Perc
enta
ge o
f Pan
els
with
2 o
r Mor
e C
rack
s15
2.39
- 15
2.49
152.
49 -
152.
5915
2.59
- 15
2.69
152.
69 -
152.
7915
2.79
- 15
2.89
152.
89 -
152.
9915
2.99
- 15
3.09
153.
09 -
153.
1915
3.19
- 15
3.2
153.
2 - 1
53.3
153.
3 - 1
53.4
153.
4 - 1
53.5
153.
5 - 1
53.6
153.
6 - 1
53.7
153.
7 - 1
53.8
153.
8 - 1
53.9
153.
9 - 1
5415
4 - 1
54.1
154.
1 - 1
54.1
4
Diam
ond
Gro
und
-
158.
31 -
158.
41Br
idge
-
158.
51 -
158.
6115
8.61
- 15
8.71
158.
71 -
158.
8115
8.81
- 15
8.91
158.
91 -
159.
0115
9.01
- 15
9.1
159.
1 - 1
59.2
159.
2 - 1
59.3
159.
3 - 1
59.4
159.
4 - 1
59.5
159.
5 - 1
59.6
159.
6 - 1
59.6
715
9.71
- 15
9.81
159.
81 -
159.
9115
9.91
- 16
0.01
160.
01 -
160.
1116
0.11
- 16
0.21
160.
21 -
160.
3116
0.31
- 16
0.41
160.
41 -
160.
51
Mile Post
Northbound Lane 2 Percentage of Panels with 2 or More Cracks MP 152.39 to MP 160.51
M-6

05
101520253035404550556065707580859095
100
Perc
enta
ge o
f Pan
els
with
2 o
r Mor
e C
rack
s16
0.51
- 16
0.61
160.
61 -
160.
7116
0.71
- 16
0.75
160.
75 -
160.
8516
0.85
- 16
0.95
160.
95 -
161.
0516
1.05
- 16
1.15
161.
15 -
161.
2516
1.25
- 16
1.35
161.
35 -
161.
4516
1.45
- 16
1.55
161.
55 -
161.
65Br
idge
-
161.
78 -
161.
8816
1.88
- 16
1.98
161.
98 -
161.
9916
2 - 1
62.1
Brid
ge -
162.
4 - 1
62.5
162.
5 - 1
62.6
162.
6 - 1
62.7
162.
7 - 1
62.8
162.
8 - 1
62.8
2Br
idge
-
164.
47 -
164.
57Br
idge
-
164.
67 -
164.
7716
4.77
- 16
4.8
164.
95 -
165.
0516
5.05
- 16
5.15
165.
15 -
165.
25Br
idge
-
166.
31 -
166.
4116
6.41
- 16
6.51
166.
51 -
166.
6116
6.61
- 16
6.71
166.
71 -
166.
8116
6.81
- 16
6.91
166.
98 -
167.
0816
7.08
- 16
7.18
167.
18 -
167.
28Br
idge
-
Mile Post
Northbound Lane 2 Percentage of Panels with 2 or More Cracks MP 160.51 to MP 167.28
05
101520253035404550556065707580859095
100
Perc
enta
ge o
f Pan
els
with
2 o
r Mor
e C
rack
s16
7.77
- 16
7.87
167.
87 -
167.
9716
7.97
- 16
8.07
168.
07 -
168.
1716
8.17
- 16
8.27
Brid
ge -
169.
28 -
169.
3816
9.38
- 16
9.48
169.
48 -
169.
5816
9.58
- 16
9.68
169.
68 -
169.
7816
9.78
- 16
9.88
169.
88 -
169.
9816
9.98
- 17
0.08
170.
08 -
170.
18Br
idge
- 17
0.6
- 170
.717
0.7
- 170
.817
0.8
- 170
.917
0.9
- 171
171
- 171
.117
1.1
- 171
.217
1.2
- 171
.317
1.3
- 171
.417
1.4
- 171
.517
1.5
- 171
.617
1.6
- 171
.717
1.7
- 171
.817
1.8
- 171
.917
1.9
- 172
172
- 172
.117
2.1
- 172
.217
2.2
- 172
.3Br
idge
- 17
2.4
- 172
.517
2.5
- 172
.617
2.6
- 172
.717
2.7
- 172
.76
Brid
ge -
172.
89 -
172.
9917
2.99
- 17
3.09
173.
09 -
173.
19
Mile Post
Northbound Lane 2 Percentage of Panels with 2 or More Cracks MP 167.77 to MP 173.19
M-7

05
101520253035404550556065707580859095
100
Perc
enta
ge o
f Pan
els
with
2 o
r Mor
e C
rack
s17
3.19
- 17
3.29
173.
29 -
173.
3917
3.39
- 17
3.49
173.
49 -
173.
5917
3.59
- 17
3.69
173.
69 -
173.
79
173.
79 -
173.
8917
3.89
- 17
3.99
173.
99 -
174.
0917
4.09
- 17
4.14
174.
14 -
174.
24
174.
24 -
174.
3417
4.34
- 17
4.44
174.
44 -
174.
5417
4.54
- 17
4.64
174.
64 -
174.
74
174.
74 -
174.
8417
4.84
- 17
4.94
174.
94 -
175.
0417
5.04
- 17
5.11
Brid
ge -
175.
24 -
175.
3417
5.34
- 17
5.44
Brid
ge -
175.
64 -
175.
74
175.
74 -
175.
84
175.
84 -
175.
9417
5.94
- 17
6.04
176.
04 -
176.
13Br
idge
-
176.
26 -
176.
36
176.
36 -
176.
4617
6.46
- 17
6.56
176.
56 -
176.
6617
6.66
- 17
6.7
176.
7 - 1
76.8
176.
8 - 1
76.9
176.
9 - 1
7717
7 - 1
77.1
177.
1 - 1
77.2
177.
2 - 1
77.3
177.
3 - 1
77.4
177.
4 - 1
77.5
177.
5 - 1
77.6
177.
6 - 1
77.7
177.
7 - 1
77.7
5
Mile Post
Northbound Lane 2 Percentage of Panels with 2 or More Cracks MP 173.19 to MP 177.75
Northbound Lane 3 Percentage of Panels with 2 or More Cracks Plots
05
101520253035404550556065707580859095
100
Per
cent
age
of P
anel
s w
ith 2
or M
ore
Cra
cks
139.
5 - 1
39.6
139.
6 - 1
39.7
139.
7 - 1
39.8
139.
8 - 1
39.9
139.
9 - 1
4014
0 - 1
40.1
140.
1 - 1
40.2
140.
2 - 1
40.3
140.
3 - 1
40.4
140.
4 - 1
40.5
140.
5 - 1
40.6
140.
6 - 1
40.7
140.
7 - 1
40.8
140.
8 - 1
40.9
140.
9 - 1
4114
1 - 1
41.1
141.
1 - 1
41.2
141.
2 - 1
41.3
141.
3 - 1
41.4
141.
4 - 1
41.5
141.
5 - 1
41.6
141.
6 - 1
41.7
141.
7 - 1
41.8
141.
8 - 1
41.9
141.
9 - 1
4214
2.04
- 14
2.14
142.
14 -
142.
2414
2.24
- 14
2.34
142.
34 -
142.
4414
2.44
- 14
2.54
142.
54 -
142.
6414
2.64
- 14
2.74
142.
74 -
142.
7914
2.82
- 14
2.92
142.
92 -
143.
0214
3.02
- 14
3.12
143.
12 -
143.
2214
3.22
- 14
3.32
143.
32 -
143.
4214
3.42
- 14
3.52
143.
52 -
143.
6214
3.62
- 14
3.72
143.
72 -
143.
82
Mile Post
Northbound Lane 3 Percentage of Panels with 2 or More Cracks MP 139.5 to MP 143.82
M-8

05
101520253035404550556065707580859095
100
Perc
enta
ge o
f Pan
els
with
2 o
r Mor
e C
rack
s14
3.82
- 14
3.92
143.
92 -
144.
0214
4.02
- 14
4.12
144.
12 -
144.
1914
4.19
- 14
4.29
144.
29 -
144.
3914
4.39
- 14
4.49
144.
49 -
144.
59Br
idge
-
144.
79 -
144.
8914
4.89
- 14
4.99
144.
99 -
145.
0914
5.09
- 14
5.19
145.
19 -
145.
2914
5.29
- 14
5.39
145.
39 -
145.
4914
5.49
- 14
5.59
145.
59 -
145.
69Br
idge
-
145.
89 -
145.
9914
5.99
- 14
6.09
146.
09 -
146.
1914
6.19
- 14
6.29
146.
29 -
146.
33Br
idge
-
146.
53 -
146.
6314
6.63
- 14
6.73
Brid
ge -
146.
93 -
147.
0314
7.03
- 14
7.13
147.
13 -
147.
2314
7.23
- 14
7.33
147.
33 -
147.
4314
7.43
- 14
7.53
147.
53 -
147.
6314
7.63
- 14
7.64
Brid
ge -
147.
77 -
147.
8714
7.87
- 14
7.97
147.
97 -
148.
0714
8.07
- 14
8.17
148.
17 -
148.
27
Mile Post
Northbound Lane 3 Percentage of Panels with 2 or More Cracks MP 143.82 to MP 148.27
05
101520253035404550556065707580859095
100
Perc
enta
ge o
f Pan
els
with
2 o
r Mor
e C
rack
s14
8.27
- 14
8.37
148.
37 -
148.
4714
8.47
- 14
8.57
148.
57 -
148.
6714
8.67
- 14
8.77
148.
77 -
148.
8714
8.87
- 14
8.97
148.
97 -
149.
07Br
idge
-
149.
32 -
149.
4214
9.42
- 14
9.52
149.
52 -
149.
6214
9.62
- 14
9.72
149.
72 -
149.
8214
9.82
- 14
9.92
149.
92 -
150.
0215
0.02
- 15
0.12
150.
12 -
150.
2215
0.22
- 15
0.32
150.
32 -
150.
4215
0.42
- 15
0.52
150.
52 -
150.
6215
0.62
- 15
0.72
150.
72 -
150.
8215
0.82
- 15
0.92
150.
92 -
151.
0215
1.02
- 15
1.12
151.
12 -
151.
2215
1.22
- 15
1.23
151.
23 -
151.
3315
1.33
- 15
1.43
151.
43 -
151.
5315
1.53
- 15
1.63
151.
63 -
151.
7315
1.73
- 15
1.83
151.
83 -
151.
9315
1.93
- 15
2.03
152.
03 -
152.
1315
2.13
- 15
2.23
Brid
ge -
152.
39 -
152.
4915
2.49
- 15
2.59
152.
59 -
152.
69
Mile Post
Northbound Lane 3 Percentage of Panels with 2 or More Cracks MP 148.27 to MP 152.69
M-9

05
101520253035404550556065707580859095
100
Perc
enta
ge o
f Pan
els
with
2 o
r Mor
e C
rack
s15
2.69
- 15
2.79
152.
79 -
152.
8915
2.89
- 15
2.99
152.
99 -
153.
0915
3.09
- 15
3.19
153.
19 -
153.
215
3.2
- 153
.315
3.3
- 153
.415
3.4
- 153
.515
3.5
- 153
.6Br
idge
- 15
3.8
- 153
.915
3.9
- 154
154
- 154
.115
4.1
- 154
.14
Diam
ond
Gro
und
-
158.
31 -
158.
4115
8.41
- 15
8.51
158.
51 -
158.
6115
8.61
- 15
8.71
158.
71 -
158.
81
158.
81 -
158.
9115
8.91
- 15
9.01
159.
01 -
159.
115
9.1
- 159
.215
9.2
- 159
.315
9.3
- 159
.415
9.4
- 159
.515
9.5
- 159
.6Br
idge
-
159.
81 -
159.
91
159.
91 -
160.
0116
0.01
- 16
0.11
160.
11 -
160.
2116
0.21
- 16
0.31
160.
31 -
160.
4116
0.41
- 16
0.51
160.
51 -
160.
6116
0.61
- 16
0.71
160.
71 -
160.
75
160.
75 -
160.
8516
0.85
- 16
0.95
160.
95 -
161.
05
Mile Post
Northbound Lane 3 Percentage of Panels with 2 or More Cracks MP 152.69 to MP 161.05
05
101520253035404550556065707580859095
100
Perc
enta
ge o
f Pan
els
with
2 o
r Mor
e C
rack
s16
1.05
- 16
1.15
161.
15 -
161.
2516
1.25
- 16
1.35
161.
35 -
161.
4516
1.45
- 16
1.55
Brid
ge -
161.
78 -
161.
8816
1.88
- 16
1.98
161.
98 -
162.
0816
2.08
- 16
2.18
162.
18 -
162.
19Br
idge
-
162.
46 -
162.
5616
2.56
- 16
2.66
162.
66 -
162.
76Br
idge
-
164.
37 -
164.
4716
4.47
- 16
4.57
Brid
ge -
164.
67 -
164.
77Br
idge
-
165.
03 -
165.
1316
5.13
- 16
5.23
Brid
ge -
166.
31 -
166.
4116
6.41
- 16
6.51
166.
51 -
166.
6116
6.61
- 16
6.71
166.
71 -
166.
8116
6.81
- 16
6.91
Brid
ge -
167.
08 -
167.
1816
7.18
- 16
7.28
Brid
ge -
167.
77 -
167.
8716
7.87
- 16
7.97
167.
97 -
168.
0716
8.07
- 16
8.17
168.
17 -
168.
2716
8.27
- 16
8.34
Brid
ge -
169.
28 -
169.
3816
9.38
- 16
9.48
Mile Post
Northbound Lane 3 Percentage of Panels with 2 or More Cracks MP 161.05 to MP 169.48
M-10

05
101520253035404550556065707580859095
100
Perc
enta
ge o
f Pan
els
with
2 o
r Mor
e C
rack
s16
9.48
- 16
9.58
169.
58 -
169.
6816
9.68
- 16
9.78
169.
78 -
169.
8816
9.88
- 16
9.98
169.
98 -
170.
0817
0.08
- 17
0.18
Brid
ge -
170.
6 - 1
70.7
170.
7 - 1
70.8
170.
8 - 1
70.9
170.
9 - 1
7117
1 - 1
71.1
171.
1 - 1
71.2
171.
2 - 1
71.3
171.
3 - 1
71.4
171.
4 - 1
71.5
171.
5 - 1
71.6
171.
6 - 1
71.7
171.
7 - 1
71.8
171.
8 - 1
71.9
171.
9 - 1
7217
2 - 1
72.1
172.
1 - 1
72.2
172.
2 - 1
72.3
Brid
ge -
172.
4 - 1
72.5
172.
5 - 1
72.6
172.
6 - 1
72.7
Brid
ge -
172.
89 -
172.
9917
2.99
- 17
3.09
173.
09 -
173.
1917
3.19
- 17
3.29
173.
29 -
173.
3917
3.39
- 17
3.49
173.
49 -
173.
5917
3.59
- 17
3.69
173.
69 -
173.
7917
3.79
- 17
3.89
173.
89 -
173.
9917
3.99
- 17
4.09
174.
09 -
174.
14
Mile Post
Northbound Lane 3 Percentage of Panels with 2 or More Cracks MP 169.48 to MP 174.14
05
101520253035404550556065707580859095
100
Perc
enta
ge o
f Pan
els
with
2 o
r Mor
e C
rack
s17
4.14
- 17
4.24
174.
24 -
174.
3417
4.34
- 17
4.44
174.
44 -
174.
5417
4.54
- 17
4.64
174.
64 -
174.
7417
4.74
- 17
4.84
174.
84 -
174.
9417
4.94
- 17
5.04
175.
04 -
175.
11Br
idge
- 17
5.24
- 17
5.34
175.
34 -
175.
44Br
idge
- 17
5.54
- 17
5.64
175.
64 -
175.
7417
5.74
- 17
5.84
175.
84 -
175.
9417
5.94
- 17
6.04
176.
04 -
176.
13Br
idge
- 17
6.26
- 17
6.36
176.
36 -
176.
4617
6.46
- 17
6.56
176.
56 -
176.
6617
6.66
- 17
6.7
176.
7 - 1
76.8
176.
8 - 1
76.9
176.
9 - 1
7717
7 - 1
77.1
177.
1 - 1
77.2
177.
2 - 1
77.3
177.
3 - 1
77.4
177.
4 - 1
77.5
177.
5 - 1
77.6
177.
6 - 1
77.7
Mile Post
Northbound Lane 3 Percentage of Panels with 2 or More Cracks MP 174.14 to MP 177.7
M-11

Northbound Lane 4 Percentage of Panels with 2 or More Cracks Plots
05
101520253035404550556065707580859095
100
Per
cent
age
of P
anel
s w
ith 2
or M
ore
Cra
cks
139.
5 - 1
39.6
139.
6 - 1
39.7
139.
7 - 1
39.8
139.
8 - 1
39.9
139.
9 - 1
4014
0 - 1
40.1
140.
1 - 1
40.2
140.
2 - 1
40.3
140.
3 - 1
40.4
140.
4 - 1
40.5
140.
5 - 1
40.6
140.
6 - 1
40.7
140.
7 - 1
40.8
140.
8 - 1
40.9
140.
9 - 1
4114
1 - 1
41.1
141.
1 - 1
41.2
141.
2 - 1
41.3
141.
3 - 1
41.4
141.
4 - 1
41.5
141.
5 - 1
41.6
141.
6 - 1
41.7
141.
7 - 1
41.8
141.
8 - 1
41.9
141.
9 - 1
4214
2.04
- 14
2.14
142.
14 -
142.
2414
2.24
- 14
2.34
142.
34 -
142.
4414
2.44
- 14
2.54
142.
54 -
142.
6414
2.64
- 14
2.74
142.
74 -
142.
7914
2.82
- 14
2.92
142.
92 -
143.
0214
3.02
- 14
3.12
143.
12 -
143.
2214
3.22
- 14
3.32
143.
32 -
143.
4214
3.42
- 14
3.52
143.
52 -
143.
62
Mile Post
Northbound Lane 4 Percentage of Panels with 2 or More Cracks MP 139.5 to MP 143.62
05
101520253035404550556065707580859095
100
Perc
enta
ge o
f Pan
els
with
2 o
r Mor
e C
rack
s14
3.62
- 14
3.72
143.
72 -
143.
8214
3.82
- 14
3.92
143.
92 -
144.
0214
4.02
- 14
4.12
144.
12 -
144.
1914
4.19
- 14
4.29
144.
29 -
144.
3914
4.39
- 14
4.49
144.
49 -
144.
59Br
idge
-
144.
79 -
144.
8914
4.89
- 14
4.99
144.
99 -
145.
0914
5.09
- 14
5.19
145.
19 -
145.
2914
5.29
- 14
5.39
145.
39 -
145.
4914
5.49
- 14
5.59
145.
59 -
145.
69Br
idge
-
145.
89 -
145.
9914
5.99
- 14
6.09
146.
09 -
146.
1914
6.19
- 14
6.29
146.
29 -
146.
33Br
idge
-
146.
53 -
146.
6314
6.63
- 14
6.73
Brid
ge -
146.
93 -
147.
0314
7.03
- 14
7.13
147.
13 -
147.
2314
7.23
- 14
7.33
147.
33 -
147.
4314
7.43
- 14
7.53
147.
53 -
147.
63Br
idge
-
147.
67 -
147.
7714
7.77
- 14
7.87
Mile Post
Northbound Lane 4 Percentage of Panels with 2 or More Cracks MP 143.62 to MP 147.87
M-12

05
101520253035404550556065707580859095
100
Perc
enta
ge o
f Pan
els
with
2 o
r Mor
e C
rack
s14
7.87
- 14
7.97
147.
97 -
148.
0714
8.07
- 14
8.17
148.
17 -
148.
2714
8.27
- 14
8.37
148.
37 -
148.
4714
8.47
- 14
8.57
148.
57 -
148.
6714
8.67
- 14
8.77
148.
77 -
148.
8714
8.87
- 14
8.97
148.
97 -
149.
07Br
idge
-
149.
22 -
149.
3214
9.32
- 14
9.42
149.
42 -
149.
5214
9.52
- 14
9.62
149.
62 -
149.
7214
9.72
- 14
9.82
149.
82 -
149.
9214
9.92
- 15
0.02
150.
02 -
150.
1215
0.12
- 15
0.22
150.
22 -
150.
3215
0.32
- 15
0.42
150.
42 -
150.
5215
0.52
- 15
0.62
150.
62 -
150.
7215
0.72
- 15
0.82
150.
82 -
150.
9215
0.92
- 15
1.02
151.
02 -
151.
1215
1.12
- 15
1.22
151.
22 -
151.
3215
1.32
- 15
1.42
151.
42 -
151.
5215
1.52
- 15
1.62
151.
62 -
151.
7215
1.72
- 15
1.82
151.
82 -
151.
92
Mile Post
Northbound Lane 4 Percentage of Panels with 2 or More Cracks MP 147.87 to MP 151.97
05
101520253035404550556065707580859095
100
Perc
enta
ge o
f Pan
els
with
2 o
r Mor
e C
rack
s15
1.99
- 15
2.09
152.
09 -
152.
1915
2.19
- 15
2.26
152.
29 -
152.
3915
2.39
- 15
2.49
152.
49 -
152.
5915
2.59
- 15
2.69
152.
69 -
152.
7915
2.79
- 15
2.89
152.
89 -
152.
9915
2.99
- 15
3.09
153.
09 -
153.
1915
3.19
- 15
3.2
153.
2 - 1
53.3
153.
3 - 1
53.4
153.
4 - 1
53.5
153.
5 - 1
53.6
153.
6 - 1
53.7
153.
7 - 1
53.8
153.
8 - 1
53.9
153.
9 - 1
5415
4 - 1
54.1
154.
1 - 1
54.1
4
Diam
ond
Gro
und
-
158.
31 -
158.
4115
8.41
- 15
8.51
158.
51 -
158.
6115
8.61
- 15
8.71
158.
71 -
158.
8115
8.81
- 15
8.91
158.
91 -
159.
0115
9.01
- 15
9.1
159.
1 - 1
59.2
159.
2 - 1
59.3
159.
3 - 1
59.4
159.
4 - 1
59.5
159.
5 - 1
59.6
159.
6 - 1
59.6
715
9.71
- 15
9.81
159.
81 -
159.
9115
9.91
- 16
0.01
Mile Post
Northbound Lane 4 Percentage of Panels with 2 or More Cracks MP 151.99 to MP 160.01
M-13

05
101520253035404550556065707580859095
100
Perc
enta
ge o
f Pan
els
with
2 o
r Mor
e C
rack
s16
0.01
- 16
0.11
160.
11 -
160.
2116
0.21
- 16
0.31
160.
31 -
160.
4116
0.41
- 16
0.51
160.
51 -
160.
6116
0.61
- 16
0.71
160.
71 -
160.
7516
0.75
- 16
0.85
160.
85 -
160.
9516
0.95
- 16
1.05
161.
05 -
161.
1516
1.15
- 16
1.25
161.
25 -
161.
3516
1.35
- 16
1.45
161.
45 -
161.
55Br
idge
-
161.
68 -
161.
7816
1.78
- 16
1.88
161.
88 -
161.
9816
1.98
- 16
2.08
162.
08 -
162.
18Br
idge
-
162.
36 -
162.
4616
2.46
- 16
2.56
162.
56 -
162.
6616
2.66
- 16
2.76
162.
76 -
162.
8216
2.96
- 16
3.04
163.
2 - 1
63.2
416
4.37
- 16
4.47
164.
47 -
164.
5716
4.57
- 16
4.67
164.
67 -
164.
7716
4.77
- 16
4.8
164.
93 -
165.
0316
5.03
- 16
5.13
165.
13 -
165.
23Br
idge
-
166.
21 -
166.
3116
6.31
- 16
6.41
Mile Post
Northbound Lane 4 Percentage of Panels with 2 or More Cracks MP 160.01 to MP 166.41
05
101520253035404550556065707580859095
100
Perc
enta
ge o
f Pan
els
with
2 o
r Mor
e C
rack
s16
6.41
- 16
6.51
166.
51 -
166.
61
166.
61 -
166.
7116
6.71
- 16
6.81
166.
81 -
166.
91Br
idge
-
167.
08 -
167.
18
167.
18 -
167.
28
167.
28 -
167.
35Br
idge
-
167.
77 -
167.
87
167.
87 -
167.
97
167.
97 -
168.
07
168.
07 -
168.
1716
8.17
- 16
8.27
Brid
ge -
169.
18 -
169.
28
169.
28 -
169.
38
169.
38 -
169.
48
169.
48 -
169.
5816
9.58
- 16
9.68
169.
68 -
169.
78
169.
78 -
169.
88
169.
88 -
169.
98
169.
98 -
170.
08
170.
08 -
170.
18Br
idge
- 17
0.6
- 170
.717
0.7
- 170
.817
0.8
- 170
.917
0.9
- 171
171
- 171
.117
1.1
- 171
.217
1.2
- 171
.317
1.3
- 171
.417
1.4
- 171
.517
1.5
- 171
.617
1.6
- 171
.717
1.7
- 171
.817
1.8
- 171
.917
1.9
- 172
172
- 172
.117
2.1
- 172
.217
2.2
- 172
.3Br
idge
- 17
2.4
- 172
.5
Mile Post
Northbound Lane 4 Percentage of Panels with 2 or More Cracks MP 166.41 to MP 172.5
M-14

05
101520253035404550556065707580859095
100
Perc
enta
ge o
f Pan
els
with
2 o
r Mor
e C
rack
s
172.
5 - 1
72.6
172.
7 - 1
72.7
617
2.89
- 17
2.99
173.
09 -
173.
1917
3.29
- 17
3.39
173.
49 -
173.
5917
3.69
- 17
3.79
173.
89 -
173.
9917
4.09
- 17
4.14
174.
24 -
174.
3417
4.44
- 17
4.54
174.
64 -
174.
7417
4.84
- 17
4.94
175.
04 -
175.
1117
5.24
- 17
5.34
175.
44 -
175.
5417
5.64
- 17
5.74
175.
84 -
175.
9417
6.04
- 17
6.13
176.
26 -
176.
3617
6.46
- 17
6.56
176.
66 -
176.
717
6.8
- 176
.917
7 - 1
77.1
177.
2 - 1
77.3
177.
4 - 1
77.5
177.
6 - 1
77.7
Mile Post
Northbound Lane 4 Percentage of Panels with 2 or More Cracks MP 172.5 to MP 177.75
Southbound Lane 1 Percentage of Panels with 2 or More Cracks Plots
05
101520253035404550556065707580859095
100
Perc
enta
ge o
f Pan
els
with
2 o
r Mor
e C
rack
s
139.
5 - 1
39.6
139.
6 - 1
39.7
139.
7 - 1
39.8
139.
8 - 1
39.9
139.
9 - 1
4014
0 - 1
40.1
140.
1 - 1
40.2
140.
2 - 1
40.3
140.
3 - 1
40.4
140.
4 - 1
40.5
140.
5 - 1
40.6
140.
6 - 1
40.7
140.
7 - 1
40.8
140.
8 - 1
40.9
140.
9 - 1
4114
1 - 1
41.1
141.
1 - 1
41.2
141.
2 - 1
41.3
141.
3 - 1
41.4
141.
4 - 1
41.5
141.
5 - 1
41.6
141.
6 - 1
41.7
141.
7 - 1
41.8
141.
8 - 1
41.9
141.
9 - 1
4214
2.04
- 14
2.09
142.
09 -
142.
1914
2.19
- 14
2.29
142.
29 -
142.
3914
2.39
- 14
2.49
142.
49 -
142.
5914
2.59
- 14
2.69
142.
69 -
142.
7914
2.81
- 14
2.89
142.
89 -
142.
9914
2.99
- 14
3.09
143.
09 -
143.
1914
3.19
- 14
3.29
Mile Post
Southbound Lane 1 Percentage of Panels with 2 or More Cracks MP 139.5 to MP 143.29
M-15

05
101520253035404550556065707580859095
100
Perc
enta
ge o
f Pan
els
with
2 o
r Mor
e C
rack
s14
3.29
- 14
3.39
143.
39 -
143.
4914
3.49
- 14
3.59
143.
59 -
143.
6914
3.69
- 14
3.79
143.
79 -
143.
8914
3.89
- 14
3.99
143.
99 -
144.
0914
4.09
- 14
4.19
144.
19 -
144.
2914
4.29
- 14
4.39
DBR
and
DG -
146.
21 -
146.
31Br
idge
- 14
6.51
- 14
6.61
146.
61 -
146.
71Br
idge
- 14
6.84
- 14
6.94
146.
94 -
147.
0414
7.04
- 14
7.14
147.
14 -
147.
2414
7.24
- 14
7.34
147.
34 -
147.
4414
7.44
- 14
7.54
147.
54 -
147.
58DB
R an
d DG
-
149.
76 -
149.
8414
9.84
- 14
9.94
149.
94 -
150.
0415
0.04
- 15
0.14
150.
14 -
150.
2415
0.24
- 15
0.34
150.
34 -
150.
4415
0.44
- 15
0.54
150.
54 -
150.
6415
0.64
- 15
0.74
150.
74 -
150.
8415
0.84
- 15
0.94
Mile Post
Southbound Lane 1 Percentage of Panels with 2 or More Cracks MP 143.29 to MP 150.94
05
101520253035404550556065707580859095
100
Perc
enta
ge o
f Pan
els
with
2 o
r Mor
e C
rack
s15
0.94
- 15
1.04
151.
04 -
151.
1415
1.14
- 15
1.24
151.
24 -
151.
3415
1.34
- 15
1.44
151.
44 -
151.
5415
1.54
- 15
1.64
151.
64 -
151.
7415
1.74
- 15
1.84
151.
84 -
151.
9415
1.94
- 15
2.04
152.
04 -
152.
1415
2.14
- 15
2.15
Brid
ge -
152.
35 -
152.
4515
2.45
- 15
2.55
152.
55 -
152.
6515
2.65
- 15
2.75
152.
75 -
152.
8515
2.85
- 15
2.95
152.
95 -
153.
0515
3.05
- 15
3.15
153.
15 -
153.
2415
3.24
- 15
3.34
153.
34 -
153.
4415
3.44
- 15
3.54
153.
54 -
153.
6415
3.64
- 15
3.74
153.
74 -
153.
8415
3.84
- 15
3.94
153.
94 -
154.
0415
4.04
- 15
4.06
Diam
ond
Gro
und
-
158.
46 -
158.
5615
8.56
- 15
8.66
158.
66 -
158.
7615
8.76
- 15
8.86
158.
86 -
158.
96
Mile Post
Southbound Lane 1 Percentage of Panels with 2 or More Cracks MP 150.94 to MP 158.96
M-16

05
101520253035404550556065707580859095
100
Perc
enta
ge o
f Pan
els
with
2 o
r Mor
e C
rack
s15
8.98
- 15
9.07
159.
07 -
159.
1715
9.17
- 15
9.27
159.
27 -
159.
3715
9.37
- 15
9.47
159.
47 -
159.
57Br
idge
-
159.
71 -
159.
7515
9.75
- 15
9.85
159.
85 -
159.
9515
9.95
- 16
0.05
Brid
ge -
160.
25 -
160.
3516
0.35
- 16
0.45
160.
45 -
160.
5516
0.55
- 16
0.65
160.
65 -
160.
7516
0.75
- 16
0.85
160.
85 -
160.
9416
0.94
- 16
1.04
161.
04 -
161.
1416
1.14
- 16
1.24
161.
24 -
161.
3416
1.34
- 16
1.44
Brid
ge -
161.
74 -
161.
8416
1.84
- 16
1.94
161.
94 -
162.
0416
2.04
- 16
2.14
162.
14 -
162.
2416
2.37
- 16
2.42
162.
42 -
162.
5216
2.52
- 16
2.62
162.
62 -
162.
7216
2.72
- 16
2.82
165.
83 -
165.
8616
5.86
- 16
5.96
165.
96 -
166.
06
Mile Post
Southbound Lane 1 Percentage of Panels with 2 or More Cracks MP 158.98 to MP 166.06
05
101520253035404550556065707580859095
100
Perc
enta
ge o
f Pan
els
with
2 o
r Mor
e C
rack
s16
6.06
- 16
6.16
166.
16 -
166.
2616
6.26
- 16
6.36
167.
72 -
167.
7416
7.74
- 16
7.84
167.
84 -
167.
9416
7.94
- 16
8.04
168.
04 -
168.
1416
8.14
- 16
8.24
Brid
ge -
169.
18 -
169.
2516
9.25
- 16
9.35
169.
35 -
169.
4516
9.45
- 16
9.55
169.
55 -
169.
6516
9.65
- 16
9.75
169.
75 -
169.
8516
9.85
- 16
9.95
169.
95 -
170.
0517
0.05
- 17
0.15
170.
15 -
170.
2517
2.52
- 17
2.54
172.
54 -
172.
6417
2.64
- 17
2.74
Brid
ge -
172.
84 -
172.
9417
2.94
- 17
3.04
173.
04 -
173.
1417
3.14
- 17
3.24
173.
24 -
173.
3417
3.34
- 17
3.44
173.
44 -
173.
5417
3.54
- 17
3.64
173.
64 -
173.
7417
3.74
- 17
3.84
173.
84 -
173.
9417
3.94
- 17
4.04
174.
04 -
174.
14
Mile Post
Southbound Lane 1 Percentage of Panels with 2 or More Cracks MP 166.06 to MP 174.14
M-17

Southbound Lane 2 Percentage of Panels with 2 or More Cracks Plots
05
101520253035404550556065707580859095
100
Per
cent
age
of P
anel
s w
ith 2
or M
ore
Cra
cks
139.
5 - 1
39.6
139.
6 - 1
39.7
139.
7 - 1
39.8
139.
8 - 1
39.9
139.
9 - 1
4014
0 - 1
40.1
140.
1 - 1
40.2
140.
2 - 1
40.3
140.
3 - 1
40.4
140.
4 - 1
40.5
140.
5 - 1
40.6
140.
6 - 1
40.7
140.
7 - 1
40.8
140.
8 - 1
40.9
140.
9 - 1
4114
1 - 1
41.1
141.
1 - 1
41.2
141.
2 - 1
41.3
141.
3 - 1
41.4
141.
4 - 1
41.5
141.
5 - 1
41.6
141.
6 - 1
41.7
141.
7 - 1
41.8
141.
8 - 1
41.9
141.
9 - 1
4214
2.04
- 14
2.09
142.
09 -
142.
1914
2.19
- 14
2.29
142.
29 -
142.
3914
2.39
- 14
2.49
142.
49 -
142.
5914
2.59
- 14
2.69
142.
69 -
142.
7914
2.81
- 14
2.89
142.
89 -
142.
9914
2.99
- 14
3.09
143.
09 -
143.
1914
3.19
- 14
3.29
143.
29 -
143.
3914
3.39
- 14
3.49
143.
49 -
143.
5914
3.59
- 14
3.69
Mile Post
Southbound Lane 2 Percentage of Panels with 2 or More Cracks MP 139.5 to MP 143.69
05
101520253035404550556065707580859095
100
Perc
enta
ge o
f Pan
els
with
2 o
r Mor
e C
rack
s14
3.69
- 14
3.79
143.
79 -
143.
8914
3.89
- 14
3.99
143.
99 -
144.
0914
4.09
- 14
4.19
144.
19 -
144.
2914
4.29
- 14
4.39
DBR
and
DG -
146.
21 -
146.
31Br
idge
-
146.
51 -
146.
6114
6.61
- 14
6.71
Brid
ge -
146.
84 -
146.
9414
6.94
- 14
7.04
147.
04 -
147.
1414
7.14
- 14
7.24
147.
24 -
147.
3414
7.34
- 14
7.44
147.
44 -
147.
5414
7.54
- 14
7.58
DBR
and
DG -
149.
76 -
149.
8414
9.84
- 14
9.94
149.
94 -
150.
0415
0.04
- 15
0.14
150.
14 -
150.
2415
0.24
- 15
0.34
150.
34 -
150.
4415
0.44
- 15
0.54
150.
54 -
150.
6415
0.64
- 15
0.74
150.
74 -
150.
8415
0.84
- 15
0.94
150.
94 -
151.
0415
1.04
- 15
1.14
151.
14 -
151.
2415
1.24
- 15
1.34
151.
34 -
151.
4415
1.44
- 15
1.54
151.
54 -
151.
64
Mile Post
Southbound Lane 2 Percentage of Panels with 2 or More Cracks MP 143.69 to MP 151.64
M-18

05
101520253035404550556065707580859095
100
Perc
enta
ge o
f Pan
els
with
2 o
r Mor
e C
rack
s15
1.64
- 15
1.74
151.
74 -
151.
8415
1.84
- 15
1.94
151.
94 -
152.
0415
2.04
- 15
2.14
152.
14 -
152.
15Br
idge
-
152.
35 -
152.
4515
2.45
- 15
2.55
152.
55 -
152.
6515
2.65
- 15
2.75
152.
75 -
152.
8515
2.85
- 15
2.95
152.
95 -
153.
0515
3.05
- 15
3.15
153.
15 -
153.
2415
3.24
- 15
3.34
153.
34 -
153.
4415
3.44
- 15
3.54
153.
54 -
153.
6415
3.64
- 15
3.74
153.
74 -
153.
8415
3.84
- 15
3.94
153.
94 -
154.
0415
4.04
- 15
4.06
Diam
ond
Gro
und
- 15
8.5
- 158
.615
8.6
- 158
.715
8.7
- 158
.815
8.8
- 158
.915
8.9
- 159
159
- 159
.115
9.1
- 159
.17
159.
17 -
159.
2715
9.27
- 15
9.37
159.
37 -
159.
4715
9.47
- 15
9.57
159.
57 -
159.
6715
9.71
- 15
9.75
159.
75 -
159.
8515
9.85
- 15
9.95
Mile Post
Southbound Lane 2 Percentage of Panels with 2 or More Cracks MP 151.64 to MP 159.95
05
101520253035404550556065707580859095
100
Perc
enta
ge o
f Pan
els
with
2 o
r Mor
e C
rack
s
Brid
ge -
160.
25 -
160.
3516
0.35
- 16
0.45
160.
45 -
160.
5516
0.55
- 16
0.65
160.
65 -
160.
7516
0.75
- 16
0.85
160.
85 -
160.
9416
0.94
- 16
1.04
161.
04 -
161.
1416
1.14
- 16
1.24
161.
24 -
161.
3416
1.34
- 16
1.44
Brid
ge -
161.
74 -
161.
8416
1.84
- 16
1.94
161.
94 -
162.
0416
2.04
- 16
2.14
Brid
ge -
162.
37 -
162.
4216
2.42
- 16
2.52
162.
52 -
162.
6216
2.62
- 16
2.72
Brid
ge -
165.
53 -
165.
5816
5.58
- 16
5.68
165.
68 -
165.
7816
5.78
- 16
5.88
165.
88 -
165.
9816
5.98
- 16
6.08
166.
08 -
166.
1816
6.18
- 16
6.28
Brid
ge -
167.
72 -
167.
7416
7.74
- 16
7.84
167.
84 -
167.
9416
7.94
- 16
8.04
168.
04 -
168.
1416
8.14
- 16
8.24
Brid
ge -
169.
18 -
169.
25
Mile Post
Southbound Lane 2 Percentage of Panels with 2 or More Cracks MP 160.25 to MP 169.25
M-19

05
101520253035404550556065707580859095
100
Perc
enta
ge o
f Pan
els
with
2 o
r Mor
e C
rack
s16
9.25
- 16
9.35
169.
35 -
169.
4516
9.45
- 16
9.55
169.
55 -
169.
6516
9.65
- 16
9.75
169.
75 -
169.
8516
9.85
- 16
9.95
169.
95 -
170.
0517
0.05
- 17
0.15
170.
15 -
170.
25Br
idge
-
170.
59 -
170.
6917
0.69
- 17
0.79
170.
79 -
170.
8917
0.89
- 17
0.99
170.
99 -
171.
0917
1.09
- 17
1.19
171.
19 -
171.
2917
1.29
- 17
1.39
171.
39 -
171.
4917
1.49
- 17
1.59
171.
59 -
171.
6917
1.69
- 17
1.79
171.
79 -
171.
8917
1.89
- 17
1.92
171.
92 -
172.
0217
2.02
- 17
2.12
172.
12 -
172.
2217
2.22
- 17
2.32
172.
32 -
172.
4217
2.42
- 17
2.52
172.
52 -
172.
5417
2.54
- 17
2.64
172.
64 -
172.
74Br
idge
-
172.
84 -
172.
9417
2.94
- 17
3.04
173.
04 -
173.
1417
3.14
- 17
3.24
173.
24 -
173.
3417
3.34
- 17
3.44
Mile Post
Southbound Lane 2 Percentage of Panels with 2 or More Cracks MP 169.25 to MP 173.44
05
101520253035404550556065707580859095
100
Perc
enta
ge o
f Pan
els
with
2 o
r Mor
e C
rack
s17
3.44
- 17
3.54
173.
54 -
173.
6417
3.64
- 17
3.74
173.
74 -
173.
8417
3.84
- 17
3.94
173.
94 -
174.
0417
4.04
- 17
4.14
174.
14 -
174.
2117
4.21
- 17
4.31
174.
31 -
174.
4117
4.41
- 17
4.51
174.
51 -
174.
6117
4.61
- 17
4.71
174.
71 -
174.
8117
4.81
- 17
4.91
174.
91 -
175.
01Br
idge
-
175.
23 -
175.
3317
5.33
- 17
5.43
Brid
ge -
175.
53 -
175.
6317
5.63
- 17
5.73
175.
73 -
175.
8317
5.83
- 17
5.93
175.
93 -
176.
03Br
idge
-
176.
16 -
176.
16Br
idge
-
176.
26 -
176.
3617
6.36
- 17
6.46
176.
46 -
176.
5617
6.56
- 17
6.66
176.
66 -
176.
7617
6.76
- 17
6.86
176.
86 -
176.
9617
6.96
- 17
7.05
177.
05 -
177.
1517
7.15
- 17
7.25
177.
25 -
177.
3517
7.35
- 17
7.45
177.
45 -
177.
5517
7.55
- 17
7.65
Mile Post
Southbound Lane 2 Percentage of Panels with 2 or More Cracks MP 173.44 to MP 177.65
M-20

Southbound Lane 3 Percentage of Panels with 2 or More Cracks Plots
05
101520253035404550556065707580859095
100
Per
cent
age
of P
anel
s w
ith 2
or M
ore
Cra
cks
139.
5 - 1
39.6
139.
6 - 1
39.7
139.
7 - 1
39.8
139.
8 - 1
39.9
139.
9 - 1
4014
0 - 1
40.1
140.
1 - 1
40.2
140.
2 - 1
40.3
140.
3 - 1
40.4
140.
4 - 1
40.5
140.
5 - 1
40.6
140.
6 - 1
40.7
140.
7 - 1
40.8
140.
8 - 1
40.9
140.
9 - 1
4114
1 - 1
41.1
141.
1 - 1
41.2
141.
2 - 1
41.3
141.
3 - 1
41.4
141.
4 - 1
41.5
141.
5 - 1
41.6
141.
6 - 1
41.7
141.
7 - 1
41.8
141.
8 - 1
41.9
141.
9 - 1
4214
2.04
- 14
2.09
142.
09 -
142.
1914
2.19
- 14
2.29
142.
29 -
142.
3914
2.39
- 14
2.49
142.
49 -
142.
5914
2.59
- 14
2.69
142.
69 -
142.
7914
2.81
- 14
2.89
142.
89 -
142.
9914
2.99
- 14
3.09
143.
09 -
143.
1914
3.19
- 14
3.29
143.
29 -
143.
3914
3.39
- 14
3.49
143.
49 -
143.
5914
3.59
- 14
3.69
Mile Post
Southbound Lane 3 Percentage of Panels with 2 or More Cracks MP 139.5 to MP 143.69
05
101520253035404550556065707580859095
100
Perc
enta
ge o
f Pan
els
with
2 o
r Mor
e C
rack
s14
3.69
- 14
3.79
143.
79 -
143.
8914
3.89
- 14
3.99
143.
99 -
144.
0914
4.09
- 14
4.19
144.
19 -
144.
2914
4.29
- 14
4.39
DBR
and
DG -
146.
21 -
146.
31Br
idge
-
146.
51 -
146.
6114
6.61
- 14
6.71
146.
71 -
146.
81Br
idge
-
146.
94 -
147.
0414
7.04
- 14
7.14
147.
14 -
147.
2414
7.24
- 14
7.34
147.
34 -
147.
4414
7.44
- 14
7.54
147.
54 -
147.
58DB
R an
d DG
-
149.
76 -
149.
8414
9.84
- 14
9.94
149.
94 -
150.
0415
0.04
- 15
0.14
150.
14 -
150.
2415
0.24
- 15
0.34
150.
34 -
150.
4415
0.44
- 15
0.54
150.
54 -
150.
6415
0.64
- 15
0.74
150.
74 -
150.
8415
0.84
- 15
0.94
150.
94 -
151.
0415
1.04
- 15
1.14
151.
14 -
151.
2415
1.24
- 15
1.34
151.
34 -
151.
4415
1.44
- 15
1.54
151.
54 -
151.
6415
1.64
- 15
1.74
Mile Post
Southbound Lane 3 Percentage of Panels with 2 or More Cracks MP 143.69 to MP 151.74
M-21

05
101520253035404550556065707580859095
100
Perc
enta
ge o
f Pan
els
with
2 o
r Mor
e C
rack
s15
1.74
- 15
1.84
151.
84 -
151.
9415
1.94
- 15
2.04
152.
04 -
152.
1415
2.14
- 15
2.15
152.
15 -
152.
25Br
idge
-
152.
35 -
152.
4515
2.45
- 15
2.55
152.
55 -
152.
6515
2.65
- 15
2.75
152.
75 -
152.
8515
2.85
- 15
2.95
152.
95 -
153.
0515
3.05
- 15
3.15
Diam
ond
Gro
und
- 15
8.5
- 158
.615
8.6
- 158
.715
8.7
- 158
.815
8.8
- 158
.915
8.9
- 159
159
- 159
.115
9.1
- 159
.17
159.
17 -
159.
2715
9.27
- 15
9.37
159.
37 -
159.
4715
9.47
- 15
9.57
159.
57 -
159.
67Br
idge
-
159.
75 -
159.
8515
9.85
- 15
9.95
159.
95 -
160.
05Br
idge
-
160.
25 -
160.
3516
0.35
- 16
0.45
160.
45 -
160.
5516
0.55
- 16
0.65
160.
65 -
160.
7516
0.75
- 16
0.85
160.
85 -
160.
9416
0.94
- 16
1.04
161.
04 -
161.
14
Mile Post
Southbound Lane 3 Percentage of Panels with 2 or More Cracks MP 151.74 to MP 161.14
05
101520253035404550556065707580859095
100
Perc
enta
ge o
f Pan
els
with
2 o
r Mor
e C
rack
s16
1.14
- 16
1.24
161.
24 -
161.
3416
1.34
- 16
1.44
Brid
ge -
161.
74 -
161.
8416
1.84
- 16
1.94
161.
94 -
162.
0416
2.04
- 16
2.14
162.
14 -
162.
24Br
idge
-
162.
42 -
162.
5216
2.52
- 16
2.62
162.
62 -
162.
7216
2.72
- 16
2.82
Brie
ge -
164.
33 -
164.
416
4.4
- 164
.516
4.5
- 164
.6Br
idge
- 16
4.7
- 164
.8Br
idge
-
164.
98 -
165.
0816
5.08
- 16
5.18
165.
18 -
165.
28Br
idge
-
165.
48 -
165.
5816
5.58
- 16
5.68
165.
68 -
165.
7816
5.78
- 16
5.88
165.
88 -
165.
9816
5.98
- 16
6.08
166.
08 -
166.
1816
6.18
- 16
6.28
166.
28 -
166.
36Br
idge
-
167.
74 -
167.
8416
7.84
- 16
7.94
167.
94 -
168.
0416
8.04
- 16
8.14
168.
14 -
168.
24Br
idge
-
169.
18 -
169.
25
Mile Post
Southbound Lane 3 Percentage of Panels with 2 or More Cracks MP 161.14 to MP 169.25
M-22

05
101520253035404550556065707580859095
100
Perc
enta
ge o
f Pan
els
with
2 o
r Mor
e C
rack
s16
9.25
- 16
9.35
169.
35 -
169.
4516
9.45
- 16
9.55
169.
55 -
169.
6516
9.65
- 16
9.75
169.
75 -
169.
8516
9.85
- 16
9.95
169.
95 -
170.
0517
0.05
- 17
0.15
170.
15 -
170.
25Br
idge
-
170.
59 -
170.
6917
0.69
- 17
0.79
170.
79 -
170.
8917
0.89
- 17
0.99
170.
99 -
171.
0917
1.09
- 17
1.19
171.
19 -
171.
2917
1.29
- 17
1.39
171.
39 -
171.
4917
1.49
- 17
1.59
171.
59 -
171.
6917
1.69
- 17
1.79
171.
79 -
171.
8917
1.89
- 17
1.92
171.
92 -
172.
0217
2.02
- 17
2.12
172.
12 -
172.
2217
2.22
- 17
2.32
172.
32 -
172.
4217
2.42
- 17
2.52
172.
52 -
172.
5417
2.54
- 17
2.64
172.
64 -
172.
74Br
idge
-
172.
84 -
172.
9417
2.94
- 17
3.04
173.
04 -
173.
1417
3.14
- 17
3.24
173.
24 -
173.
3417
3.34
- 17
3.44
173.
44 -
173.
54
Mile Post
Southbound Lane 3 Percentage of Panels with 2 or More Cracks MP 169.25 to MP 173.54
05
101520253035404550556065707580859095
100
Perc
enta
ge o
f Pan
els
with
2 o
r Mor
e C
rack
s17
3.54
- 17
3.64
173.
64 -
173.
7417
3.74
- 17
3.84
173.
84 -
173.
9417
3.94
- 17
4.04
174.
04 -
174.
1417
4.14
- 17
4.21
174.
21 -
174.
3117
4.31
- 17
4.41
174.
41 -
174.
5117
4.51
- 17
4.61
174.
61 -
174.
7117
4.71
- 17
4.81
174.
81 -
174.
9117
4.91
- 17
5.01
Brid
ge -
175.
23 -
175.
3317
5.33
- 17
5.43
Brid
ge -
175.
53 -
175.
6317
5.63
- 17
5.73
175.
73 -
175.
8317
5.83
- 17
5.93
175.
93 -
176.
03Br
idge
-
176.
16 -
176.
16Br
idge
-
176.
26 -
176.
3617
6.36
- 17
6.46
176.
46 -
176.
5617
6.56
- 17
6.66
176.
66 -
176.
7617
6.76
- 17
6.86
176.
86 -
176.
9617
6.96
- 17
7.05
177.
05 -
177.
1517
7.15
- 17
7.25
177.
25 -
177.
3517
7.35
- 17
7.45
177.
45 -
177.
5517
7.55
- 17
7.65
Mile Post
Southbound Lane 3 Percentage of Panels with 2 or More Cracks MP 173.54 to MP 177.65
M-23

Southbound Lane 4 Percentage of Panels with 2 or More Cracks Plots
05
101520253035404550556065707580859095
100
Per
cent
age
of P
anel
s w
ith 2
or M
ore
Cra
cks
139.
5 - 1
39.6
139.
6 - 1
39.7
139.
7 - 1
39.8
139.
8 - 1
39.9
139.
9 - 1
4014
0 - 1
40.1
140.
1 - 1
40.2
140.
2 - 1
40.3
140.
3 - 1
40.4
140.
4 - 1
40.5
140.
5 - 1
40.6
140.
6 - 1
40.7
140.
7 - 1
40.8
140.
8 - 1
40.9
140.
9 - 1
4114
1 - 1
41.1
141.
1 - 1
41.2
141.
2 - 1
41.3
141.
3 - 1
41.4
141.
4 - 1
41.5
141.
5 - 1
41.6
141.
6 - 1
41.7
141.
7 - 1
41.8
141.
8 - 1
41.9
141.
9 - 1
4214
2.04
- 14
2.09
142.
09 -
142.
1914
2.19
- 14
2.29
142.
29 -
142.
3914
2.39
- 14
2.49
142.
49 -
142.
5914
2.59
- 14
2.69
142.
69 -
142.
7914
2.81
- 14
2.89
142.
89 -
142.
9914
2.99
- 14
3.09
143.
09 -
143.
1914
3.19
- 14
3.29
143.
29 -
143.
3914
3.39
- 14
3.49
Mile Post
Southbound Lane 4 Percentage of Panels with 2 or More Cracks MP 139.5 to MP 143.49
05
101520253035404550556065707580859095
100
Perc
enta
ge o
f Pan
els
with
2 o
r Mor
e C
rack
s14
3.49
- 14
3.59
143.
59 -
143.
6914
3.69
- 14
3.79
143.
79 -
143.
8914
3.89
- 14
3.99
143.
99 -
144.
0914
4.09
- 14
4.19
144.
19 -
144.
2914
4.29
- 14
4.39
DBR
and
DG -
146.
21 -
146.
31Br
idge
-
146.
51 -
146.
6114
6.61
- 14
6.71
Brid
ge -
146.
84 -
146.
9414
6.94
- 14
7.04
147.
04 -
147.
1414
7.14
- 14
7.24
147.
24 -
147.
3414
7.34
- 14
7.44
147.
44 -
147.
5414
7.54
- 14
7.59
DBR
and
DG -
149.
76 -
149.
8414
9.84
- 14
9.94
149.
94 -
150.
0415
0.04
- 15
0.14
150.
14 -
150.
2415
0.24
- 15
0.34
150.
34 -
150.
4415
0.44
- 15
0.54
150.
54 -
150.
6415
0.64
- 15
0.74
150.
74 -
150.
8415
0.84
- 15
0.94
150.
94 -
151.
0415
1.04
- 15
1.14
151.
14 -
151.
2415
1.24
- 15
1.34
Mile Post
Southbound Lane 4 Percentage of Panels with 2 or More Cracks MP 143.49 to MP 151.34
M-24

05
101520253035404550556065707580859095
100
Perc
enta
ge o
f Pan
els
with
2 o
r Mor
e C
rack
s15
1.34
- 15
1.44
151.
44 -
151.
5415
1.54
- 15
1.64
151.
64 -
151.
7415
1.74
- 15
1.84
151.
84 -
151.
9415
1.94
- 15
2.04
152.
04 -
152.
1415
2.14
- 15
2.15
Brid
ge -
152.
35 -
152.
4515
2.45
- 15
2.55
152.
55 -
152.
6515
2.65
- 15
2.75
152.
75 -
152.
8515
2.85
- 15
2.95
152.
95 -
153.
0515
3.05
- 15
3.15
153.
15 -
153.
2415
3.24
- 15
3.34
153.
34 -
153.
4415
3.44
- 15
3.54
153.
54 -
153.
6415
3.64
- 15
3.74
153.
74 -
153.
8415
3.84
- 15
3.94
153.
94 -
154.
0415
4.04
- 15
4.06
Diam
ond
Gro
nd -
158.
5 - 1
58.6
158.
6 - 1
58.7
158.
7 - 1
58.8
158.
8 - 1
58.9
158.
9 - 1
5915
9 - 1
59.1
159.
1 - 1
59.1
715
9.17
- 15
9.27
159.
27 -
159.
3715
9.37
- 15
9.47
159.
47 -
159.
57
Mile Post
Southbound Lane 4 Percentage of Panels with 2 or More Cracks MP 151.34 to MP 159.57
05
101520253035404550556065707580859095
100
Perc
enta
ge o
f Pan
els
with
2 o
r Mor
e C
rack
s
Brid
ge -
159.
71 -
159.
7515
9.75
- 15
9.85
159.
85 -
159.
95Br
idge
-
160.
25 -
160.
3516
0.35
- 16
0.45
160.
45 -
160.
5516
0.55
- 16
0.65
160.
65 -
160.
7516
0.75
- 16
0.85
160.
85 -
160.
9416
0.94
- 16
1.04
161.
04 -
161.
1416
1.14
- 16
1.24
161.
24 -
161.
3416
1.34
- 16
1.44
Brid
ge -
161.
74 -
161.
8416
1.84
- 16
1.94
161.
94 -
162.
0416
2.04
- 16
2.14
Brid
ge -
162.
37 -
162.
4216
2.42
- 16
2.52
162.
52 -
162.
6216
2.62
- 16
2.72
Brid
ge -
164.
33 -
164.
416
4.4
- 164
.516
4.5
- 164
.616
4.6
- 164
.7Br
idge
-
164.
93 -
164.
9816
4.98
- 16
5.08
165.
08 -
165.
18Br
idge
-
165.
44 -
165.
4816
5.48
- 16
5.58
165.
58 -
165.
68
Mile Post
Southbound Lane 4 Percentage of Panels with 2 or More Cracks MP 159.71 to MP 165.68
M-25

05
101520253035404550556065707580859095
100
Perc
enta
ge o
f Pan
els
with
2 o
r Mor
e C
rack
s16
5.68
- 16
5.78
165.
78 -
165.
8816
5.88
- 16
5.98
165.
98 -
166.
0816
6.08
- 16
6.18
166.
18 -
166.
28Br
idge
-
167.
72 -
167.
7416
7.74
- 16
7.84
167.
84 -
167.
9416
7.94
- 16
8.04
168.
04 -
168.
1416
8.14
- 16
8.24
Brid
ge -
169.
18 -
169.
2516
9.25
- 16
9.35
169.
35 -
169.
4516
9.45
- 16
9.55
169.
55 -
169.
6516
9.65
- 16
9.75
169.
75 -
169.
8516
9.85
- 16
9.95
169.
95 -
170.
0517
0.05
- 17
0.15
170.
15 -
170.
25Br
idge
-
170.
59 -
170.
6917
0.69
- 17
0.79
170.
79 -
170.
8917
0.89
- 17
0.99
170.
99 -
171.
0917
1.09
- 17
1.19
171.
19 -
171.
2917
1.29
- 17
1.39
171.
39 -
171.
4917
1.49
- 17
1.59
171.
59 -
171.
6917
1.69
- 17
1.79
171.
79 -
171.
8917
1.89
- 17
1.92
Mile Post
Southbound Lane 4 Percentage of Panels with 2 or More Cracks MP 165.68 to MP 171.92
05
101520253035404550556065707580859095
100
Perc
enta
ge o
f Pan
els
with
2 o
r Mor
e C
rack
s17
1.92
- 17
2.02
172.
02 -
172.
1217
2.12
- 17
2.22
172.
22 -
172.
3217
2.32
- 17
2.42
172.
42 -
172.
5217
2.52
- 17
2.54
172.
54 -
172.
6417
2.64
- 17
2.74
Brid
ge -
172.
84 -
172.
9417
2.94
- 17
3.04
173.
04 -
173.
1417
3.14
- 17
3.24
173.
24 -
173.
3417
3.34
- 17
3.44
173.
44 -
173.
5417
3.54
- 17
3.64
173.
64 -
173.
7417
3.74
- 17
3.84
173.
84 -
173.
9417
3.94
- 17
4.04
174.
04 -
174.
1417
4.14
- 17
4.21
174.
21 -
174.
3117
4.31
- 17
4.41
174.
41 -
174.
5117
4.51
- 17
4.61
174.
61 -
174.
7117
4.71
- 17
4.81
174.
81 -
174.
9117
4.91
- 17
5.01
Brid
ge -
175.
23 -
175.
3317
5.33
- 17
5.43
Brid
ge -
175.
53 -
175.
6317
5.63
- 17
5.73
175.
73 -
175.
8317
5.83
- 17
5.93
Mile Post
Southbound Lane 4 Percentage of Panels with 2 or More Cracks MP 171.92 to MP 175.93
M-26

05
101520253035404550556065707580859095
100
Perc
enta
ge o
f Pan
els
with
2 o
r Mor
e C
rack
s
175.
93 -
176.
0317
6.03
- 17
6.13
176.
16 -
176.
16
Brid
ge -
176.
26 -
176.
3617
6.36
- 17
6.46
176.
46 -
176.
5617
6.56
- 17
6.66
176.
66 -
176.
7617
6.76
- 17
6.86
176.
86 -
176.
9617
6.96
- 17
7.05
177.
05 -
177.
1517
7.15
- 17
7.25
177.
25 -
177.
3517
7.35
- 17
7.45
177.
45 -
177.
5517
7.55
- 17
7.65
Mile Post
Southbound Lane 4 Percentage of Panels with 2 or More Cracks MP 175.93 to MP 177.65
M-27

Appendix N – Percentage of Cracked Panels and Average Faulting
N-1

Northbound Lane 1 Percentage of Cracked Panels and Average Faulting MP 139.5 to MP 143.92
139.
5 - 1
39.6
139.
6 - 1
39.7
139.
7 - 1
39.8
139.
8 - 1
39.9
139.
9 - 1
4014
0 - 1
40.1
140.
2 - 1
40.3
140.
3 - 1
40.4
140.
4 - 1
40.5
140.
5 - 1
40.6
140.
6 - 1
40.7
140.
7 - 1
40.8
140.
8 - 1
40.9
140.
9 - 1
4114
1 - 1
41.1
141.
1 - 1
41.2
141.
3 - 1
41.4
141.
4 - 1
41.5
141.
5 - 1
41.6
141.
7 - 1
41.8
141.
8 - 1
41.9
141.
9 - 1
4214
2.04
- 14
2.14
142.
14 -
142.
2414
2.24
- 14
2.34
142.
34 -
142.
4414
2.44
- 14
2.54
142.
54 -
142.
6414
2.64
- 14
2.74
142.
92 -
143.
0214
3.02
- 14
3.12
143.
12 -
143.
2214
3.22
- 14
3.32
143.
32 -
143.
4214
3.42
- 14
3.52
143.
52 -
143.
6214
3.62
- 14
3.72
143.
72 -
143.
8214
3.82
- 14
3.92
0
10
20
30
40
50
60
70
80
90
100Pe
rcen
tage
of C
rack
ed P
anel
s an
d A
vera
ge
Faul
ting
(1/1
00 in
)
Mile PostAverage FaultingPercentage of Cracked Panels
Northbound Lane 1 Percentage of Cracked Panels and Average Faulting MP 143.92 to MP 148.17
143.
92 -
144.
0214
4.02
- 14
4.12
144.
12 -
144.
19
144.
19 -
144.
2914
4.29
- 14
4.39
144.
39 -
144.
49
144.
49 -
144.
59Br
idge
-
144.
79 -
144.
8914
4.89
- 14
4.99
144.
99 -
145.
0914
5.09
- 14
5.19
145.
19 -
145.
2914
5.29
- 14
5.39
145.
39 -
145.
4914
5.49
- 14
5.59
145.
59 -
145.
69Br
idge
-
145.
89 -
145.
9914
5.99
- 14
6.09
146.
09 -
146.
1914
6.19
- 14
6.29
146.
29 -
146.
3314
6.33
- 14
6.43
Brid
ge -
146.
53 -
146.
6314
6.63
- 14
6.73
Brid
ge -
146.
93 -
147.
0314
7.03
- 14
7.13
147.
13 -
147.
2314
7.23
- 14
7.33
147.
33 -
147.
4314
7.43
- 14
7.53
147.
53 -
147.
6314
7.63
- 14
7.64
147.
67 -
147.
7714
7.77
- 14
7.87
147.
87 -
147.
9714
7.97
- 14
8.07
148.
07 -
148.
17
0
10
20
30
40
50
60
70
80
90
100
Perc
enta
ge o
f Cra
cked
Pan
els
and
Ave
rage
Fa
ultin
g (1
/100
in)
Mile PostAverage FaultingPercentage of Cracked Panels
N-2

Northbound Lane 1 Percentage of Cracked Panels and Average Faulting MP 148.17 to MP 152.13
148.
17 -
148.
2714
8.27
- 14
8.37
148.
37 -
148.
4714
8.47
- 14
8.57
148.
57 -
148.
6714
8.67
- 14
8.77
148.
77 -
148.
8714
8.87
- 14
8.97
148.
97 -
149.
07Br
idge
-
149.
22 -
149.
3214
9.32
- 14
9.42
149.
42 -
149.
5214
9.52
- 14
9.62
149.
62 -
149.
7214
9.72
- 14
9.82
149.
82 -
149.
9214
9.92
- 15
0.02
150.
02 -
150.
1215
0.12
- 15
0.22
150.
22 -
150.
3215
0.32
- 15
0.42
150.
42 -
150.
5215
0.52
- 15
0.62
150.
62 -
150.
7215
0.72
- 15
0.82
150.
82 -
150.
9215
0.92
- 15
1.02
151.
02 -
151.
1215
1.12
- 15
1.22
151.
22 -
151.
2315
1.23
- 15
1.33
151.
33 -
151.
4315
1.43
- 15
1.53
151.
53 -
151.
6315
1.63
- 15
1.73
151.
73 -
151.
8315
1.83
- 15
1.93
151.
93 -
152.
0315
2.03
- 15
2.13
0
10
20
30
40
50
60
70
80
90
100Pe
rcen
tage
of C
rack
ed P
anel
s an
d A
vera
ge
Faul
ting
(1/1
00 in
)
Mile PostAverage FaultingPercentage of Cracked Panels
Northbound Lane 1 Percentage of Cracked Panels and Average Faulting MP 152.13 to MP 160.41
152.
13 -
152.
23Br
idge
-
152.
39 -
152.
49
152.
49 -
152.
5915
2.59
- 15
2.69
152.
69 -
152.
79
152.
79 -
152.
8915
2.89
- 15
2.99
152.
99 -
153.
09
153.
09 -
153.
1915
3.19
- 15
3.2
153.
2 - 1
53.3
153.
3 - 1
53.4
153.
4 - 1
53.5
153.
5 - 1
53.6
Brid
ge -
153.
8 - 1
53.9
153.
9 - 1
5415
4 - 1
54.1
154.
1 - 1
54.1
4
Diam
ond
Gro
und
-
158.
51 -
158.
6115
8.61
- 15
8.71
158.
71 -
158.
8115
8.81
- 15
8.91
158.
91 -
159.
0115
9.01
- 15
9.1
159.
1 - 1
59.2
159.
2 - 1
59.3
159.
3 - 1
59.4
159.
4 - 1
59.5
159.
5 - 1
59.6
Brid
ge -
159.
71 -
159.
8115
9.81
- 15
9.91
159.
91 -
160.
0116
0.01
- 16
0.11
160.
11 -
160.
2116
0.21
- 16
0.31
160.
31 -
160.
41
0
10
20
30
40
50
60
70
80
90
100
Perc
enta
ge o
f Cra
cked
Pan
els
and
Ave
rage
Fa
ultin
g (1
/100
in)
Mile PostAverage FaultingPercentage of Cracked Panels
N-3

Northbound Lane 1 Percentage of Cracked Panels and Average Faulting MP 160.41 to MP 169.78
160.
41 -
160.
51
160.
51 -
160.
6116
0.61
- 16
0.71
160.
71 -
160.
75
160.
75 -
160.
8516
0.85
- 16
0.95
160.
95 -
161.
0516
1.05
- 16
1.15
161.
15 -
161.
2516
1.25
- 16
1.35
161.
35 -
161.
4516
1.45
- 16
1.55
Brid
ge -
161.
78 -
161.
8816
1.88
- 16
1.98
161.
98 -
162.
0816
2.08
- 16
2.18
Brid
ge -
162.
36 -
162.
4616
2.46
- 16
2.56
162.
56 -
162.
5716
6.21
- 16
6.31
166.
31 -
166.
4116
6.41
- 16
6.51
166.
51 -
166.
6116
6.61
- 16
6.71
166.
71 -
166.
8116
6.81
- 16
6.91
166.
98 -
167.
0816
7.08
- 16
7.18
167.
18 -
167.
28Br
idge
-
168.
23 -
168.
3316
8.33
- 16
8.34
Brid
ge -
169.
28 -
169.
3816
9.38
- 16
9.48
169.
48 -
169.
5816
9.58
- 16
9.68
169.
68 -
169.
78
0
10
20
30
40
50
60
70
80
90
100Pe
rcen
tage
of C
rack
ed P
anel
s an
d A
vera
ge
Faul
ting
(1/1
00 in
)
Mile PostAverage FaultingPercentage of Cracked Panels
Northbound Lane 1 Percentage of Cracked Panels and Average Faulting MP 169.78 to MP 175.79
169.
78 -
169.
8816
9.88
- 16
9.98
169.
98 -
170.
0817
0.08
- 17
0.18
170.
18 -
170.
25Br
idge
-
172.
49 -
172.
5917
2.59
- 17
2.69
Brid
ge -
172.
89 -
172.
9917
2.99
- 17
3.09
173.
09 -
173.
1917
3.19
- 17
3.29
173.
29 -
173.
3917
3.39
- 17
3.49
173.
49 -
173.
5917
3.59
- 17
3.69
173.
69 -
173.
7917
3.79
- 17
3.89
173.
89 -
173.
9917
3.99
- 17
4.09
174.
09 -
174.
1417
4.14
- 17
4.24
174.
24 -
174.
3417
4.34
- 17
4.44
174.
44 -
174.
5417
4.54
- 17
4.64
174.
64 -
174.
7417
4.74
- 17
4.84
174.
84 -
174.
9417
4.94
- 17
5.04
175.
04 -
175.
11Br
idge
- 17
5.24
- 17
5.34
175.
34 -
175.
44Br
idge
- 17
5.64
- 17
5.74
175.
74 -
175.
79
0
10
20
30
40
50
60
70
80
90
100
Perc
enta
ge o
f Cra
cked
Pan
els
and
Ave
rage
Fa
ultin
g (1
/100
in)
Mile PostAverage FaultingPercentage of Cracked Panels
N-4

Northbound Lane 2 Percentage of Cracked Panels and Average Faulting MP 139.5 to MP 143.72
139.
5 - 1
39.6
139.
6 - 1
39.7
139.
7 - 1
39.8
139.
8 - 1
39.9
139.
9 - 1
4014
0 - 1
40.1
140.
1 - 1
40.2
140.
2 - 1
40.3
140.
3 - 1
40.4
140.
4 - 1
40.5
140.
5 - 1
40.6
140.
6 - 1
40.7
140.
7 - 1
40.8
140.
8 - 1
40.9
140.
9 - 1
4114
1 - 1
41.1
141.
1 - 1
41.2
141.
2 - 1
41.3
141.
3 - 1
41.4
141.
4 - 1
41.5
141.
5 - 1
41.6
141.
6 - 1
41.7
141.
7 - 1
41.8
141.
8 - 1
41.9
141.
9 - 1
4214
2.04
- 14
2.14
142.
14 -
142.
2414
2.24
- 14
2.34
142.
34 -
142.
4414
2.44
- 14
2.54
142.
54 -
142.
6414
2.64
- 14
2.74
142.
74 -
142.
7914
2.82
- 14
2.92
142.
92 -
143.
0214
3.02
- 14
3.12
143.
12 -
143.
2214
3.22
- 14
3.32
143.
32 -
143.
4214
3.42
- 14
3.52
143.
52 -
143.
6214
3.62
- 14
3.72
0
10
20
30
40
50
60
70
80
90
100Pe
rcen
tage
of C
rack
ed P
anel
s an
d A
vera
ge
Faul
ting
(1/1
00 in
)
Mile PostAverage FaultingPercentage of Cracked Panels
Northbound Lane 2 Percentage of Cracked Panels and Average Faulting MP 143.72 to MP 148.17
143.
72 -
143.
82Br
idge
-
143.
92 -
144.
02
144.
02 -
144.
12
144.
12 -
144.
19
144.
19 -
144.
29
144.
29 -
144.
39
144.
39 -
144.
49
144.
49 -
144.
59Br
idge
-
144.
79 -
144.
8914
4.89
- 14
4.99
144.
99 -
145.
0914
5.09
- 14
5.19
145.
19 -
145.
2914
5.29
- 14
5.39
145.
39 -
145.
49
145.
49 -
145.
5914
5.59
- 14
5.69
Brid
ge -
145.
89 -
145.
9914
5.99
- 14
6.09
146.
09 -
146.
1914
6.19
- 14
6.29
146.
29 -
146.
3314
6.33
- 14
6.43
Brid
ge -
146.
53 -
146.
6314
6.63
- 14
6.73
Brid
ge -
146.
93 -
147.
0314
7.03
- 14
7.13
147.
13 -
147.
2314
7.23
- 14
7.33
147.
33 -
147.
4314
7.43
- 14
7.53
147.
53 -
147.
63Br
idge
-
147.
77 -
147.
8714
7.87
- 14
7.97
147.
97 -
148.
0714
8.07
- 14
8.17
0
10
20
30
40
50
60
70
80
90
100
Perc
enta
ge o
f Cra
cked
Pan
els
and
Ave
rage
Fa
ultin
g (1
/100
in)
Mile PostAverage FaultingPercentage of Cracked Panels
N-5

Northbound Lane 2 Percentage of Cracked Panels and Average Faulting MP 148.17 to MP 152.23
148.
17 -
148.
27
148.
27 -
148.
37
148.
37 -
148.
47
148.
47 -
148.
57
148.
57 -
148.
67
148.
67 -
148.
77
148.
77 -
148.
87
148.
87 -
148.
97
148.
97 -
149.
07Br
idge
-
149.
22 -
149.
32
149.
32 -
149.
4214
9.42
- 14
9.52
149.
52 -
149.
6214
9.62
- 14
9.72
149.
72 -
149.
82
149.
82 -
149.
9214
9.92
- 15
0.02
150.
02 -
150.
1215
0.12
- 15
0.22
150.
22 -
150.
3215
0.32
- 15
0.42
150.
42 -
150.
5215
0.52
- 15
0.62
150.
62 -
150.
7215
0.72
- 15
0.82
150.
82 -
150.
9215
0.92
- 15
1.02
151.
02 -
151.
1215
1.12
- 15
1.22
151.
22 -
151.
2315
1.23
- 15
1.33
151.
33 -
151.
4315
1.43
- 15
1.53
151.
53 -
151.
6315
1.63
- 15
1.73
151.
73 -
151.
8315
1.83
- 15
1.93
151.
93 -
152.
0315
2.03
- 15
2.13
152.
13 -
152.
23Br
idge
-
0
10
20
30
40
50
60
70
80
90
100Pe
rcen
tage
of C
rack
ed P
anel
s an
d A
vera
ge
Faul
ting
(1/1
00 in
)
Mile PostAverage FaultingPercentage of Cracked Panels
Northbound Lane 2 Percentage of Cracked Panels and Average Faulting MP 152.39 to MP 160.51
152.
39 -
152.
49
152.
49 -
152.
59
152.
59 -
152.
69
152.
69 -
152.
79
152.
79 -
152.
89
152.
89 -
152.
99
152.
99 -
153.
09
153.
09 -
153.
1915
3.19
- 15
3.2
153.
2 - 1
53.3
153.
3 - 1
53.4
153.
4 - 1
53.5
153.
5 - 1
53.6
153.
6 - 1
53.7
153.
7 - 1
53.8
153.
8 - 1
53.9
153.
9 - 1
5415
4 - 1
54.1
154.
1 - 1
54.1
4
Diam
ond
Gro
und
-
158.
31 -
158.
41Br
idge
-
158.
51 -
158.
6115
8.61
- 15
8.71
158.
71 -
158.
8115
8.81
- 15
8.91
158.
91 -
159.
0115
9.01
- 15
9.1
159.
1 - 1
59.2
159.
2 - 1
59.3
159.
3 - 1
59.4
159.
4 - 1
59.5
159.
5 - 1
59.6
159.
6 - 1
59.6
715
9.71
- 15
9.81
159.
81 -
159.
9115
9.91
- 16
0.01
160.
01 -
160.
1116
0.11
- 16
0.21
160.
21 -
160.
3116
0.31
- 16
0.41
160.
41 -
160.
51
0
10
20
30
40
50
60
70
80
90
100
Perc
enta
ge o
f Cra
cked
Pan
els
and
Ave
rage
Fa
ultin
g (1
/100
in)
Mile PostAverage FaultingPercentage of Cracked Panels
N-6

Northbound Lane 2 Percentage of Cracked Panels and Average Faulting MP 160.51 to MP 167.28
160.
51 -
160.
61
160.
61 -
160.
71
160.
71 -
160.
75
160.
75 -
160.
85
160.
85 -
160.
95
160.
95 -
161.
05
161.
05 -
161.
15
161.
15 -
161.
25
161.
25 -
161.
3516
1.35
- 16
1.45
161.
45 -
161.
55
161.
55 -
161.
65Br
idge
-
161.
78 -
161.
88
161.
88 -
161.
9816
1.98
- 16
1.99
162
- 162
.1Br
idge
- 16
2.4
- 162
.516
2.5
- 162
.616
2.6
- 162
.716
2.7
- 162
.816
2.8
- 162
.82
Brid
ge -
164.
47 -
164.
57Br
idge
-
164.
67 -
164.
7716
4.77
- 16
4.8
164.
95 -
165.
0516
5.05
- 16
5.15
165.
15 -
165.
25Br
idge
-
166.
31 -
166.
4116
6.41
- 16
6.51
166.
51 -
166.
6116
6.61
- 16
6.71
166.
71 -
166.
8116
6.81
- 16
6.91
166.
98 -
167.
0816
7.08
- 16
7.18
167.
18 -
167.
28Br
idge
-
0
10
20
30
40
50
60
70
80
90
100Pe
rcen
tage
of C
rack
ed P
anel
s an
d A
vera
ge
Faul
ting
(1/1
00 in
)
Mile PostAverage FaultingPercentage of Cracked Panels
Northbound Lane 2 Percentage of Cracked Panels and Average Faulting MP 160.77 to MP 173.19
167.
77 -
167.
87
167.
87 -
167.
97
167.
97 -
168.
07
168.
07 -
168.
17
168.
17 -
168.
27Br
idge
-
169.
28 -
169.
3816
9.38
- 16
9.48
169.
48 -
169.
58
169.
58 -
169.
6816
9.68
- 16
9.78
169.
78 -
169.
8816
9.88
- 16
9.98
169.
98 -
170.
0817
0.08
- 17
0.18
Brid
ge -
170.
6 - 1
70.7
170.
7 - 1
70.8
170.
8 - 1
70.9
170.
9 - 1
7117
1 - 1
71.1
171.
1 - 1
71.2
171.
2 - 1
71.3
171.
3 - 1
71.4
171.
4 - 1
71.5
171.
5 - 1
71.6
171.
6 - 1
71.7
171.
7 - 1
71.8
171.
8 - 1
71.9
171.
9 - 1
7217
2 - 1
72.1
172.
1 - 1
72.2
172.
2 - 1
72.3
Brid
ge -
172.
4 - 1
72.5
172.
5 - 1
72.6
172.
6 - 1
72.7
172.
7 - 1
72.7
6Br
idge
-
172.
89 -
172.
9917
2.99
- 17
3.09
173.
09 -
173.
19
0
10
20
30
40
50
60
70
80
90
100
Perc
enta
ge o
f Cra
cked
Pan
els
and
Ave
rage
Fa
ultin
g (1
/100
in)
Mile PostAverage FaultingPercentage of Cracked Panels
N-7

Northbound Lane 2 Percentage of Cracked Panels and Average Faulting MP 173.19 to MP 177.75
0
10
20
30
40
50
60
70
80
90
100Pe
rcen
tage
of C
rack
ed P
anel
s an
d A
vera
ge
Faul
ting
(1/1
00 in
)
Mile PostAverage FaultingPercentage of Cracked Panels
Northbound Lane 3 Percentage of Cracked Panels and Average Faulting MP 139.5 to MP 143.82
0
10
20
30
40
50
60
70
80
90
100
Perc
enta
ge o
f Cra
cked
Pan
els
and
Ave
rage
Fa
ultin
g (1
/100
in)
Mile PostAverage FaultingPercentage of Cracked Panels
N-8

Northbound Lane 3 Percentage of Cracked Panels and Average Faulting MP 143.82 to MP 148.27
143.
82 -
143.
92
143.
92 -
144.
02
144.
02 -
144.
12
144.
12 -
144.
19
144.
19 -
144.
29
144.
29 -
144.
39
144.
39 -
144.
49
144.
49 -
144.
59Br
idge
-
144.
79 -
144.
89
144.
89 -
144.
9914
4.99
- 14
5.09
145.
09 -
145.
1914
5.19
- 14
5.29
145.
29 -
145.
3914
5.39
- 14
5.49
145.
49 -
145.
59
145.
59 -
145.
69Br
idge
-
145.
89 -
145.
9914
5.99
- 14
6.09
146.
09 -
146.
1914
6.19
- 14
6.29
146.
29 -
146.
33Br
idge
-
146.
53 -
146.
6314
6.63
- 14
6.73
Brid
ge -
146.
93 -
147.
0314
7.03
- 14
7.13
147.
13 -
147.
2314
7.23
- 14
7.33
147.
33 -
147.
4314
7.43
- 14
7.53
147.
53 -
147.
6314
7.63
- 14
7.64
Brid
ge -
147.
77 -
147.
8714
7.87
- 14
7.97
147.
97 -
148.
0714
8.07
- 14
8.17
148.
17 -
148.
27
0
10
20
30
40
50
60
70
80
90
100Pe
rcen
tage
of C
rack
ed P
anel
s an
d A
vera
ge
Faul
ting
(1/1
00 in
)
Mile PostAverage FaultingPercentage of Cracked Panels
Northbound Lane 3 Percentage of Cracked Panels and Average Faulting MP 148.27 to MP 152.69
148.
27 -
148.
37
148.
37 -
148.
47
148.
47 -
148.
57
148.
57 -
148.
67
148.
67 -
148.
77
148.
77 -
148.
87
148.
87 -
148.
97
148.
97 -
149.
07Br
idge
-
149.
32 -
149.
4214
9.42
- 14
9.52
149.
52 -
149.
62
149.
62 -
149.
7214
9.72
- 14
9.82
149.
82 -
149.
9214
9.92
- 15
0.02
150.
02 -
150.
12
150.
12 -
150.
2215
0.22
- 15
0.32
150.
32 -
150.
4215
0.42
- 15
0.52
150.
52 -
150.
6215
0.62
- 15
0.72
150.
72 -
150.
8215
0.82
- 15
0.92
150.
92 -
151.
0215
1.02
- 15
1.12
151.
12 -
151.
2215
1.22
- 15
1.23
151.
23 -
151.
3315
1.33
- 15
1.43
151.
43 -
151.
5315
1.53
- 15
1.63
151.
63 -
151.
7315
1.73
- 15
1.83
151.
83 -
151.
9315
1.93
- 15
2.03
152.
03 -
152.
1315
2.13
- 15
2.23
Brid
ge -
152.
39 -
152.
4915
2.49
- 15
2.59
152.
59 -
152.
69
0
10
20
30
40
50
60
70
80
90
100
Perc
enta
ge o
f Cra
cked
Pan
els
and
Ave
rage
Fa
ultin
g (1
/100
in)
Mile PostAverage FaultingPercentage of Cracked Panels
N-9

Northbound Lane 3 Percentage of Cracked Panels and Average Faulting MP 152.69 to MP 161.05
152.
69 -
152.
79
152.
79 -
152.
89
152.
89 -
152.
99
152.
99 -
153.
09
153.
09 -
153.
1915
3.19
- 15
3.2
153.
2 - 1
53.3
153.
3 - 1
53.4
153.
4 - 1
53.5
153.
5 - 1
53.6
Brid
ge -
153.
8 - 1
53.9
153.
9 - 1
5415
4 - 1
54.1
154.
1 - 1
54.1
4
Diam
ond
Gro
und
-
158.
31 -
158.
41
158.
41 -
158.
51
158.
51 -
158.
6115
8.61
- 15
8.71
158.
71 -
158.
8115
8.81
- 15
8.91
158.
91 -
159.
0115
9.01
- 15
9.1
159.
1 - 1
59.2
159.
2 - 1
59.3
159.
3 - 1
59.4
159.
4 - 1
59.5
159.
5 - 1
59.6
Brid
ge -
159.
81 -
159.
9115
9.91
- 16
0.01
160.
01 -
160.
1116
0.11
- 16
0.21
160.
21 -
160.
3116
0.31
- 16
0.41
160.
41 -
160.
5116
0.51
- 16
0.61
160.
61 -
160.
7116
0.71
- 16
0.75
160.
75 -
160.
8516
0.85
- 16
0.95
160.
95 -
161.
05
0
10
20
30
40
50
60
70
80
90
100Pe
rcen
tage
of C
rack
ed P
anel
s an
d A
vera
ge
Faul
ting
(1/1
00 in
)
Mile PostAverage FaultingPercentage of Cracked Panels
Northbound Lane 3 Percentage of Cracked Panels and Average Faulting MP 161.05 to MP 169.48
161.
05 -
161.
15
161.
15 -
161.
25
161.
25 -
161.
35
161.
35 -
161.
45
161.
45 -
161.
55Br
idge
-
161.
78 -
161.
88
161.
88 -
161.
98
161.
98 -
162.
08
162.
08 -
162.
18
162.
18 -
162.
19Br
idge
-
162.
46 -
162.
56
162.
56 -
162.
6616
2.66
- 16
2.76
Brid
ge -
164.
37 -
164.
4716
4.47
- 16
4.57
Brid
ge -
164.
67 -
164.
77Br
idge
-
165.
03 -
165.
1316
5.13
- 16
5.23
Brid
ge -
166.
31 -
166.
4116
6.41
- 16
6.51
166.
51 -
166.
6116
6.61
- 16
6.71
166.
71 -
166.
8116
6.81
- 16
6.91
Brid
ge -
167.
08 -
167.
1816
7.18
- 16
7.28
Brid
ge -
167.
77 -
167.
8716
7.87
- 16
7.97
167.
97 -
168.
0716
8.07
- 16
8.17
168.
17 -
168.
2716
8.27
- 16
8.34
Brid
ge -
169.
28 -
169.
3816
9.38
- 16
9.48
0
10
20
30
40
50
60
70
80
90
100
Perc
enta
ge o
f Cra
cked
Pan
els
and
Ave
rage
Fa
ultin
g (1
/100
in)
Mile PostAverage FaultingPercentage of Cracked Panels
N-10

Northbound Lane 3 Percentage of Cracked Panels and Average Faulting MP 169.48 to MP 174.14
169.
48 -
169.
58
169.
58 -
169.
68
169.
68 -
169.
78
169.
78 -
169.
88
169.
88 -
169.
98
169.
98 -
170.
08
170.
08 -
170.
18Br
idge
- 17
0.6
- 170
.717
0.7
- 170
.817
0.8
- 170
.917
0.9
- 171
171
- 171
.117
1.1
- 171
.217
1.2
- 171
.317
1.3
- 171
.417
1.4
- 171
.517
1.5
- 171
.617
1.6
- 171
.717
1.7
- 171
.817
1.8
- 171
.917
1.9
- 172
172
- 172
.117
2.1
- 172
.217
2.2
- 172
.3Br
idge
- 17
2.4
- 172
.517
2.5
- 172
.617
2.6
- 172
.7Br
idge
-
172.
89 -
172.
9917
2.99
- 17
3.09
173.
09 -
173.
1917
3.19
- 17
3.29
173.
29 -
173.
3917
3.39
- 17
3.49
173.
49 -
173.
5917
3.59
- 17
3.69
173.
69 -
173.
7917
3.79
- 17
3.89
173.
89 -
173.
9917
3.99
- 17
4.09
174.
09 -
174.
14
0
10
20
30
40
50
60
70
80
90
100Pe
rcen
tage
of C
rack
ed P
anel
s an
d A
vera
ge
Faul
ting
(1/1
00 in
)
Mile PostAverage FaultingPercentage of Cracked Panels
Northbound Lane 3 Percentage of Cracked Panels and Average Faulting MP 174.14 to MP 177.7
174.
14 -
174.
2417
4.24
- 17
4.34
174.
34 -
174.
4417
4.44
- 17
4.54
174.
54 -
174.
6417
4.64
- 17
4.74
174.
74 -
174.
8417
4.84
- 17
4.94
174.
94 -
175.
0417
5.04
- 17
5.11
Brid
ge -
175.
24 -
175.
3417
5.34
- 17
5.44
Brid
ge -
175.
54 -
175.
6417
5.64
- 17
5.74
175.
74 -
175.
8417
5.84
- 17
5.94
175.
94 -
176.
0417
6.04
- 17
6.13
Brid
ge -
176.
26 -
176.
3617
6.36
- 17
6.46
176.
46 -
176.
5617
6.56
- 17
6.66
176.
66 -
176.
717
6.7
- 176
.817
6.8
- 176
.917
6.9
- 177
177
- 177
.117
7.1
- 177
.217
7.2
- 177
.317
7.3
- 177
.417
7.4
- 177
.517
7.5
- 177
.617
7.6
- 177
.7
0
10
20
30
40
50
60
70
80
90
100
Perc
enta
ge o
f Cra
cked
Pan
els
and
Ave
rage
Fa
ultin
g (1
/100
in)
Mile PostAverage FaultingPercentage of Cracked Panels
N-11

Northbound Lane 4 Percentage of Cracked Panels and Average Faulting MP 139.5 to MP 143.62
139.
5 - 1
39.6
139.
6 - 1
39.7
139.
7 - 1
39.8
139.
8 - 1
39.9
139.
9 - 1
4014
0 - 1
40.1
140.
1 - 1
40.2
140.
2 - 1
40.3
140.
3 - 1
40.4
140.
4 - 1
40.5
140.
5 - 1
40.6
140.
6 - 1
40.7
140.
7 - 1
40.8
140.
8 - 1
40.9
140.
9 - 1
4114
1 - 1
41.1
141.
1 - 1
41.2
141.
2 - 1
41.3
141.
3 - 1
41.4
141.
4 - 1
41.5
141.
5 - 1
41.6
141.
6 - 1
41.7
141.
7 - 1
41.8
141.
8 - 1
41.9
141.
9 - 1
4214
2.04
- 14
2.14
142.
14 -
142.
2414
2.24
- 14
2.34
142.
34 -
142.
4414
2.44
- 14
2.54
142.
54 -
142.
6414
2.64
- 14
2.74
142.
74 -
142.
7914
2.82
- 14
2.92
142.
92 -
143.
0214
3.02
- 14
3.12
143.
12 -
143.
2214
3.22
- 14
3.32
143.
32 -
143.
4214
3.42
- 14
3.52
143.
52 -
143.
62
0
10
20
30
40
50
60
70
80
90
100Pe
rcen
tage
of C
rack
ed P
anel
s an
d A
vera
ge
Faul
ting
(1/1
00 in
)
Mile PostAverage FaultingPercentage of Cracked Panels
Northbound Lane 4 Percentage of Cracked Panels and Average Faulting MP 143.62 to MP 147.87
143.
62 -
143.
72
143.
72 -
143.
8214
3.82
- 14
3.92
143.
92 -
144.
0214
4.02
- 14
4.12
144.
12 -
144.
19
144.
19 -
144.
2914
4.29
- 14
4.39
144.
39 -
144.
4914
4.49
- 14
4.59
Brid
ge -
144.
79 -
144.
8914
4.89
- 14
4.99
144.
99 -
145.
0914
5.09
- 14
5.19
145.
19 -
145.
2914
5.29
- 14
5.39
145.
39 -
145.
4914
5.49
- 14
5.59
145.
59 -
145.
69Br
idge
-
145.
89 -
145.
9914
5.99
- 14
6.09
146.
09 -
146.
1914
6.19
- 14
6.29
146.
29 -
146.
33Br
idge
-
146.
53 -
146.
6314
6.63
- 14
6.73
Brid
ge -
146.
93 -
147.
0314
7.03
- 14
7.13
147.
13 -
147.
2314
7.23
- 14
7.33
147.
33 -
147.
4314
7.43
- 14
7.53
147.
53 -
147.
63Br
idge
- 14
7.67
- 14
7.77
147.
77 -
147.
87
0
10
20
30
40
50
60
70
80
90
100
Perc
enta
ge o
f Cra
cked
Pan
els
and
Ave
rage
Fa
ultin
g (1
/100
in)
Mile PostAverage FaultingPercentage of Cracked Panels
N-12

Northbound Lane 4 Percentage of Cracked Panels and Average Faulting MP 147.87 to MP 151.97
147.
87 -
147.
9714
7.97
- 14
8.07
148.
07 -
148.
17
148.
17 -
148.
2714
8.27
- 14
8.37
148.
37 -
148.
47
148.
47 -
148.
5714
8.57
- 14
8.67
148.
67 -
148.
7714
8.77
- 14
8.87
148.
87 -
148.
9714
8.97
- 14
9.07
Brid
ge -
149.
22 -
149.
3214
9.32
- 14
9.42
149.
42 -
149.
5214
9.52
- 14
9.62
149.
62 -
149.
7214
9.72
- 14
9.82
149.
82 -
149.
9214
9.92
- 15
0.02
150.
02 -
150.
1215
0.12
- 15
0.22
150.
22 -
150.
3215
0.32
- 15
0.42
150.
42 -
150.
5215
0.52
- 15
0.62
150.
62 -
150.
7215
0.72
- 15
0.82
150.
82 -
150.
9215
0.92
- 15
1.02
151.
02 -
151.
1215
1.12
- 15
1.22
151.
22 -
151.
3215
1.32
- 15
1.42
151.
42 -
151.
5215
1.52
- 15
1.62
151.
62 -
151.
7215
1.72
- 15
1.82
151.
82 -
151.
9215
1.92
- 15
1.97
0
10
20
30
40
50
60
70
80
90
100Pe
rcen
tage
of C
rack
ed P
anel
s an
d A
vera
ge
Faul
ting
(1/1
00 in
)
Mile PostAverage FaultingPercentage of Cracked Panels
Northbound Lane 4 Percentage of Cracked Panels and Average Faulting MP 151.99 to MP 160.01
151.
99 -
152.
09
152.
09 -
152.
19
152.
19 -
152.
26
152.
29 -
152.
39
152.
39 -
152.
4915
2.49
- 15
2.59
152.
59 -
152.
69
152.
69 -
152.
7915
2.79
- 15
2.89
152.
89 -
152.
99
152.
99 -
153.
0915
3.09
- 15
3.19
153.
19 -
153.
215
3.2
- 153
.315
3.3
- 153
.415
3.4
- 153
.515
3.5
- 153
.615
3.6
- 153
.715
3.7
- 153
.815
3.8
- 153
.915
3.9
- 154
154
- 154
.115
4.1
- 154
.14
Diam
ond
Gro
und
-
158.
31 -
158.
4115
8.41
- 15
8.51
158.
51 -
158.
6115
8.61
- 15
8.71
158.
71 -
158.
8115
8.81
- 15
8.91
158.
91 -
159.
0115
9.01
- 15
9.1
159.
1 - 1
59.2
159.
2 - 1
59.3
159.
3 - 1
59.4
159.
4 - 1
59.5
159.
5 - 1
59.6
159.
6 - 1
59.6
715
9.71
- 15
9.81
159.
81 -
159.
9115
9.91
- 16
0.01
0
10
20
30
40
50
60
70
80
90
100
Perc
enta
ge o
f Cra
cked
Pan
els
and
Ave
rage
Fa
ultin
g (1
/100
in)
Mile PostAverage FaultingPercentage of Cracked Panels
N-13

Northbound Lane 4 Percentage of Cracked Panels and Average Faulting MP 160.01 to MP 166.41
160.
01 -
160.
11
160.
11 -
160.
2116
0.21
- 16
0.31
160.
31 -
160.
4116
0.41
- 16
0.51
160.
51 -
160.
6116
0.61
- 16
0.71
160.
71 -
160.
7516
0.75
- 16
0.85
160.
85 -
160.
9516
0.95
- 16
1.05
161.
05 -
161.
1516
1.15
- 16
1.25
161.
25 -
161.
3516
1.35
- 16
1.45
161.
45 -
161.
55Br
idge
-
161.
68 -
161.
7816
1.78
- 16
1.88
161.
88 -
161.
9816
1.98
- 16
2.08
162.
08 -
162.
18Br
idge
-
162.
36 -
162.
4616
2.46
- 16
2.56
162.
56 -
162.
6616
2.66
- 16
2.76
162.
76 -
162.
8216
2.96
- 16
3.04
163.
2 - 1
63.2
416
4.37
- 16
4.47
164.
47 -
164.
5716
4.57
- 16
4.67
164.
67 -
164.
7716
4.77
- 16
4.8
164.
93 -
165.
0316
5.03
- 16
5.13
165.
13 -
165.
23Br
idge
- 16
6.21
- 16
6.31
166.
31 -
166.
41
0
10
20
30
40
50
60
70
80
90
100Pe
rcen
tage
of C
rack
ed P
anel
s an
d A
vera
ge
Faul
ting
(1/1
00 in
)
Mile PostAverage FaultingPercentage of Cracked Panels
Northbound Lane 4 Percentage of Cracked Panels and Average Faulting MP166.41 to MP 172.5
166.
41 -
166.
5116
6.61
- 16
6.71
166.
81 -
166.
9116
7.08
- 16
7.18
167.
28 -
167.
3516
7.77
- 16
7.87
167.
97 -
168.
0716
8.17
- 16
8.27
169.
18 -
169.
2816
9.38
- 16
9.48
169.
58 -
169.
6816
9.78
- 16
9.88
169.
98 -
170.
08Br
idge
- 17
0.7
- 170
.817
0.9
- 171
171.
1 - 1
71.2
171.
3 - 1
71.4
171.
5 - 1
71.6
171.
7 - 1
71.8
171.
9 - 1
7217
2.1
- 172
.2
Brid
ge -
0
10
20
30
40
50
60
70
80
90
100
Perc
enta
ge o
f Cra
cked
Pan
els
and
Ave
rage
Fa
ultin
g (1
/100
in)
Mile PostAverage FaultingPercentage of Cracked Panels
N-14

Northbound Lane 4 Percentage of Cracked Panels and Average Faulting MP 172.5 to MP 177.75
172.
5 - 1
72.6
172.
7 - 1
72.7
617
2.89
- 17
2.99
173.
09 -
173.
1917
3.29
- 17
3.39
173.
49 -
173.
5917
3.69
- 17
3.79
173.
89 -
173.
9917
4.09
- 17
4.14
174.
24 -
174.
3417
4.44
- 17
4.54
174.
64 -
174.
7417
4.84
- 17
4.94
175.
04 -
175.
1117
5.24
- 17
5.34
175.
44 -
175.
5417
5.64
- 17
5.74
175.
84 -
175.
9417
6.04
- 17
6.13
176.
26 -
176.
3617
6.46
- 17
6.56
176.
66 -
176.
717
6.8
- 176
.917
7 - 1
77.1
177.
2 - 1
77.3
177.
4 - 1
77.5
177.
6 - 1
77.7
0
10
20
30
40
50
60
70
80
90
100Pe
rcen
tage
of C
rack
ed P
anel
s an
d A
vera
ge
Faul
ting
(1/1
00 in
)
Mile PostAverage FaultingPercentage of Cracked Panels
Southbound Lane 1 Percentage of Cracked Panels and Average Faulting MP 139.5 to MP 143.29
139.
5 - 1
39.6
139.
6 - 1
39.7
139.
7 - 1
39.8
139.
8 - 1
39.9
139.
9 - 1
4014
0 - 1
40.1
140.
1 - 1
40.2
140.
2 - 1
40.3
140.
3 - 1
40.4
140.
4 - 1
40.5
140.
5 - 1
40.6
140.
6 - 1
40.7
140.
7 - 1
40.8
140.
8 - 1
40.9
140.
9 - 1
4114
1 - 1
41.1
141.
1 - 1
41.2
141.
2 - 1
41.3
141.
3 - 1
41.4
141.
4 - 1
41.5
141.
5 - 1
41.6
141.
6 - 1
41.7
141.
7 - 1
41.8
141.
8 - 1
41.9
141.
9 - 1
4214
2.04
- 14
2.09
142.
09 -
142.
1914
2.19
- 14
2.29
142.
29 -
142.
3914
2.39
- 14
2.49
142.
49 -
142.
5914
2.59
- 14
2.69
142.
69 -
142.
7914
2.81
- 14
2.89
142.
89 -
142.
9914
2.99
- 14
3.09
143.
09 -
143.
1914
3.19
- 14
3.29
0
10
20
30
40
50
60
70
80
90
100
Perc
enta
ge o
f Cra
cked
Pan
els
and
Ave
rage
Fa
ultin
g (1
/100
in)
Mile PostAverage FaultingPercentage of Cracked Panels
N-15

Southbound Lane 1 Percentage of Cracked Panels and Average Faulting MP 139.5 to MP 143.29
143.
29 -
143.
3914
3.39
- 14
3.49
143.
49 -
143.
5914
3.59
- 14
3.69
143.
69 -
143.
7914
3.79
- 14
3.89
143.
89 -
143.
9914
3.99
- 14
4.09
144.
09 -
144.
1914
4.19
- 14
4.29
144.
29 -
144.
39DB
R an
d DG
-
146.
21 -
146.
31Br
idge
-
146.
51 -
146.
6114
6.61
- 14
6.71
Brid
ge -
146.
84 -
146.
9414
6.94
- 14
7.04
147.
04 -
147.
1414
7.14
- 14
7.24
147.
24 -
147.
3414
7.34
- 14
7.44
147.
44 -
147.
5414
7.54
- 14
7.58
DBR
and
DG -
149.
76 -
149.
8414
9.84
- 14
9.94
149.
94 -
150.
0415
0.04
- 15
0.14
150.
14 -
150.
2415
0.24
- 15
0.34
150.
34 -
150.
4415
0.44
- 15
0.54
150.
54 -
150.
6415
0.64
- 15
0.74
150.
74 -
150.
8415
0.84
- 15
0.94
0
10
20
30
40
50
60
70
80
90
100Pe
rcen
tage
of C
rack
ed P
anel
s an
d A
vera
ge
Faul
ting
(1/1
00 in
)
Mile PostAverage FaultingPercentage of Cracked Panels
Southbound Lane 1 Percentage of Cracked Panels and Average Faulting MP 150.94 to MP 158.96
150.
94 -
151.
0415
1.04
- 15
1.14
151.
14 -
151.
2415
1.24
- 15
1.34
151.
34 -
151.
4415
1.44
- 15
1.54
151.
54 -
151.
6415
1.64
- 15
1.74
151.
74 -
151.
8415
1.84
- 15
1.94
151.
94 -
152.
0415
2.04
- 15
2.14
152.
14 -
152.
15Br
idge
-
152.
35 -
152.
4515
2.45
- 15
2.55
152.
55 -
152.
6515
2.65
- 15
2.75
152.
75 -
152.
8515
2.85
- 15
2.95
152.
95 -
153.
0515
3.05
- 15
3.15
153.
15 -
153.
2415
3.24
- 15
3.34
153.
34 -
153.
4415
3.44
- 15
3.54
153.
54 -
153.
6415
3.64
- 15
3.74
153.
74 -
153.
8415
3.84
- 15
3.94
153.
94 -
154.
0415
4.04
- 15
4.06
Diam
ond
Gro
und
-
158.
46 -
158.
5615
8.56
- 15
8.66
158.
66 -
158.
7615
8.76
- 15
8.86
158.
86 -
158.
96
0
10
20
30
40
50
60
70
80
90
100
Perc
enta
ge o
f Cra
cked
Pan
els
and
Ave
rage
Fa
ultin
g (1
/100
in)
Mile PostAverage FaultingPercentage of Cracked Panels
N-16

Southbound Lane 1 Percentage of Cracked Panels and Average Faulting MP 158.98 to MP 166.06
158.
98 -
159.
0715
9.07
- 15
9.17
159.
17 -
159.
2715
9.27
- 15
9.37
159.
37 -
159.
4715
9.47
- 15
9.57
Brid
ge -
159.
71 -
159.
7515
9.75
- 15
9.85
159.
85 -
159.
9515
9.95
- 16
0.05
Brid
ge -
160.
25 -
160.
3516
0.35
- 16
0.45
160.
45 -
160.
5516
0.55
- 16
0.65
160.
65 -
160.
7516
0.75
- 16
0.85
160.
85 -
160.
9416
0.94
- 16
1.04
161.
04 -
161.
1416
1.14
- 16
1.24
161.
24 -
161.
3416
1.34
- 16
1.44
Brid
ge -
161.
74 -
161.
8416
1.84
- 16
1.94
161.
94 -
162.
0416
2.04
- 16
2.14
162.
14 -
162.
2416
2.37
- 16
2.42
162.
42 -
162.
5216
2.52
- 16
2.62
162.
62 -
162.
7216
2.72
- 16
2.82
165.
83 -
165.
8616
5.86
- 16
5.96
165.
96 -
166.
06
0
10
20
30
40
50
60
70
80
90
100Pe
rcen
tage
of C
rack
ed P
anel
s an
d A
vera
ge
Faul
ting
(1/1
00 in
)
Mile PostAverage FaultingPercentage of Cracked Panels
Southbound Lane 1 Percentage of Cracked Panels and Average Faulting MP 166.06 to MP 174.14
166.
06 -
166.
1616
6.16
- 16
6.26
166.
26 -
166.
3616
7.72
- 16
7.74
167.
74 -
167.
8416
7.84
- 16
7.94
167.
94 -
168.
0416
8.04
- 16
8.14
168.
14 -
168.
24Br
idge
-
169.
18 -
169.
2516
9.25
- 16
9.35
169.
35 -
169.
4516
9.45
- 16
9.55
169.
55 -
169.
6516
9.65
- 16
9.75
169.
75 -
169.
8516
9.85
- 16
9.95
169.
95 -
170.
0517
0.05
- 17
0.15
170.
15 -
170.
2517
2.52
- 17
2.54
172.
54 -
172.
6417
2.64
- 17
2.74
Brid
ge -
172.
84 -
172.
9417
2.94
- 17
3.04
173.
04 -
173.
1417
3.14
- 17
3.24
173.
24 -
173.
3417
3.34
- 17
3.44
173.
44 -
173.
5417
3.54
- 17
3.64
173.
64 -
173.
7417
3.74
- 17
3.84
173.
84 -
173.
9417
3.94
- 17
4.04
174.
04 -
174.
14
0
10
20
30
40
50
60
70
80
90
100
Perc
enta
ge o
f Cra
cked
Pan
els
and
Ave
rage
Fa
ultin
g (1
/100
in)
Mile PostAverage FaultingPercenatge of Cracked Panels
N-17

Southbound Lane 2 Percentage of Cracked Panels and Average Faulting MP 139.5 to MP 143.69
139.
5 - 1
39.6
139.
6 - 1
39.7
139.
7 - 1
39.8
139.
8 - 1
39.9
139.
9 - 1
4014
0 - 1
40.1
140.
1 - 1
40.2
140.
2 - 1
40.3
140.
3 - 1
40.4
140.
4 - 1
40.5
140.
5 - 1
40.6
140.
6 - 1
40.7
140.
7 - 1
40.8
140.
8 - 1
40.9
140.
9 - 1
4114
1 - 1
41.1
141.
1 - 1
41.2
141.
2 - 1
41.3
141.
3 - 1
41.4
141.
4 - 1
41.5
141.
5 - 1
41.6
141.
6 - 1
41.7
141.
7 - 1
41.8
141.
8 - 1
41.9
141.
9 - 1
4214
2.04
- 14
2.09
142.
09 -
142.
1914
2.19
- 14
2.29
142.
29 -
142.
3914
2.39
- 14
2.49
142.
49 -
142.
5914
2.59
- 14
2.69
142.
69 -
142.
7914
2.81
- 14
2.89
142.
89 -
142.
9914
2.99
- 14
3.09
143.
09 -
143.
1914
3.19
- 14
3.29
143.
29 -
143.
3914
3.39
- 14
3.49
143.
49 -
143.
5914
3.59
- 14
3.69
0
10
20
30
40
50
60
70
80
90
100Pe
rcen
tage
of C
rack
ed P
anel
s an
d A
vera
ge
Faul
ting
(1/1
00 in
)
Mile PostAverage FaultingPercentage of Cracked Panels
Southbound Lane 2 Percentage of Cracked Panels and Average Faulting MP 143.69 to MP 151.64
143.
69 -
143.
7914
3.79
- 14
3.89
143.
89 -
143.
99
143.
99 -
144.
0914
4.09
- 14
4.19
144.
19 -
144.
29
144.
29 -
144.
39DB
R an
d DG
-
146.
21 -
146.
31Br
idge
-
146.
51 -
146.
6114
6.61
- 14
6.71
Brid
ge -
146.
84 -
146.
9414
6.94
- 14
7.04
147.
04 -
147.
1414
7.14
- 14
7.24
147.
24 -
147.
3414
7.34
- 14
7.44
147.
44 -
147.
5414
7.54
- 14
7.58
DBR
and
DG -
149.
76 -
149.
8414
9.84
- 14
9.94
149.
94 -
150.
0415
0.04
- 15
0.14
150.
14 -
150.
2415
0.24
- 15
0.34
150.
34 -
150.
4415
0.44
- 15
0.54
150.
54 -
150.
6415
0.64
- 15
0.74
150.
74 -
150.
8415
0.84
- 15
0.94
150.
94 -
151.
0415
1.04
- 15
1.14
151.
14 -
151.
2415
1.24
- 15
1.34
151.
34 -
151.
4415
1.44
- 15
1.54
151.
54 -
151.
64
0
10
20
30
40
50
60
70
80
90
100
Perc
enta
ge o
f Cra
cked
Pan
els
and
Ave
rage
Fa
ultin
g (1
/100
in)
Mile Post
Southbound Lane 2 Percentage of Cracked Panels and Average Faulting MP 143.69 to MP 151.64
Average FaultingPercentage of Cracked Panels
N-18

Southbound Lane 2 Percentage of Cracked Panels and Average Faulting MP 151.64 to MP 159.95
151.
64 -
151.
74
151.
74 -
151.
84
151.
84 -
151.
94
151.
94 -
152.
04
152.
04 -
152.
1415
2.14
- 15
2.15
Brid
ge -
152.
35 -
152.
4515
2.45
- 15
2.55
152.
55 -
152.
65
152.
65 -
152.
7515
2.75
- 15
2.85
152.
85 -
152.
9515
2.95
- 15
3.05
153.
05 -
153.
1515
3.15
- 15
3.24
153.
24 -
153.
3415
3.34
- 15
3.44
153.
44 -
153.
5415
3.54
- 15
3.64
153.
64 -
153.
7415
3.74
- 15
3.84
153.
84 -
153.
9415
3.94
- 15
4.04
154.
04 -
154.
06
Diam
ond
Gro
und
- 15
8.5
- 158
.615
8.6
- 158
.715
8.7
- 158
.815
8.8
- 158
.915
8.9
- 159
159
- 159
.115
9.1
- 159
.17
159.
17 -
159.
2715
9.27
- 15
9.37
159.
37 -
159.
4715
9.47
- 15
9.57
159.
57 -
159.
6715
9.71
- 15
9.75
159.
75 -
159.
8515
9.85
- 15
9.95
0
10
20
30
40
50
60
70
80
90
100Pe
rcen
tage
of C
rack
ed P
anel
s an
d A
vera
ge
Faul
ting
(1/1
00 in
)
Mile PostAverage FaultingPercentage of Cracked Panels
Southbound Lane 2 Percentage of Cracked Panels and Average Faulting MP 160.25 to MP 169.25
Brid
ge -
160.
25 -
160.
3516
0.35
- 16
0.45
160.
45 -
160.
5516
0.55
- 16
0.65
160.
65 -
160.
7516
0.75
- 16
0.85
160.
85 -
160.
9416
0.94
- 16
1.04
161.
04 -
161.
1416
1.14
- 16
1.24
161.
24 -
161.
3416
1.34
- 16
1.44
Brid
ge -
161.
74 -
161.
8416
1.84
- 16
1.94
161.
94 -
162.
0416
2.04
- 16
2.14
Brid
ge -
162.
37 -
162.
4216
2.42
- 16
2.52
162.
52 -
162.
6216
2.62
- 16
2.72
Brid
ge -
165.
53 -
165.
5816
5.58
- 16
5.68
165.
68 -
165.
7816
5.78
- 16
5.88
165.
88 -
165.
9816
5.98
- 16
6.08
166.
08 -
166.
1816
6.18
- 16
6.28
Brid
ge -
167.
72 -
167.
7416
7.74
- 16
7.84
167.
84 -
167.
9416
7.94
- 16
8.04
168.
04 -
168.
1416
8.14
- 16
8.24
Brid
ge -
169.
18 -
169.
25
0
10
20
30
40
50
60
70
80
90
100
Perc
enta
ge o
f Cra
cked
Pan
els
and
Ave
rage
Fa
ultin
g (1
/100
in)
Mile PostAverage FaultingPercentage of Cracked Panels
N-19

Southbound Lane 2 Percentage of Cracked Panels and Average Faulting MP 169.25 to MP 173.44
169.
25 -
169.
35
169.
35 -
169.
4516
9.45
- 16
9.55
169.
55 -
169.
6516
9.65
- 16
9.75
169.
75 -
169.
8516
9.85
- 16
9.95
169.
95 -
170.
0517
0.05
- 17
0.15
170.
15 -
170.
25Br
idge
-
170.
59 -
170.
6917
0.69
- 17
0.79
170.
79 -
170.
8917
0.89
- 17
0.99
170.
99 -
171.
0917
1.09
- 17
1.19
171.
19 -
171.
2917
1.29
- 17
1.39
171.
39 -
171.
4917
1.49
- 17
1.59
171.
59 -
171.
6917
1.69
- 17
1.79
171.
79 -
171.
8917
1.89
- 17
1.92
171.
92 -
172.
0217
2.02
- 17
2.12
172.
12 -
172.
2217
2.22
- 17
2.32
172.
32 -
172.
4217
2.42
- 17
2.52
172.
52 -
172.
5417
2.54
- 17
2.64
172.
64 -
172.
74Br
idge
-
172.
84 -
172.
9417
2.94
- 17
3.04
173.
04 -
173.
1417
3.14
- 17
3.24
173.
24 -
173.
3417
3.34
- 17
3.44
0
10
20
30
40
50
60
70
80
90
100Pe
rcen
tage
of C
rack
ed P
anel
s an
d A
vera
ge
Faul
ting
(1/1
00 in
)
Mile PostAverage FaultingPercentage of Cracked Panels
Southbound Lane 2 Percentage of Cracked Panels and Average Faulting MP 173.44 to MP 177.65
173.
44 -
173.
54
173.
54 -
173.
64
173.
64 -
173.
74
173.
74 -
173.
84
173.
84 -
173.
94
173.
94 -
174.
04
174.
04 -
174.
1417
4.14
- 17
4.21
174.
21 -
174.
31
174.
31 -
174.
4117
4.41
- 17
4.51
174.
51 -
174.
6117
4.61
- 17
4.71
174.
71 -
174.
8117
4.81
- 17
4.91
174.
91 -
175.
01Br
idge
-
175.
23 -
175.
3317
5.33
- 17
5.43
Brid
ge -
175.
53 -
175.
6317
5.63
- 17
5.73
175.
73 -
175.
8317
5.83
- 17
5.93
175.
93 -
176.
03Br
idge
-
176.
16 -
176.
16Br
idge
-
176.
26 -
176.
3617
6.36
- 17
6.46
176.
46 -
176.
5617
6.56
- 17
6.66
176.
66 -
176.
7617
6.76
- 17
6.86
176.
86 -
176.
9617
6.96
- 17
7.05
177.
05 -
177.
1517
7.15
- 17
7.25
177.
25 -
177.
3517
7.35
- 17
7.45
177.
45 -
177.
5517
7.55
- 17
7.65
0
10
20
30
40
50
60
70
80
90
100
Perc
enta
ge o
f Cra
cked
Pan
els
and
Ave
rage
Fa
ultin
g (1
/100
in)
Mile PostAverage FaultingPercentage of Cracked Panels
N-20

Southbound Lane 3 Percentage of Cracked Panels and Average Faulting MP 139.5 to MP 143.69
139.
5 - 1
39.6
139.
6 - 1
39.7
139.
7 - 1
39.8
139.
8 - 1
39.9
139.
9 - 1
4014
0 - 1
40.1
140.
1 - 1
40.2
140.
2 - 1
40.3
140.
3 - 1
40.4
140.
4 - 1
40.5
140.
5 - 1
40.6
140.
6 - 1
40.7
140.
7 - 1
40.8
140.
8 - 1
40.9
140.
9 - 1
4114
1 - 1
41.1
141.
1 - 1
41.2
141.
2 - 1
41.3
141.
3 - 1
41.4
141.
4 - 1
41.5
141.
5 - 1
41.6
141.
6 - 1
41.7
141.
7 - 1
41.8
141.
8 - 1
41.9
141.
9 - 1
4214
2.04
- 14
2.09
142.
09 -
142.
1914
2.19
- 14
2.29
142.
29 -
142.
3914
2.39
- 14
2.49
142.
49 -
142.
5914
2.59
- 14
2.69
142.
69 -
142.
7914
2.81
- 14
2.89
142.
89 -
142.
9914
2.99
- 14
3.09
143.
09 -
143.
1914
3.19
- 14
3.29
143.
29 -
143.
3914
3.39
- 14
3.49
143.
49 -
143.
5914
3.59
- 14
3.69
0
10
20
30
40
50
60
70
80
90
100Pe
rcen
tage
of C
rack
ed P
anel
s an
d A
vera
ge
Faul
ting
(1/1
00 in
)
Mile PostAverage FaultingPercentage of Cracked Panels
Southbound Lane 3 Percentage of Cracked Panels and Average Faulting MP 143.69 to MP 151.74
143.
69 -
143.
79
143.
79 -
143.
89
143.
89 -
143.
99
143.
99 -
144.
09
144.
09 -
144.
19
144.
19 -
144.
29
144.
29 -
144.
39DB
R an
d DG
-
146.
21 -
146.
31Br
idge
-
146.
51 -
146.
6114
6.61
- 14
6.71
146.
71 -
146.
81Br
idge
-
146.
94 -
147.
0414
7.04
- 14
7.14
147.
14 -
147.
24
147.
24 -
147.
3414
7.34
- 14
7.44
147.
44 -
147.
5414
7.54
- 14
7.58
DBR
and
DG -
149.
76 -
149.
8414
9.84
- 14
9.94
149.
94 -
150.
0415
0.04
- 15
0.14
150.
14 -
150.
2415
0.24
- 15
0.34
150.
34 -
150.
4415
0.44
- 15
0.54
150.
54 -
150.
6415
0.64
- 15
0.74
150.
74 -
150.
8415
0.84
- 15
0.94
150.
94 -
151.
0415
1.04
- 15
1.14
151.
14 -
151.
2415
1.24
- 15
1.34
151.
34 -
151.
4415
1.44
- 15
1.54
151.
54 -
151.
6415
1.64
- 15
1.74
0
10
20
30
40
50
60
70
80
90
100
Perc
enta
ge o
f Cra
cked
Pan
els
and
Ave
rage
Fa
ultin
g (1
/100
in)
Mile PostAverage FaultingPercentage of Cracked Panels
N-21

Southbound Lane 3 Percentage of Cracked Panels and Average Faulting MP 151.74 to MP 161.14
151.
74 -
151.
84
151.
84 -
151.
94
151.
94 -
152.
04
152.
04 -
152.
14
152.
14 -
152.
15
152.
15 -
152.
25Br
idge
-
152.
35 -
152.
45
152.
45 -
152.
55
152.
55 -
152.
65
152.
65 -
152.
75
152.
75 -
152.
85
152.
85 -
152.
95
152.
95 -
153.
05
153.
05 -
153.
15
Diam
ond
Gro
und
- 15
8.5
- 158
.615
8.6
- 158
.715
8.7
- 158
.815
8.8
- 158
.915
8.9
- 159
159
- 159
.115
9.1
- 159
.17
159.
17 -
159.
2715
9.27
- 15
9.37
159.
37 -
159.
4715
9.47
- 15
9.57
159.
57 -
159.
67Br
idge
-
159.
75 -
159.
8515
9.85
- 15
9.95
159.
95 -
160.
05Br
idge
-
160.
25 -
160.
3516
0.35
- 16
0.45
160.
45 -
160.
5516
0.55
- 16
0.65
160.
65 -
160.
7516
0.75
- 16
0.85
160.
85 -
160.
9416
0.94
- 16
1.04
161.
04 -
161.
14
0
10
20
30
40
50
60
70
80
90
100Pe
rcen
tage
of C
rack
ed P
anel
s an
d A
vera
ge
Faul
ting
(1/1
00 in
)
Mile PostAverage FaultingPercentage of Cracked Panels
Southbound Lane 3 Percentage of Cracked Panels and Average Faulting MP 161.14 to MP 169.25
161.
14 -
161.
24
161.
24 -
161.
34
161.
34 -
161.
44Br
idge
-
161.
74 -
161.
84
161.
84 -
161.
94
161.
94 -
162.
04
162.
04 -
162.
14
162.
14 -
162.
24Br
idge
-
162.
42 -
162.
5216
2.52
- 16
2.62
162.
62 -
162.
7216
2.72
- 16
2.82
Brie
ge -
164.
33 -
164.
416
4.4
- 164
.516
4.5
- 164
.6Br
idge
- 16
4.7
- 164
.8Br
idge
-
164.
98 -
165.
0816
5.08
- 16
5.18
165.
18 -
165.
28Br
idge
-
165.
48 -
165.
5816
5.58
- 16
5.68
165.
68 -
165.
7816
5.78
- 16
5.88
165.
88 -
165.
9816
5.98
- 16
6.08
166.
08 -
166.
1816
6.18
- 16
6.28
166.
28 -
166.
36Br
idge
-
167.
74 -
167.
8416
7.84
- 16
7.94
167.
94 -
168.
0416
8.04
- 16
8.14
168.
14 -
168.
24Br
idge
-
169.
18 -
169.
25
0
10
20
30
40
50
60
70
80
90
100
Perc
enta
ge o
f Cra
cked
Pan
els
and
Ave
rage
Fa
ultin
g (1
/100
in)
Mile PostAverage FaultingPercentage of Cracked Panele
N-22

Southbound Lane 3 Percentage of Cracked Panels and Average Faulting MP 169.25 to MP 173.54
169.
25 -
169.
35
169.
35 -
169.
45
169.
45 -
169.
55
169.
55 -
169.
65
169.
65 -
169.
75
169.
75 -
169.
85
169.
85 -
169.
95
169.
95 -
170.
05
170.
05 -
170.
1517
0.15
- 17
0.25
Brid
ge -
170.
59 -
170.
6917
0.69
- 17
0.79
170.
79 -
170.
89
170.
89 -
170.
9917
0.99
- 17
1.09
171.
09 -
171.
1917
1.19
- 17
1.29
171.
29 -
171.
3917
1.39
- 17
1.49
171.
49 -
171.
5917
1.59
- 17
1.69
171.
69 -
171.
7917
1.79
- 17
1.89
171.
89 -
171.
9217
1.92
- 17
2.02
172.
02 -
172.
1217
2.12
- 17
2.22
172.
22 -
172.
3217
2.32
- 17
2.42
172.
42 -
172.
5217
2.52
- 17
2.54
172.
54 -
172.
6417
2.64
- 17
2.74
Brid
ge -
172.
84 -
172.
9417
2.94
- 17
3.04
173.
04 -
173.
1417
3.14
- 17
3.24
173.
24 -
173.
3417
3.34
- 17
3.44
173.
44 -
173.
54
0
10
20
30
40
50
60
70
80
90
100Pe
rcen
tage
of C
rack
ed P
anel
s an
d A
vera
ge
Faul
ting
(1/1
00 in
)
Mile PostAverage FaultingPercenatage of Cracked Panels
Southbound Lane 3 Percentage of Cracked Panels and Average Faulting MP 173.54 to MP 177.65
173.
54 -
173.
6417
3.64
- 17
3.74
173.
74 -
173.
8417
3.84
- 17
3.94
173.
94 -
174.
04
174.
04 -
174.
1417
4.14
- 17
4.21
174.
21 -
174.
3117
4.31
- 17
4.41
174.
41 -
174.
5117
4.51
- 17
4.61
174.
61 -
174.
7117
4.71
- 17
4.81
174.
81 -
174.
9117
4.91
- 17
5.01
Brid
ge -
175.
23 -
175.
3317
5.33
- 17
5.43
Brid
ge -
175.
53 -
175.
6317
5.63
- 17
5.73
175.
73 -
175.
8317
5.83
- 17
5.93
175.
93 -
176.
03Br
idge
-
176.
16 -
176.
16Br
idge
-
176.
26 -
176.
3617
6.36
- 17
6.46
176.
46 -
176.
5617
6.56
- 17
6.66
176.
66 -
176.
7617
6.76
- 17
6.86
176.
86 -
176.
9617
6.96
- 17
7.05
177.
05 -
177.
1517
7.15
- 17
7.25
177.
25 -
177.
3517
7.35
- 17
7.45
177.
45 -
177.
5517
7.55
- 17
7.65
0
10
20
30
40
50
60
70
80
90
100
Perc
enta
ge o
f Cra
cked
Pan
els
and
Ave
rage
Fa
ultin
g (1
/100
in)
Mile PostAverage FaultingPercentage of Cracked Panels
N-23

Southbound Lane 4 Percentage of Cracked Panels and Average Faulting MP 139.5 to MP 143.49
139.
5 - 1
39.6
139.
6 - 1
39.7
139.
7 - 1
39.8
139.
8 - 1
39.9
139.
9 - 1
4014
0 - 1
40.1
140.
1 - 1
40.2
140.
2 - 1
40.3
140.
3 - 1
40.4
140.
4 - 1
40.5
140.
5 - 1
40.6
140.
6 - 1
40.7
140.
7 - 1
40.8
140.
8 - 1
40.9
140.
9 - 1
4114
1 - 1
41.1
141.
1 - 1
41.2
141.
2 - 1
41.3
141.
3 - 1
41.4
141.
4 - 1
41.5
141.
5 - 1
41.6
141.
6 - 1
41.7
141.
7 - 1
41.8
141.
8 - 1
41.9
141.
9 - 1
4214
2.04
- 14
2.09
142.
09 -
142.
1914
2.19
- 14
2.29
142.
29 -
142.
3914
2.39
- 14
2.49
142.
49 -
142.
5914
2.59
- 14
2.69
142.
69 -
142.
7914
2.81
- 14
2.89
142.
89 -
142.
9914
2.99
- 14
3.09
143.
09 -
143.
1914
3.19
- 14
3.29
143.
29 -
143.
3914
3.39
- 14
3.49
0
10
20
30
40
50
60
70
80
90
100Pe
rcen
tage
of C
rack
ed P
anel
s an
d A
vera
ge F
aulti
ng
(1/1
00 in
)
Mile PostAverage FaultingPercentage of Cracked Panels
Southbound Lane 4 Percentage of Cracked Panels and Average Faulting MP 143.49 to MP 151.34
143.
49 -
143.
5914
3.59
- 14
3.69
143.
69 -
143.
7914
3.79
- 14
3.89
143.
89 -
143.
9914
3.99
- 14
4.09
144.
09 -
144.
1914
4.19
- 14
4.29
144.
29 -
144.
39DB
R an
d DG
-
146.
21 -
146.
31Br
idge
-
146.
51 -
146.
6114
6.61
- 14
6.71
Brid
ge -
146.
84 -
146.
9414
6.94
- 14
7.04
147.
04 -
147.
1414
7.14
- 14
7.24
147.
24 -
147.
3414
7.34
- 14
7.44
147.
44 -
147.
5414
7.54
- 14
7.59
DBR
and
DG -
149.
76 -
149.
8414
9.84
- 14
9.94
149.
94 -
150.
0415
0.04
- 15
0.14
150.
14 -
150.
2415
0.24
- 15
0.34
150.
34 -
150.
4415
0.44
- 15
0.54
150.
54 -
150.
6415
0.64
- 15
0.74
150.
74 -
150.
8415
0.84
- 15
0.94
150.
94 -
151.
0415
1.04
- 15
1.14
151.
14 -
151.
2415
1.24
- 15
1.34
0
10
20
30
40
50
60
70
80
90
100
Per
cent
age
of C
rack
ed P
anel
s an
d A
vera
ge F
aulti
ng
(1/1
00 in
)
Mile PostAverage FualtingPercentage of Cracked Panels
N-24

Southbound Lane 4 Percentage of Cracked Panels and Average Faulting MP 151.34 to MP 159.57
151.
34 -
151.
4415
1.44
- 15
1.54
151.
54 -
151.
6415
1.64
- 15
1.74
151.
74 -
151.
8415
1.84
- 15
1.94
151.
94 -
152.
0415
2.04
- 15
2.14
152.
14 -
152.
15Br
idge
-
152.
35 -
152.
4515
2.45
- 15
2.55
152.
55 -
152.
6515
2.65
- 15
2.75
152.
75 -
152.
8515
2.85
- 15
2.95
152.
95 -
153.
0515
3.05
- 15
3.15
153.
15 -
153.
2415
3.24
- 15
3.34
153.
34 -
153.
4415
3.44
- 15
3.54
153.
54 -
153.
6415
3.64
- 15
3.74
153.
74 -
153.
8415
3.84
- 15
3.94
153.
94 -
154.
0415
4.04
- 15
4.06
Diam
ond
Gro
nd -
158.
5 - 1
58.6
158.
6 - 1
58.7
158.
7 - 1
58.8
158.
8 - 1
58.9
158.
9 - 1
5915
9 - 1
59.1
159.
1 - 1
59.1
715
9.17
- 15
9.27
159.
27 -
159.
3715
9.37
- 15
9.47
159.
47 -
159.
57
0
10
20
30
40
50
60
70
80
90
100Pe
rcen
tage
of C
rack
ed P
anel
s an
d A
vera
ge
Faul
ting
(1/1
00 in
)
Mile PostAverage FaultingPercentage of Cracked Panels
Southbound Lane 4 Percentage of Cracked Panels and Average Faulting MP 159.71 to MP 165.68
Brid
ge -
159.
71 -
159.
7515
9.75
- 15
9.85
159.
85 -
159.
95Br
idge
-
160.
25 -
160.
3516
0.35
- 16
0.45
160.
45 -
160.
5516
0.55
- 16
0.65
160.
65 -
160.
7516
0.75
- 16
0.85
160.
85 -
160.
9416
0.94
- 16
1.04
161.
04 -
161.
1416
1.14
- 16
1.24
161.
24 -
161.
3416
1.34
- 16
1.44
Brid
ge -
161.
74 -
161.
8416
1.84
- 16
1.94
161.
94 -
162.
0416
2.04
- 16
2.14
Brid
ge -
162.
37 -
162.
4216
2.42
- 16
2.52
162.
52 -
162.
6216
2.62
- 16
2.72
Brid
ge -
164.
33 -
164.
416
4.4
- 164
.516
4.5
- 164
.616
4.6
- 164
.7Br
idge
- 16
4.93
- 16
4.98
164.
98 -
165.
0816
5.08
- 16
5.18
Brid
ge -
165.
44 -
165.
4816
5.48
- 16
5.58
165.
58 -
165.
68
0
10
20
30
40
50
60
70
80
90
100
Perc
enta
ge o
f Cra
cked
Pan
els
and
Ave
rage
Fau
lting
(1
/100
in)
Mile PostAverage FaultingPercentage of Cracked Panels
N-25

Southbound Lane 4 Percentage of Cracked Panels and Average Faulting MP 165.68 to MP 171.92
165.
68 -
165.
7816
5.78
- 16
5.88
165.
88 -
165.
9816
5.98
- 16
6.08
166.
08 -
166.
1816
6.18
- 16
6.28
Brid
ge -
167.
72 -
167.
7416
7.74
- 16
7.84
167.
84 -
167.
9416
7.94
- 16
8.04
168.
04 -
168.
1416
8.14
- 16
8.24
Brid
ge -
169.
18 -
169.
2516
9.25
- 16
9.35
169.
35 -
169.
4516
9.45
- 16
9.55
169.
55 -
169.
6516
9.65
- 16
9.75
169.
75 -
169.
8516
9.85
- 16
9.95
169.
95 -
170.
0517
0.05
- 17
0.15
170.
15 -
170.
25Br
idge
- 17
0.59
- 17
0.69
170.
69 -
170.
7917
0.79
- 17
0.89
170.
89 -
170.
9917
0.99
- 17
1.09
171.
09 -
171.
1917
1.19
- 17
1.29
171.
29 -
171.
3917
1.39
- 17
1.49
171.
49 -
171.
5917
1.59
- 17
1.69
171.
69 -
171.
7917
1.79
- 17
1.89
171.
89 -
171.
92
0
10
20
30
40
50
60
70
80
90
100Pe
rcen
tage
of C
rack
ed P
anel
s an
d A
vera
ge F
aulti
ng
(1/1
00 in
)
Mile PostAverage FaultingPercentage of Cracked Panels
Southbound Lane 4 Percentage of Cracked Panels and Average Faulting MP 171.92 to MP 175.93
171.
92 -
172.
0217
2.02
- 17
2.12
172.
12 -
172.
2217
2.22
- 17
2.32
172.
32 -
172.
4217
2.42
- 17
2.52
172.
52 -
172.
5417
2.54
- 17
2.64
172.
64 -
172.
74Br
idge
-
172.
84 -
172.
9417
2.94
- 17
3.04
173.
04 -
173.
1417
3.14
- 17
3.24
173.
24 -
173.
3417
3.34
- 17
3.44
173.
44 -
173.
5417
3.54
- 17
3.64
173.
64 -
173.
7417
3.74
- 17
3.84
173.
84 -
173.
9417
3.94
- 17
4.04
174.
04 -
174.
1417
4.14
- 17
4.21
174.
21 -
174.
3117
4.31
- 17
4.41
174.
41 -
174.
5117
4.51
- 17
4.61
174.
61 -
174.
7117
4.71
- 17
4.81
174.
81 -
174.
9117
4.91
- 17
5.01
Brid
ge -
175.
23 -
175.
3317
5.33
- 17
5.43
Brid
ge -
175.
53 -
175.
6317
5.63
- 17
5.73
175.
73 -
175.
8317
5.83
- 17
5.93
0
10
20
30
40
50
60
70
80
90
100
Perc
enta
ge o
f Cra
cked
Pan
els
and
Ave
rage
Fau
lting
(1
/100
in)
Mile PostAverage FaultingPercentage of Cracked Panels
N-26

Southbound Lane 4 Percentage of Cracked Panels and Average Faulting MP 175.93 to MP 177.65
175.
93 -
176.
0317
6.03
- 17
6.13
176.
16 -
176.
16
Brid
ge -
176.
26 -
176.
3617
6.36
- 17
6.46
176.
46 -
176.
5617
6.56
- 17
6.66
176.
66 -
176.
7617
6.76
- 17
6.86
176.
86 -
176.
9617
6.96
- 17
7.05
177.
05 -
177.
1517
7.15
- 17
7.25
177.
25 -
177.
3517
7.35
- 17
7.45
177.
45 -
177.
5517
7.55
- 17
7.65
0
10
20
30
40
50
60
70
80
90
100Pe
rcen
tage
of C
rack
ed P
anel
s an
d A
vera
ge F
aulti
ng
(1/1
00 in
)
Mile PostAverage FaultingPercentage of Cracked Panels
N-27

Appendix O – Arc GIS IRI Pavement Distress Images
O-1

O-2

O-3

O-4

O-5

O-6

O-7

O-8

O-9

O-10

O-11

Appendix P – Arc GIS Average Faulting Pavement Distress Images
P-1

P-2

P-3

P-4

P-5

P-6

P-7

P-8

P-9

P-10

P-11

Appendix Q – Arc GIS Percentage of Cracked Panels with Two or More Cracks
Distress Images
Q-1

Q-2

Q-3

Q-4

Q-5

Q-6

Q-7

Q-8

Q-9
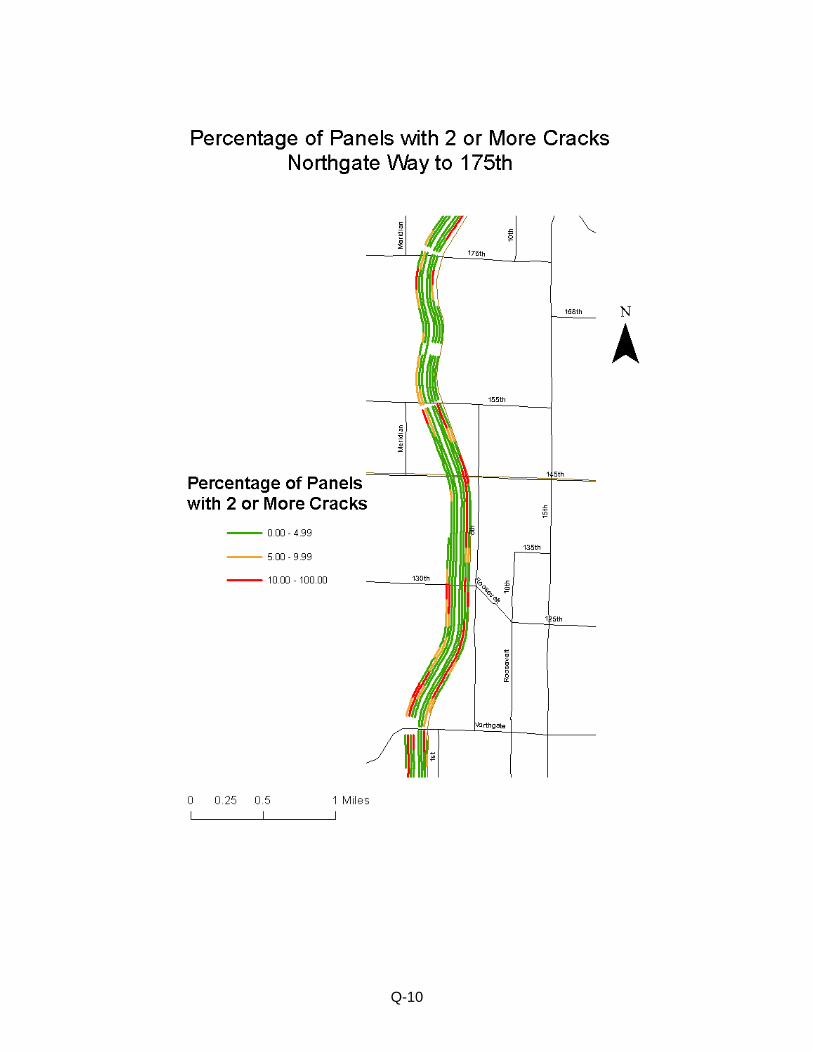
Q-10

Q-11

Appendix R – Arc GIS Wheel Path Wear Pavement Distress Images
R-1

R-2

R-3

R-4

R-5

R-6

R-7

R-8

R-9

R-10

R-11

Appendix S – Arc GIS General Conditions Images
S-1

S-2

S-3

S-4

S-5

S-6

S-7

S-8

S-9

S-10

Appendix T – Arc GIS WSDOT Trigger Rehabilitation Options Images
T-1

T-2

T-3

T-4

T-5

T-6

Appendix U – Arc GIS Triage Project Rehabilitation Options Images
U-1

U-2

U-3

U-4
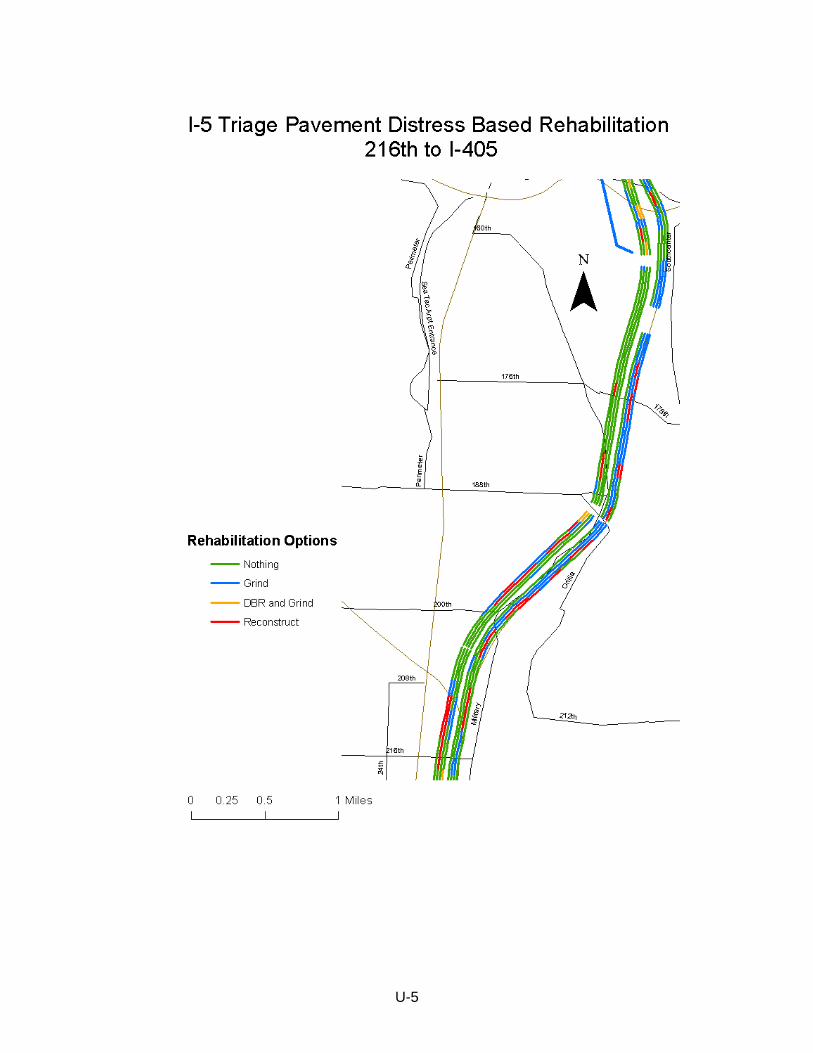
U-5

U-6

U-7

U-8

Appendix V – Arc GIS Wet Conditions Images
V-1

V-2

V-3

V-4

V-5

V-6

V-7

V-8

V-9

V-10

V-11

V-12

Appendix W – Existing and Post-Overlay Bridge Clearances
W-1

Existing and Post-Overlay Bridge Clearances (Source: WSDOT)
Milepost Crossing Name Existing Clearance
4” HMA Overlay
5” HMA Overlay
No. Bridge No.
139.50 Pierce Co/King Co Line I D I D I D 1 5/501 140.15 S 376th St UC 16.75 18.83 16.40 18.48 16.30 18.38 2 161/102 141.25 SR 161 UC 17.08 16.08 16.73 15.73 16.63 15.63 3 5/505 143.83 S 320th Street UC 16.83 15.83 16.48 15.48 16.38 15.38 4 5/513 150.33 S 216th Street UC 20.33 18.17 19.98 17.82 19.88 17.72 5 5/515 151.18 Military Road UC 19.50 19.67 19.15 19.32 19.05 19.22 6 5/518 153.15 S 178th Street UC 18.25 15.92 17.90 15.57 17.80 15.47 7 5/520E 154.12 Klickitat DR UC 16.25 15.90 15.80 8 405/1 154.56 I-405 UC 16.17 20.58 15.82 20.23 15.72 20.13 9 5/524 155.32 S 144th Street UC 17.25 16.58 16.90 16.23 16.80 16.13 10 5/525N-N 155.91 N-N Ramp UC 16.50 16.75 16.15 16.40 16.05 16.30 11 5/526.1 156.48 Archie Codeba Bridge 18.50 16.92 18.15 16.57 18.05 16.47 12 900/13W 157.34 SR 900 UC 18.67 16.83 18.32 16.48 18.22 16.38 13 900/12W 157.77 SR 900 UC 17.08 16.50 16.73 16.15 16.63 16.05 14 5/528 158.01 S 107th Street UC 17.08 18.50 16.73 18.15 16.63 18.05 15 5/532.5 161.26 Albro Street UC 16.33 16.67 15.98 16.32 15.88 16.22 16 5/533E-N 161.37 E-N Ramp UC 16.33 16.50 15.98 16.15 15.88 16.05 17 5/536N-W 162.92 N-W Ramp UC 19.25 28.42 18.90 28.07 18.80 27.97 18 5/537S 163.05 EB Lanes UC 28.42 29.33 28.07 28.98 27.97 28.88 19 5/537E-N 163.09 E-N Ramp UC 16.67 24.58 16.32 24.23 16.22 24.13 20 5/537W-S 163.10 W-S Ramp UC 40.67 44.00 40.32 43.65 40.22 43.55 21 5/538S-E 163.10 S-E Ramp UC 16.25 18.75 15.90 18.40 15.80 18.30 22 5/539.5 163.96 Beacon-Holgate UC 16.83 26.25 16.48 25.90 16.38 25.80 23 5/540N-W 164.39 N-W Ramp UC 17.25 40.08 16.90 39.73 16.80 39.63 24 90/10W-S 164.50 W-S Ramp UC 16.92 16.42 16.57 16.07 16.47 15.97 25 90/10WB 164.50 I-90 UC 19.00 17.92 18.65 17.57 18.55 17.47 26 90/10E-N 164.51 E-N Ramp UC 17.92 24.83 17.57 24.48 17.47 24.38 27 5/542S-E 164.57 S-E Ramp UC 28.00 20.25 27.65 19.90 27.55 19.80 28 5/544 165.16 Yestler Street UC 23.17 15.50 22.82 15.15 22.72 15.05 29 5/546 165.64 Madison Street UC 22.33 39.25 21.98 38.90 21.88 38.80 30 5/547 165.69 Spring Street UC 21.42 31.42 21.07 31.07 20.97 30.97 31 5/549CNC 165.73 Convention Center UC 16.08 16.17 15.73 15.82 15.63 15.72 32 5/549 165.85 8th Ave. - Trade Center UC 15.92 16.17 15.57 15.82 15.47 15.72 33 5/550 166.12 Pike Street UC 16.75 20.42 16.40 20.07 16.30 19.97 34 5/552 166.16 Olive Way UC 15.42 18.00 15.07 17.65 14.97 17.55 35 5/553 166.26 Denny Way UC 15.92 19.58 15.57 19.23 15.47 19.13 36 5/564 167.11 Lakeview Boulevard UC 24.75 20.00 24.40 19.65 24.30 19.55 37 520/1W-S 168.10 W-S Ramp UC 15.50 15.15 15.05 38 5/569 168.18 Roanoke Street UC 14.92 16.92 14.57 16.57 14.47 16.47 39 5/572 169.42 NE 45th Street UC 15.83 20.67 15.48 20.32 15.38 20.22 40 5/574 169.67 NE 50th Street UC 14.75 16.17 14.40 15.82 14.30 15.72 41 5/580 170.66 NE 70th-NE 71st Street UC 29.67 20.33 29.32 19.98 29.22 19.88 42 522/14W-S 170.79 W-S Ramp UC SR-522 23.33 25.67 22.98 25.32 22.88 25.22 43 5/582 170.83 5th Avenue NE UC 17.50 17.58 17.15 17.23 17.05 17.13 44 5/583 171.09 NE 80th Street UC 19.00 19.50 18.65 19.15 18.55 19.05 45 5/584N-W 171.32 N-85th Ramp UC 18.25 16.17 17.90 15.82 17.80 15.72 46 5/585 171.58 NE 92nd Street UC 17.50 15.92 17.15 15.57 17.05 15.47 47 5/589 173.15 NE 117th Street UC 18.25 17.00 17.90 16.65 17.80 16.55 48 5/590 173.83 NE 130th Street UC 16.25 17.00 15.90 16.65 15.80 16.55 49 523/5 174.58 SR 523 UC 16.42 20.33 16.07 19.98 15.97 19.88 50 5/596 176.72 NE 185th Street UC 16.25 20.25 15.90 19.90 15.80 19.80 51 5/598 177.21 Pedestrian UC NE 195th St 21.08 18.08 20.73 17.73 20.63 17.63 177.77 King /Snohomish Co Line
W-2

Relevant Sources:
1. WSDOT (2002), “2002 Bridge List,” M23-09, Washington State Department of Transportation. 2. RCW 46.44.020, “Maximum Height—Impaired Clearance Signs:” This RCW notes that
maximum vehicle height is 14 ft. above the roadway. 3. WASHTO (1995), “Western Regional Agreement for Issuance of Permits for Oversize and
Overweight Vehicles Involved in Interstate Travel,” Western Association of State Highway and Transportation Officials, July 21, 1995. This reference notes that the maximum vehicle height is 14 ft.
W-3