assessment of the effects of noise and vibration …
TRANSCRIPT
ASSESSMENT OF THE EFFECTS OF NOISE AND VIBRATION FROM
OFFSHORE WIND FARMS ON MARINE WILDLIFE
ETSU W/13/00566/REP
DTI/Pub URN 01/1341
ContractorUniversity of Liverpool, Centre for Marine and Coastal Studies
Environmental Research and Consultancy
Prepared byG Vella, I Rushforth, E Mason, A Hough, R England,
P Styles, T Holt, P Thorne
The work described in this report was carried out under contract as part of the DTI Sustainable EnergyProgrammes. The views and judgements expressed in this report are those of the contractor and do not necessarily reflect those of the DTI.
First published 2001
i

© Crown copyright 2001
EXECUTIVE SUMMARY
Main objectives of the report
Energy Technology Support Unit (ETSU), on behalf of the Department of Trade and Industry (DTI) commissioned the Centre for Marine and Coastal Studies (CMACS) in October 2000, to assess the effect of noise and vibration from offshore wind farms on marine wildlife. The key aims being to review relevant studies, reports and other available information, identify any gaps and uncertainties in the current data and make recommendations, with outline methodologies, to address these gaps.
Introduction
The UK has 40% of Europe’s total potential wind resource, with mean annual offshore wind speeds, at a reference of 50m above sea level, of between 7m/s and 9m/s. Research undertaken by the British Wind Energy Association suggests that a ‘very good’ site for development would have a mean annual wind speed of 8.5m/s. The total practicable long-term energy yield for the UK, taking limiting factors into account, would be approximately 100 TWh/year (DTI, 1999).
The UK Government is committed to new and renewable energy and is introducing a new Renewables Obligation that will succeed the Non-Fossil Fuel Obligation (NFFO). This will be introduced in the Utilities Bill currently progressing through Parliament and will require power suppliers to source a specified amount of the electricity they supply to their customers from renewable energy. Offshore wind power is expected to contribute a significant proportion of this renewable energy.
The regulatory framework for offshore wind power development is likely to be the Transport and Works Act 1992 with a requirement for Environmental Impact Assessments (EIA’s) to be carried out on a site by site basis. To determine the environmental effects of offshore wind farm development, a range of generic impacts on marine wildlife are addressed in this report. These generic effects are:
• Characterisation of noise and vibration generated by offshore turbine operation and construction activities.
• Propagation and attenuation of noise and vibration above and below the surface.
• Prediction of noise levels at the shoreline and impacts on marine wildlife.• Likely range of background noise above and below the surface.• Identification of the range of noise sensitive marine species most at risk to
noise and vibration impacts related to UK offshore wind farms.• The effects of noise and vibration on marine species.
ii
• The extent to which offshore wind turbines may provide physical protection and new habitat opportunities.
Lifecycle of an offshore wind farm and potential locations
The lifecycle of an offshore wind farm would consist of planning, development, commissioning, operation (and maintenance) and decommissioning stages. Each of these stages may exert environmental impacts, considered below. Site selection is dependent upon such issues as average wind speed, local conservation areas, shipping routes, bathymetry etc. Initial areas of interest identified by the Crown Estates Commission include the Thames Estuary, the East Coast (Humber to Mid-East Anglia), the Solway Firth, Liverpool Bay and the Bristol Channel. The majority of these localities are predominately areas of sandy substrate with either underlying mud or gravel. The bathymetry at each of the sites generally ranges from 10m to 20m. The Bristol Channel is an exception with water depths ranging from 15m to 40m.
The Crown Estates as “landowners” of the seabed within territorial waters will lease sites prior to commencement of any work. The first round of applications, pre-qualification and allocation of sites closed on 9th February 2001. These sites will initially be restricted to a size of 10 square kilometres with permission to develop up to 30 turbines on each with a minimum output for the site of 20 MW. All the Crown Estate agreements will be subject to the developer obtaining all the necessary consents prior to development.
Associated issues
Although this investigation primarily considers the possible effects of noise and vibration from offshore wind farms on marine wildlife, associated issues reviewed here also include their potential role in marine productivity in acting as artificial reefs - providing areas of shelter and increased surface area for colonisation.
Summary of the Work Undertaken
The study was divided into three sequential phases. Phase 1 involved the identification and review of studies, reports and other available information pertinent to offshore wind farms. Specifically, noise and vibration during construction and operation, and their effects on marine wildlife. Information used in Phase 1 was collected through both a consultation exercise and literature review.
For the consultation exercise a cross section of stakeholders in the offshore wind industry were identified and consulted with.
During the consultation exercise 98 organisations and individuals were contacted and 38 replies were received - 39% of recipients. The exercise
iii

provided information on the specific concerns and perspectives of the various stakeholders involved.
The next stage, was the identification of gaps and uncertainties in existing knowledge and the recommendation of further studies needed to address these gaps. This included outlining methodologies for further information acquisition.
Finally an inventory of planned and ongoing studies and projects directly relevant, or complementary to, the assessment of the effects of offshore wind- farms on marine life was developed. This was designed using Microsoft Access (Office 97 Version) and includes a User Manual together with a CD- ROM. References obtained during the consultation exercise and literature review were also collated on the Microsoft Access database. The design allows for ongoing update and review.
Summary of the results
Probable noise produced by the operation of offshore wind turbines, above the water is expected to be broadly similar to that produced by onshore turbines. However, there have been very few studies conducted to characterise underwater noise caused by offshore wind turbines.
The mechanisms by which noise propagates through both air and water are well understood. If sound energy is free to travel in all directions sound levels will decrease in proportion to the square of the distance from the sound source.
In shallow waters, however, (where most offshore wind turbines will be located), the underwater sound radiating from the tower structure may be channelled by the seabed and water surface. The sound energy will then only propagate in two dimensions with sound levels decreasing with distance from the source. However, when considering sound frequencies produced by operational offshore wind farms and distances involved, absorption losses are expected to be relatively insignificant compared with the much greater attenuation due to geometric spreading.
Physical noise and vibration in the ocean is a product of a plethora of sources. These include geological disturbances, non-linear wave-wave interactions, turbulent wind stress on the sea surface, breaking waves and spray, rain and hail. The range of frequencies associated with these natural processes can often be very broad eg noise produced by wind and rain can range from 1Hz to 25kHz with source levels of up to 100dB. Conversely, some processes can produce narrow ranges of high-energy noise and vibration, such as earthquake events where frequencies are commonly between 5-15Hz with source levels as powerful as 240dB.
Noise and vibration from human activities (anthropogenic sources) are generally of mid-low frequency between 10 and 1000Hz and include:
iv
shipping and transportation, dredging, construction, hydrocarbon and mineral extraction, geophysical survey, sonar, explosions and ocean science studies, but it may have very high source levels. For example, noise associated with geophysical and seismic surveying regularly produces sound levels above 200dB. The sounds from these sources are categorised as 'transient' if their duration is brief, such as the pulses of airguns, sonar or explosions; or 'continuous' if they persist for long periods, such as the noise generated by an oil drilling platform, or the anticipated sound of an operating offshore wind farm.
Use of sound by marine species
Many marine organisms are known to produce underwater sounds, often used in a behavioural context. Most notably, both odontocete (toothed whales such as sperm and killer whales and also oceanic and river dolphins and porpoises) and mysticete (baleen whales from the Greek “moustached” describing the appearance of the “hairs”, actually plates, that hang from their upper jaws and include the humpback, blue, grey and right whales) have a wide repertoire of underwater sounds. Mysticetes are capable of producing infrasonic frequencies with ranges between 0.01 to 3kHz with source levels of up to 188dB. Odontocete sounds are considerably higher in frequency than those of the Mysticetes and range between 1 to 150kHz with source levels of up to 230dB.
Pinnipeds (seals) use a variety of sounds both in and out of the water to carry complex social information such as dominancy and territoriality.
Fish produce underwater sounds through stridulation (rubbing together of body parts) and manipulation of the swimbladder, with the frequencies produced ranging from 50Hz to 5kHz and source levels of up to 140dB While the importance of sounds produced by many fish is not fully understood, stridulatory noises are thought to be associated with alarm, whilst resonant swimbladder sounds may play a role in social communication.
Sounds produced by invertebrates are characteristically high in frequency and mainly produced through stridulation. However, few studies have clearly established any behavioural significance to these.
The effects of noise and vibration on marine species.
The hearing and sensitivity response of many marine organisms overlaps, to an extent, with noise in the marine environment from anthropogenic sources. In general, anthropogenic noise tends to be broadband and of low frequency within the range of 10Hz to 1000Hz. This overlaps with the sensitivity thresholds of many fish and some of the larger marine mammals such as the mysticete whales. The effects of anthropogenic noise are broadly categorised into behavioural and physiological effects.
v

The behavioural impacts of anthropogenic sound on cetaceans are well documented. These impacts include attraction or avoidance behaviour, panic and increases in the intensity of vocal communication. Such behavioural changes can in turn affect populations of sensitive species in an area. Physiological effects are less well documented. However, studies have shown that long-term exposure to noise can cause damage to the internal ear. However, many cetaceans appear to readily habituate to anthropogenic noise.
Studies of the impact of anthropogenic noise on fish, invertebrates and planktonic species, almost exclusively consider the effects of geophysical survey, particularly the effects of 'airguns', used in seismic surveys. For fish these devices have been shown to produce a range of impacts from avoidance behaviour to physiological impacts. Studies have also shown that noise in general, such as that associated with shipping, causes avoidance (or attraction) which can lead to avoidance of migration routes, feeding and spawning areas. Reports describing the impacts of noise on invertebrates and planktonic organisms are much fewer in number. However, the general consensus is that there are very few effects, behavioural or physiological, unless the organisms are very close to a powerful noise source.
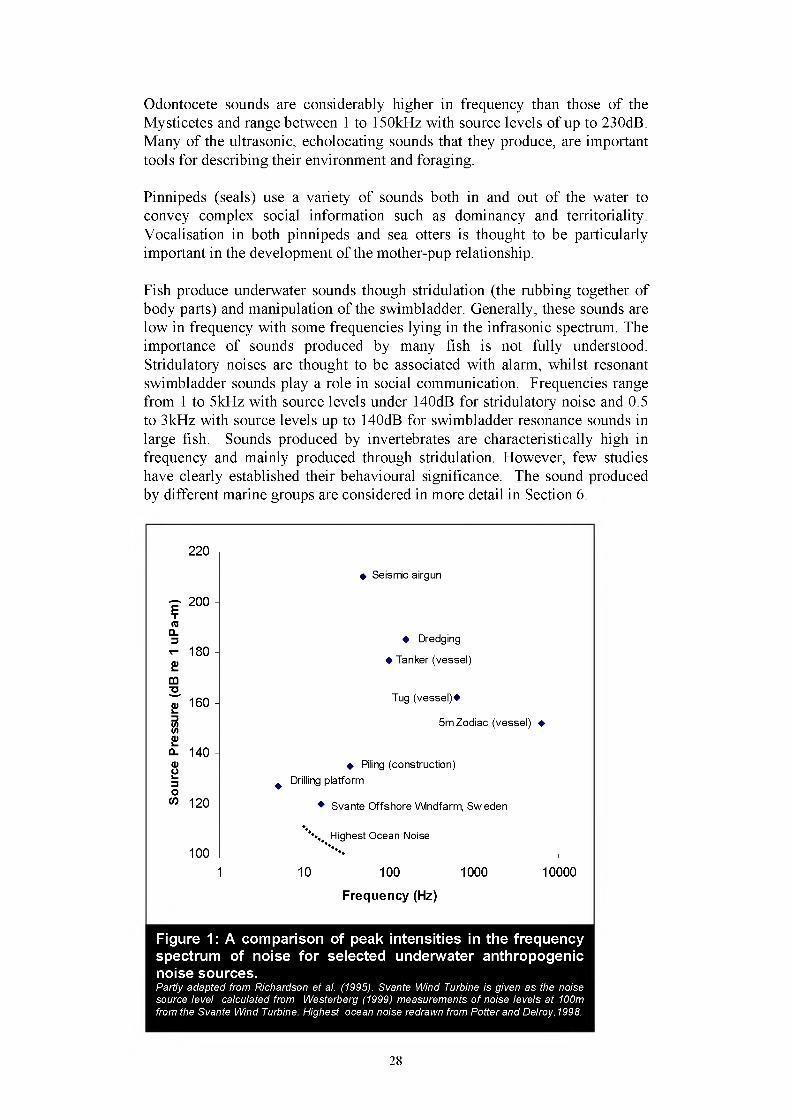
At the time of producing this report, data on the underwater noise produced by offshore wind farms was limited to the Svante wind farm off Sweden. Noise produced here is estimated to peak at 120dB at 16Hz.
This falls within the lower range of the frequency in source pressure spectrum for anthropogenic noise, and is below the “highest ocean noise” band. The noise produced at Svante also appears to be outside the “behavioural reaction” sensitivities of most species for which data is available (such as harbour seal, harbour porpoise, salmon and dab). Some effect may be apparent, however, on species such as cod.
It must be stressed, however, that the amount of actual underwater noise data available is extremely limited at present.
Artificial reefs and colonisation
Fish tend to aggregate around objects placed in the sea. This phenomenon has been widely used in the development of Fish Aggregating Devices (FADs). However, the attraction of fish to objects is poorly understood. It is postulated that fish are attracted to submerged objects as they provide shelter from currents and wave action and safety from predators.
Industrial platforms in the North Sea have also been shown to provide a hard, stable substrata for colonisation by a diverse range of marine organisms including seaweeds, mussels, barnacles, tubeworms, hydroids, sponges, soft corals and other invertebrates. These organisms, which attach themselves permanently to the structures, attract various free-living invertebrates and small fish, which in turn attract larger organisms, thereby increasing species diversity, biomass and general productivity. This may be particularly so if
vi

hard-substrate structures, such as offshore wind farms, are placed in soft- substrate environments.
Conclusion and recommendations
On the basis of the available data, pinnipeds (seals) and odontocetes (toothed whales) are likely to show initial avoidance to wind farms, followed by habituation and possibly attraction to wind farms as feeding grounds. The reaction of mysticetes (baleen whales) is unknown in the absence of data regarding their audible sensitivity. However, it is possible that they will show a behavioural response to the low frequency sound wind farms are likely to produce. The significance of this response will depend upon the proximity of wind farms to whale migratory routes.
From the information available for operating offshore wind farms and other “noisy” offshore structures such as oil and gas platforms, it is expected that effects on fish population dynamics will be determined by immigration/attraction of fish to wind farms following construction. No adverse impacts on marine invertebrates are expected by the noise and vibration generated by turbines.
However, the full effects of offshore wind farms on marine wildlife, particularly mammal, fish and migratory fish behaviour and ecology can only be usefully determined through further monitoring. Additional studies into the effects of offshore wind farms on marine species are therefore recommended. These studies should accompany the first round of offshore wind farm development, due to commence following pre-qualification in May 2001.
vii

CONTENTS1 INTRODUCTION.................................................................................................................... 10
1.1 Aims and objectives of the report................................................................................101.1.1 Offshore wind farm development...................................................................... 101.1.2 Tender specifications for our report and our deliverables............................... 10
1.2 Background to offshore wind farms..........................................................................111.2.1 Lifecycle of an offshore wind farm................................................................... 111.2.2 Planning, development and areas of potential wind farm location..................111.2.3 Associated issues...............................................................................................11
1.3 Structure of the report...................................................................................................12
2 METHODOLOGY................................................................................................................... 14
2.1 PHASE 1.................................................................................................................................... 142.1.1 Consultation......................................................................................................142.1.2 Literature review...............................................................................................14
2.2 PHASE 2.................................................................................................................................... 152.3 PHASE 3.................................................................................................................................... 15
3 CONCEPTS AND TERMINOLOGY IN ACOUSTICS................................................ 16
3.1 WHAT IS sound/noise?......................................................................................................... 163.2 Frequency spectra & temporal variations..............................................................173.3 Human (and mammalian) hearing system.................................................................. 183.4 Measuring sound and vibration...................................................................................193.5 Propagation of sound and vibration......................................................................... 21
4 AMBIENT MARINE NOISE/VIBRATION..................................................................... 24
4.1 PHYSICAL noise/vibration.................................................................................................244.1.1 Wind & waves....................................................................................................244.1.2 Rain...................................................................................................................244.1.3 Movement of seabed materials, especially gravel............................................ 244.1.4 Natural seismic activity.................................................................................... 24
4.2 Anthropogenic noise/vibration....................................................................................244.2.1 .Boats and shipping......................................................................................................244.2.2 Seismic surveying............................................................................................. 254.2.3 Drilling platforms............................................................................................. 254.2.4 Construction......................................................................................................264.2.5 Airborne noise.................................................................................................. 264.2.6 Sonar............................................................................................................................. 274.2.7 Explosions.................................................................................................................... 27
4.3 Biological noise/vibration.............................................................................................27
5 OFFSHORE WIND FARMS................................................................................................. 30
5.1 Introduction to wind turbines and wind farms..................................................... 305.1.1 Components of a wind energy converter (WEC)...............................................305.1.2 Installation and commissioning........................................................................ 305.1.3 Decommissioning............................................................................................. 30
5.2 Noise/vibration from operational offshore wind farms:.................................. 315.3 Brief overview of operational onshore wind farm noise/vibration andAPPLICABILITY TO THE OFFSHORE SITUATION.............................................................................. 325.4 Construction noise/vibration from offshore wind turbines:.......................... 355.5 Factors affecting propagation and attenuation of noise from offshorewind farms:.....................................................................................................................................35
6 NOISE/VIBRATION: EFFECTS ON MARINE WILDLIFE......................................36
6.1 Hearing and sensitivity................................................................................................... 366.2 Zones of noise influence................................................................................................. 37
8

6.3 CETACEANS.............................................................................................................................416.3.1 Species under consideration:........................................................................... 416.3.2 Hearing and sensitivity..................................................................................... 426.3.3 Sound production in mysticete cetaceans......................................................... 446.3.4 Sound production in odontocete cetaceans...................................................... 446.3.5 Effects of anthropogenic noise and vibration................................................... 456.3.6 Summary........................................................................................................................47
6.4 PINNIPEDS AND OTTERS .........................................................................................................486.4.1 Species under consideration............................................................................. 486.4.2 Hearing and sensitivity..................................................................................... 486.4.3 Sound production..............................................................................................496.4.4 Effects of anthropogenic noise and vibration....................................................496.4.5 Summary............................................................................................................50
6.5 Fish.......................................................................................................................................... 516.5.1 Species under consideration:........................................................................... 516.5.2 Hearing and sensitivity..................................................................................... 516.5.3 Sound production............................................................................................. 536.5.4 Effects of anthropogenic noise and vibrations.................................................. 53
6.6 Invertebrates and plankton......................................................................................... 576.6.1 Species under consideration:........................................................................... 576.6.2 Hearing and sensitivity..................................................................................... 576.6.3 Effects of anthropogenic noise and vibration....................................................58
6.7 PLANTS AND ALGAE................................................................................................................59
7 COLONISATION, SHELTER AND PRODUCTIVITY...............................................61
7.1 Artificial reefs...................................................................................................................617.2 Colonisation of turbine foundations........................................................................ 62
7.2.1 Attractiveness of turbine foundations to fish.....................................................63
8 CONCLUSIONS, GAPS & UNCERTAINTIES.............................................................. 65
8.1 Sources of impact associated with offshore wind farms.................................... 658.2 Invertebrates..................................................................................................................... 668.3 FISH.......................................................................................................................................... 678.4 PINNIPEDS (seals)..................................................................................................................688.5 CETACEANS.............................................................................................................................698.6 Gaps and uncertainties................................................................................................... 70
9 RECOMMENDATIONS........................................................................................................ 74
9.1 Characterisation of the airborne and underwater environment of a wind
FARM .................................................................................................................................................. 749.2 Monitoring of the effects of offshore wind farms on marine mammal andfish behaviour/ecology............................................................................................................. 749.3 The effects of vibration on colonising organisms................................................76
10 ACKNOWLEDGEMENTS................................................................................................... 78
11 GLOSSARY............................................................................................................................... 80
12 APPENDICES............................................................................................................................ 83
12.1 Appendix A - Consultee database...........................................................................8412.2 Appendix B - Consultation letter and aims and objectives.........................8812.3 Appendix C - References.............................................................................................92
9
1 INTRODUCTION
1.1 Aims and objectives of the report
1.1.1 Offshore wind farm development
The UK has 40% of Europe’s total potential wind resource, with mean annual offshore wind speeds, at a reference of 50m above sea level, of between 7m/s and 9m/s. Research undertaken by the British Wind Energy Association suggests that a ‘very good’ site for development would have a mean annual wind speed of 8.5m/s. The total practicable long-term energy yield for the UK, taking limiting factors into account, would be approximately 100 TWh/year (DTI, 1999).
The UK Government is committed to new and renewable energy and is introducing a new Renewables obligation that will succeed the Non-Fossil Fuel Obligation (NFFO). This will be introduced in the Utilities Bill currently progressing through Parliament and will require power suppliers to source a specified amount of the electricity they supply to their customers from renewable energy.
The regulatory framework for offshore wind power development is likely to be the Transport and Works Act 1992 (Marcus Trinnick, Irish Sea Forum Meeting, 1999) with a requirement for Environmental Impact Assessments (EIA’s) to be carried out on a site by site basis (Metoc, 2000). To facilitate this, availability of data on environmental impacts of wind farms, together with any gaps and uncertainties on specific environmental issues and areas of concern need to be addressed.
1.1.2 Tender specifications for our report and our deliverables
Energy Technology Support Unit (ETSU), on behalf of the Department of Trade and Industry (DTI) commissioned the Centre for Marine and Coastal Studies (CMACS) in October 2000, to assess the effect of noise and vibration from offshore wind farms on marine wildlife. The key aims were to review relevant studies, reports and other available information, identify any gaps and uncertainties and make recommendations with outline methodologies, to address these. Factors addressed in this study include:
• Characterisation of noise and vibration generated by offshore turbine operation and construction activities.
• propagation and attenuation of noise and vibration above and below the surface.
• prediction of noise levels at the shoreline and impacts on marine wildlife.• Likely range of background noise above and below the surface.
10
• identification of the range of noise sensitive marine species most at risk to noise and vibration impacts related to UK offshore wind farms.
• The effects of noise and vibration on marine species.• The extent to which offshore wind turbines may provide physical
protection and new habitat opportunities.
1.2 Background to offshore wind farms
1.2.1 Lifecycle of an offshore wind farm
The lifecycle of offshore wind farms would consist of planning, development, commissioning, operation (and maintenance) and decommissioning stages. Each of these stages may exert environmental impacts, considered below.
1.2.2 Planning, development and areas of potential wind farm location
Site selection is dependent upon such issues as average wind speed, local conservation areas, shipping routes, bathymetry etc. initial areas of interest identified by the Crown Estates Commission include the Thames Estuary, the East Coast (Humber to Mid-East Anglia), The Solway Firth, Liverpool Bay and the Bristol Channel. The majority of these localities are predominately areas of sandy substrate with either underlying mud or gravel. The bathymetry at each of the sites generally ranges from 10m to 20m. The Bristol Channel is an exception with water depths ranging from 15m to 40m.
The Crown Estates as ‘landowners’ of the seabed within territorial waters, will lease sites prior to commencement of any work. The first round of applications, pre-qualification and allocation of sites closed on 9th February 2001. These sites will initially be restricted to a size of 10 square kilometres with permission to develop up to 30 turbines on each with a minimum output for the site of 20 MW. All the Crown Estate agreements will be subject to the developer obtaining all the necessary consents prior to development. prequalification depends upon satisfaction of the Crown Estate's requirements in respect of financial resources, together with expertise in offshore project management and wind energy. The Crown Estate will be announcing the potential sites for development of offshore wind energy, the companies and organisations that have successfully prequalified and the sites they are seeking to develop, on or soon after the 3rd April 2001.
1.2.3 Associated issues
Although this investigation primarily considers the possible effects of noise and vibration from offshore wind farms on marine wildlife, associated issues reviewed includes their potential role in marine productivity as artificial reefs providing areas of shelter and increased surface area available for colonisation (see Section 7). The laying of cables and their possible geomagnetic effects is also briefly considered in the conclusions (Section 8).
11
1.3 Structure of the report
• Section 2 briefly describes the methodology including the consultation exercise, literature review and database construction.
• Section 3 outlines concepts and terminology of acoustics and vibration, providing an overview prior to subsequent technical sections
• Section 4 considers ambient marine noise and vibration (physical, anthropological and biological).
• Section 5 describes a typical life cycle of a wind farm, together with information on noise production from onshore wind farms and existing offshore wind farm noise data.
• Section 6 considers those marine species likely to be affected by noise produced during offshore wind farm construction and operation: Cetaceans, Pinnipeds, Otters, Fish, Invertebrates, Plankton, and Algae. within each group the sensitivity, communication and known effects of anthropogenic noise are given together with the species known to be most sensitive.
• Section 7 addresses the issue of any provision of shelter, provision of new habitat and subsequent colonisation associated with offshore wind farms.
• Section 8 considers the possible behavioural and physiological impacts of the noise of operating offshore wind farms on marine wildlife groups and summarises gaps and uncertainties in current knowledge.
• Section 9 makes recommendations for addressing any gaps.
Appendices include hard copy prints of the consultee database, the library/reference catalogue and the inventory of operating and planned wind farms.
12

13

2 METHODOLOGY
The study was divided into three sequential phases as follows:
2.1 Phase 1
The initial phase was the identification and review of studies, reports and other available information pertinent to offshore wind farms. Key issues are noise and vibration produced during construction and operation, and their effects on marine wildlife. Information used in Phase 1 was collected by both a consultation exercise and literature review as follows:
2.1.1 Consultation
A cross section of stakeholders in the offshore wind industry were identified and a consultee database was constructed (APPENDIX A). The organisations included representatives of the following:
• British and European Wind Energy Associations• Turbine manufacturers• Offshore Wind Power developers, in the UK and Northern Europe• Regulatory bodies including English Nature, Countryside Council
for Wales, DETR, DTI, MAFF, Environment Agency etc• Sea Fisheries Committees.• Organisations holding relevant data (eg Sea Mammal Research
Unit, Ministry of Defence, Marine Conservation Society).• Academic/Research organisations active in this area.• other marine industries• Relevant NGO’s.
A consultation letter, together with the aims and objectives of the report (APPENDIX B) was sent to all parties on the database. This was followed up by telephone calls and e-mail contact as required. To communicate further the aims of the study a presentation was also made to stakeholders at the BWEA Conference on 5th December 2000. During the consultation exercise 98 organisations and individuals were contacted and 38 replies were received - 39% of recipients. The exercise allowed us to obtain information on the specific concerns and perspectives of the various stakeholders involved.
2.1.2 Literature review
As well as reviewing information provided during the consultation exercise, existing published and unpublished literature was reviewed. The following sources were of particular relevance:
14

• The Web of Science online database of abstracts (summaries) for reports in academic journals.
• Joint Nature Conservation Councils “Coasts and Seas of the UK” - a comprehensive database of information such as designated, protected coastal areas and important species found around the UK.
• Natural Environment Research Council (NERC) UK Digital Marine Atlas - a database of information for the UK’s coastal waters ranging from marine geology and geomorphology to seabird and mammal counts.
References obtained during the consultation exercise and literature review are collated on a Microsoft Access database. (APPENDIX C).
2.2 Phase 2
The next stage was the identification of gaps and uncertainties in existing knowledge and the recommendation of further studies needed to address these gaps. This included outlining methodologies for further information acquisition.
2.3 Phase 3
The final stage was the provision of an inventory of planned and ongoing studies and projects directly relevant, or complementary to the assessment of the effects of offshore wind-farms on marine life. The results of this phase are included in appendix D (Separate document - ETSU W/13/00566/00REP/A). This dataset is designed to allow maximum future synergy in updating knowledge on the ‘ecosystem’ effects of offshore renewable energy development. As one of the project deliverables is a database, this was designed using Microsoft Access (Office 97 Version) and includes a User Manual together with a CD-ROM. The design allows for ongoing update and review.
15
3 CONCEPTS AND TERMINOLOGY IN ACOUSTICS
3.1 What is sound/noise?
Acoustics is the study of sound. Sound is an aural sensation caused by pressure variations in the fluid surrounding an organism’s ear (or other hearing mechanism). The pressure variations, which are produced by a vibrating source, propagate in a longitudinal fashion ie via a succession of compressions and rarefactions radiating outwards from the source.
The simplest form of sound is one in which all the energy is transmitted at one pitch (frequency). A tuning fork emits this kind of sound, known as a pure tone, and its sound wave may be characterised by:
• Wavelength - the distance between two successive points of maximum compression or maximum rarefaction;
• Frequency - the number of vibrations or pressure fluctuations per second. The unit is the Hertz (Hz);
• Velocity - dependent on the medium (fluid) through which the sound wave is passing. Velocity is equal to frequency x wavelength.
The velocity of sound in air is approximately 330m/s (it varies slightly with temperature, pressure and humidity). In water, sound propagates with velocities of ~1500m/s (varying with temperature, pressure and salinity).
The amplitude of sound pressure waves is measured in Pascals (Pa). Because pressure amplitudes of sound show great variation, it is convenient to express these in terms of a logarithmic scale. Thus sound pressure level values are often determined and quoted in units of deciBels (dB), defined by:
Sound Pressure Level = 20 x log (Sound Pressure/Ref)
where Ref is a reference Sound Pressure which is taken as 20gPa for measurements in air, whilst 1gPa is commonly used for underwater measurements.
The sound power output from a sound source is the amount of acoustic energy radiated from the source per second. The unit of sound power is the Watt (W).
Sound intensity is defined as the rate of flow of sound energy through a unit area normal to the direction of propagation (travel) of the sound energy. Unitis the Watt per square metre (W/m2).
Noise is most simply defined as ‘unwanted sound’.
16
3.2 Frequency spectra & temporal variations
Sounds in the real world are rarely pure tonal in nature. They often consist of a range of tones of different frequencies. Frequency analysis of sound is often carried out to determine a sound’s various frequency components and their relative strengths. This information is often plotted as frequency spectra (graphs of sound pressure versus frequency).
Periodic sounds (those with pressure fluctuations that repeat regularly with time) consist of energy in a harmonic series. As well as a strong component at the lowest (fundamental) tone, periodic sounds also contain energy at frequencies that are equal to integer multiples of the fundamental frequency. These are known as harmonic frequencies and are represented by sharp peaks at regular intervals in the sound’s frequency spectrum. For instance, a periodic sound with a fundamental frequency of 50Hz may also contain sound energy at 100Hz, 150Hz, etc (2nd harmonic, 3rd harmonic, etc). A note from a musical instrument other than the tuning fork consists of a harmonic series, in which the harmonic frequencies are sounded with varying relative strengths. The relative strengths of the harmonic frequencies heard when a note is played determines the character of the instrument and its musical timbre.
Much environmental noise (including background noise) consists of random pressure fluctuations with no obvious periodic (repeating) component. This type of sound has a component of its energy at every frequency across a wide frequency range, and is known as broadband noise. A good example is the sound of rushing water.
it is usual to measure and plot frequency spectra for broadband noise in bands of frequencies. Each band has an upper and lower frequency limit; all sound energy at frequencies in between these limits is summed to give the band level. A band may be represented by a single figure (the centre frequency) which is the geometric mean1 of the upper and lower frequency limits of the band.
one type of frequency band commonly used is the octave band. These are designed to cover successive frequency ranges such that the centre frequency of each octave band is separated from the centre frequencies of the next octave bands above and below by a factor of 2. Thus octave bands in standard use are the 500Hz octave band (covering the frequency range 353-707Hz), 1000Hz octave band (,..707-1414Hz), 2000Hz octave band (... 1414-2825Hz), etc.
If slightly better frequency resolution is required, 1/3-octave bands may be used. These are constructed in a similar manner to octave bands but three 1/3- octave bands cover the same frequency range as each octave band. For example, the 1/3-octave bands 1250Hz and 1600Hz lie between the 1000Hz 1
1 the square root of the product of the upper and lower frequency limits
17
and 2000Hz 1/3-octave bands.
The strength (amplitude) of a sound source often varies with time. A transient (or impulsive) sound is one in which the pressure-time graph shows a sudden, rapid increase in pressure followed by a swift decay in amplitude. Explosions are extreme examples of transient sounds.
Continuous sounds, conversely, have pressure-time plots that display relatively steady peak pressure amplitudes over a lengthy period. A vibrating surface driven by a steady source (such as an idling engine) gives rise to sound that may be classified as continuous (depending on the time scale under consideration).
3.3 Human (and mammalian) hearing system
The human ear consists of three main parts: the outer ear, middle ear and inner ear. The outer ear collects airborne sound waves that then vibrate the eardrum, the interface with the middle ear. The middle ear transmits sound to the inner ear via a series of small bones. The inner ear consists of a balancing mechanism and the cochlea, a fluid-filled, spiralled tube that converts acoustic pressure waves into neuro-electrical signals that are then processed by the brain. This is achieved via thousands of tiny, very sensitive hair cells within the cochlea that detect the slightest movements of the cochlea fluid and transform these movements into nerve impulses.
Experimental work by Bekesy determined that high frequency sound sets into vibration the hair cells nearest to the entrance to the cochlea, whilst low frequency sound excites the hair cells closest to the apex of the cochlea spiral. Thus the cochlea is largely responsible for the high-resolution frequency discrimination mechanism of the human ear.
Other mammals have broadly similar hearing systems, though marine mammals lack the outer ear that is less useful underwater and reduces hydrodynamic drag.
The audible frequency range in humans is generally taken to be 20Hz to 20kHz. In fact, human hearing response can be represented by an audibility threshold curve that is plotted as amplitude versus frequency, and has the following general features:
• A broad minimum across the range of frequencies that are generally considered ‘audible’;
• A positive slope at the higher frequencies ie the amplitude necessary for a sound wave to be audible to humans, increases with increasing frequency above 20kHz. This is often termed the ‘supersonic’ frequency range;
• A sharply negative slope at the lower frequencies ie the minimum audible amplitude of low frequency sound increases rapidly with
18

decreasing frequency. The range of frequencies below 20Hz is often termed the ‘subsonic’ range.
Human audibility threshold curves vary slightly from one individual to the next. Similarly, other species also show great variation in audible threshold curves, though the overall shape is generally the same ie a minimum audible level (maximum sensitivity) across some intermediate frequency range, with increases (reductions in sensitivity) at the upper and lower ends of the spectrum.
The threshold curves described above relate to absolute audibility thresholds ie the threshold of audibility in the absence of any background noise. if background noise (which tends to be broadband in nature - see Section 3.2) is present at sufficiently high sound levels, it may have the effect of hindering the ear’s ability to distinguish a particular noise. This is known as masking.
A sound will only be masked by background noise within a certain frequency band. The detection of the sound depends on its level exceeding background noise level in this critical band by a certain critical value. Background noise at frequencies outside this masking bandwidth will not affect the ear’s ability to hear a sound whose frequency falls within the bandwidth.
These parameters are still not fully understood for human hearing, though there is evidence that the human masking bands may approximate to 1/3- octave bands. For non-human species, even less is known and much more experimental work is needed in this area.
3.4 Measuring sound and vibration
Microphones are designed to respond to, and measure, pressure fluctuations in the air. Hydrophones are their underwater equivalent.
Unlike the human ear (see Section 3.3), microphones and hydrophones tend to have a flat frequency response (equal sensitivity) to all sound frequencies. When measuring airborne sound, the output from the microphone is often ‘A- weighted’. This means that very low and very high frequency noise is de- emphasised in the recorded signal in an attempt to mimic the sensitivity of the human ear. Thus, the recorded sound may bear some relation to the sound that would be picked up by an average human ear. A-weighted sound levels are quoted in units of dB(A).
Because of the wide variation in hearing thresholds (audibility curves -see Section 3.3) between different animal species, sound levels that are A- weighted in this way are not necessarily a good indicator of the potential effects on non-humans.
19

Environmental noise that is considered to be ambient (ie background noise, for which no specific source can be pinpointed) is simply measured in terms of sound levels. Theoretically, the measurement position chosen will have no effect on the observed ambient noise sound level.
On the other hand, specific sources of noise will give rise to different pressure levels at different measurement positions (generally decreasing with increasing distance from the source - see Section 3.5 for more detailed analysis). For this reason, it is necessary when quantifying the sound output from a noise source to specify the distance from the source at which the measurement was taken.
A further complication occurs when the physical size of the source is large compared with the measurement distance. In this case, small changes in measurement position may lead to large variations in the measured pressure levels - this region is known as the near-field.
it is preferable to make measurements in the far-field ie at distances that are large compared with the dimensions of the sound source. In the far-field, the source may be considered to be a point source ie infinitesimally small.
The source level of a specific sound source is often quoted, as the (theoretical) sound level that would be measured at a distance of 1metre from the source. It is standard to give source levels for underwater sound sources in units of dBre:1pPa at 1metre, (or dB re:1pPa-1m).
Often, source levels cannot be measured directly and so are calculated by taking far-field measurements at a known distance from the source and estimating the propagation losses between the actual and theoretical (ie 1 metre from source) measurement distances, using the attenuation models described in Section 3.5.
Sound pressure levels measured in air and in water are usually stated with respect to different reference pressures (see Section 3.1). This is equivalent to a 26dB difference between airborne and waterborne sound measurements. In addition, the difference in acoustic impedance2 between the two fluids means that two identical sound sources (of equal sound power output) in water and in air, would not create sound waves of equal pressure amplitude above and below the surface. For these reasons, care must be taken when comparing sound/source levels measured in water and in air.
it is sometimes useful to measure the degree of vibration of a noise source. Vibration may be measured using accelerometers mounted on the vibrating structure. Accelerometers are designed to respond to variations in acceleration, measured in units of m/s2.
The frequency composition of accelerometer recordings may be analysed in
2 A measure of the resistance of a fluid to the establishment of pressure waves through it by a vibrating source immersed in the fluid.
20

terms of vibration spectra. Often sharp peaks are seen corresponding to resonant frequencies of the vibrating structure. By comparing the vibration spectrum of a vibrating source with a noise spectrum measured in the surrounding fluid, it is possible to calculate a transfer function, which reveals the relative ease with which various frequency components of the structural vibration are transmitted into waterborne/airborne sound waves.
3.5 Propagation of sound and vibration
The mechanisms by which sound propagates (travels) through both air and water are well understood. The primary cause of attenuation (reduction in strength) of sound waves is geometric spreading ie as sound radiates outwards from a source, the area through which the sound is passing increases and so the sound intensity (sound power per unit area - see Section 3.1) decreases. Geometric spreading may be modelled as described below (note that the models are rather oversimplified compared with real-world situations).
If sound energy is free to travel in all directions then spherical divergence of the energy occurs, and sound levels will decrease in proportion to the square of the distance from the sound source. This is equivalent to a 6dB drop for a doubling of distance, and is the method by which sound will dissipate geometrically in the air and in the deep ocean.
Propagation above water, in air, of sound from offshore wind turbines is likely to follow the spherical divergence law. However, the prevailing wind direction may distort the spherical contours of equal loudness surrounding a sound source, with enhanced propagation downwind and a shadow zone (reduced levels) in the upwind direction.
in addition, a sound source may have inherent directivity ie a tendency to propagate sound energy more strongly in some directions than others. Onshore wind turbines have been shown to propagate noise more strongly in directions perpendicular to the plane of the rotor blades, than in directions parallel to the plane of the blades (see Section 5).
in shallow waters, where most offshore wind turbines will be located, the underwater sound radiating from the tower structure may be channelled by the seabed and water surface. The sound energy will then only propagate in two dimensions ie cylindrical divergence, and sound levels will decrease in proportion to the distance from the source. in the logarithmic decibel scale, this is equivalent to a 3dB drop for each doubling of distance from the source. Very low frequency (long wavelength) waves are not sustainable in shallow water columns, and attenuate more rapidly.
As well as the attenuation caused by geometric spreading, sound energy is lost due to molecular absorption. Absorption loss follows a linear
21

relationship with distance (with units of dB/km), and the degree of absorption is dependent on a number of factors including temperature, pressure, humidity (for airborne sound), salinity (for underwater sound) and the frequency of the sound under consideration.
At the sound frequencies produced by operational offshore wind farms (see Section 5) and the distances (of the order of kilometres) where wind farm noise may be discernible above ambient noise levels, it is considered unlikely that absorption losses will be significant compared with the much greater attenuation due to geometric spreading.
However, inhomogeneities within the water such as air bubbles or suspended particles of sediment may cause scattering of sound energy and thus enhance absorption losses. This factor may be used beneficially eg by utilising ‘bubble curtains’ to absorb some of the sound energy during construction.
Variations in temperature, pressure, humidity, salinity, etc. also cause slight variations in the sound velocity of the fluid. If a water or air column has variations in sound velocity with depth, this can give rise to refraction of sound waves (bending of the waves towards the slower part of the medium). This phenomenon has an effect on propagation/attenuation models for sound.
For example, in the deep ocean, hydrostatic pressure increases with depth and thus so does sound velocity. This leads to refraction of sound waves upwards, causing enhanced acoustic propagation at shallow depths.
Knowledge of environmental conditions such as those mentioned above is therefore important when attempting to model sound propagation, in order to take refraction effects into account.
An air-water interface acts as a good reflector of sound energy and so transmission of sound across the sea surface is likely to be minimal, especially if a sound wave hits the interface at shallow angles of incidence (ie directions close to parallel to the interface). In fact, Snell’s Law determines that airborne sound waves incident on a planar (flat) water surface will only be transmitted into the water if the angle of incidence from the perpendicular (vertical) is less than 26°.
Thus, during a calm day (when the sea surface is smooth), airborne sound from a source such as an offshore wind turbine will only be transmitted into the subsurface within a 26° vertical cone centred on the source. Outside this cone, the airborne sound waves will be reflected, except during rough conditions when a high Sea State may provide the right circumstances locally to allow transmission of airborne sound into the subsurface further afield.
Underwater vibrating structures, such as wind turbine foundations, may transmit vibrations into the environment via two routes. Sound waves may
22
be set up in the surrounding water column which then propagate outwards by cylindrical divergence (see above), or the vibrations may be transmitted directly through the structure into the seabed. The latter involves more complex wave types than the simple longitudinal waves by which sound propagates. Detailed knowledge of local seabed geology is required at a specific site in order to attempt to model such vibrations.
Source levels (see Section 3.4) for underwater sound sources are quoted at a reference distance of lmetre, but are usually estimated from more distant measurements. it is important to specify the assumptions made (propagation model used and position where actual measurements were taken) when quoting estimated source levels.
23

4 AMBIENT MARINE NOISE/VIBRATION
4.1 Physical noise/vibration
Ambient ocean noise is caused by a plethora of natural sources and is characterised by extreme geographical and temporal variability.
4.1.1 Wind & waves
Wind and waves are common, interrelated sources of physical ambient noise in the oceans. The sound spectrum is broadband, with no tones. Noise levels tend to increase with increasing wind speed and wave height (‘Sea State’).
Sound level versus frequency curves for this ambient ocean noise tends to decrease logarithmically with frequency, with third-octave levels decreasing by ~2dB per octave. Levels in the 100Hz third-octave band range from 74dB re: 1gPa for Sea State 0 (calm) to over 100dB re: 1gPa for Sea State 6 (rough) (Wenz, 1962).
4.1.2 Rain
Precipitation noise from rain and hail is a naturally occurring ambient noise source. It is generally detectable above wind and wave noise above ~500Hz (Wenz, 1962).
4.1.3 Movement of seabed materials, especially gravel
The movement of material at the seabed, such as gravel, may make a significant contribution to physical ambient marine noise, especially near estuaries.
4.1.4 Natural seismic activity
Seismic noise from volcanic activity and underwater earthquakes may contribute to low frequency ambient noise in geologically active areas. This is not the case in the seas surrounding the U.K. and so seismic activity is not considered in this report.
4.2 Anthropogenic noise/vibration
4.2.1 Boats and shipping
Vessel noise is a combination of tonal sounds at specific frequencies (eg propeller blade rotational frequency and its harmonics) and broadband noise.
24

It can be considered a continuous (rather than transient) noise source.
Propeller cavitation noise is the primary source of sound from underway vessels, whilst noise from propulsion machinery originates inside a vessel and reaches the water via the vessel hull.
Larger vessels have more powerful engines and slower-turning engines and propellers. Larger hull areas more effectively couple machinery sound from within to surrounding water. Therefore, in general, the bigger the ship, the higher the source level produced and the lower the dominant frequency range of the noise. in addition, for a given ship size and design, sound power level increases with speed of travel.
Overall, vessel noise covers a wide range of frequencies from 10Hz to 10kHz. Source levels and dominant frequencies range from 152dB at 6300Hz for a 5m Zodiac with offboard motor, through 162dB at 630Hz for a tug/barge travelling at 18 km/hr, through to a large tanker with source level around 177dB in the 100Hz third octave band.
(all dB re: 1pPa at 1m, taken from Richardson et al, 1995)
4.2.2 Seismic surveying
Most energy sources used in seismic surveying nowadays are non-explosive. The most commonly used sources are air guns, which function by suddenly venting high-pressure air into the water. This produces an air-filled cavity that expands, then contracts, then re-expands; each oscillation creating a sound pressure wave.
The resulting noise is transient, with typically very high source levels over a range of low frequencies (10-1000Hz, with most energy in the range 10- 120Hz). Whilst the peak noise levels from airgun pulses are very high, the short duration of each pulse limits the total sound energy produced. it is common for arrays of airguns to be employed, firing every few seconds.
A typical noise spectrum from a 32-airgun array has peak levels of 210dB at 50Hz (with overall source level 216dB). The biggest arrays may have overall source levels up to 259dB.
(all dB re: 1pPa at 1m, taken from Richardson et al, 1995)
4.2.3 Drilling platforms
Oil and gas production at offshore locations around Britain tends to be carried out from bottom-standing metal platforms. The underwater noise from
25

platforms standing on metal legs, with machinery positioned well above the water surface, is expected to be relatively weak due to the small surface area in contact with the water and the low transmissibility of sound energy at the air-water interface.
Nevertheless, there have been some studies conducted to quantify the underwater noise produced by offshore drilling platforms. Gales (1982, reported in Richardson et al, 1995) made measurements in the near field (ie at close range relative to the size of the platforms), which are therefore not directly comparable with source level measurements. However, the results showed sound spectra with dominant tones in the very low to infrasonic frequency region (eg 5 Hz tone of level 119-127dB re: 1pPa at ranges 9-61m).
Drilling noise may be classified as continuous.
4.2.4 Construction
The two aspects of offshore construction that give rise to the greatest anthropogenic noise levels are dredging and pile-driving.
Dredging - is common in coastal waters to deepen channels and harbours, to create submerged platforms and for subsea mining. The underwater sounds from dredging are continuous, often tonal, and tend to be dominated by low frequency energy, though higher frequencies may also be present and conspicuous above background levels.
A typical dredging noise spectrum, as reported in Richardson et al, 1995, has peak levels of 178dB re: 1 pPa-m at 160Hz, with overall source level 185dB re: 1pPa-m.
Pile-driving - Impulsive hammering sounds associated with installation of a conductor pipe on an artificial island (Miles et al, 1987, reported in Richardson et al, 1995) were measured at levels as high as 131-135dB re: 1p Pa at range 1km. During hammering, blows occurred every 3 s, lasting 0.2s, and the transient signals had strongest components at 30-40Hz and ~100Hz.
4.2.5 Airborne noise
Airborne sounds from aircraft, ships and industrial sites may contribute to the airborne noise exposure of marine mammals when at the surface or hauled out in the case of seals. Unfortunately, many of the available data relating to airborne noise source levels are quoted as overall levels in A-weighted decibels (dBA), which may not be directly applicable when considering the effects of the noise on animals with different hearing sensitivity curves to humans.
Underwater noise from a passing aircraft is generally brief in duration
26

(transient), compared with the length of time for which the same aircraft can be heard above the surface. This is because most of the sound energy from an airborne source reflects off the air-water interface for all except the steepest (closest to vertical) angles of incidence (ie only when the aircraft is almost directly overhead does a significant amount of energy penetrate the water). Thus even supersonic aircraft, which emit high levels of low frequency sound energy due to the ‘sonic boom’ effect, only ensonify a given point underwater for a very short period of time (~ 100ms), because of their rapid overflight speeds.
Typical frequency spectra recorded underwater produced by aircraft overflights show peak levels at 63Hz, 152dB re:1pPa-m for a fixed-wing aeroplane, and at 16Hz, 159dB re:1pPa-m for a helicopter (from Richardson et al,1995).
4.2.6 Sonar
Military active sonars utilise very short (0.1-1000ms) pulses of sound for detection of underwater objects, navigation, depth-sounding etc (Richardson et al, 1995). Sonar frequencies range from a few hundred Hz to several hundred kHz. The source levels produced can reach as high as 230dB re:1pPa-m, but the total energy emitted is relatively low due to the transient nature of the sound pulse. In addition, most active sonars are highly directional and so only ‘ensonify’ a narrow cone of water.
4.2.7 Explosions
Underwater explosives are used for military purposes, for demolition work and as acoustic signal sources in ocean science studies. The impulsive waveforms created may have peak source levels as high as 279 dB re:1pPa-m, but most of the energy occupies the very low frequency to infrasonic (<20Hz) range.
Since the transient waveform is short in length, the positive acoustic impulse (the integral of the initial positive pressure pulse over time) is relatively low and not as potentially damaging as a continuous source of similar amplitude. However, research on blast damage to animals (Richardson et al, 1995) has shown that it is the positive acoustic impulse from explosive underwater sound sources that is crucial in determining organ damage.
4.3 Biological noise/vibration
Many marine mammals, fish and invertebrates are known to produce underwater sounds. Both Odontocete (toothed) and Mysticete (baleen) whales have a wide repertoire of underwater sounds. Such sounds are used extensively in a behavioural context. Mysticetes are capable of producing infrasonic frequencies, which are believed to be an important tool for both navigation and communication between distant individuals. In general, these sounds range between 0.01 to 3kHz with source levels of up to 188dB.
27
Odontocete sounds are considerably higher in frequency than those of the Mysticetes and range between 1 to 150kHz with source levels of up to 230dB. Many of the ultrasonic, echolocating sounds that they produce, are important tools for describing their environment and foraging.
Pinnipeds (seals) use a variety of sounds both in and out of the water to convey complex social information such as dominancy and territoriality. Vocalisation in both pinnipeds and sea otters is thought to be particularly important in the development of the mother-pup relationship.
Fish produce underwater sounds though stridulation (the rubbing together of body parts) and manipulation of the swimbladder. Generally, these sounds are low in frequency with some frequencies lying in the infrasonic spectrum. The importance of sounds produced by many fish is not fully understood. Stridulatory noises are thought to be associated with alarm, whilst resonant swimbladder sounds play a role in social communication. Frequencies range from 1 to 5kHz with source levels under 140dB for stridulatory noise and 0.5 to 3kHz with source levels up to 140dB for swimbladder resonance sounds in large fish. Sounds produced by invertebrates are characteristically high in frequency and mainly produced through stridulation. However, few studies have clearly established their behavioural significance. The sound produced by different marine groups are considered in more detail in Section 6.
220
— 200reQ.
1800)
m"O
% 160
2o. 140§3
« 120
100
♦ Seismic airgun
♦ Dredging
♦ Tanker (vessel)
Tug (vessel)*
5m Zodiac (vessel) ♦
♦ Piling (construction)^ Drilling platform
♦ Svante Offshore Wndfarm, Sw eden
X Highest Ocean Noise' . ||
1 10 100 1000 10000
Frequency (Hz)
Figure 1: A comparison of peak intensities in the frequency spectrum of noise for selected underwater anthropogenic noise sources.Partly adapted from Richardson et al. (1995). Svante Wind Turbine is given as the noise source level calculated from Westerberg (1999) measurements of noise levels at 100m from the Svante Wind Turbine. Highest ocean noise redrawn from Potter and Deiroy,1998.
28

29

5 OFFSHORE WIND FARMS
5.1 Introduction to wind turbines and wind farms
5.1.1 Components of a wind energy converter (WEC).
The WEC consists of several key components to convert wind energy into electrical energy. The nacelle houses the majority of the key components of the WEC including the turbine, which converts the mechanical energy from rotor blades, via the gearbox to electrical energy. It is specifically designed to accommodate the fluctuating mechanical power produced by varying wind speeds, speeds up to 1500 RPM.
Additional components include a cooling system for the generator and a hydraulics system to reset the aerodynamic brakes. The nacelle is situated on top of the tower.
The tower is slightly conical in shape, is usually constructed from steel and is connected to the base, which can be one of numerous designs. The two most common base designs are monopile and gravity floated.
5.1.2 Installation and commissioning
The installation of the turbine base depends upon the design to be used. The choice of base will be largely determined by local meteorological and oceanographic conditions. A monopile foundation uses a custom built drill bit to bore a hole into the seabed. The foundation is set using grout. In the case of gravity foundations the area is cleared of any obstructions, and the base is constructed in a drydock, floated to the site, and ballasted into position using sand. The turbine towers are then installed onto the bases, this is normally a multi-stage process depending on the number of sections in the tower. Upon completion of the tower, the nacelle is normally fitted within a couple of days. Like the majority of the components used in offshore wind energy converters, the rotors are pre-assembled onshore, and transported to the site. This reduces transportation costs and the time at sea. A rotor can be attached within a few days. The remaining components include cabling to shore, onshore electrical connection and turbine commissioning.
Cabling requires a small area of dredging and the use of specialist equipment to sink the cable into the seabed (~1m depth).
5.1.3 Decommissioning
As offshore wind farms are still in early stages and with the design life of turbines estimated at between 20 and 50 years, it will be some time before decommissioning becomes an issue. However, factors to take into
30

consideration will be the degree of colonisation that has taken place and the disposal of materials involved.
5.2 Noise/vibration from operational offshore wind farms:
Very little data are available regarding measured levels of noise and vibration near operational offshore wind farms.
An EIA for the proposed offshore wind farm at Radsand, Denmark (SEAS Distribution A.m.b.A., 2000) does not give absolute sound levels, but states that, “it has been estimated that the submarine noise will at most be audible to porpoises at a distance of a few metres and to seals maybe up to 20 metres from the foundations”. Also, the contribution of airborne sound from the turbines to overall noise levels at a “nearby seal reserve” (distance not specified) and at the closest coastline, were estimated to be ~10dB and “a few dB” respectively.
A similar EIA for the proposed Horns Rev Offshore Wind farm, Denmark (Elsamprojekt A/C, 2000), makes very little reference to potential noise pollution except to say, “submarine noise from the turbines... may locally have an influence on the distribution of fish, but seen as a whole, [this impact is] most likely negligible”.
Westerberg (1994) made a series of measurements at the world’s first offshore wind turbine - “Svante” (which has a tripod foundation), off the Southeast coast of Sweden. Using a hydrophone, the underwater sound levels were recorded, at various distances from the turbine, for different wind speeds. Westerberg’s study focussed on sound frequencies below 100Hz. It was not possible to translate the entire paper from the Swedish original due to time constraints, and so the detailed methodology used is not clear. However, the main feature of the results was the presence of low frequency tones in the narrowband frequency spectra, corresponding to harmonics of the blade passing frequency (~2Hz) of the tower. The strongest peak, the 8th harmonic (~16Hz) was at a sound level ~20dB above background noise (at a distance of 100m from the turbine). This seemed to be the case regardless of wind speed (ie noise from the turbine and ambient noise levels increased at the same rate with increasing wind speed) such that the relative intensity of the turbine noise remained constant.
From this measurement, an estimate can be made of the wind turbine’s source level (ie the predicted sound level at a distance of 1 metre from a point source of equal sound power output). Assuming attenuation loss (or gain) of ~3dB per doubling (or halving) of distance from the turbine (see Section 3.5), the level at 1m from the tower would be ~35-40dB above ambient noise levels. Assuming ambient levels are ~80dB re: 1qPa (fairly calm sea state), the estimated source level of the turbine is ~115-120 dB re: 1qPa-1m, which is significantly lower than other anthropogenic noise sources in the ocean (see Section 4.2). Note, however, that many assumptions are involved in this calculation.
31

The Dutch company Haskoning recently completed a relatively comprehensive study on behalf of Novem BV at a nearshore wind turbine with monopile foundations, in the Ijsselmeer near Leylstad in the Netherlands. This involved measuring underwater sound levels at a range of distances from the turbine, in relation to the frequency and magnitude of the vibration levels in the tower (Haskoning/Novem BV, personal communication, February 2001). However, at the time of writing it had not been possible to acquire the data from this study.
Despite the scarcity of firm data, it is commonly anticipated that the sound levels produced by operational offshore turbines are small compared with those from other anthropogenic sources, or compared with background noise levels (see Section 4, Metoc, 2000).
Offshore wind turbines installed at Tuno Kn0b were modified to run at a rate 10% faster than comparable onshore turbines, “because noise emissions are not a concern” (http://www.windpower.dk, Offshore Guided Tour).
It has, unfortunately, not been possible to acquire any data relating to measurement of tower vibration levels for offshore wind turbines. Such whole-structure vibration would be expected both during operation of the turbines and during periods of non-operation (due to buffeting of the tower by the wind, underwater currents etc.).
5.3 Brief overview of operational onshore wind farm noise/vibrationand applicability to the offshore situation
Because of the scarcity of offshore wind turbine measurements, it was considered appropriate to consider the noise and vibration characteristics of onshore turbines. This is a field in which many studies have taken place, and the results and conclusions of these studies are expected to be comparable from those expected for offshore turbines.
Overall source levels for onshore wind turbine noise are typically 90-100dB (Taylor, 1992). These levels are dependent on many environmental factors including wind speed and direction, and wind farms that consist of many turbines naturally cause higher levels of radiated noise at a given measurement distance than would a single turbine at the same distance.
Altener GDWF (1996) suggests minimum distances from wind farms at which the nearest dwelling should be located, in order that the airborne noise from the wind farm is at an acceptable level within the dwelling. For a single 500kW turbine, an “exclusion zone” approximating to a circle of radius 300m should be allowed for (in reality, this circle will be distorted by the prevailing wind into an ellipse parallel to the wind direction). For two such machines in a row, this critical distance is increased slightly to about 320m along the row, but perpendicular to the row the nearest dwelling should be situated 372m away. Noise propagation from wind farms that consist of a linear array of
32

turbines, is therefore expected to be greater in the direction perpendicular to the line of turbines.
The noise radiated from a wind turbine arises from two main sources: mechanical and aerodynamic noise (Bullmore et al, 1999).
Mechanical noise radiates from the gearbox and/or generator, which are situated within the tower nacelle. Mechanical noise is generally tonal and occupies the lower end of the frequency spectrum (typically between 100- 500Hz). It may break out by one of two routes: an airborne path or a structure borne path. Airborne noise is directly radiated from the surfaces of mechanical components in the nacelle, setting up a sound field within the nacelle. This internal noise can then escape to the atmosphere, either via openings in the nacelle or by breakout through the nacelle walls. Structure borne sound escapes via excitation of structural elements of the tower to which the vibrating machinery is attached. These structural waves then propagate away from the input point until they reach elements of the structure that are exposed to the atmosphere (eg tower walls or the rotor blades themselves), whereupon noise can be radiated into the surrounding air.
Sound insulation of the nacelle cover and anti-vibration mounting of machinery within the nacelle may be used to reduce airborne and structure borne sound respectively.
Aerodynamic noise radiated from wind turbines has a number of possible sources. For the purpose of this report, it is sufficient to point out that aerodynamic noise tends to increase in line with increasing turbulence in the incident airflow; turbulence itself increasing with roughness of the surrounding terrain.
At sea, the ‘terrain’ roughness is usually relatively low (zero roughness corresponds to a perfectly flat surface). Therefore, the level of aerodynamic noise radiated from an offshore wind turbine would be expected to be less than that from an onshore turbine (especially one located in hilly terrain), all other environmental factors being equal.
Careful design of blade shape and profile may help to reduce aerodynamic noise emissions.
Aerodynamic noise tends to occupy the frequency range 650-8000Hz, with spectra peaking at around 1-2kHz. It is the dominant noise source on modern wind turbines as a lot of work has gone into reducing mechanical noise emissions. Mechanical noise is easier to reduce and its tonal nature gives greater potential for annoyance reactions in humans than an aerodynamic noise of the same loudness. Furthermore, the louder the mechanical noise output from a wind turbine, the less efficiently it is likely to be running. Therefore, there is an indirect cost incentive to minimise the mechanical noise output.
33
In terms of the likely underwater noise from turbines operating offshore, most of the airborne sound energy (outside a vertical 13° cone centred on the turbine rotor - see Section 3) is expected to reflect off the air-water interface and not reach the sub-surface. The greater part of the noise entering the water column is expected to go through the tower structure. However, it is this noise (mechanical in origin) that is most mitigated for in the design stage to increase efficiency/longevity of turbines.
Thus it can be speculated that underwater noise levels due to operation of offshore wind farms should be minimal. There is, however, a need to quantify this by collecting direct data.
Because the predicted propagation path of noise from offshore turbines into the water is via the turbine tower, measurement of tower turbine vibration data assumes greater priority. At present few published reports into wind turbine noise contain tower vibration data. The comprehensive study “Wind Turbine Measurements for Noise Source Identification” (Bullmore et al, 1999) gives data from accelerometers mounted on various items of machinery within the nacelle, but no direct measurements from the tower wall. The acceleration levels that are given are displayed in the form of frequency spectra, with amplitudes in dB with no reference level - without which absolute acceleration levels cannot be determined. However, assuming the reference level used to be 10-6m/s2, the peak vibration levels shown in that report (~70dB) correspond to absolute levels of ~3mm/s2.
Another study (Snow, 1997) did measure tower vibrations by attaching an accelerometer directly to the tower wall. The report gives a frequency spectrum for these vibrations, but unfortunately the emphasis of the report was on tonal frequencies rather than absolute levels; the ordinance is displayed in “arbitrary units”. The peak level in the spectrum is 1.2x10⁻³ “arbitrary units”. If we assume the arbitrary units to be m/s2, then these tower vibration levels are of the same order of magnitude (~mm/s2) as the inferred nacelle machinery vibration levels in the report considered earlier (Bullmore et al, 1999).
Again, though, there is a need to quantify tower vibration levels for operational offshore wind turbines. Ideally, these would be carried out at the same time as underwater noise measurements near the tower, so that a Transfer Function for vibrations from tower to surrounding water could be calculated to deduce the efficiency with which the vibration levels in the tower are transferred into the surrounding medium as sound energy.
Tower vibration levels are likely to be strongest at the natural resonant frequency of the turbine itself, which is a function of tower dimensions. This information should be available from turbine manufacturers, though it was not possible to acquire such data in this study.
Both airborne/waterborne noise and tower vibrations are likely to be ‘modulated’ (ie have periodic variations in amplitude) due to an effect called ‘blade swish’. The mechanisms that cause this are not fully understood, but
34

possibilities include directionality (variations in amplitude with orientation) of the sound emitted from the rotor blades as they rotate, or ‘tower shadow’ effects (as a blade passes in front of the turbine tower it is momentarily shielded from the wind). The effect of blade swish on the frequency spectrum is to introduce peaks at the blade-passing frequency and its harmonics (See Section 3). Typically, a three-bladed turbine will rotate at a rate of 30 revs/minute (0.5Hz), giving a blade-passing frequency of 1.5Hz with harmonics at 3Hz, 4.5Hz, 6Hz etc. The relative strengths of these harmonics seems to vary between individual turbines.
5.4 Construction noise/vibration from offshore wind turbines:
The loudest sources of noise and vibration during construction of offshore wind farms are likely to be piling and dredging. Boat noise will be relatively high in the area during the construction phase as the turbine towers and their foundations are brought out to sea and emplaced. See Section 4 for detailed discussion of the noise characteristics of these activities at sea.
A Danish summary paper (“Environmental Impact Assessment of the First Four Offshore Wind farms in Denmark”), speculates about the effects on marine mammals of offshore wind farm construction, and suggests that “shortterm intense activities during construction are probably of less importance” than operation and maintenance noise from the wind farms.
Drilling/piling of tower foundations may cause underwater noise disturbance but, if necessary, this may be mitigated for by using devices such as underwater ‘bubble curtains’ that prevent the propagation of underwater noise waves through interference effects.
5.5 Factors affecting propagation and attenuation of noise fromoffshore wind farms:
Offshore wind turbines are generally situated in shallow waters, and so the underwater sound emitted from them is likely to be channelled between the surface and seabed. The sound will undergo attenuation due to cylindrical divergence, equivalent to a 3dB drop per doubling of distance (Westerburg, 1994).
However, this model may be an oversimplification. If the seabed is sloping, sound energy may become focused up-slope (ie towards the coast in most cases) from the turbines, in which case the attenuation in this direction may be slightly less than 3dB per doubling of distance. Conversely, attenuation rates slightly greater than 3 dB per doubling of distance may prevail down-slope (ie out to sea) as sound waves diverge.
Underwater sound waves travelling towards an estuary may be focused both vertically and horizontally, further enhancing propagation (and reducing attenuation). However, the increased level of suspended sediment near river
35

mouths may mitigate this effect somewhat via increased absorption of sound energy.
6 NOISE/VIBRATION: EFFECTS ON MARINEWILDLIFE
The 'marine wildlife' considered in this report, are those species commonly present in UK waters. In the absence of information for Northeast Atlantic species, similar species from other areas of the world will be considered as being indicative of likely effects. The groups of organisms that will be discussed are:
• Cetaceans - This group includes the mysticetes (the large, baleen or filterfeeding whales) and the odontocetes (toothed whales, which also includes all the species commonly known as dolphins and porpoises).
• Pinnipeds (seals) and 'sea' otters - Of the pinnipeds, only the phocinid or 'true' seals are seen around the UK.
• Fish - The teleost (bony fish such as cod and herring) and elasmobranch fish (cartilaginous fish such as the sharks and rays)
• Invertebrates - This term refers to all marine animals, other than the above, that lack a 'back-bone' (e.g. crustaceans such as the lobster and molluscs such as the octopus and squid).
• Plants and Algae - Considered here are the marine algae (seaweeds).
For each of the above groups, the general range of species that may be sensitive will be identified. For the most part, this will be based on their presence or absence in UK coastal waters. Following this, hearing and sensitivity, sounds produced, and the reported effects of anthropogenic noise (noise from human activities) will be considered where appropriate. This information will be used to identify those species in UK waters that will be most sensitive to offshore wind farms and the range of possible impacts posed by the noise and vibration of offshore wind farms.
However, it is necessary to consider a few concepts that are relevant to all marine wildlife groups, prior to considering them individually.
6.1 Hearing and sensitivity
The hearing ability of marine animals (although more specifically for marine mammals), is a function of the following characteristics and processes;
• Absolute hearing threshold curve - the level of a sound that is barely audible in the absence of significant ambient noise is the absolute hearing threshold. This varies with frequency, giving a threshold curve with reduced sensitivity at low and high frequencies and maximum sensitivity in an intermediate frequency range. The graph of this information, threshold verses sound frequency is termed the audiogram, which is species-dependent. In this report, audiograms for species discussed refer
36

to 'behavioural' audiograms. These are produced under controlled laboratory conditions on trained animals. The behavioural audiogram gives sound levels for each frequency that are both detectable by the subjects and are effective in eliciting a specific behavioural response, such as moving away from the noise source.
• Individual variation - Auditory sensitivity varies between individuals. Published audiograms for most species are based on data for only one or two individuals, particularly so for marine mammals due to the difficulty and cost in training captive animals. Thus, whilst audiograms are a good indication of the range of frequencies detectable by a species, and the sound levels at each frequency that elicit a behavioural response, they are only an indication.
• Masking - As discussed above, hearing threshold audiograms represent the lowest levels of sound detectable in a quiet environment. However, the sea is a very noisy environment, even in the absence of anthropogenic noise (see Section 4.1). Ambient noise often interferes with or masks the ability of an organism to detect a sound signal, even when that sound is above the absolute hearing threshold. The obvious implication here is that anthropogenic noise can lead to masking of sound used by organisms for communication, detecting predators and prey. The signal-to-noise ratio (SNR) (where signal = sound level and noise = ambient sea noise level), the amount by which a pure-tone sound signal must exceed ambient noise levels is termed the 'critical ratio' (CR). CR's have been determined for some species by presenting a pure tone to an organism in the presence of ambient noise, and recording the intensity required for the pure-tone to be heard over the ambient noise. Masking bands describe the range above and below a single frequency important to a species within which ambient noise may mask that frequency if at a high enough intensity.
• Localisation - Sound source localisation is the ability of an organism to determine the direction from which a sound is arriving. This is important in detecting and responding to predators, prey and other individuals of the same species. Organisms must be able to determine the direction of a sound over ambient noise levels.
• Frequency and intensity discrimination - This refers to the ability to discriminate sounds of different frequencies and levels, particularly over ambient noise levels
6.2 Zones of noise influence
If a noise is within the threshold of an animal, the distance the animal is from the noise source dictates, to an extent, the effect. This is referred to as the 'zone of noise influence', of which there are four;
• Zone of audibility• Zone of responsiveness• Zone of masking• Zone of physiological effect (such as hearing loss, discomfort or injury)
The most extensive of these conceptual zones is the 'zone of audibility', the
37
area within which the organism might hear the noise. Following this, the 'zone of responsiveness' is the region within which the organism reacts behaviourally or physiologically. The 'zone of masking' is the region within which noise is of a high enough intensity to mask other sounds such as communication. Finally, the 'zone of physiological effect' is the area around the noise source in which the noise is at a damaging level.
The above concepts are considered in more detail below, for certain groups of marine organisms. Furthermore, it is expected that the underwater noise and vibration produced by operating offshore wind farms (and related construction/decommissioning activities), will be predominantly low frequency in nature, as discussed in Sections 4 & 5. Thus, this section will primarily consider the effects of low-frequency noise and vibration. All sound levels given in this section are in decibels (dB) with respect to 1 pPa-m, unless stated otherwise.
38

100 1000 10000 100000
Frequency(Hz)
Figure 2: Audiograms of marine mammalsUnderwater behavioural audiograms of odontocetes and pinniped seals adapted from: bottlenose dolphin (A) - Au 1993; Bottlenose Dolphin (L) - Ljungblad et al. 1982; harbour porpoise - Anderson 1970; harbour seal - Kastack and Schusterman 1995
130
120
110
100
90
80
70
6010
/ /j Salmon
100 1000
Frequency (Hz)
Figure 3: Audiograms of fishUnderwater behavioural audiograms of fish adapted from: cod - Chapman and Hawkins 1973; salmon - Hawkins and Johnstone 1978; dab - Chapman and Sand 1974
39

Bottlenose dolphinEcholocation 2 ->150kHz 110-130kHz up to 218- 228Whistles 0.8- 24kHz - 125- 173Low-frequency narrowband < 2kHz 0.3-0.9kHz -Harbour porpoiseEcholocation 110-150kHz - 135-177Clicks 2kHz - 100Atlantic white-sided dolphinWhistles - 6-15Hz -White-beaked dolphinEcholocation to 325kHz - < 207Squeals - 8-12Hz -Common dolphinEcholocation 23-67kHz - -Whistles - 2-18Hz -Chirps - 8-14Hz -Barks - < 0.5-3Hz -
MinkeDownsweeps 60-130Hz - 165Moans/grunts 60-140Hz 60-140Hz 151-175Ratchet 850Hz-6kHz 850Hz -Clicks 3.3kHz-20kHz <12kHz 151Thump trains 100Hz-2kHz 100-200Hz -SeiFM sweeps 1.5kHz-3.5kHz - -BlueMoans 12-390Hz 16-25Hz 188HumpbackSong components 30Hz-8kHz 120-4000Hz 144-174Moans 20Hz-1.8kHz 35-360Hz 175Pulse trains 25-1250Hz 25-80Hz 179-181Underwater blows 100Hz-2kHz - 158
Harbour sealSocial sounds 0.5-3.5Hz - -Clicks 8-150kHz 12kHz-40kHz -Roar 0.4-4kHz 0.4-0.8kHz -Bubbly growl <1kHz-4kHz <100Hz-250Hz -Grey sealClicks, hiss 0-30, 0-40kHz 0.1-3kHz -6 call types 0.1-5kHz Up to 10kHz -Knocks Up to 16kHz - -
Stridulatory 100Hz -5kHz - Under 140Swimbladder 50Hz - 3kHz - Under 140Choruses <4kHz - Up to 120 in
highest 1/3octave
Stridulator 2-10kHz - under 140
40

6.3 Cetaceans
6.3.1 Species under consideration:
World wide, the Order Cetacea comprises some 78 species (Dolman & Simmonds, 1998) grouped into two families:
• The mysticetes (the large, baleen, filter-feeding whales)• The odontocetes (toothed whales, which includes all the species
commonly known as dolphins and porpoises).
Twenty three different species of cetacean have been spotted in UK coastal waters in recent years (WDCS 2001b). Coasts and Seas of the United Kingdom (1996) list the following species as being present throughout the year, or during some period of the year, in the five areas identified by the Crown Estates Commission as potential areas for wind farm sites.
• The East Coast (Humber to Mid-East Anglia) - Harbour porpoise (Phocoena phocoena), white-sided dolphin (Lagenorhynchus acutus), white-beaked dolphin (Lagenorhynchus albirostris), minke whale (Balanoptera acutorostrata) and killer whale (Orcinus orca)
• Thames Estuary, Kent and Essex Coasts - Harbour porpoise, bottlenose dolphin (Tursiops truncatus), common dolphin (Delphinus delphis) and long-finned pilot whale (Globicephala melas)
• Bristol Channel, South Wales and North Cornwall Coasts - Harbour porpoise, bottlenose dolphin, common dolphin, stripped dolphin (Stenella coeruleoalba), risso’s dolphin (Grampus grisue), long-finned pilot whale, killer whale, fin whale (Balanoptera physalus) and sperm whale (Physeter macrocephalus)
• Liverpool Bay/East Irish Sea - Harbour porpoise, common dolphin and bottlenose dolphin
• Solway Firth, Cumbria - Harbour porpoise, common dolphin and bottlenose dolphin
It should be noted, however, that whilst the above species of cetaceans have been observed within the respected areas, abundance's range from rare to common. Furthermore, numbers differ seasonally as many of these species are spotted whilst passing through an area on their migration routes. In addition, whilst some species have UK resident populations, such as the bottlenose and harbour porpoise, they may forage over very large areas.
One of the most common UK cetaceans is the harbour porpoise (Phocoena phocoena). This species is found in the coastal waters of the North Atlantic and North Pacific and constitute the only member of the porpoise family found living in European waters. The majority of sightings occur within 10km of the coast (WDCS 2001a) and they frequently visit shallow bays, estuaries and
41

tidal rivers. Of particular importance, they are present in various concentrations in all five of the areas identified by the Crown Estates Commission as areas of interest for offshore wind farm locations (see Section 1.2). They are more commonly observed inshore during the summer and offshore during the winter, following prey movements. The harbour porpoise is listed in Annex II of the EC Habitats Directive as a species whose conservation requires the designation of Special Areas of Conservation (SAC). The possible impacts of noise and vibration on this species are therefore of particular significance.
The common (Delphinus delphis), bottlenose (Tursiops truncatus) and white- beaked (Lagenorhynchus albirostris) dolphins are also of importance due to their numbers around the UK. With respect to the five areas identified by the Crown Estates Commission, the common and bottlenose dolphins are predominantly seen in sites on the West and Southwest coasts, whilst the white-beaked dolphin is the most frequently observed cetacean on the East Coast of the UK. The bottlenose dolphin is listed in Annex II of the EC Habitats Directive. As a result of this, Cardigan Bay and the Moray Firth in Scotland are designated as candidate Special Areas of Conservation (cSAC).
Whilst most mysticetes, such as the fin whales, are only rarely seen or only seen in small numbers, the minke whale (Balanoptera acutorostrata) is quite common on the East Coast, particularly around the Farne Islands off the Northumberland Coast (an existing offshore wind farm site) (Evans, 1996; Thompson, 2001, pers. Comm.). As will be discussed below, mysticetes use low-frequency sounds in communication.
6.3.2 Hearing and sensitivity
The way in which marine mammals differ to other mammals is in their 'absolute hearing threshold curve'. Whereas in humans the 'absolute hearing threshold curve' rises markedly around 20kHz (thus requiring a sound of 21kHz to have a very high sound level for a human to hear it), the upper hearing threshold in dolphins (for example), reaches frequencies of up to 150kHz. However the hearing threshold curve, or behavioural audiogram, has only been determined for a few odontocetes (Figure 2) and none of the large mysticete whales (for review, see Au, 1993 and Richardson et al 1995). Furthermore, audiograms for most species studied are only based on one or two animals and thus the effect of individual variability can be relatively large. However, it is anticipated that auditory sensitivity of marine mammals should closely reflect the range of sounds that different marine mammals produce.
Behavioural audiograms for the bottlenose dolphin, Tursiops truncatus (see Figure 2) (Johnson 1967, Ljungblad et al. 1982 and Au 1993) indicate that hearing ranges from approximately 75Hz to 150kHz with the best sensitivity between 10kHz-60kHz. At 75Hz, however, the audible threshold is approximately 130dB, ie sounds with an amplitude of <130dB at 75Hz will not be detected. It should be noted that behavioural audiograms have only
42

been developed for a few individual bottlenose dolphins, and thus are only indicative. Furthermore, there is considerable variation in low-frequency sensitivity between the audiograms of Au (1993) and Johnson (1967) with those described by Ljungblad et al (1982). Johnson (1967) and Au (1993) found bottlenose's sensitivity to extend as low as 75Hz with sound levels of 130dB whilst Ljungblad et al report sensitivity extending only as far as approximately 1100Hz with sound levels of 125dB.
The extent to which a noise must exceed ambient noise levels in the sea, in order for it to mask communication, has not been determined for the bottlenose for frequencies below 6kHz. At 6 kHz, noises must exceed ambient levels (approximately 80dB) by 22dB (Richardson et al. 1995). Wind farms are not expected to produce noises that will exceed ambient levels at this frequency. However, the lack of available data makes it very difficult to draw any conclusions on their sensitivity to low frequency sounds or the possibility of wind farm noises masking their sensitivity and communication.
Anderson (1970) presents the only behavioural audiogram obtained for a harbour porpoise (see Figure 2). Greatest sensitivity was found between 8kHz to 40kHz, with general sensitivity from 1kHz to 150kHz. At 1kHz sensitivity was approximately 75dB.
Popov et al (1986), presents an audiogram based on auditory evoked potential (AEP) data from four porpoises. AEP audiograms differ from behavioural audiograms in that they describe data about the relative sensitivity of some part of the sensory or nervous system, rather than behavioural reactions. These AEP audiograms suggest best sensitivities in the harbour porpoise at around 30kHz and 125kHz. However, considering that porpoises are reported to produce sounds below 1kHz, it is possible that they have relatively good hearing at these frequencies. Again, the lack of available data for the harbour porpoise makes it very difficult to draw any conclusions on their sensitivity to low frequency sounds.
In general, it appears that the odontocetes are most sensitive to sounds in the frequency range of approximately 10kHz-60kHz, although their audible sensitivity to low frequency noise is poorly understood. They have good frequency discrimination (Ketten and Wartzog 1990; Ketten 1994) and intensity discrimination (Dubrovski 1990; Richardson et al 1995), directional hearing and source localisation (Richardson et al 1995).
Behavioural audiograms for the mysticete whales have not been produced due to the difficulty of keeping such a large animal in captivity and then training it to respond to sounds of different frequencies. Furthermore, nothing is known of their sound localisation, frequency and sound intensity discriminatory abilities. However, it is thought that they have relatively good hearing at low frequencies. Potter and Delroy (1998) speculate that a large mysticete such as a fin or blue whale, which vocalise at 15-20Hz may have a behavioural audiogram with an optimal frequency centred at 50Hz or lower, whilst smaller mysticetes may have audiograms centred in the hundreds of Hz. Thus it is
43
very possible that they will be sensitive to the sounds produced by offshore wind farms, which are expected to exceed ambient noise levels only at very low frequencies.
6.3.3 Sound production in mysticete cetaceans
Sounds function as tools to communicate information regarding the presence of danger, food and other individuals of the same species. Sounds are also used to communicate information regarding an individual's position, identity, territory or reproductive status. As mentioned above, several mysticete species are common to the UK and thus the sounds they produce are of importance. All mysticetes produce intense, low frequency sounds, many of which can be detected over hundreds and even thousands of kilometres. The frequency of these calls varies from below 10Hz to 25kHz (Thompson et al 1979; Watkins et al 1985, Richardson et al 1995). The open ocean species appear to use much lower frequencies than species found closer inshore, probably due to the fact that low frequency sounds travel much further in the open water. Some examples for species observed around the UK in recent years, are considered below.
Minke whales produces a range of sounds from downsweeps of 130-60Hz at 165dB to moans and grunts between 60-140Hz with sound levels of 151- 175dB and clicks between 3300Hz and 20kHz at approximately 151dB (Richardson et al. 1995). Humpback whales (Megaptera novaeangliae) produce highly complex songs that vary in frequency from 100Hz to 8kHz. Sound levels average 155dB and range from 144 to 174dB (Thompson et al 1979). Dolman et al. (1998) reports that humpback songs have a range of 10 to 20km. Further examples are given in Table 1 (located at the start of Section 6).
6.3.4 Sound production in odontocete cetaceans
Toothed cetaceans can produce a large repertoire of complicated sounds (see Table 1). These are categorised as narrow-band whistles and tones (Schultz et al 1995) or broader-band clicks and pulsed sounds which are used for echolocation (Dolman et al 1998). Echolocation clicks are transmitted from the front of the head in a highly directional beam and are emitted in a rapid series with a variable repetition rate depending on the required resolution. More powerful sounds are capable of debilitating or disorientating prey species. For reviews on echolocation, see Au et al. (1997).
Odontocete vocalisation has been extensively studied in the bottlenose dolphin and harbour porpoise. Tests on the bottlenose dolphin have shown that their echolocation clicks are broadband and range from a few kHz to >150kHz with dominant echolocation frequencies of 110-130kHz and source levels of 218- 228dB (Au 1993). Bottlenose dolphins also produce whistles between 800Hz and 24kHz with source levels of 125-173dB.
44

Harbour porpoises produce narrow-band clicks with a frequency range of 110- 150kHz at a source level of 135-177dB (Akamatsu et al 1994; Dolman et al 1998) which they use to locate and prey on sand eels and small cephalopods hidden in bottom sediments. They also produce low frequency sounds around 2kHz (Anderson, 1970; Amundin, 1991) and 20kHz (Kamminga and Wiersma, 1981), which may be used in communication (Amundin 1991). Verboom & Kastelien (1995; cited in Hoffman et al 2000), report the detection of whistle-like sounds with frequencies varying from 47Hz to more than 600Hz, not previously reported for harbour porpoises. Thus, harbour porpoises seem to use a variety of sounds ranging from infrasonic frequencies as low as 47Hz to ultrasonic echolocating sounds. Of note, Connelly et al. (1996; cited in Dolman et al 1998) suggest that the harbour porpoise is capable of discriminating and exploiting small sound pressure level variations, probably used to locate prey.
6.3.5 Effects of anthropogenic noise and vibration
Intense sounds within the audible range of cetaceans have the potential to impact on their behaviour and/or physiology. Simmonds and Dolman (1999) provide a comprehensive list of the possible impacts to marine mammals in general, where behavioural impacts include the gross interruption or modification of normal behaviour, displacement from an area, masking of communication with conspecifics (individuals of the same species), masking of other biologically important noises and interference with the ability to acoustically interpret their environment. Physical impacts include temporal or permanent hearing threshold shifts and gross physical damage to hearing apparatus and body tissues. Other impacts of noise can result in decreased viability of an individual, increased vulnerability to disease and increased potential for impacts from cumulative effects, such as chemical pollution combined with noise-induced stress. Furthermore, habituation to noise impacts may exacerbate other effects.
However, there are very few reports of physiological damage or adverse conditions linked to anthropogenic noise and very little is known of the frequencies and sound intensities required for physiological damage. Recently, concerns have been raised over noises such as sonar eg low frequency acoustic sonar (LFAS) (for review see Malakoff 2001) and explosions (Lien et al 1993; Ketten et al 1993; Ketten 1995). Andre et al. (1997) report a permanent threshold shift in the ears of two sperm whales, possibly induced by the long term exposure of the animals to very intense shipping. However, these noise sources tend to be of very high intensity (see Section 4.2.1 and Figure 1). The majority of reactions in cetaceans to noise are of a behavioural nature.
Cetaceans show a behavioural response to a range of anthropogenic noise sources in the ocean. Most commonly, observations are linked to vessel noise. This noise is probably a good substitute for assessing the possible reactions of cetaceans to wind farm noise as they are both continuous in nature, low frequency and of similar sound intensities (see Figure 1).
45

Dolphins of many species show tolerance to and may even approach vessels, whilst at the same time, other members of the same species may show avoidance. This may be a factor of the dolphins activity and internal state where resting or foraging dolphins may avoid vessels, whilst socialising dolphins may approach them (Shane 1990; Acevedo 1991; Richardson et al. 1995).
Harbour porpoise are normally considered shy and their reaction to disturbance, is often flight (Flaherty 1981; Taylor and Dawson 1984; Barlow 1988; Palker 1993). However, they are often observed in areas of intense shipping activity (Hoffman et al. 2000). Similar behaviour has been observed in beluga whales (Delphinapterus leucas) to ice-breaking vessels.
An obvious problem with the reactions of cetaceans to vessels is that it is not known whether avoidance is in response to noise generated by vessels, or simply to visual or auditory cues, ie some cetaceans are simply being cautious and moving away from a strange object
It is thought that the mysticete whales will be most sensitive to the noise produced by wind farms, due to their use of very low frequency sounds for communication. Certainly the reactions of mysticete whales to anthropogenic noise is well documented, with reactions ranging from avoidance or attraction, to apparent habituation (see McCauley 1994; Richardson and Malme 1993; Richardson et al 1991, 1995; Dolman and Simmonds, 1999). However, the noise sources that usually accompany these behavioural reactions are extremely loud such as those of seismic airguns (see Section 4.2.2 and Figure 1). A range of mysticetes including the minke, humpback and odontocetes such as the white-sided and white-beaked dolphins (both observed in UK waters), have all been observed to be disturbed by seismic testing (Bowles et al. 1994; McCauley et al. 1998; Stone 1997, 1998). Avoidance behaviour has been induced at distances of up to 370km from the seismic source.
Mysticetes use of low frequency sound may be masked by anthropogenic noise. Au et al. (1985) noted an increase in a beluga whale's vocalisation as it moved into an area with higher ambient noise levels and Lesage et al. (1999) report that beluga’s vocalisations changed in rate, type and frequency in response to anthropogenic noise input.
Zones of noise influence (including noise masking) have only been developed very arbitrarily and only for a few species to specific noise sources, such as the beluga to ice breaker vessels (Erbe and Farmer 2000a; for reviews, see McCauley, 1994, for zones of noise response in marine mammals to seismic noise and Richardson et al, 1995 for noise in general). Whilst zones of noise influence around offshore wind farms have not been developed for any species to date, Erbe and Farmer (2000b) present a novel software model to estimate zones of impact on marine mammals
Tolerance and habituation in cetaceans has not been rigorously investigated. However, there are several examples of 'apparent' cases:
46

• Mysticetes continue to use shipping lanes in the St. Laurence estuary and off Cape Cod each year despite frequent exposure to heavy vessel traffic (Richardson et al. 1995).
• Bowhead whales (Balaena mysticetus, a mysticete species) continue to return to areas in the Canadian Beaufort Sea where there has been considerable seismic investigation in previous years (Richardson et al. 1987).
• Humpback whales off Newfoundland tolerate repeated exposure to strong noise pulses from nearby explosions (Lien et al. 1993).
• Grey whales (Eschrichtius robustus) continue to migrate through heavily travelled shipping lanes and areas of seismic exploration along the West Coast of North America twice a year (Richardson et al 1995)
• Odontocetes in general habituate to areas of consistent noise following initial avoidance reactions (Richardson et al. 1995).
In the absence of behavioural audiograms, it seems appropriate to assume that mysticetes are sensitive to the same frequencies and possibly, volumes they produce and thus, would be sensitive to low frequency noises. Noises from offshore wind farms will therefore probably be in the frequency range to which they are sensitive. It is therefore possible that mysticetes will show some behavioural reactions. However, as these mammals have good frequency and sound intensity discrimination they may not be troubled by the addition of turbine noise to the general ambient noise in the sea.
6.3.6 Summary
All cetaceans are known to produce underwater sounds. These sounds are used extensively in a behavioural context. Mysticetes are capable of producing infrasonic frequencies that are believed to be an important tool for both navigation and communication between distant individuals. Odontocete sounds are considerably higher in frequency than those of the mysticetes. Many of the ultrasonic, echolocating sounds that they produce, are important tools for describing their environment and for foraging.
The hearing range of odontocetes extends from less than 1kHz to more than 100kHz. However, they are only influenced by low frequency sounds at relatively high sound levels. In the bottlenose, this level is 130dB. Generally, odontocetes have good hearing to frequencies in the range 10kHz to 60kHz. (see Figure 2). They have good frequency discrimination and intensity discrimination, directional hearing and source localisation. Mysticete whales have relatively good hearing at low frequencies and are likely to be able to hear the noise and vibration of offshore wind farms.
Noise from anthropogenic sources may cause pronounced short-term behavioural reactions and temporary displacement of certain cetaceans. However, the continued presence of cetaceans in many areas of high anthropogenic noise such as shipping channels suggests tolerance of human
47

activity. There is little information regarding whether or not animals that tolerate chronic noise exposure are stressed or otherwise deleteriously affected. It is possible that many of these questions will be answered in the near future as, particularly in America, there is a large campaign to further investigate the effects of low frequency sound on marine mammals and mysticetes in particular. Unfortunately, many of these investigations are ongoing at this time and results have not yet been presented (see Appendix D, a separate document).
It is likely that minke whales will also be sensitive through their use of low- frequency noise. However, with no data on the audible thresholds of mysticete whales, it is not currently possible to predict the extent of this sensitivity.
6.4 Pinnipeds and otters
6.4.1 Species under considerationThe only pinnipeds found on the UK coasts are the common or harbour seal (Phoca vitulina) and the grey seal (Haliocherous grypus), members of the phocinid or 'true' seals. As with the bottlenose dolphin and harbour porpoise, it is difficult to predict how sensitive these two seal species will be to the noise produced by offshore wind farms. Both the grey and harbour seal are protected under the British Conservation of Seals Act (1970) and are listed in Annex II of the EC Habitats Directive. The otter (Lutra lutra), although predominantly freshwater, has adapted to the marine environment in some coastal areas, most commonly in Scotland. It is unlikely that otters will be sensitive to the noise and vibration of offshore wind farms as they tend to forage for prey predominantly in the intertidal zone and wind farm sites are expected to be several miles offshore.
6.4.2 Hearing and sensitivityPhocinid (or 'true') seals characteristically have flat underwater audiograms that range from 1kHz to ~50kHz with threshold sensitivity of 60 to 82dB (Richardson et al 1995) (see Figure 2). The lowest limit of sensitivity (although only established for a single individual), was at approximately 100Hz. At 96dB (Kastak and Schusterman, 1995). Also, Richardson et al (1995) report that the audiograms for phocinid seals that have been established for more that one individual show considerable intraspecific variability, ie differences between individuals within the same species. Thus, even if phocinid seals can indeed perceive noise in the frequency range below 1000Hz, they would probably not be able to hear it above general ambient noise levels.
Unlike whales and dolphins, pinnipeds spend a portion of their lives on land and thus, vocalise both in and out of the water. In-air sensitivities for harbour and grey seals are generally very similar to human sensitivity, with best sensitivity from approximately 2kHz to 20kHz. However, several in-air behavioural audiograms have shown that some harbour seals can perceive sound in air at frequencies as low as 100Hz, but require sound levels of 96dB for noises at this frequency to be heard (Kastak and Schusterman, 1995).
48

6.4.3 Sound production
Vocalisation in the grey and harbour seals has been studied extensively and is summarised in Table 1 (Renouf 1984; Perry et al. 1988; Assellin et al 1993; Hanggi et al 1994; Caudron et al 1998; McConnell et al 1999; McCulloch et al 2000, Van Parijs et al 1999, 2000). Out of the water, low frequency calls and visual signals are used to determine territory and dominance of haul-out areas (Sullivan 1982). Haul-out areas are locations where seals haul themselves out of the water. Typically they are rocky outcrops, sand banks or sheltered beaches.
6.4.4 Effects of anthropogenic noise and vibration
As discussed for cetaceans, intense sounds within the audible range of pinnipeds have the potential to impact on their behaviour and/or physiology.
There are very few reports of physiological damage or conditions linked to anthropogenic noise and very little is know of the frequencies and sound intensities required for physiological damage. Documented effects exclusively consider the effect of high intensity sound. For example, Bohne et al. (1985) describe the presence of lesions in the ear of weddel seals (Leptonychotes weddelli) that were linked to the blasting of holes in ice by dynamite and an audible threshold shift has been described for harbour seals exposed to sand blasting (Kastack and Schusterman, 1996).
Similarly, very little is known regarding the effect of noise on the behaviour of the UK's harbour and grey seals in the water as most studies have been conducted on hauled out animals. Conducting studies on hauled-out seals is further compounded by the difficulty in determining whether the reactions recorded were to the emitted noise or were caused by visual cues.
The noise frequency of on-shore wind farms is expected to be broadly comparable to the airborne noise of offshore wind farms (but at lower sound levels). The on-shore airborne noise frequency is generally 500Hz to 2kHz with source levels of 90-100dB (See Section 5.3). Harbour seals best sensitivity within the range 500Hz to 2kHz is approximately 80dB (Kastak and Schusterman, 1995). Thus, whilst they will probably hear the airborne noise of an offshore wind farm, it will only be 10-20dB above their lowest audible threshold at the base of the turbine.
The most common reaction of seals to anthropogenic noise, is to simply enter the water (Reijnders 1981; Richardson et al. 1995)
The reaction of seals to construction and construction related activities are not well known. However, from the observations that have been recorded, their effects appear to be insignificant. Richardson et al. (1995) reports that artificial island construction and operation has little effect on ringed seals and that harbour seals in Alaska continued to haul out during construction of a
49

hydroelectric facility approximately 1.6Km away. Gentry et al. (1990) report that the only response of Northern fur seals to the heavy equipment operating only 100m away, was to display an alert posture.
There is some data on the reaction of seals to seismic survey devices such as air guns. In a recent study by the Sea Mammal Research Unit (SMRU 2001), harbour and grey seals were subjected over two years to simulated seismic survey noise from an airgun with a source level of 215-224dB. The results indicate that seals behaviour was affected by airgun noise, leading to an avoidance reaction, but responses were short-lived with no apparent long-term effects. Richardson et al. (1995) report that seals in both water and air sometimes tolerate strong noise pulses from non-explosive and explosive scaring devices, especially if attracted to an area for feeding or reproduction. For example, Acoustic Harassment Devices (AHD), scare pinnipeds away from fishing nets and fisheries through the emission of strong noise pulses in the frequency range 11-17kHz with source levels of approximately 187- 195dB. These devices have had some success. However, Mate (1993) reports that whilst harbour seals have been monitored to avoid nets where AHD's are present, the scaring effects seems to decrease with time as some large individuals are reported to display habituation.
In general, it is thought that seals tolerate and habituate to anthropogenic noise and activity, once the animals realise the noise source is not a threat. For example, both grey and harbour seals in the UK permit the close approach of tour boats that repeatedly visit haul out locations (Bonner, 1982; pers obs).
Evidence of habituation to noise in seals is presented by observation of the grey seals 1.5km from Nasrevet Wind farm, 3km offshore to the Southwest of Gotland, Sweden. This wind farm is comprised of five turbines of 500kW, each 40m in height, with a well-established local grey seal colony (Westerberg, 1999). The results of observation prior to, during construction, and in the first year of the wind farms operation, gave no indication that the seals were affected. The only impact observed was avoidance of boats that passed close to the haul out site during the construction phase.
With respect to masking of communication, critical ratios have been developed as far as 1100Hz for the harbour seal underwater. At this frequency the critical ratio is approximately 20%, which is equal to 16dB above ambient levels (Richardson et al. 1995). It is unlikely that wind farm noise at this frequency will be above ambient levels. However, no records of critical ratios at lower frequencies in seals have been determined.
6.4.5 Summary
Pinnipeds use a variety of sounds both in and out of the water to carry complex social information such as dominancy and territoriality. Vocalisation in both pinnipeds and otters is thought to be particularly important in the development of the mother-pup relationship. Whilst audiograms for otters
50
have not been developed, audiograms for phocinid seals show that they are generally sensitive to sounds in the frequency range 1-50kHz. Comparisons of audiograms for different individuals show that there is high variability. There is some evidence to suggest that harbour seals can detect noises of frequencies at low as 100Hz (see Figure 2), however, as audiograms have only been established for a few individuals, the accuracy of this information cannot be established.
The majority of reports concerning the effects of noise and vibration on pinnipeds show that the most common response is simply a short-term avoidance reaction. Certainly, Westerberg’s (1999) report that seals have shown no significant changes in behaviour to the presence of an offshore wind farm, and other observations of the reaction of seals to anthropogenic noise and activity, suggests that they tolerate on habituate to noise/activity once a threat is not perceived. Impacts related to the noise produced by offshore turbines are therefore likely to be minor and short-term.
6.5 Fish
6.5.1 Species under consideration:
The groups under consideration are the elasmobranch and teleost fish. The elasmobranchs comprise the sharks such as the basking shark (Cetorhinus maximus) observed during the summer off the coast of Devon and Cornwall, and within the Irish Sea. The basking shark is listed as vulnerable in the ‘1996 IUCN Red List of Threatened Animals’ with respect to its global status and is fully protected from intentional capture or disturbance in British waters under Schedule 5 of the Wildlife and Countryside Act (1981 as amended).
The teleosts include the majority of the commercially fished round and flatfish species in the UK such as herring (Clupeiformes species), cod (Gadus species), plaice (Pleuronectes platessa) and sole (Solea solea). Many fish species possess a gas-filled organ termed the swimbladder used for buoyancy and in noise perception.
6.5.2 Hearing and sensitivity
Fish hear/sense noise and vibration in two ways; through the inner ear and through the swimbladder. The swimbladder is a membranous, gas filled sac located in the body cavity below the spine of most teleost fish (for review, see Hawkins, 1986; Pitcher, 1986). Fish with larger otoliths (ear bones) may be more sensitive to low-frequency sounds than fish with smaller otoliths. However, it is not known how well otolith size and fish size correlate between species.
The otoliths are important in the detection of flow fields (hydrodynamic/water movements). The most important flow fields fish encounter are those caused
51

by the motion of other animals, whether these are predators or prey. These flow fields are of a low frequency nature depending on the size of the animal. The frequency content arising from ordinary swimming movements is usually below 40-50Hz with higher frequencies only generated in the case of abrupt movement such as escape responses or predator attacks (Hoffman et al 2000). Low frequency sound has the character of hydrodynamic motion in the near field, thus it is likely that wind farms will produce flow fields. However, Hoffman et al. (2000) conclude that as a result of the spatial dimensions of wind farm flow fields, fish are not expected to be impaired in their ability to detect and interpret the flow fields of different sources (ie as produced by other swimming animals or wind farms).
Numerous families of fish have also developed hearing through the use of the swimbladder. However, some fish such as plaice posses a swimbladder as planktonic juveniles that is used for buoyancy, but once the plaice become adults and migrate to the bottom of the water column, the swimbladder is lost. This phenomenon is also observed in many species of sharks and rays, where the swimbladder is absent as adults.
Behavioural audiograms for different species of fish vary enormously (Figure 3; for review, see Hawkins 1986). In general however, most fish can hear within the frequency range of 60 to 3000Hz outside of which their hearing thresholds increase markedly. However, Sand et al. (2000) demonstrated avoidance response to infrasounds at a frequency of 11.8Hz in migrating European silver eels (Anguilla anguilla), and Karl sen (1992) reports that plaice (P. platessa) are sensitive to sound frequencies as low as 30-100Hz.
Sensitivity to sound levels also differs between species. Hearing ‘specialists’ have sensitivities as low as 50dB and ‘non-hearing specialists’ have best sensitivities from 110dB.
Several species of fish, such as the salmon and cod (Hawkins, 1986) have good sound frequency and intensity discrimination, and can discriminate sounds of different frequencies and levels over ambient noise (Hawkins and Chapman, 1975; Hawkins and Johnstone, 1978; Fay and Popper, 1980).
The sensitivity of particular fish species to noise and vibration will depend on:
• The audible threshold. Species such as the eel, cod and herring all have thresholds that are reported to extend below 100Hz
• The presence of a swimbladder. Fish with swimbladders will be more at risk than those without. Thus teleost fish are potentially more sensitive than the sharks and rays (elasmobranchs), many of whom, do not posses a swimbladder.
• The size of the swimbladder. Larger fish whose swimbladders resonate at lower frequencies will be more sensitive to wind farm noise than smaller fish whose swimbladder volume is less. For example, cod as compared to the generally small marine gobies.
• Mechanical coupling of the swimbladder to the ear. Fish with mechanical
52

coupling of the swimbladder to the ear will be most susceptible to trauma of the ear through the transmission of sound pressure energy directly to the otoliths, such as found in the herring.
• The resonance frequency of the otolith system. Possibly, the larger the otolith, the lower the frequency it resonates at.
Furthermore, behavioural features such as schooling/aggregating behaviour may also influence the sensitivity of fish to offshore wind farm noise. Fish that form schools for breeding may be particularly susceptible, as any disruption to reproductive behaviour could result in reduced reproductive success. Acoustically mediated changes in behaviour such as startle and alarm responses have been documented in some species such as herring and cod. The species in which juvenile fish aggregate in a specific area such as a ‘nursery ground’ may also be more sensitive as nursery grounds are usually areas that have some advantages to the success of the species. Fish that use nursery grounds include the herring, cod, and haddock, whiting and flat fish such as plaice and sole.
6.5.3 Sound production
It is reported that more than fifty families of fish contain sound producing species (Myrberg, 1981, cited in Hawkins, 1986). Of these species, many produce calls as part of a particular behaviour pattern and sounds are believed to stimulate a change in the behaviour of other individuals within the same species, or different species (for review, see Pain 2000). The majority of sounds produced by fish are the result of two mechanisms; stridulatory apparatus noises (rubbing hard parts of the body together), or by applying vibration patterns to the swimbladder. These sounds vary in structure depending on the mechanism used to produce them, but generally, they are composed of frequencies below 3kHz.
Swimbladder sounds have a resonant sound that commonly range between 100 and 1000Hz depending on the frequency the swimbladder resonates at and the depth and size of the calling fish (McCauley 1994). Stridulatory noises range between 0.1-5kHz (source levels of 140dB) whilst the frequency of swimbladder sounds range between 0.5-3kHz (source levels up to 140dB) (see Table 1, located at the start of Section 6).
6.5.4 Effects of anthropogenic noise and vibrations
In general, fish only respond consistently to sound and vibrations of either very low or very high frequencies (Knudsen et al 1992; 1994; Nestler et al 1992).
Studies have shown that noise such as that associated with shipping causes avoidance or attraction (see Table 1). Experimental studies of the reactions of cod and herring to playback of vessel noise show that avoidance occurs 118dB
53

within the frequency range of 60-3 000Hz, whilst sounds in the range of 20- 60Hz have no effect (Engas et al., 1995). Changes in the schooling behaviour of fish due to vessel noise has been reported by Olsen et al 1982a, 1982b; Dalen & Raknes, 1985, 1986. These changes include the formation of tighter schools, schools rapidly descending or turning away from a noise source, increased swimming speeds and panic fleeing (McCauley, 1994). Levels of 120-130dB are suggested as the sound level to which herring, cod and polar cod show behavioural reactions to the continuous sound produced by vessels.
Zones of noise influence have been poorly defined in fish. To an extent, this is a result of the fact that they are such a diverse group with gross variability in their morphology, sensitivity and behaviour. The extent of this variability in fishes sensitivity and behaviour to anthropogenic noise is illustrated by McCauley (1994) who has broadly estimated for fish, the zones of noise influence to large seismic airguns (source levels >200dB). McCauley gives the following ranges;
• Zone of audibility - 10m to 10km• Zone of response - 10m to 10km• subtle responses - 2-10km• alarm responses - 600m to 1km• startle responses - 150-300m• Zone of avoidance - 10m to 1km with most reactions between 200m and
1km• Zone of physiological effects - 10-200m with most reactions between 50
and 200m
Chapman and Hawkins (1969) documented the effects of seismic gunshots with a source level of 220dB, on fish via an echo sounder. The fish species was believed to be whiting. During intermittent firing of the gun, the school of fish showed a sudden downward movement. The sound level to which the fish showed an avoidance reaction was 185-192dB (with respect to the vertical distribution of the school). The gunshots were fired for approximately one hour at a time, towards the end of which the fish appeared to show habituation to the noise. Pearson et al. (1992) found a similar response threshold in rockfish of 180dB to cause an alarm response and 160dB to elicit subtle changes in behaviour of rockfish to seismic sounds.
Several investigators have demonstrated that discharge from an array of seismic guns used under realistic conditions influence both the spatial distribution and catch rates of fish. Engas et al (1996) monitored catch rates of cod (G. morhua) and haddock (Melanogrammus aeglefinus) before, during and after local seismic investigation in the Barents Sea. They report that the seismic shooting (10-150Hz with source levels of 253dB) reduced haddock catches by 70% and 50% in cod. Furthermore, these effects were shown to extend beyond the limits of the seismic survey area to the edge of the 40 by 40 nautical mile investigation area. In addition, Engas et al. (1996) report that a relatively larger decrease in catches was observed in bigger fish (>60cm) than in smaller fish. This may be a result of the fact that larger fish with
54

swimbladders of greater volume are more susceptible to low-frequency sound than smaller fish. In a similar investigation by Skalski et al. (1992), the effect of sound from seismic guns on rockfish was monitored. A sound level of 186dB was recorded at the point where rockfish aggregation occurred. During seismic shooting, the aggregated fish stayed lower in the water column and didn’t rise, reducing the catch-per-unit-effort (CPUE) by approximately 50%.
Two investigations of the effects of offshore wind farm noise and vibration on fish have been carried out around the Svante Wind farm situated off the Southeast Coast of Sweden (Westerberg, 1999). In the first investigation, the possible disturbance of eel migration past the wind turbine (in a north to south direction) was investigated by telemetry tracking and an analysis of the catch statistics near the site of the wind farm. Two groups of eels were tracked travelling in a southerly direction past the wind farm; one group whilst the turbine was in operation, the other whilst the turbine was in a non-operational phase. Of the 16 eels followed, only 2 deviated from the normal migratory direction (one during operation of the turbine and one during a non- operational period). Westerberg reports that there was no difference between the two groups with respect to migration speed or distance from the turbine (between 500-2000m) and that no changes in behaviour could be related to the presence of the turbine. As discussed in Section 5.2, the peak noise generated by the Svante turbine is between 102 and 113dB for winds of 6 and 12m/s respectively at a distance of 100m from the turbine
Westerberg’s comparison of eel catches five years prior to construction of the wind farm, and five years following construction and operation found no significant reduction, south of the wind farm, in post-constructional eel catches. This indicates that the wind farms construction and operation has had little effect on the migration of eels. Following this, Westerberg compared CPUE in eels for different wind speed, prior to and following construction. The results of this indicated that at wind speeds of 5m/s (just under the operational threshold of the turbine) there was no significant difference in pre and post-constructional CPUE. At wind speeds of 10-15m/s however, a significant difference in CPUE was found; post-constructional CPUE south of the wind farm had been reduced by 22%. This suggests that the wind farm may have impacted on eel migration when wind speeds are high.
In the second investigation, Westerberg examined the CPUE of the general fish community in two zones around the Svante wind farm whilst the turbine was operating and during non-operational periods. The first zone had a radius of 200m from the wind farm. The second zone encompassed the area between 200-800m from the wind farm. The CPUE was analysed for the three most common species, cod, roach and shorthorn sculpin. For cod, CPUE was greater in zone one (close to the turbine) than in zone two and CPUE was greater whilst the turbines were not operating. However, whilst CPUE was reduced in zone one whilst the turbine was operating, it remained greater than the CPUE in zone two whilst the turbine was idle. These results were also seen in sculpin and roach suggesting that the turbine act as a fish attraction device (FAD) (See Section 7). Whilst the turbines are idle, fish move in close
55

to the structures. Upon activation of the turbine, some individuals move away (thus accounting for the lower CPUE), but the numbers left are still greater than in zone two (200-800m). This indicates that the sound level in zone one is not of a high enough intensity to deter the majority of the fish in that zone.
This corresponds with McCauley’s (1994) sound level range of 120-130dB required to elicit behavioural reactions to the continuous sound produced by vessels in herring, cod and polar cod. Fish have also been noticed in close proximity to wind turbines at Blyth, Northumberland. Indeed, guillemot birds have been observed diving into the water within 20m of the turbines, to catch fish (Grainger 2001, pers. Comm.).
56

6.6 Invertebrates and plankton
6.6.1 Species under consideration:
The marine invertebrates such as the crustacean lobsters and molluscan squid and octopus, are an extremely diverse group with very different morphology and internal anatomy.
Many planktonic species are marine invertebrates and fish (including fish eggs) in early stages of their life cycle. The effects of noise and vibration have not been studied extensively across these groups, therefore, this section will consider any species for which data has been collected.
6.6.2 Hearing and sensitivity
Hearing and sensitivity in planktonic fish is generally the same as that described for adult fish. However, the definition of hearing is a loosely defined term when applied to marine invertebrates. Few marine invertebrates possess sensory organs that can perceive sound pressure. However, invertebrates do possess two classes of sensory organs through which sound may be perceived, mechanoreceptors and statocyst organs. Invertebrates may respond to high amplitude, low frequency (< 100Hz), sounds akin to hydrodynamic motion or flow fields, principally via mechanoreceptors (Hawkins & Myrberg, 1983, cited in McCauley, 1994).
It has also been postulated that marine invertebrates are receptive to the particle acceleration component of a sound wave, possibly in the far field (McCauley, 1994)
Some relevant studies are summarised below:
• Sounds in the frequency range 10-75Hz can cause the heart beat of lobsters (Homarus americanus) to slow down (Offut 1970, cited in McCauley, 1994)
• The brittle star (Ophuira ophuira) can detect both near-field vibrations down to a few Hz and far-field pressure waves (Moore and Cobb, 1986).
• The octopus, Octopus vulgaris and the squid, Loligo vulgaris (both cephalopods), are sensitive to sound frequencies below 100Hz with best sensitivity below 10Hz (Packard et al. 1990). The stimulus is thought to be the particle acceleration component of the sound wave.
• Maniwa (1976) demonstrated that the squid Todarodes pacificus could be attracted to pure tone sounds at 600Hz using a source level of 160dB. This technique is commonly used to commercially catch squid.
Zones of noise influence for invertebrates are, however, poorly understood.
57

6.6.3 Effects of anthropogenic noise and vibration
Reports describing the impacts of noise on invertebrates and planktonic organisms are few in number and almost exclusively consider the effects of geophysical survey, particularly the effects of 'airguns' used in seismic surveys. However, the general consensus is that there are generally few effects, behavioural or physiological, unless the organisms are very close (within metres) to a powerful noise source. For further reviews see McCauley, 1994; Brand & Wilson, 1996.
This is also true for juvenile fish and fish eggs. In general, Kostyuchenko (1971) (cited in McCauley 1994) suggests pathological effects on plankton out to ten metres from an airgun array, with known effects demonstrated to five metres only. More recently Booman et al (1996) (cited in Johnstone 1999) investigated the effects of seismic sounds on various eggs and larvae of fish. They used carefully calibrated sound sources that generated maximum intensities of 242dB at 0.75m and 220dB at six metres. They saw no effects in cod and saithe eggs. Cod embryos suffered no ill effects but they saw increased mortalities in saithe embryos. Cod yolk sac fry experienced mortalities on exposure but only at 0.75 metres. Turbot fry died in increased numbers out to three metres. They saw no differences in herring fry in the range 2-5 metres but mortalities overall, including controls, were very high making comparison problematic. Older cod larvae were susceptible but only at close range (20% mortalities at 0.9m; 3% at 1.3m; 0% at 1.7m).
Thus, seismic sounds of high intensity have the capability to injure or kill fish eggs and larvae in the near field, metres from the sound source. It is highly unlikely that wind farms could produce sounds of this intensity.
There are very few reports concerning the effect of surface vibration on organisms, particularly sessile organisms that attach to hard surfaces. However, an investigation of the Horns Rev offshore wind farm in Denmark, (Bio/consult 2000, cited in Leonhard 2000) reports fouling by invertebrates on the mono-pile masts, five months post-construction. The fouling invertebrate species included bryozoans (Bryozoa species) sea anemones (Urticina felina and Actinariidae species), sea squirts (Ascidiacea), star fish (Asterias species), polychaete worms and common mussels (Mytilus edulis). The noise and vibration of the Horns Rev wind farms does not appear to have had any detrimental effects on the invertebrate fauna. The Horns Rev turbines are similar in design to those expected to be erected around the UK (and very similar to the Blyth turbines). Leonhard’s investigation is a good indication that the noise and vibration that will be generated by UK turbines will not be of sufficient intensity to exclude colonising invertebrates.
In an investigation of whether escape response in North Sea brown shrimp (Crangon crangon) was triggered by ground vibration produced by shrimp catching gear, Berghahn et al. (1995) found that the 'tail-flip' escape behaviour was a result of changes in water currents produced by the fishing gear, rather than the ground vibration.
58

6.7 Plants and algae
It is very unlikely that the noise and vibration produced by offshore wind farms will impact on marine plants and algae (seaweeds) directly. However, they could be affected by general changes in the local ecology of an area. Thus, plants and algae are considered in Section 7.
59

60
7 COLONISATION, SHELTER AND PRODUCTIVITY
Offshore wind farms have the potential to provide ‘artificial’ habitat and shelter effects that could increase the diversity, size and productivity of local marine communities. In this, they could function as ‘artificial reefs.’
7.1 Artificial reefs
Artificial reefs are defined as submerged man-made structures placed intentionally underwater to mimic some characteristics of natural reefs through the provision of a basis for growth and production of marine life. These constructions may, if properly designed, provide habitat for a variety of marine fauna and flora, providing food and refuge to a number of fish species, and generally contribute to the biodiversity of a region. ). The MCS lists the following environmental benefits of artificial reefs (MCS 2000):
• Creation of new habitats and associated increased species diversity• Provisions of hard substrata for larval settlement in areas dominated by
soft substrates• Provision of a variety of surfaces for attachment relative to current
direction• Crevices providing shelter for fish and shell fish from predation• Protection of fishing and nursery grounds and benthos against impacts
from trawling• Offshore barriers for coastal protection.
Technically, turbine foundations do not fall into this definition, as their primary function is not that of an artificial reef. However, the Marine Conservation Society (MCS) notes that a wide variety of man-made structures unintentionally mimic the characteristics of a natural reef in some fashion. These structures, which may include turbine foundations, are referred to as secondary artificial reefs (MCS 2000).
The effects of a range of secondary artificial reef structures have been investigated from oil platforms to wood and concrete pilings and pontoons (Connell and Glasby 1999; Page et al. 1999; Love et al. 1999, 2000; MCS 2000
Whilst secondary artificial reefs provide a potential hard substrate upon which organisms can attach, the types of colonising plants and animals depend on a number of parameters including:
• size• height• shape• profile• scale
61
• morphological complexity• material used and rugosity (surface roughness) (Connell and Glasby 1999;
Rilov and Behnayahu 1998, 2000).
Of these, complexity will be the primary factor determining the attractiveness of a structure to fauna and flora. (Pickering and Whitmarsh 1997; Hoffman et al. 2000). Highly complex structures provide a greater surface area for colonisation and more 'nooks and crannies' (niches and micro-niches) for shelter from predators and from physical conditions such as water movement and light intensity. This allows a more diverse and dense assemblage including organisms that are more fragile or light sensitive to colonise an area from which they were previously excluded. Structural complexity appears to be a condition for many productive and complex environments such as coral reefs, mangrove swamps and sea grass meadows (Leonhard, 2000).
The extent of colonisation of structures will also be affected by physical parameters such as wind and waves, temperature, salinity, coastal geomorphology and local geography (Hair et al., 1994; Hoffman 2000).
The use of biofoulants will also impact colonising species. However, biofoulant regimes have not been implemented at the Blyth Wind Farm, Northumberland, and we are not aware of any regimes likely to be used on wind farms around the UK in the near future.
It is therefore expected that turbine foundations will function as secondary artificial reefs.
7.2 Colonisation of turbine foundations
How the colonising biological community will develop is a function of the parameters listed above, and is thus site-specific. However, the following general assumptions can be made.
Following construction of the wind farms, recruitment will primarily occur in two ways; through migration from the surrounding substrate, or by the settling of larvae, spat, algal spores etc. from currents. Thus recruitment will be a factor of the sea currents carrying organisms to the foundations as well as other physical factors such as distance from the shore, depth and wave climate.
The complexity of colouring communities will also depend on the complexity of the structure. The principal type of foundation being considered by developers for offshore wind farms around the UK is a steel mono-pile structure of extremely low complexity. However, because of the risk of scouring causing instability, protective armourstone may be used around the foundations. If armourstone is used, this will provide extensive structural complexity, through variation in rugosity and the size of nooks and crannies that can be used for shelter and to escape predation.
62

The first species to colonise the foundations will be algae (marine plants and seaweeds) and invertebrates. Colonisation will often have a characteristic succession with microscopic and filamentous algae initially settling, followed by rapidly settling species and thereafter, a more diverse community will develop. Furthermore, community composition will differ with depth. For example, some intertidal species tolerate a period of drying out and will be found in the tidal zone of the vertical surface.
An investigation of the Horns Rev offshore wind farm in Denmark, (Bio/consult 2000, cited in Leonhard 2000) reports fouling by invertebrates on the mono-pile masts, five months post-construction. The fouling invertebrate species included bryozoans, several species of sea anemone, sea squirts, star fish, polychaete worms and the common mussel. Furthermore, this investigation noted that currents and near-seabed transport of sand limited fouling. Sand scouring is of sufficient intensity in this particular area that the lowest parts of the turbine foundations are devoid of fouling species. However, the turbines at Horns Rev are not protected by rock revetment (retaining walls).
With an increase in species diversity there may also be an increase in the general productivity of the area (Wickens and Barker, 1996, cited in Hoffman et al. 2000; Grossman et al. 1997). This is probably due to the fact that a greater diversity of fixed colonising species will attract various free-living invertebrates and small fish, which in turn attract larger organisms, up to and including marine mammals. Also, it is likely that detritevours (that feed on organic particles) living in the local soft sediments, will migrate to the turbine foundations and will feed on the increased organic detritus in the local area.
Thus, it is likely that wind farms, particularly if these have highly complex foundations/foundation protection, will increase the local species diversity, biomass and productivity.
7.2.1 Attractiveness of turbine foundations to fish
Fish tend to aggregate around objects placed in the sea. This phenomenon has been widely used in the development of Fish Aggregating or Attraction Devices (FAD's). However, the attraction of fish to objects such as artificial reefs is poorly understood. It is postulated that fish are attracted to submerged objects because they provide shelter from currents and wave action and safety from predators.
Different fish species have different affinities to submarine structures and these affinities may change during their lifecycle. One group of fish that are attracted to high profile structures, are the codfish (Hoffman et al. 2000), including species such as the whiting and cod. Indeed, studies around oil and gas platforms in the North Sea, have revealed noticeable aggregations of cod (Valdemarsen, 1979) despite the fact that oil platforms can be quite noisy (100-122dB, Richardson et al 1995). Thus, there is the possibility that wind farms may attract sizeable fish populations.
63

This may in turn have implications for local fisheries. Artificial reefs and FAD’s are currently being used in North America and extensively in the Far East as a fisheries technique for fin fisheries and shell-fisheries such as lobster (Herrnkind et al. 1997), crab (Page et al. 1999) mussels and abalone (MCS 2000). Several studies have demonstrated that biomass is greater on vertical artificial reefs than on natural reefs (Rilov and Benayahu 2000). Rilov and Benayahu postulate that this difference is attributed to vertical structures being more attractive to fish for settlement and recruitment than moderately sloped natural reefs. Increases in catch-per-unit-effort (CPUE) are documented for fish assemblages on artificial reefs over natural reefs in Southern California (Ambrose and Swarbrick 1989). Indeed the Japanese initiated a programme in 1974 with the goal of diverting fishing effort away from distant water fishing to mariculture and near shore fisheries, resulting in entire fishing grounds being created from artificial reefs (MCS 2000).
Several studies consider the success of such techniques and note that whilst artificial reef fisheries appear to be successful, there are negative impacts to such fisheries with respect to sustainability and that there is a need for careful management of such fisheries (for recent reviews, see Grossman et al. 1997; Pickering and Whitmarsh 1997; Bortone et al. 1998).
64
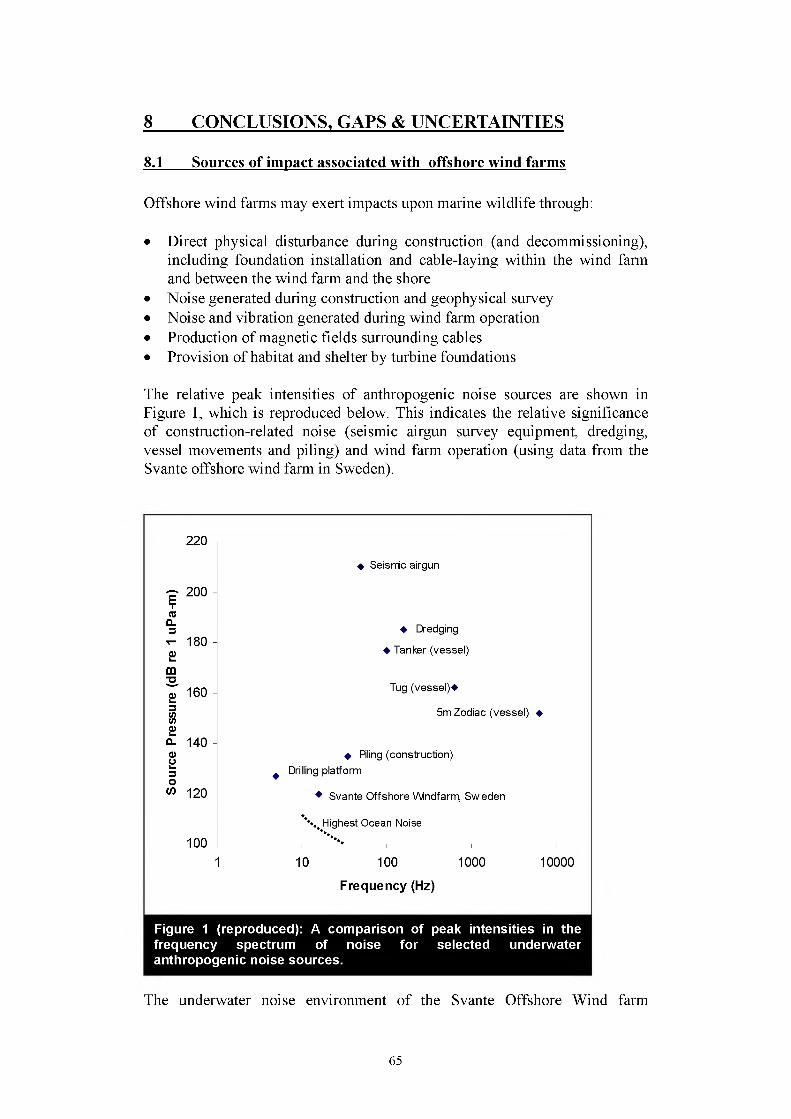
8 CONCLUSIONS, GAPS & UNCERTAINTIES
8.1 Sources of impact associated with offshore wind farms
Offshore wind farms may exert impacts upon marine wildlife through:
• Direct physical disturbance during construction (and decommissioning), including foundation installation and cable-laying within the wind farm and between the wind farm and the shore
• Noise generated during construction and geophysical survey• Noise and vibration generated during wind farm operation• Production of magnetic fields surrounding cables• Provision of habitat and shelter by turbine foundations
The relative peak intensities of anthropogenic noise sources are shown in Figure 1, which is reproduced below. This indicates the relative significance of construction-related noise (seismic airgun survey equipment, dredging, vessel movements and piling) and wind farm operation (using data from the Svante offshore wind farm in Sweden).
220
— 200reQ.
m"O
180
160
82a- 14023
« 120
100
♦ Seismic airgun
♦ Dredging
♦ Tanker (vessel)
Tug (vessel)*
5m Zodiac (vessel) ♦
♦ Piling (construction)^ Drilling platform
♦ Svante Offshore Wndfarm, Sweden
X Highest Ocean NoiseJ------- . ----- ,-------1 10 100 1000 10000
Frequency (Hz)
Figure 1 (reproduced): A comparison of peak intensities in the frequency spectrum of noise for selected underwater anthropogenic noise sources.
The underwater noise environment of the Svante Offshore Wind farm
65

(Westerberg 1994 & 1999), extrapolated from measurements made at 100m from the turbines, has been used to represent the likely noise and vibration climate associated with offshore wind farms, this being the only data available at the time of report production.
The Svante Offshore wind farm is located off the Southeast Coast of Sweden and was built as a pilot project. The wind farm consists of a single turbine 220kW Windworld AS turbine, 35m tall, on a tripod foundation. Measurements of the underwater acoustic environment were taken in 1994 at a range of distances, depths and wind speeds. Beyond frequencies of 100Hz, sound levels were below ambient sea levels of around 80dB at 100m from the turbine (Westerberg 2001, pers. comm.). Below frequencies of 100Hz, the noise ranged from approximately 80 to 100dB in intensity with a peak of 103dB at 16Hz.
Unlike construction and vessel noise, operational noise will, however, be more continuous. The noise experienced in the vicinity of an operating wind farm will also vary with local conditions such as coastal morphology, water depth, distance offshore etc.
At present, little information is available on the amount and frequency of noise produced by operating turbines, or the effects of local conditions on the transmission of this noise. Recommendations are included below to address some of these gaps.
Impacts associated with direct physical disturbance are considered to be site- specific and so are not addressed here, the production of magnetic fields surrounding cables is considered in terms of impacts on fish. Otherwise, the impacts associated with noise/vibration and creation of new habitat and shelter are considered below in terms of their effects on invertebrates, fish, seals (pinnipeds) and cetaceans (dolphins, porpoises and other ‘whales’)
8.2 Invertebrates
Evidence of noise and vibration related effects on invertebrates are largely restricted to the effects of seismic investigations. Here high sound levels are produced which affect invertebrates in a very localised area (suggested to be within ten metres of a very loud sound source).
Apart from such seismic survey, no adverse impacts of noise or vibration are expected. Indeed, studies at the Horns Rev offshore wind farm in Denmark show colonisation of turbine foundations by many marine species within five months of construction (Leonhard, 2000).
The likely effect of wind farm construction would therefore be locally increased numbers of hard-substrate colonising species. At present, no use of anti-foulant substances has been proposed, the extent of colonisation will therefore depend upon the number and size of turbine foundations and any additional habitat provided by foundation protection.
66

It is, however, recommended that monitoring be carried out on the extent of colonisation of an operating turbine base and a nearby ‘non-vibrating’ control structure. This, accompanied by measurements of the amount of structural vibration experienced, would indicate any impacts expected eg with larger turbines in the future.
8.3 Fish
The observed responses of several representative marine species to noise of various frequencies and sound pressure levels are presented in Figure 4 below. For fish, these ‘behavioural audiograms’ are given for cod (a roundfish), dab (a flatfish) and salmon (a sea/freshwater migratory fish).
Intermittent noise associated with construction activities (vessel movements, seismic survey, piling etc) is well within the range of these behavioural audiograms (Figure 1 and Figure 4). This is supported by observations of fish reactions to such noises, which have commonly demonstrated changes in behaviour such as alarm and startle responses. Such responses may be of particular significance if a wind farm is in close proximity to spawning or nursery ground areas and particularly if construction is prolonged. Greatest response would be expected to louder activities such as seismic survey and piling
Of the fish species included in Figure 4, only the audiogram of cod falls within the noise range of the Svante turbine, suggesting that an avoidance response should be expected. However, investigations at the Svante wind farm have shown numbers of cod close to operating turbines to be greater than in open waters, but lower than when the turbines are not operating (Westerberg, 1999). This presumably reflects the ability of animals to habituate to a continuous noise stimulus. Similar effects have been observed around other ‘noisy’ structures such as oil platforms (Valdemarsen, 1979).
Magnetic fields, surrounding electric cables, may affect species that use such fields for navigation or prey identification, notably sharks and rays. At present the University of Liverpool and the Countryside Council for Wales (CCW) are investigating the geomagnetic effects of cables from wind farms on sharks and rays (Gill, 2001 pers. comm.). This investigation is due to report within the next few months.
Intermittent, loud noise may therefore have an adverse effect on local fish populations, causing alarm responses and probable movement of fish away from construction areas. This could be significant if construction affected spawning or nursery areas. When wind farms are operating normally, fish appear to readily habituate and utilise wind farm sites at higher than normal densities, taking advantage of the shelter provided and probably also the additional food resources provided by colonising animals. Also, a study of the effects of operational noise on migrating fish (Westerberg, 1999) did not show a significant effect of the Svante wind farm on migrating eels that had been
67
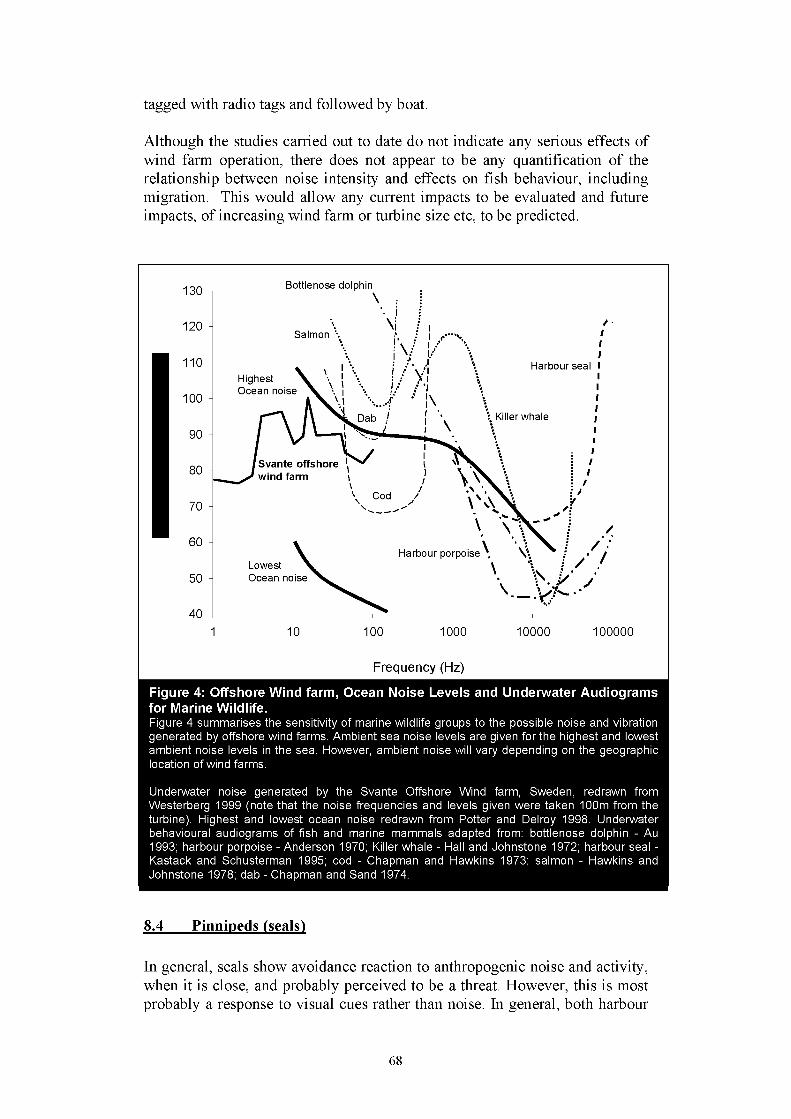
tagged with radio tags and followed by boat.
Although the studies carried out to date do not indicate any serious effects of wind farm operation, there does not appear to be any quantification of the relationship between noise intensity and effects on fish behaviour, including migration. This would allow any current impacts to be evaluated and future impacts, of increasing wind farm or turbine size etc, to be predicted.
Figure 4: Offshore Wind farm, Ocean Noise Levels and Underwater Audiograms for Marine Wildlife.Figure 4 summarises the sensitivity of marine wildlife groups to the possible noise and vibration generated by offshore wind farms. Ambient sea noise levels are given for the highest and lowest ambient noise levels in the sea. However, ambient noise will vary depending on the geographic location of wind farms.
Underwater noise generated by the Svante Offshore Wind farm, Sweden, redrawn from Westerberg 1999 (note that the noise frequencies and levels given were taken 100m from the turbine). Highest and lowest ocean noise redrawn from Potter and Delroy 1998. Underwater behavioural audiograms of fish and marine mammals adapted from: bottlenose dolphin - Au 1993; harbour porpoise - Anderson 1970; Killer whale - Hall and Johnstone 1972; harbour seal - Kastack and Schusterman 1995; cod - Chapman and Hawkins 1973; salmon - Hawkins and Johnstone 1978; dab - Chapman and Sand 1974.
8.4 Pinnipeds (seals)
In general, seals show avoidance reaction to anthropogenic noise and activity, when it is close, and probably perceived to be a threat. However, this is most probably a response to visual cues rather than noise. In general, both harbour
68
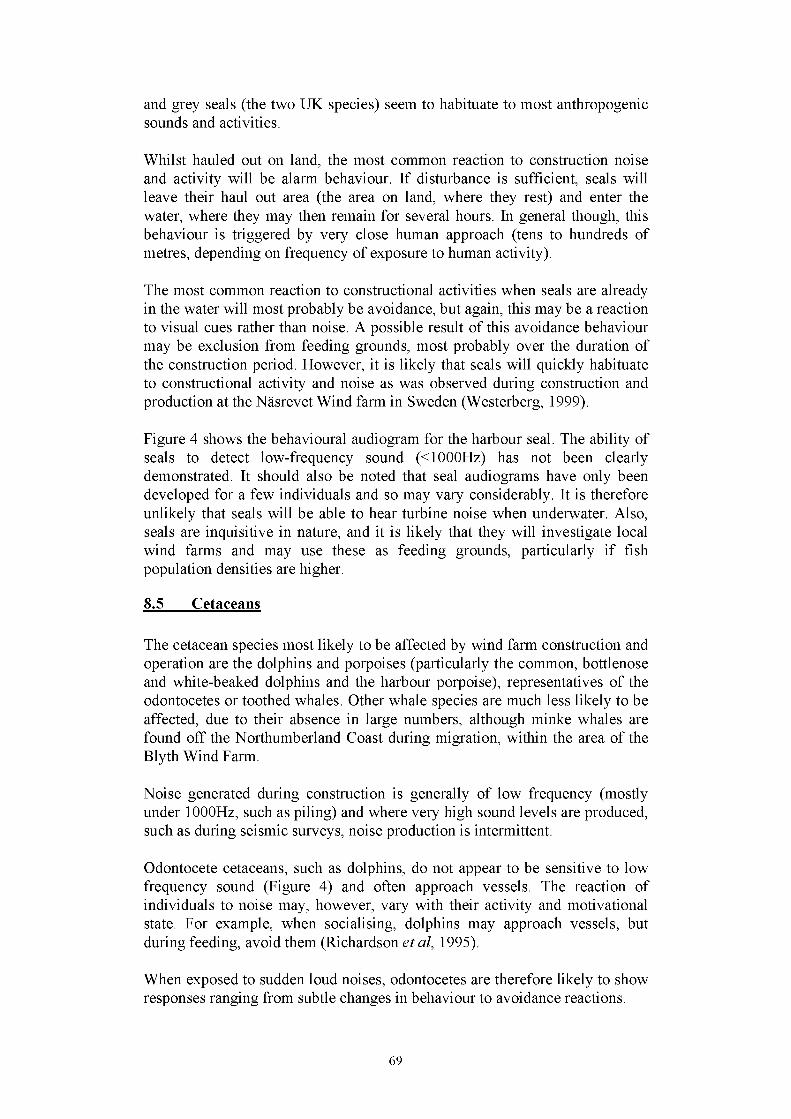
and grey seals (the two UK species) seem to habituate to most anthropogenic sounds and activities.
Whilst hauled out on land, the most common reaction to construction noise and activity will be alarm behaviour. If disturbance is sufficient, seals will leave their haul out area (the area on land, where they rest) and enter the water, where they may then remain for several hours. In general though, this behaviour is triggered by very close human approach (tens to hundreds of metres, depending on frequency of exposure to human activity).
The most common reaction to constructional activities when seals are already in the water will most probably be avoidance, but again, this may be a reaction to visual cues rather than noise. A possible result of this avoidance behaviour may be exclusion from feeding grounds, most probably over the duration of the construction period. However, it is likely that seals will quickly habituate to constructional activity and noise as was observed during construction and production at the Nasrevet Wind farm in Sweden (Westerberg, 1999).
Figure 4 shows the behavioural audiogram for the harbour seal. The ability of seals to detect low-frequency sound (< 1000Hz) has not been clearly demonstrated. It should also be noted that seal audiograms have only been developed for a few individuals and so may vary considerably. It is therefore unlikely that seals will be able to hear turbine noise when underwater. Also, seals are inquisitive in nature, and it is likely that they will investigate local wind farms and may use these as feeding grounds, particularly if fish population densities are higher.
8.5 Cetaceans
The cetacean species most likely to be affected by wind farm construction and operation are the dolphins and porpoises (particularly the common, bottlenose and white-beaked dolphins and the harbour porpoise), representatives of the odontocetes or toothed whales. Other whale species are much less likely to be affected, due to their absence in large numbers, although minke whales are found off the Northumberland Coast during migration, within the area of the Blyth Wind Farm.
Noise generated during construction is generally of low frequency (mostly under 1000Hz, such as piling) and where very high sound levels are produced, such as during seismic surveys, noise production is intermittent.
Odontocete cetaceans, such as dolphins, do not appear to be sensitive to low frequency sound (Figure 4) and often approach vessels. The reaction of individuals to noise may, however, vary with their activity and motivational state. For example, when socialising, dolphins may approach vessels, but during feeding, avoid them (Richardson et al, 1995).
When exposed to sudden loud noises, odontocetes are therefore likely to show responses ranging from subtle changes in behaviour to avoidance reactions.
69

Although the audible thresholds of mysticete whales have not been measured, they are thought to be sensitive to low frequency noise over considerable distances. They will almost certainly, therefore, be sensitive to constructional noise and will most probably show avoidance reaction or give construction sites a wide berth. As with odontocetes, however, responses may be mixed and males in search of mates, for example, may ignore or tolerate noise which females with young may avoid.
The noise and vibration of an operating wind farm is only expected to exceed ambient levels at very low frequencies, possibly under 100Hz. As described above, there is little evidence that animals such as the bottlenose dolphin and harbour porpoise can perceive sounds at these frequencies. Following familiarisation with wind farms and habituation to any noise which is perceived, therefore, odontocetes such as the dolphins and porpoise, are unlikely to be adversely affected and indeed may exploit wind farm sites as feeding grounds.
It has been suggested that behavioural audiograms for mysticete whales such as the minke, may be centred in the vicinity of 100-200Hz (Potter and Delroy, 1998). If this is correct, there is a possibility that communication or other behaviour could be affected.
Further studies are recommended to demonstrate any effects of wind farms on local odontocete behaviour and on mysticete migration.
8.6 Gaps and uncertainties
Table 2 illustrates the key interactions influencing the effects of offshore wind farms on marine wildlife and summarises the gaps and uncertainties outlined above.
The top row of the table contains those factors expected to have a direct impact on marine wildlife while the left hand column contains those ‘physical’ factors which may determine the nature/extent of these factors. The extent of the interaction (major interaction, minor interaction, no direct interaction or uncertain interaction) is shown by the symbol in the lower left of each cell. For example, turbine size has a major interaction with vibration and noise production, and therefore also with noise transmission, but only a minor interaction with surface area for colonisation etc.
The right hand column represents the different components of the ‘marine wildlife’: colonising organisms, benthos, plankton, fish etc. The interaction of factors such as vibration, noise production etc on each element of marine wildlife is represented by the symbol in the upper right of each cell. For example, noise transmission from wind farms is expected to have a minor interaction with intertidal species and an uncertain interaction with local fish populations.
70

Where major interactions have been identified, but clear quantitative evidence is not available, or where uncertain interactions are identified, studies are recommended below to address these gaps and uncertainties.
71
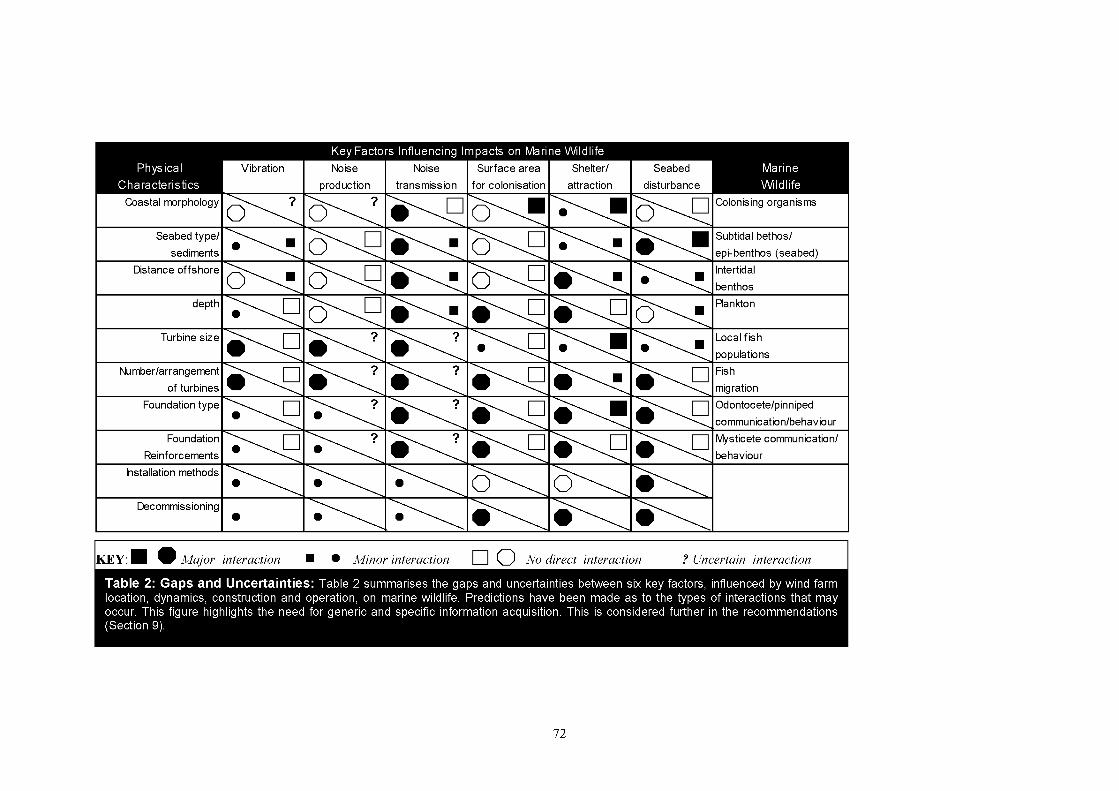
Vibration
pr
Noise
duction
Noise
transmission
Surface area
for colonisation
Shelter
attractio
/
n
Seabed
disturbance
Coastal morphology cy / 'O V i 6 ■ .. . . ■ Colonising organisms
Seabed type/
sediments cy /□ 7 /□ •. . ■ Subtidal bethos/
epi-benthos (seabed)
Distance offshore 7 /□ Intertidal
benthos
depth . . . . . . □/ •... . Plankton
Turbine size •. . □ . ............ . . . . . . . Local fish
populationsNumber/arrangement
of turbines •... . •.... . n •... . Fish
migration
Foundation type ?# •... . •... . •.. .. Odontocete/pinniped
communication/behaviour
Foundation
Reinforcements # •...... . n •... . •. . . E Mysticete communication/
behaviour
Installation methods
Decommissioning#
KEY: I Major interaction ■ ■ Minor interaction O No direct interaction ? Uncertain interaction
Table 2: Gaps and Uncertainties: Table 2 summarises the gaps and uncertainties between six key factors, influenced by wind farm location, dynamics, construction and operation, on marine wildlife. Predictions have been made as to the types of interactions that may occur. This figure highlights the need for generic and specific information acquisition. This is considered further in the recommendations (Section 9).
72

73

9 RECOMMENDATIONS
At each wind farm site, studies to characterise the current ecological status of the site will be required as part of the Environmental Impact Assessment process. These would include, for example, surveys of benthic (bottomdwelling) fauna and free-swimming species including commercial and noncommercial fish. However, it is considered appropriate to carry out a number of targeted and more extensive studies at representative offshore wind farm sites to provide ‘generic’ information on the effects of offshore wind power development. Our recommended studies are outline below.
9.1 Characterisation of the airborne and underwater environment of awind farm
Characterisation of the airborne and underwater acoustic environment surrounding offshore wind farms is an essential first step in better understanding the impacts of noise and vibration on marine wildlife.
It is recommended that hydroacoustic measurements be taken at different distances, depths, and directions particularly on/off shore and wind speed/climatic conditions. Investigation should include measurements around single turbines and entire wind farms and during periods of operation and nonoperation (to give baseline data).
Furthermore, comparisons between wind farm sites where there are differences in the following parameters would be required:
• Coastal morphology• Seabed and sediment types• Depth and distance offshore• Numbers, sizes and arrangement of turbines (and, if possible turbines size
and manufacturer)• Turbine foundation types
Following the construction and operation of the first tranche of offshore wind farm sites, sufficient information should be made available to allow multivariate analysis of the interaction of the above parameters in noise/vibration production and transmission. This information may be particularly useful in the selection of future wind farm sites.
9.2 Monitoring of the effects of offshore wind farms on marinemammal and fish behaviour/ecology
Following the current licensing round and identification of potential wind farm development sites, wind farm site(s) should be identified for monitoring. To gain the maximum information (and best value) the site(s) should allow monitoring of:
74

• Local populations of seals and dolphins/porpoises• An area that is visited by larger (mysticete) whales.• Local fish migration paths and diverse fish populations• A site representative of UK wind farms with respect to factors such as
size, number of turbines and distance offshore.
It is unlikely that a single wind farm would combine all four of these parameters, and thus elements of the investigation would have to be carried out at several wind farm sites. This should be combined with noise/vibration monitoring outlined in 9.1 above.
Prior to any monitoring, baseline data collection would be required preconstruction for comparison with post-constructional data. Baseline data should be collected for more than one year to monitor seasonal differences in fish and marine mammal populations.
Post construction, it would also be important to collect data regarding the behaviour of fish and marine mammals during both operation and nonoperation of the wind farms.
Outline methodologies for monitoring are described below.
• Pinnipeds and odontocetes - Tracking of animal movements could be achieved through tagging investigations (VHF radio/satellite telemetry), or a combination of tagging investigations and boat-based observations. Telemetry tags such as data-logging time-depth-recorders (TDK’s) can be used to track animals and set to sample parameters such as depth, divetime and swimming speeds. This information could be used to investigate whether wind farms are avoided, or whether animals are attracted to them. They could also provide data on the type of reaction produced upon encountering wind farms.
• Mysticetes - should also be monitored in terms of any behavioural changes on encountering wind farms by tagging or boat-based observations.
• For marine mammals, and including species such as basking shark, boat- based observation should ideally operate on a transect method in the general area of the wind farm, noting and positioning any sightings of marine mammals. These observations should be supported by observations from wind farm maintenance vessels.
• Fish migration - Fish migration should be studied in a range of species such as salmonid species (salmon), eels and flat fish species (plaice). Investigation of their movements could be achieved through a variety of methods such as mark and recapture. However, tracking of fish tagged with VHF radio tags in the vicinity of wind farms would provide better, and more reliable, data.
75
• Fish population dynamics - Fish population dynamics at wind farm sites should be investigated through a series of semi-quantitative fishing methods. For example, beam trawls would give information on bottomdwelling species, whilst purse seine netting, for example, would identify pelagic fish populations.
9.3 The effects of vibration on colonising organisms
Vibration of the turbine structure, transmitted through the foundation, may affect the extent to which these are colonised by sessile marine life. While not an ‘impact’ of offshore wind farms, this will affect their contribution to habitat creation. It is therefore recommended that a study be undertaken at a developing site to monitor colonisation at annual intervals over, say, three years.
Inclusion of a non-vibrating ‘control’ structure should be incorporated within the design of a wind farm (eg a metal plate of similar material to the turbine base held above the seabed) and compared with the turbine base.
76

77

10 ACKNOWLEDGEMENTS
We would like to thank all those who responded to the consultation exercise for their comments and literature recommended or provided. In particular, we would like to thank Dr. P Thompson, Sea Mammal Research Unit, and Dr. H Westerberg for their valuable input.
78

79

11 GLOSSARY
The terminology and concepts relevant to acoustics were introduced in Section 3. The brief glossary below, therefore, addresses only the biological terms used in the report. Further reading material on any of these subjects will be found in the Reference list accompanying this report for those who wish to read further.
Anthropogenic noise - noise originating from human activities
Baleen - (with respect to baleen whales) plates located on the upper jaw of baleen whales. The plates hang down and overlap one another and can number up to 700 forming a bristle effect. The plates then act as a filter feeding device.
Cetacean - any member of the Order Cetacea which includes all whales, dolphins and porpoises.
CPUE - Catch Per Unit Effort is a term used in fisheries management to describe that a "unit" of fishing effort (eg a timed trawl) will yield a certain number/weight of fish. If stocks are abundant this Catch Per Unit Effort will be higher than if stocks are low and vice versa, thus providing information on stock abundance.
Echolocation - is a biological sonar, animals emit sound which is reflected off objects in the water. The pattern of reflected sound is used, for example by whales, to navigate and locate food.
FAD - Fish Attraction/Aggregating Device used in fishing and for scientific studies and is an artificial structure placed in water around which fish will accumulate.
Mysticete - “baleen” (see above) whales from the Greek “moustached” describing the appearance of the minute “hairs”, actually plates, that hang from their upper jaws and include the humpback, blue, grey and right whales.
Odontocete - toothed whales such as sperm whales, killer whales, dolphins and porpoises as opposed to baleen whales.
Otolith - small "stones" of calcium carbonate located within the inner ear of vertebrates, including fish, which assist in detecting changes in gravity, movement and sonic vibrations. Calcium carbonate is laid down in seasonal rings. Fish can be aged by counting these rings just as we do with trees.
Pinnipeds - seals, sea-lions and walruses.
Toothed - the teeth in the toothed whales (Odontocete - see above) are unlike other mammalian teeth in that one set is retained for life and the teeth are all
80

identical in a species, i.e. they do not have molars, incisors etc as we do. Interestingly, the shape of the tooth differs between each species.
Revetments - retaining walls, usually sloping, commonly used for defence from wave action and erosion.
Stridulation - the rubbing together of body parts to produce sound.
81

82

12 APPENDICES
83

12.1 Appendix A - Consultee databaseAppendix A
DEVELOPERS ANDMANUFACTURERS20 B9 Energy (O&M) Ltd21 Border Wind Ltd22 Celtic Infrastructure Services Ltd23 EcoGen Ltd24 Enercon25 Enron Wind Overseas Development Ltd.26 National Wind Power Ltd29 Renewable Energy Systems Ltd30 Wind Prospect Ltd32 Colham Energy Ltd33 Community Power Ltd34 Manx Wind Energy36 The Wind Company UK Ltd37 Windelectric Ltd40 Renewable Delelopment Company Ltd44 Renewable Energy Systems Ltd.71 Burlington Resources73 VESTAS75 Aerolaminates Ltd78 NEG Micon UK Limited79 J W Colpitts & Co Ltd80 Dale Sailing Company Ltd81 McNulty Offshore Services Ltd82 Haskoning Consulting Engineers and Arch85 The Centre for Alternative Technology
FISHERIES
Id No. Company59 Cornwall Sea Fisheries Committee60 Eastern Sea Fisheries Committee61 North Western and North Wales Sea62 South Wales Sea Fisheries Committee63 Southern Sea Fisheries Committee64 Sussex Sea Fisheries Committee65 Cumbria Sea Fisheries Committee66 Devon Sea Fisheries Committee67 Fisheries Conservation Board for68 Kent & Essex Sea Fisheries Committee69 North Eastern Sea Fisheries Committee
84

70 Northumberland Sea Fisheries Committee
GO
Id No. Company3 Countryside Agency4 The Environment Agency6 MAFF7 CEFAS9 CCW15 English Nature16 The Crown Estate18 DTI41 Countryside Council For Wales43 The Crown Estate48 English Nature51 DoE, Northern Ireland84 DERA
NGO
1 World Wildlife Fund For Nature2 RSPB5 The National Trust17 Scottish Natural Heritage39 Marine Science and Technology Board46 The Wildlife Trust47 Marine Conservation Society49 Joint Nature Conservation Committee50 Natural Resources Institute52 Friends of the Earth53 Greenpeace UK76 EMU consult92 Renew North93 Yorkshire Windpower Ltd
UTILITIES
Id No. Company28 PowerGen Renewables Ltd
85

35 Scottish Power88 Scottish Power89 Shell International Renewables Limited91 TXU Europe Power Ltd94 Energiekontor (UK) Ltd95 bt.environment
MISC.
Id No. Company12 BWEA13 OWEN14 Metoc plc19 Anglesey Wind & Energy Ltd27 Next Generation31 Bond Pearce54 International Maritime Organisation55 Whale and Dolphin Conservation Society56 Univ. of Aberdeen57 Gatty Marine Laboratory58 University of Aberdeen72 Utrecht University74 River Bush Salmon Station77 European Wind Energy Association83 Energy and Environment Research Unit86 Independent Energy UK ltd.87 M & N Wind Power Ltd90 Tomen Power Corporation UK Ltd96 Loyds of London (Offshore Section)97 University of Aberdeen98 Natural Environment Institution of Denmark99 University of Keil100 LGL Ltd.101 University of Aberdeen102 Fiskeriverket103 Centre for Marine Science and Technology104 University of Liverpool105 Emu-Consult106 Kobenhavns Millo og Energikontor
86

87

12.2 Appendix B - Consultation letter and aims and objectives
88
Date: ............Our Ref: 2586
, 2000
Dear........................................ ,
ASSESSMENT OF THE EFFECTS OF NOISE AND VIBRATION FROM OFFSHORE WIND FARMS ON MARINE WILDLIFE
The Centre for Marine and Coastal Studies (CMACS), has been commissioned by the UK Department of Trade and Industry (DTI) Energy Technology Support Unit (ETSU), to assess the effect of noise and vibration from offshore wind farms on marine wildlife.
The UK has one of the largest offshore wind resources in Europe. The use of this ‘renewable’ resource to generate electricity through the development of offshore wind farms is recognised as a key element in meeting the UK Government’s commitments to reducing greenhouse gases. The Government is proposing that 5% of UK electricity requirements should be met from renewable energy sources by the end of 2003 and 10% by 2010.
Construction of offshore wind farms will, however, be subject to individual projects obtaining the necessary consent. Environmental assessment of projects will be an element of the consent process and so pertinent environmental issues and concerns will need to be identified and understood. The availability of data and knowledge (or lack of it) on these environmental issues therefore, needs to be established. The effects of construction, operation and decommissioning of offshore wind turbines on marine wildlife is one such area of interest.
The present study seeks to address this area of interest. A detailed ‘Project Description’ setting out the objectives of this project is enclosed. I have also included some general information on CMACS for your information.
We wish to ensure that our evaluation includes as much relevant information as possible, and is able to address the concerns of all stakeholders involved in the offshore wind industry. We would be very grateful, therefore, for details of any information you hold or views relevant to the points listed in the Project Description.
89
This may be in the form of reports or publications, planned or proposed projects or research, or general views on the effects of offshore wind farms on the marine ecosystem. Please note that our study does not include sea or shorebirds, which are being investigated separately. In return for your information, ETSU have informed us that it will be possible for consultees providing input into the project to receive a copy of the report in its published format.
We are, of course, sensitive to the commercial and confidential nature ofsome information, particularly that related to wind farm locations etc.However, to get the most out of our study essential information such aswind farm size, anticipated water depths, substrate and general locations(e.g. North West, South West etc.) is crucial. Furthermore, informationneed not be ascribed if identified as being of a confidential nature.
In order for us to complete our assessment within the project timescale, we would be grateful for your response by......................... , 2000.
Should you wish to discuss the above or any other issues of concern, please do not hesitate to contact myself or Dr.Andrew Hough at the address below.
Yours sincerely,
Erica Mason Project Co-ordinator
90

ASSESSMENT OF THE EFFECTS OF NOISE AND VIBRATION FROM OFFSHORE WIND FARMS ON MARINE WILDLIFE
ETSU REF: W/13/00566/00/00 CMACS REF: J2586/10.00
Objectives of the study
1. Identify and review studies, reports and other available information pertinent to offshore wind farms, and specifically noise and vibration during construction and operation, and their effects on marine wildlife. Particular issues include;
The overall effects of noise and vibration on marine species Characterisation of noise and vibration generated by offshore turbine operation and construction activities.The extent to which offshore wind turbines may provide physical protection new habitat opportunities etc for marine species
- Propagation and attenuation of noise and vibration above and below the surface.
- Likely range of background noise above and below surface.- Prediction of noise levels and biological effects at the shoreline
Identification of those marine species most at risk to noise and vibration impacts related to UK offshore wind farmsBio-fouling of structures and possible anti-fouling regimes Effects ofpower cable radiation fields and impact on marine life.
2. To identify gaps and uncertainties in existing knowledge and recommend further studies that are needed to address these gaps, outlining methodologies for further information acquisition.
3. To provide an inventory of planned and ongoing studies that are directly relevant, or complementary, to the assessment of the effects of offshore wind farms on marine life. From this information, opportunities for resolving uncertainties in the information available may be identified and exploited, e.g. by combining studies or targeting new work on wind farm developments in particular localities.
91

12.3 Appendix C - References
92

APPENDIX C
Reference list
Acevedo A (1991) Interactions between boats and bottlenose dolphins in the entrance to Ensenada de la Paz, Mexico. Aquatica Mammalia 17 120-124
Akamatsu, T; Hatakeyama, Y; Kojima, T; Soeda, H (1994) Echolocation Rates of 2 harbour porpoises (Phocoena phocoena). Marine Mammal Science 10 401-411
Altechnica (1992) Separation Distances for Siting Wind Turbines: A Literature Survey. ETSU WN 6056/016
Ambrose RF; Swarbrick SL (1989) Comparison of fish assemblages on artificial and natural reefs off the coast of southern California. Bulletin of Marine Science 44 718-733
Amundin M (1991) Sound production in odontocetes, with emphasis on the harbour porpoise, Phocoena phocoena. PhD dissertation, University of Stockholm
Amundin, M (1997) Sound production and hearing in Marine Mammals. Proceedings of the Institute of Acoustics 19 1-8
Anderson S (1970) Auditory sensitivity of the harbour porpoise Phocoena phocoena. Invest. Cetacea 2 255-259
Andre M, Kamminga C; Ketten D (1997) Art low frequency sounds a marine hearing hazard: a case study in the Canary Islands. Proceedings of the Institute of Acoustics 19 77-84
Ashmore JF; Russell IJ (1983) The physiology of hair cells. In: Lewis B (Ed.) Bioacoustics a comparative approach. Academic Press, Sydney 149-180
Assellin S; Hammill MO; Barrette C (1993) Underwater Vocalizations Of Ice Breeding Gray Seals. Canadian Journal of Zoology 71 2211-2219
AU Rilov, G; Benayahu, Y (2000) Fish assemblage on natural versus vertical artificial reefs: the rehabilitation perspective. Marine Biology 136 931-942
Au WWL (1993) The sonar of dolphins. Springer-Verlag, New York
Au WWL; Carder DA; Penner RH; Scronce BL (1985) Demonstration of adaption in beluga whale (Delphinapterus leucas) echolocation signals. Journal of the Acoustical Society of America 77 726-730
93

Au, W.W.L; Nachtigall, P.E (1997) Acoustics of echolocating dolphins and small whales. Marine and Freshwater Behaviour and Physiology 29 127-162
Barlow J (1988) Harbour porpoises, Phocoena phocoena, abundance estimates for California, Oregon and Washington: I. Ship surveys. Fisheries Bulletin 86 417-432
Barne JF; Robson CF; Kaznowska SS; Doody JP; Davidson NC (eds.) (1996) Coasts and Seas of the United Kingdom. Joint Nature Conservation Committee, Peterborough.
Berghahn R; Wiese K; Ludmann K (1995) Physical and physiological aspects of gear efficiency in North Sea brown shripmp fisheries. Helgolander Meersesuntersuchungen 49 507-518
Bio/consult (2000) Visit to measuring tower on Horns rev. technical note to ESLAM. (in Danish).
Bohne BA; Thomas JA; Yohe ER; Stone SH (1985) Explanation of the potential hearing damage in Weddell seals (Leptonychotes weddelli) in McMurdo Sound, Antartica. Antartic Journal 1985 174-176
Bonner WN (1982) Seals and man - a study of interactions. University of Washington Press, Seattle, WA.
Booman. C; Dalen. J; Leivestad. H; Levsen. A; van de Meeren. T; and Toklum. K (1996) The effects of airguns on eggs larvae and fry.. Fiskens og Havet No 3 1996 83
Bortone, SA; Cody, RP; Turpin, RK; Bundrick, CM (1998) The impact of artificial-reef fish assemblages on their potential forage area. Italian Journal Of Zoology 65 265-267
Bowles AE; Smultea M; Wursig B; Demaster DP; Palka D (1994) Relative abundance and behaviour of marine mammals exposed to transmission from Heard Island feasibility test. Journal of the Acoustical Society of America 96 2469-2484
Brand AR; Wilson UAW (1996) Seismic surveys and scallop fisheries: A report on the impact of a seismic survey on the 1994 Isle of Man queen scallop fishery. Report to a consortium of oil companies by Port Erine Marine Laboratory, University of Liverpool, Port Erin, Isle of Man 68
British Aerospace (1986) Offshore wind turbine generators. Fatigue testing programmes for coated materials in salt spray environments. ETSU-WN-5010- P1
Bullmore, A. J. and McKenzie, A. R (1996) Tonal Noise Immission from
94

Wind Farms. Proceedings of Internoise 96 453-458
Bullmore, A. J., Lowson, J. F., Bass, J. H. and Dunbabin, P (1999) Wind Turbine Measurements for Noise Source Identification. ETSU W13/00391/REP
Caudron AK, Kondakov AA, Siryanov SV (1998) Acoustic structure and individual variation of grey seal (Halichoerus grypus) pup calls. Journal of the Marine Biological Association UK 78 651-658
Chapman CJ; Hawkins AD (1969) The importance of sound in fish behaviour in relation to capture by trawls. FAO Fisheries Report 62 717-729
Chapman CJ; Hawkins AD (1973) A field study of hearing in cod, Gadus morhua. Journal of Comparative Physiology 85 147-167
Chapman CJ; Sand O (1974) Field studies in hearing in two species of flatfish, Plueronectus platessa and Limanda limanda. Comparitive Biochemistry and Physiology 47 371-385
Climatic Research Unit, School of Environmental Sciences, University of East Anglia Monitoring the Godmanchester Vestas V27-225 Wnd Turbine. ETSU W32/00228/38/REP
Connell, SD; Glasby, TM (1999) Do urban structures influence local abundance and diversity of sub tidal epibiota? A case study from Sydney Harbour, Australia. Marine Environmental Research 47 373-387
Connelly PR; Goodson AD; Lepper P; Coggrave CP (1996) Aversive Sound Pressure Levels and a Harbour Porpoise. European Proceedings of the tenth annual conference of the European Cetacean Society, Lisbon, Portugal. 11-13 March 1996.. Research on Cetaceans 10 75
Crown Estate Web site: (2001)http://fm353.facility.pipex.com/estates/marine/wind farms.
Dalen J; Raknes A (1985) Scaring effects on fish from 3D seismic surveys. Institute of Marine Research, Bergen, Norway, Report No. FO 8504
Dalen J; Raknes A (1986) Scaring effects in fish and harmful effects on eggs, larvae and fry by offshore seismic exploration. In: Merklinge HM (ed). Progress in Underwater Acoustics, Plenum Press, London
Danish Institute for Fisheries Research (2000) Effects of marine windfarms on the distribution of fish, shellfish and marine mammals in the Horns Rev area. ELSAMPROJEKT A/S Baggrundsrapport nr. 24
Danish Wind Turbine Manufacturers Association (2001) Web site: http://www.windpower.dk (Offshore Giuded Tour).
95

Dawbin, W.H; Cato, D.H (1992) Sounds of a pygmy right whale (Caperea marginata). Marine Mammal Science 8 3 213-219
Diercks, K.J; Trochta, R.T; Evans, W.E (1971) Recording and analysis of dolphin echolocation signals. Journal of the Acoustical Society of America 49 1729-1732
Dolman, S; Simmonds, M.P (1998) The threat posed to cetaceans: preliminary considerations with particular reference to anti-predator devices. International Whaling Commission. SC/50/E8.
Dubrovski NA (1990) On the two auditory subsystems in dolphins. P. 233254. In: Thomas JA; Kastelein RA (eds.). Sensory abilities of cetaceans/laboratory and field evidence. Plenum, New York
Dunbabin, P (1996) An Investigation of Blade Swish from Wind Turbines. Proceedings of Internoise 96 463-469
ELSAMPROJEKT A/S (2000) Horns Rev Offshore Wind Farm Environmental Impact Assessment - Summary of EIA Report.
Eltra (2000) (in Danish) Beregning og maling af magnetfelter omkring kabler og vindmoller. Internt notat 2000-238
Engas A; Lokkenborg S; Ona E; Soldal AV (1996) Effect of seismic shooting on local abundance of cod (Gadus maohua) and haddock (Melanogrammus aeglefinus). Canadian Journal of Fisheries and Aquatic Science 53 22382249
Engas A; Misund OA; Soldal AV; Horvei B; Solstad A (1995) Reactions of penned herring and cod to playback of original, frequency-filtered and time- smoothed vessel sound. Fisheries Research 22 243-254
Erbe C; Farmer DM (2000) (b) A software model to estimate zones of impact on marine mammals around anthropogenic noise. Journal of the Acoustical Society of America 108 1327-1331
Erbe C; Farmer DM (2000) (a) Zones of impact around icebreakers affecting beluga whales in the Beaufort Sea. Journal of the Acoustical Society ofAmerica 108 1332-1340
Evan PGH (1996) Whales, dolphins and porpoises. In: Barne JF; Robson CF; Kaznowska SS; Doody JP; Davidson NC (eds.), Coasts and Seas of the United Kingdom, Region 5 North-east England: Berwick-upon-Tweed to Filey Bay. Joint Nature Conservation Committee, Peterborough..
Fay. R.R and Popper. A.N (1980) Structure and function in Teleost Auditory
96

Systems. A.N. Popper and R.R. Fay (eds). Comparative Studies Of Hearing in Vertebrates, Springer-Verlag, New York 3-42
Flaherty C (1981) Apparent effects of boat traffic on harbour porpoises (Phocoena phocoena). P.35 In: Abstracts of the 4th Biennial Conference on the Biology of Marine Mammals. San Fransisco, CA, Dec. 1981
Flow Solutions Ltd (1993) Assessment and Prediction of Wind Turbine Noise. ETSU W/13/00284/REP
Flow Solutions Ltd (1993) Systematic Comparison of Predictions and Experiment for Wind Turbine Aerodynamic Noise. ETSU W/13/00363/REP
FSM Esbjerg, Ornis Consult A/S, Copenhagen Zoological Museum (2000) EIA- marine mammals and windmills on Horns Reef.
Gardner, P., Morgan, C. A., Noakes, J. and French, R. G (1992) Feasibility study for an offshore wind turine. Report by Renewable Energy Systems Ltd, Hemel Hempstead, UK
Garrad Hassan & Partners Ltd. Offshore Wind Industry Capabilites in the UK. ETSU W35/00530/REP
Garrad Hassan and Partners Limited (1995) The prospects and cost benefits of advanced horizontal axis wind turbine design. ETSU W/23/00355/REP
Garrad, Hassan and Partners, Bristol Germanischer Lloyd, Hamburg (1994) Study of Offshore wind energy in the EC. Volume 2. ETSU W35/00250/REP/2 2
Garrad, Hassan and Partners, Bristol Germanischer Lloyd, Hamburg (1994) Study of Offshore wind energy in the EC. Vol. 1. Offshore wind energy potential in the EC. ETSU W/35/00250/REP/1 1
Garrad, Hassan and Partners, Bristol Germanischer Lloyd, Hamburg (1994) Study of Offshore wind energy in the EC. Vol. 3. ETSU W/35/00250/REP/3 3
Garrad, Hassan and Partners, Bristol Germanischer Lloyd, Hamburg Study of offshore wind energy in the EC Vol 4. ETSU W/35/00250/REP/4 4
Garrad, Hassan and Partners, Bristol Germanischer Lloyd, Hamburg (1994) Study of Offshore wind energy in the EC. Excutive Summary. ETSU W35/00250/REP/S
Gausland, I (2000) Impact of Seismic Surveys on Marine Life. The Leading Edge 8 903-905
GEC-Marconi (1996) Design and development of wind turbine tower damping
97

treatments. ETSU W/13/00407/REP
Gentry RL; Gentry EC; Gilman JF (1990) Response of northern fur seals toquarrying operations. Marine Mammal Science 6 151-155Grainger B (2001) AMEC/Blythe Windfarm, Northumberland. Personalcommunication.
Grastrup, H., Gaarde, J. K., Svenson, J. M. and Pederson, P. H Environmental Impact Assessment of the First Four Offshore Wind Farms in Denmark. Report by ELSAMPROJEKT A/S and SEAS Distribution AmbA
Grossman, GD; Jones, GP; Seaman, WJ (1997) Do artificial reefs increase regional fish production? A review of existing data. Fisheries 22 17-23
Hair CA; Bell JD; Kingsford MJ (1994) Effects Of Position In The Water Column, Vertical Movement And Shade On Settlement Of Fish To Artificial Habitats. Bulletin Of Marine Science 55 434-444
Hall JD; Johnson CS (1972) Auditory thresholds of a killer whale Orcinus orca Linnaeus. Journal of the Acoustical Society of America 51 515-517
Hanggi, E.B; Schusterman, R.J (1994) Underwater acoustic displays and individual variation in male harbor seals, Phoca vitulina. Animal Behaviour, 48 1275-1283
Haskoning/Novem BV (2001) Personal communication.
Hatakeyama Y; Ishii K; Akamatsu T (1994) A review of the studies on attempts to reduce the entanglement of the dall’d porpoise in Japanese salmon gillnet fishery. Report to the International Whaling Commission, (Special Issue 15 549-563
Hawkins AD; Johnstone ADF (1978) The hearing of the atlantic salmon Salmo salar. Journal of Fish Biology 13 655-673
Hawkins AD; Myrberg AA (1983) Hearing and communication underwater. In: Lewis B (Ed.) Bioacoustics a comparative approach. Academic Press, Sydney 149-180
Hawkins, A.D (1986) Underwater sound and fish behaviour. In: Pitcher, T.J (ed), The Behaviour of Teleost Fish. Groom Helm Ltd., Kent 114-149
Hayes McKenzie Partnership, Hoare, Lea & Partners, Renewable Energy Systems Ltd. (1996) Objective and Subjective Rating of Tonal Noise Radiated From Uk Wind Farms. ETSU W/13/00354/44/REP
Hayes, M. and Stevenson, R (1996) The Mynydd Y Cemmaes Wind Farm Impact Study: Volume IIC Noise Impact: Final Report. ETSU W/13/00300/REP/2C
98
Hayes, M. D (1996) The Measurement of Noise from Wind Farms and Background Noise Levels. Proceedings of Internoise 96 471-478
Herrnkind, WF; Butler, MJ; Hunt, JH (1997) Can artificial habitats that mimic natural structures enhance recruitment of Caribbean spiny lobster?. Fisheries 22 24-27
Hoare, Lea & Partners (1996) Objective and Subjective Rating of Tonal Noise Radiated from UK Wind Farms: Part 2. ETSU W/32/00228/55/REP
Hoffman E; Astrup J; Larsen F; Munch-Petersen S; Strottrup J (2000) The effects of marine windfarms on the distribution of fish, shellfish and marine mammals in the Horns Rev area. Baggrundsrapport nr. 24. Report to ELSAMPROJEKT A/S. Danish Institute for Fisheries Research.
Houser DS, Helweg DA, Moore PW (1999) Classification of dolphin echolocation clicks by energy and frequency distributions. Journal of the Acoustical Society of America 106 1579-1585
James Howden Group Technology (1993) The Influence of Noise of the Design of Horizontal Axis Wind Turbines. ETSU W/13/00190/REP
Johnson CS (1967) Sound detection thresholds in marine mammals. In: Travolga WN, (ed.), Marine bio-acoustics. Pergamon, Oxford 247-260
Johnstone R (1999) Seismic and fish - research results and regulatory advice. Report by the Fisheries Research Service (FRS), Marine Laboratory, Aberdeen, UK.
Jones ML; Swartz SL (1984) Demography and phenology of gray whales and evaluation or whale-watching activities in Laguna San Ignacio, California, Mexico: 1978-1982. In: Jones ML; Swartz SL; Leatherwood (eds), The gray whale Eschrichtius robustus.. Academic Press, Orlando, Florida.
Kalmijn, A. J (1974) The detection of electric fields from inanimate and animate sources other that electric organs. In Handbook of Sensory Physiology, vol. III/3 (ed A. Fessard) pp. 147-200.. New York. Springer- Verlag
Kamminga C; Weirsma H (1981) Investigations on cetacean sonar II. Acoustical similarities and differences in odontocete sonar signals. Aquatica Mammalia 8 41-62
Karl sen HE (1992) Infrasound sensitivity in plaice (Plueronectes platessa). Journal of Experimental Biology 171 173-187
Kastak D; Schusterman RJ (1995) Aerial and underwater hearing thresholds for 100Hz pure tones in two pinniped species. In: Kastelein RA; Thomas JA;
99

Nachtigall PE (eds.), Sensory systems of aquatic mammals.. De Spil Publishers, Woerden, The Netherlands
Kastak, D; Schusterman R J (1996) Temporary threshold shift in a harbour seal (Phoca vitulina). Journal of the Acoustical Society of America 100 19051908
Ketten DR (1995) Estimates of blast injury and acoustic trauma zones for marine mammals from underwater explosions. In: Kastelein RA; Thomas JA; Nachtigall PE (eds), Sensory systems of aquatic animals.. De Spil Publ., Woerden, The Netherlands.
Ketten DR (1994) Functional analysis of whale ears: Adaptations for underwater hearing. IEEE Proceedings of the Symposium on Underwater Acoustics 1 264-270
Ketten DR; Lien J; Todd S (1993) Blast injury in humpback whale ears: Evidence and implications. Journal of the Acoustical Society of America 94 1849-1850
Ketten DR; Wartzog D (1990) Three dimensional reconstruction of the dolphin ear. P81-105. In: Kastelein RA; Thomas JA (eds) Sensory abilities of cetaceans/laboratory and field evidence.. Plenum, New York.
Kinsler, L. E., Frey, A. R., Coppens, A. B. and Sanders, J. V (2000) Fundamentals of Acoustics, 4th edition. John Wiley & Sons, Inc.
Knudsen FR; Enger PS; Sand O (1992) Awareness reactions and avoidance responses to sound in juvenile Atlantic salmon, Salmo salar L. Journal of Fish Biology 40 523-534
Knudsen FR; Enger PS; Sand O (1994) Avoidance response to low frequency sound in downstream migrating Atlantic salmon smolt, Salmo salar. Journal of Fish Biology 45 227-233
Kvaerner Oil & Gas Ltd Development Opportunities for the UK Offshore Wind Industry. ETSU W/35/00545/REP
Lawson, M. V. and Fiddes, S. P (1994) Design Prediction Model for Wind Turbine Noise. ETSU W/13/00317/REP
Legerton, M. L (1996) Recommendations of the Working Group on Wind Turbine Noise. Proceedings of Internoise 96 2547-2552
Legerton, M. L., Manley, D. M. J. P., Sargent, J. W., Snow, D. J. and Styles, P (1996) Low Frequency Noise & Vibration Levels at a Modern Wind Farm. Proceedings of Internoise 96 459-462
100

Leonhard SB (2000) Horns Rev Offshore Wind Farm, EIA of Sea Bottom and Marine Biology. Report to I/S ELSAM, Denmark
Lesage V; Barrette C; Kingsley MCS; Sjare B (1999) The effect of vessel noise on the vocal behaviour of belugas in the St. Lawrence Estuary, Canada. Marine Mammal Science 15 65-84
Lien J; Todd S; Stevick P; Marques F; Ketten D (1993) The reaction of humpback whales to underwater explosions: Orientation, movements and behaviour. Journal of the Acoustical Society of America 94 1849
Ljungblad DK; Scoggins PD; Gilmartin WG (1982) Auditory thresholds of a captive eastern Pacific bottlenosed dolphin, Tursiops spp. Journal of the Acoustical Society of America 72 1726-1729
Love, MS; Caselle, JE; Snook, L (2000) Fish assemblages around seven oil platforms in the Santa Barbara Channel area. Fishery Bulletin 98 96-117
Love, MS; Caselle, JE; Snook, L (1999) Fish assemblages on mussel mounds surrounding seven oil platforms in the Santa Barbara Channel and Santa Maria Basin. Bulletin Of Marine Science 65 497-513
Lowson, J. V (1996) A New Approach to Wind Turbine Noise Measurement. Proceedings of Internoise 96 143-148
Lowson, M. V (1996) Aerodynamic Noise of Wind Turbines. Proceedings of Internoise 96 479-484
Malakoff D (2001) A roaring debate over ocean noise. Science 291 576-578
Maniwa Y (1976) Attraction of bony fish, squid and crab by sound. In: Schuijf A; Hawkins AD (eds.), Sound reception in fish. Elsevier, New York 271-283
Mann DA; Lu Z, Hastings MC, Popper AN (1998) Detection of ultrasonic tones and simulated dolphin echolocation clicks by a teleost fish , the American shad(Alosa sapidisima). Journal of the Acoustical Society of America 104 562-568
Mate B (1993) Experiments with acoustic harassment systems to limit seal movements. Journal of the Acoustical Society of America 94 1828
McCauley RD; Jenner MN; Jenner C; McCabe KA; Murdoch J (1998) The response of humpback whales (Megaptera novaeangliae) to offshore seismic survey: Preliminary results of observations about a working seismic vessel and experimental exposures.. APPEA J 692-706
101

McCauley, R.D (1994) Seismic surveys. In: Swan, J.M.; Neff, J.M.; Young, P.C., (Eds.) Environmental Implications of Offshore Oil and Gas Development in Australia - The findings of an Independent Scientific Review. APEA, Sydney
McConnell BJ, Fedak MA, Lovell P, Hammond PS (1999) Movements and foraging areas of grey seals in the North Sea. Journal of Applied Ecology 36 573-590
McCulloch, S; Boness, D.J (2000) Mother-pup vocal recognition in the grey seal (Halichoerus grypus) of Sable Island, Nova Scotia, Canada. Journal of Zoology 251 449-455
McKenzie, A. R. and Bullmore, A. J (1996) Verification of Objective Assessment Method for Tonal Noise from Wind Farms. Proceedings of Internosie 96 2115-2120
MCS (2000) Habitats factsheet: artificial reefs. SP/08/00
Mcshane, L.J; Estes, J.A; Riedman, M.I; Staedler, M.M (1995) Repertoire, Structure, and Individual Variation of Vocalizations in The Sea Otter. Journal Of Mammalogy 76 414-427
Metoc Plc (2000) An Assessment of the Environmental Effects of OffshoreWind Farms. ETW %%3J/00J#/REP
Micheal J (1999) Sounding the Depths: Supertankers, Sonar and the rise of Undersea Noise. Natural Resources Defence Council Report.
Milton Keynes Development Corporation and University of Southampton (1989) Social Implications of a wind driven generator located in a residential area. ETS^ J097-P7
Moore A; Cobb JLS (1986) Neurophysiological studies on the detection of mechanical stimuli in Ophiura ophuira. Journal of Experimental Marine Biology and Ecology 104 125-141
Myrberg, A.A (1981) Sound Communication and Interception in Fish. In: Tavolga, A; Popper, A.N; Fay, R.R (eds), Hearing and Sound Communication in Fishes. Pringer-Verlag, New York 395-452.
National Engineering Laboratory (1999) Noise Immission from WindTurbines. ETW ^/73/00J03/REP
Nestler JM; Ploskey GR; Pickens J; Menezes J; Schilt C (1992) Response of blueback herring to high frequency sound and implications for reducing entrainment at hydropower dams. North American Journal of Fish
102

Management 12 667-683
Offut. G.C (1970) Acoustic stimulus perception by the American Lobster Homarus americanus. Experentia 26 1276-1278
Olsen K; Angell J; Petterson F; Lovick A (1982) Observed fish reactions to a surveying vessel with special reference to herring, cod, capellin and polar cod. In: FAO 1982 Symposium on fisheries acoustics. FIRM/R300 131-138
Olsen K; Angell J; Petterson F; Lovick A (1982) Quantitative estimations of the influence of fish behaviour on acoustically determined fish abundance. In: FAO 1982 Symposium on fisheries acoustics. FIRM/R300 139-145
Packard A; Kalsen HE; Sand O (1990) Low frequency hearing in cephalopods. Journal of Comparative Physiology 166 501-505
Page, HM; Dugan, JE; Dugan, DS; Richards, JB; Hubbard, DM (1999) Effects of an offshore oil platform on the distribution and abundance of commercially important crab species. Marine Ecology-Progress Series 185 47-57
Pain S (2000) Squawk, burble and pop. New Scientist 166 42-45
Palker, DL (1993) The presence of ship avoidance during line transect survey of harbour porpoises in the Gulf of Maine, p.84 In: Abstracts of the 10th Biennial Conference on the Biology of Marine Mammals. Galveston, TX, Nov.7993
Pearson WH; Skalski JR; Malme CI (1992) Effects of sound from geophysical survey device on behaviour of captive rockfish (Sebastes spp.). Canadian Journal of Fisheries and Aquatic science 49 1343-1356
Perry, E.A; Renouf D (1988) Further-Studies Of The Role Of Harbor Seal (Phoca vitulina) Pup Vocalizations In Preventing Separation Of Mother Pup Pairs. Canadian Journal of Zoology 66 934-938
Pickering, H; Whitmarsh, D (1997) Artificial reefs and fisheries exploitation: A review of the 'attraction versus production' debate, the influence of design and its significance for policy. Fisheries Research 31 39-59
Pickett GD; Seaby RHM; Eaton DR; Arnold GP (1994) Poole Bay seismic survey: effects on bass movements and catch rates in the local fishery.
Pitcher, T.J (ed) (1986) The Behaviour of Teleost Fish. Groom Helm Ltd., Kent
Popov VV; Ladygina TF; Supin Aya (1986) Evoked potentials of the auditory cortex of the porpoise, Phocoena phocoena. Journal of Comparative Physiology 158 705-711
103

Popper AN (2000) Hair cell heterogeneity and ultrasonic hearing: recent advances in understanding fish hearing. Philosophical Transactions of the Royal Society of London Series B - Biological Sciences 355 1277-1280
Potter, J. and Delory, E (1998) Noise Sources in the Sea & the Impact for Those Who Live There. Acoustics & Vibration Asia 1998 Conference Proceedings 56-71
Ramboll (2000) Frequency Analysis for Cable Damage from Ship Activities at Horns Rev. Baggrundcrapport nr. 14
Reijnders PJH (1981) Management and conservation of the harbour seal, Phoca vitulina, populations in the international Wadden Sea area. Biological Conservation 19 213-221
Renewable Energy Systems Ltd (1993) A Sensitivity Analysis of Wind Farm Energy Production on Realistic sites. ETSU WN 6056/010
Renewable Energy Systems Ltd (1993) Institutional consents and detailed site investigation for a demonstration offshore wind turbine. E7SUW35/00290/REP
Renewable Energy Systems Ltd (1994) Noise Assessment at Coal Clough. ETSU W13/00354/037/REP
Renouf, D (1984) The Vocalization Of The Harbor Seal Pup (Phoca vitulina) And Its Role In The Maintenance Of Contact With The Mother. Journal Of Zoology 202 583-590
Richardson WJ; Davis RA; Evans CR; Ljungblad DK; Norton P (1987) Summer distribution of bowhead whales, Balaena mysticetus, relative to oil industry activities in the Canadian Beaufort Sea, 1980-84. Artic 40 93-104
Richardson, W.J; Green, C.R; Malme, C.L; Thomson, D.H; Moore, S.E; Wursig. B (1991) Effects of noise on marine mammals. OCS study MMS 900093 Rep. From LGL Ecological Research Assoc. Inc. Texas for US Mineral Management Service. Atlantic OCS Reg, Herndon, VA.. NTIS PB91-168914
Richardson, W.J; Greene, C.R; Malme, C.I; Thompson, H.H (1995) Marine Mammals and Noise. Academic Press, San Diego
Richardson. W.J; Malme, C.L (1993) Man-made noise and behaviour responses in: Burns J.J; Montague. J.J; Cowles. C.J. (eds), the bowhead whale. Spec. Publ. 2. Soc.. Mar. Mammial. Lawrence, KS.
Rilov G; Benayahu. Y (2000) Fish assemblage on natural versus vertical artificial reffs: the rehabilitation perspective.. Marine Biology 136 5 931-942
104
Rilov, G; Benayahu, Y (1998) Vertical artificial structures as an alternative habitat for coral reef fishes in disturbed environments. Marine Environmental Research 45 431-451
Rupert EE; Barnes RD (1994) Invertebrate Zoology, 6th Edition. Pub: Saunders College Publishing
Sand O; Enger PS, Karlsen HE; Knudsen F, Kvernstuen T (2000) Avoidance response to infrasound in downstream migrating European silver eels, Anguilla anguilla. Environmental Biology of fishes 57 327-336
Schevill, W.E; Watkins, W.A; Ray (1963) Underwater sounds of pinnipeds. Science 141 50-53
Schultz, K.W; Cato, DH; Corkeron, P.J (1995) Low-Frequency Narrow-Band Sounds Produced By Bottle-Nosed Dolphins. Marine Mammal Science 11 503-509.
SEAS Distribution A.m.b.A., Vind Enegri Center (2000) Rodsand Offshore Wind Farm Environmental Impact Assessment - Summary Report.
SGS Environment (1996) An Inventory of Environmental Monitoring Programmes at Wind Farms in the UK. ETSU W/13/00426/REP/1
SGS Environment (1996) A Review of the Ecological Impacts of Wind Farmsin the UK. ETSU W13/00426/REP/2
Shane SH (1990) Behaviour and ecology of the bottlenose dolphin at Sanibel Island, Florida. pp.245-265 In: Leatherwood S; Reeves RR (eds.), The bottlenose dolphin. Academic Press, San Diego, CA.
Shepherd, K. P. and Hubbard, H. H (1991) Physical Characteristics and Perception of Low Frequency Noise form Wind Turbines. Noise Control Engineering Journal 36 1 5-15
Simmonds, M.P; Dolman, S (1999) A note on the vulnerability of cetaceans to acoustic disturbance. International Whaling Commission. IWC51/E15
Simpson, P. B., Hancock, M. and Kuhn, U.B. M (1991) A re-appraisal of the cost of UK offshore wind energy. Report by Wind Energy Group Ltd, UK
Skalski JR; Pearson WH; Malme CI (1992) Effects of sounds from geophysical survey device on catch-per-unit-effort in a hook-and-line fishery for rockfish (Sebastes spp.). Canadian Journal of Fisheries and Aquatic Science 49 1357-1365
SMRU (2001) Behavioural and physiological response of seals to seismic surveys. Sea Mammal Research Unit Website: http://smub.st-and.ac.uk/.
105

Snow, D. J (1997) Low Frequency Noise and Vibrations Measurement at a Modern Wind Farm. ETSU W/13/00392/REP
Stone C J (1997) Cetacean observations during seismic surveys in 1996. Joint Nature Conservation Committee. JNCC Reports, No.228. Joint Nature Conservation Committee, Aberdeen.
Stone C J (1998) Cetacean observations during seismic surveys in 1997. Joint Nature Conservation Committee. JNCC Reports, No.278. Joint Nature Conservation Committee, Aberdeen.
Styles, P Low Frequency Wind Turbine Noise and Vibration. Report for ETSU/PowerGen pcl
Sullivan, R.M (1982) Agonistic Behaviour And Dominance Relationships In The Harbor Seal, Phoca vitulina. Journal Of Mammalogy 63 554-569
T.R. Gurney (1987) The Influence of a salt spray environment on the fatigue strength of welded joints (Literature survey)- Final report. ETSU-WN-5085-P3
Taylor BL; Dawson PK (1984) Seasonal changes in density and behaviour of harbour porpoises Phocoena phocoena) affecting census methodology in Glacier Bay National Park, Alaska. Reports of the International Whaling Committee 34 479-483
Taywood Engineering, British Aerospace, GEC and the Central Electricity Generating Board (1985) Offshore Wind Energy Assessment Phase IIB study. ETSU-WN-5009 (Pt 1A) 1
Taywood Engineering, Central Electricity Generating Board (1982) Offshore Wind Energy Assessment Phase IIA Study. ETSU-WN-5002(P1) 1 1
The Working Group on Noise form Wind Turbines (1996) The Assessment and Rating of Noise from Wind Farms. ETSU-R-97
Thompson P (2001) Sea Mammal Research Unit, University of Aberdeen, personal communication.
Thompson, T.J; Winn, H.E; Perkins, P.J (1979) Mysticete sounds. In: Winn, H.E; Olla, B.L (eds.), Behaviour of Marine Animals, Vol. 3: Cetaceans. Plenum Press, New York.
Valdemarsen JW (1979) Behaviour aspects of fish in relation to oil platforms in the North Sea. ICES C.M., B:27
Van Parijs SM, Hastie GD, Thompson PM (2000) Individual and geographical variation in display behaviour of male harbour seals in Scotland. Animal Behaviour 59 559-568
106
Van Parijs, S.M; Hastie, G.D; Thompson, P.M (1999) Geographical variation in temporal and spatial vocalization patterns of male harbour seals in the mating season. Animal Behaviour, 58 1231-1239
Verboom WC; Kastelein RA (1995) Acoustic signals by harbour porpoises (Phocoena phocoena). In: Nachtigall PE; Lien J; Au WWL; Read AJ (eds.). Harbour porpoises - laboratory studies to reduce bycatch.. De SpilPublishers, Woerden, The Netherlands.
Walker, M. M; Diebel, C.E; Haugh, C.V; Pankhurst, P.M; Montgomery, J.C; Green, C.R (1997) Structure and function of the vertebrate magnetic sense. Nature 390 371-376
Waltons and Morse, London (1997) Geographically distributed wind farms. ETSU W32/00442RP
Watkins, R.R; Wartzok, D (1985) Sensory biophysics of marine mammals. Marine mammal Science 1 3 219-260
WDCS (2001) UK Wales and Dolphins. The Whale and Dolphin Conservation Society Website:http://www.wdcs.org/dan/publishing.nsf/allweb/D40BD8FF24FCD942802569 CF004381F3.
WDCS (2001) UK Wales and Dolphins. The Whale and Dolphin Conservation Society website:http://www.wdcs.org/dan/publishing.nsf/(allweb)/2BEEE587F48ED74802569 4400554993.
Web of Science (2001) Web site: http://wos.mimas.ac.uk.
Westerberg (2001) Personal Comment.
Westerberg, H (1999) Impact Studies of Sea-Based Windpower in Sweden. "Technische Eingriffe in marine Lebensraume”
Westerberg, H (1994) Fiskeriundersokningar vid havsbaserat vindkraftvert 1990-1993. Rapport 5 - 1994. 44 pp. Jonkoping: Goteborgsfilialen, Utredningskontoret i Jonkoping. Sweden National Board of Fisheries.
Wickens J; Barker G (1996) Quantifying complexity in rock reefs. In: Jensen AC (ed.), European artificial reef research. Proceedings of the 1st EARRN conference, Ancona, Italy. Pub. Southampton Oceanography Centre. 423-430
107