assessment of the contribution of agroforestry … doc/ijpss_july2012/ijmra-pss1519.pdf · ijpss...
TRANSCRIPT
IJPSS Volume 2, Issue 7 ISSN: 2249-5894 _________________________________________________________
A Monthly Double-Blind Peer Reviewed Refereed Open Access International e-Journal - Included in the International Serial Directories Indexed & Listed at: Ulrich's Periodicals Directory ©, U.S.A., Open J-Gage, India as well as in Cabell’s Directories of Publishing Opportunities, U.S.A.
International Journal of Physical and Social Sciences http://www.ijmra.us
369
July
2012
Productivity of the Agroforestry Systems
and its Contribution to Household Income
among Farmers in Lushoto District, Tanzania
Baltazar M.L. Namwata*
Zacharia S. Masanyiwa*
Omari B. Mzirai*
__________________________________________________________
Abstract
This paper investigates the productivity of the agroforestry systems and its contribution to household
income among farmers in Lushoto District, Tanga, Tanzania. Specifically, the study aimed to determine
and compare the level of household’s farm production and net income between farmers practicing and not
practicing agroforestry. A total of 134 respondents from four villages in Soni and Ubiri wards were
involved. Data were collected using structured questionnaire, focus group discussion and through non-
participant observation. Distribution of responses, central tendency and dispersion, and multiple linear
regression analyses were carried using the Statistical Package for Social Science (SPSS) computer
software. Results indicate that farmers practicing agroforestry had significantly higher contribution to the
household’s level of farm production and net income than those who were not practicing agroforestry.
Given the average farm size of 3.1 ha, 2.3 cows and 9.2 chicken, the annual production for farmers
practicing agroforestry was 425.9 kg for maize, beans 225.7 kg, coffee 101.1kg, and 163.9 bunches of
banana, 999.12 litres and 373.5 eggs compared to 342.6 kg of maize, 202.1 kg of beans, 75 kg of coffee,
108 bunches of banana, 1120.6 litres of milk and 338.6 eggs for farmers not practicing agroforestry. The
average household annual net income was Tshs 664,992 and 547,608 for farmers practicing and not
practicing agroforestry respectively. The income per capita was Tshs 100,756 for farmers practicing and
Tshs 82,971 for farmers’ not practicing agroforestry. However, the level of household farm production
and net income was generally lower compared to most findings from other agroforestry systems. There
* Institute of Rural Development Planning, P.O. Box 138, Dodoma.
IJPSS Volume 2, Issue 7 ISSN: 2249-5894 _________________________________________________________
A Monthly Double-Blind Peer Reviewed Refereed Open Access International e-Journal - Included in the International Serial Directories Indexed & Listed at: Ulrich's Periodicals Directory ©, U.S.A., Open J-Gage, India as well as in Cabell’s Directories of Publishing Opportunities, U.S.A.
International Journal of Physical and Social Sciences http://www.ijmra.us
370
July
2012
was partial adoption of the agroforestry technologies by some farmers (some households had few numbers
of trees/shrubs for timber, fodder, fruits, firewood etc) and poor management which resulted from
constraints like inadequate extension services, higher prices of most of the agricultural inputs, low soil
fertility and unattractive producer prices. Therefore, overcoming these constraints could improve and
probably sustain productivity of the agroforestry systems and its contribution to household income.
Key words: Agroforestry systems, crop production, household income, net income
Introduction
Kitalyi et al (2009) reported that Tanzania is listed among the thirteen African countries worst
affected by climate change impacts and vulnerability, and having the least adaptive capacities. A
review of the status of Tanzania’s Agricultural Sector Development Program notes that the
country is lagging in achieving its targets on reducing poverty and in achieving the Millennium
Development Goals due to low agricultural productivity. Low agricultural productivity is mainly
due to low and declining soil fertility. Soil fertility is low and declining due to reduced use of
inorganic fertilizers and continuous cropping. The resource poor farmers can not afford the
fertilizers in sufficient quantities and sometimes do not apply the fertilizer at all on some of the
lands. This is mainly because the farmers can not afford the fertilizers especially after the
introduction of the Economic Structural Adjustment Programme in 1989 to 1991 when fertilizer
subsidies were withdrawn. Tanzania faces the challenge of revitalizing her agricultural sector by
improving the natural resource base: soil, water and biodiversity. Agroforestry, the integration of
trees in agricultural landscapes, offers robust options to improve productivity and achieve
environmental sustainability.
Incorporating agroforestry systems into national agricultural development programmes offers
more affordable and sustainable sources of soil nutrients through deep soil extraction and nitrogen
fixation. On the other hand, practicing agroforestry or integrating agroforestry into the farming
systems can potentially improve the livelihoods of farmers through improved agricultural
productivity (SECAP, 1991; Semgalawe, 1998). Young (1989) defines agroforestry as a
collective name for land use systems and practices in which woody perennials (trees, shrubs etc)

IJPSS Volume 2, Issue 7 ISSN: 2249-5894 _________________________________________________________
A Monthly Double-Blind Peer Reviewed Refereed Open Access International e-Journal - Included in the International Serial Directories Indexed & Listed at: Ulrich's Periodicals Directory ©, U.S.A., Open J-Gage, India as well as in Cabell’s Directories of Publishing Opportunities, U.S.A.
International Journal of Physical and Social Sciences http://www.ijmra.us
371
July
2012
are grown in association with herbaceous plants (crops, pastures) and/or livestock in a spatial
arrangement, rotation or both and in which there are both ecological and economic interactions
between the trees and non-tree components of the system. Tanzania is home to several traditional
agroforestry systems that have been in practice for hundreds of years. Some have been
documented: the Chagga home-gardens, the related Mara region home-gardens known as
Obohochere and the traditional Wasukuma silvopastoral system called Ngitili and those of
Kagera. One outstanding aspect of these traditional methods is the use of multi-layered systems
with a mixture of annual and perennial plants, which imitate natural ecosystems (O’kting’ati,
1985; Rugalema, 1992).
In effect, many projects with various packages of agroforestry technologies have been launched in
various parts of the country. Some of these projects include Soil Erosion Control and
Agroforestry Project (SECAP) in Lushoto, Soil Conservation and Agroforestry Project Arusha
(SCAPA), “Hifadhi Mazingira” (HIMA), “Hifadhi Ardhi Dodoma” (HADO), Land Management
Programme (LAMP), Handeni Integrated Agroforestry Project (HIAP), Hifadhi Ardhi Shinyanga
(HASHI) to mention a few. A lot have been done by these projects; starting from the point of
sensitization to integration of various agroforestry technologies into the poor rural farming
systems (Kerkhof, 1990; Johansson, 2001).
In Lushoto district where the SECAP project has been implemented since 1981, previous studies
have shown that, the project has been successful in improving the livelihood strategies of farming
households (Kerkhof, 1990, SECAP, 1999; Johansson, 2001). While the contribution of
agroforestry to poverty reduction is well documented in many places, there is paucity of
information on whether or not agroforestry systems significantly contribute to the farm
productivity and household income in Lushoto District. Therefore, this paper examined the
productivity of the agroforestry systems and its contribution to household income in the district.

IJPSS Volume 2, Issue 7 ISSN: 2249-5894 _________________________________________________________
A Monthly Double-Blind Peer Reviewed Refereed Open Access International e-Journal - Included in the International Serial Directories Indexed & Listed at: Ulrich's Periodicals Directory ©, U.S.A., Open J-Gage, India as well as in Cabell’s Directories of Publishing Opportunities, U.S.A.
International Journal of Physical and Social Sciences http://www.ijmra.us
372
July
2012
Materials and Methods
This study was carried out four selected villages namely Ngulwi and Ubiri in Ubiri ward, and
Soni and Shashui villages in Soni ward in Lushoto district in the northeastern part of Tanzania.
The exiting land use pattern in the district is divided into four categories namely dry land farming
constituting 58%, tree crops or irrigated area (11%), forest reserves (16%) and grazing areas
(15%). This land use pattern makes the West Usambaras one of the most intensely farmed areas
of Tanzania (Pfeiffer, 1990).
A cross-sectional research design was adopted in this study because it allows data to be collected
at a single point in time without repetition from the representative sample. The reason for the
choice of such a design is that, it is easier and economical to conduct especially where resource
constraints like time, labour and money dictate the results, as it was the case for this study.
Primary data were collected through household questionnaire survey using structured
questionnaires with both open-ended and closed-ended questions, focus group discussion with the
key informants using a checklist of questions and physical observation, while secondary data
were collected through documentary review. The aim was to cross check and verify information
obtained through these different methods regarding the topic in question.
The target group for this study was all farmers practicing and not practicing agroforestry in the
Lushoto district. The sampling unit was the household. A household in this study is referred to as
a single person or group of persons who live and eat together and share common living
arrangements i.e. share expenses (URT, 1994). Since for any land use system to qualify as an
agroforestry system, there must be woody perennials (trees, shrubs etc) deliberately combined
with herbaceous plants and or livestock in spatial, rotational or both in which there are both
ecological and economical interactions between the tree and non-tree components of the system
(Young, 1989; ICRAF, 1996). In addition, since it was also hardly possible to find a single
household’s farm without trees and /or shrubs in the study area, then, the criterion used to obtain
farmers practicing and not practicing agroforestry was based on the number of trees found in the
household’s farm. Farmers who had less than 20 trees/ ha were regarded as not practicing
agroforestry while those with more than 20 trees were practicing agroforestry.

IJPSS Volume 2, Issue 7 ISSN: 2249-5894 _________________________________________________________
A Monthly Double-Blind Peer Reviewed Refereed Open Access International e-Journal - Included in the International Serial Directories Indexed & Listed at: Ulrich's Periodicals Directory ©, U.S.A., Open J-Gage, India as well as in Cabell’s Directories of Publishing Opportunities, U.S.A.
International Journal of Physical and Social Sciences http://www.ijmra.us
373
July
2012
It was assumed that, other factors being constant, farmers with many agroforestry trees and which
are properly arranged and managed could have higher income resulted from positive interactions
between the tree and non-tree components of the system(s) than those with fewer trees.
After identifying farmers practicing and not practicing agroforestry; simple random sampling
technique was applied to select households from the study villages. Equal number of households
from both farmers practicing and not practicing agroforestry in each village were picked for the
interview for easy comparison. A random sampling intensity of at least 5% was used to determine
the sample size of the households interviewed in each village as described by Boyd et al. (1981)
cited by Kayunze (1998). Overall, a total of 134 households were selected for the study.
This study was carried out in two phases. Phase one involved a reconnaissance survey. The
second phase was mainly based on questionnaire survey. The reconnaissance survey was
conducted in order to observe the general conditions of the farming systems; make researcher be
acquainted with the study area; select study villages and the sample size required; and pre-test the
questionnaires to check for its validity and reliability, to fit the local condition as recommended
by Goldman and Macdonald (1987) cited by Kayunze (1998). Questionnaires were pre-tested
using 44 respondents from four villages. Eight respondents (4 from participants and 4 non-
participants of the agroforestry practices) and 3 key informants were picked from each village.
However, most of the questions were responded thus, very little modifications were made to the
original questions.
Descriptive and inferential statistics methods were applied to analyse the quantitative data while
qualitative data were analysed by using Content and Structural-Functional methods (Merina,
2001). Multiple linear regression model was developed in order to predict whether or not the
dependent and independent variables were significantly related and measure the strength of their
relationship. The dependent variable, net income of household’s farm production was regressed
on the independent variables (farm size, household size, number of trees planted, number of
livestock kept, varieties of crops grown and cost of production) to find the standard regression

IJPSS Volume 2, Issue 7 ISSN: 2249-5894 _________________________________________________________
A Monthly Double-Blind Peer Reviewed Refereed Open Access International e-Journal - Included in the International Serial Directories Indexed & Listed at: Ulrich's Periodicals Directory ©, U.S.A., Open J-Gage, India as well as in Cabell’s Directories of Publishing Opportunities, U.S.A.
International Journal of Physical and Social Sciences http://www.ijmra.us
374
July
2012
coefficient, the beta weight (ß) of each independent variables, the multiple correlation, R, and the
multiple coefficient of determination, R2. These six independent variables were included because
they were thought to be able to account for more of the variation in the dependent variable. The
general model used in linear regression was:
Yi = a + b1x1+ b2x2 + ……………+ bjxj + ei
Where:
Yi = The ith
observed value of the net income of the household’s farm
production (dependent variable).
a = Intercept
b1 to b6 = Independent variable coefficients
X1 = Farm size
X2 = Household size
X3 = Number of trees planted
X4 = Number of animals kept
X5 = Varieties of crops grown
X6 = Cost of farm production
ei = Random error
Results and Discussion
Socio-economic characteristics of farmers
The socio-economic characteristics of farmers examined in this study were sex, marital status,
age, household size, farm size, education level and the main occupation. The purpose of choosing
IJPSS Volume 2, Issue 7 ISSN: 2249-5894 _________________________________________________________
A Monthly Double-Blind Peer Reviewed Refereed Open Access International e-Journal - Included in the International Serial Directories Indexed & Listed at: Ulrich's Periodicals Directory ©, U.S.A., Open J-Gage, India as well as in Cabell’s Directories of Publishing Opportunities, U.S.A.
International Journal of Physical and Social Sciences http://www.ijmra.us
375
July
2012
these characteristics was to get general overview of what the respondents are composed of and
how these characteristics could influence agroforestry practices towards poverty reduction in the
study area. Results in Table 1 show that, the highest percent of farmers (79.1%) were men while
only 20.9% were women despite the fact that women are the key players in most of the
household’s farm activities. The possible explanation for this trend is that the study targeted
households’ heads as main decision makers of the household affairs. Except for the few
households which were female headed, the majority were male headed. Sometimes, women had
to respond on behalf of their husbands due to some special excuses like when were not around.
Therefore, combining some of the households which were male headed and the female headed;
87.3% of the interviewed farmers were heads of the households while 12.7% not heads of the
households. The findings also show that 85.8% of the respondents were married, 6.7% divorced,
3.7% widowed and 3.7% separated.
The study found the age of farmers to range from 22–70 years. The average age was 45 years.
Over three quarters (79.1%) were in the age group of 31–64 years, whereas 12.7% were above 64
years and 8.2% below 30 years. This implies that most of farmers were in the economically
productive age group with great experience in agroforestry both before and after SECAP.
Therefore their experience was very useful in the success of this study. According to Mandara
(1998) and Mtenga (1999), household members are considered economically productive from the
age of 16 to 64 years. The age bracket below 16 years is children some of whom may be attending
schools and others too young to participate in farming activities. The age group above 64 years is
considered less economically active because the members are too old.
Table 1: Characteristics of respondents (n = 134)
Variable Characteristics Frequency Percent
Sex Male 106 79.1
Female 28 20.9

IJPSS Volume 2, Issue 7 ISSN: 2249-5894 _________________________________________________________
A Monthly Double-Blind Peer Reviewed Refereed Open Access International e-Journal - Included in the International Serial Directories Indexed & Listed at: Ulrich's Periodicals Directory ©, U.S.A., Open J-Gage, India as well as in Cabell’s Directories of Publishing Opportunities, U.S.A.
International Journal of Physical and Social Sciences http://www.ijmra.us
376
July
2012
Marital status Married 115 85.8
Divorced 9 6.7
Widowed 5 3.7
Separated 5 3.7
Age group Below 30 years 11 8.2
Between 30 – 64 years 106 79.1
Above 64 years 17 12.7
Education level No formal education 5 3.7
Adult education 11 8.2
Primary education 96 71.6
Secondary education 19 14.2
Diploma 3 2.2
Farm size Less than 2.0 ha 51 38.0
2.0 – 3.0 ha 45 33.6
More than 3.0 ha 38 28.4
The mean household size was 6.6 persons. The smallest household had 3 persons while the largest
had 11. This figure is higher than the district average of 4.7 persons reported in the National
Population and Housing Census (URT, 2002) and lower than that of 8.8 persons reported by
Moshi (1997) in the west Usambaras. The average household size below the age of 16 years was
3.0 persons, 2.8 persons between 16 – 64 years and 0.8 persons above 64 years. This implies that
at least every household in the study area has an average of 2.8 persons who can actively
participate in farming activities.

IJPSS Volume 2, Issue 7 ISSN: 2249-5894 _________________________________________________________
A Monthly Double-Blind Peer Reviewed Refereed Open Access International e-Journal - Included in the International Serial Directories Indexed & Listed at: Ulrich's Periodicals Directory ©, U.S.A., Open J-Gage, India as well as in Cabell’s Directories of Publishing Opportunities, U.S.A.
International Journal of Physical and Social Sciences http://www.ijmra.us
377
July
2012
Close to three quarters of respondents (71.6%) had primary education, 14.2% secondary, 8.2%
adult education, 3.7% no formal education while 2.2% diploma education. Generally, except for
the minority (3.7%) who had no formal education, most of the respondents were educated. This
implies that, introduction of various agroforestry innovations in the study area are likely to be
successfully adopted because the majority could not only be trained by the extensionists but also
read from books and newsletters and other sources of information.
With regard to farm size, over one third of respondents (38%) had farm sizes below or equal to 2
hectares. The mean farm size was found to be 3.1ha. The minimum and maximum farm sizes
were 0.7 and 4.5 hectares respectively. However, majority of the households with farm sizes
greater than 3 hectares had plots of woodlots some planted with black wattle (Acacia meansii) and
others planted various tree species for timber, firewood, poles and other building materials among
which being eucalyptus and grevillea. Further, observations have shown that there is high farm
fragmentation ought to be influenced by the former system of shifting cultivation. Farmers have
several farm plots of various shapes and sizes located into different places within and sometimes
even out of the sample village. Close to three thirds of respondents (61.2%) complained that their
farms were not enough. However, further observations have shown that the average farm size of
3.1 ha could be large enough to meet requirements of most of the reported household size of 6.6
persons. However, most farms were not well managed including adding enough manure and
planting improved crop seeds. Historically, the study area had faced serious soil erosion resulted
from poor soil conservation measures before SECAP thus leading to low soil fertility. Therefore,
if farmers could manage them properly as recommended, will improve the systems productivity
and thus meet most of the household daily requirements and surplus for cash income.
Productivity of the agroforestry systems
Various levels of farm production were observed in the study area between farmers practicing and
not practicing agroforestry as described in the subsections here under.
IJPSS Volume 2, Issue 7 ISSN: 2249-5894 _________________________________________________________
A Monthly Double-Blind Peer Reviewed Refereed Open Access International e-Journal - Included in the International Serial Directories Indexed & Listed at: Ulrich's Periodicals Directory ©, U.S.A., Open J-Gage, India as well as in Cabell’s Directories of Publishing Opportunities, U.S.A.
International Journal of Physical and Social Sciences http://www.ijmra.us
378
July
2012
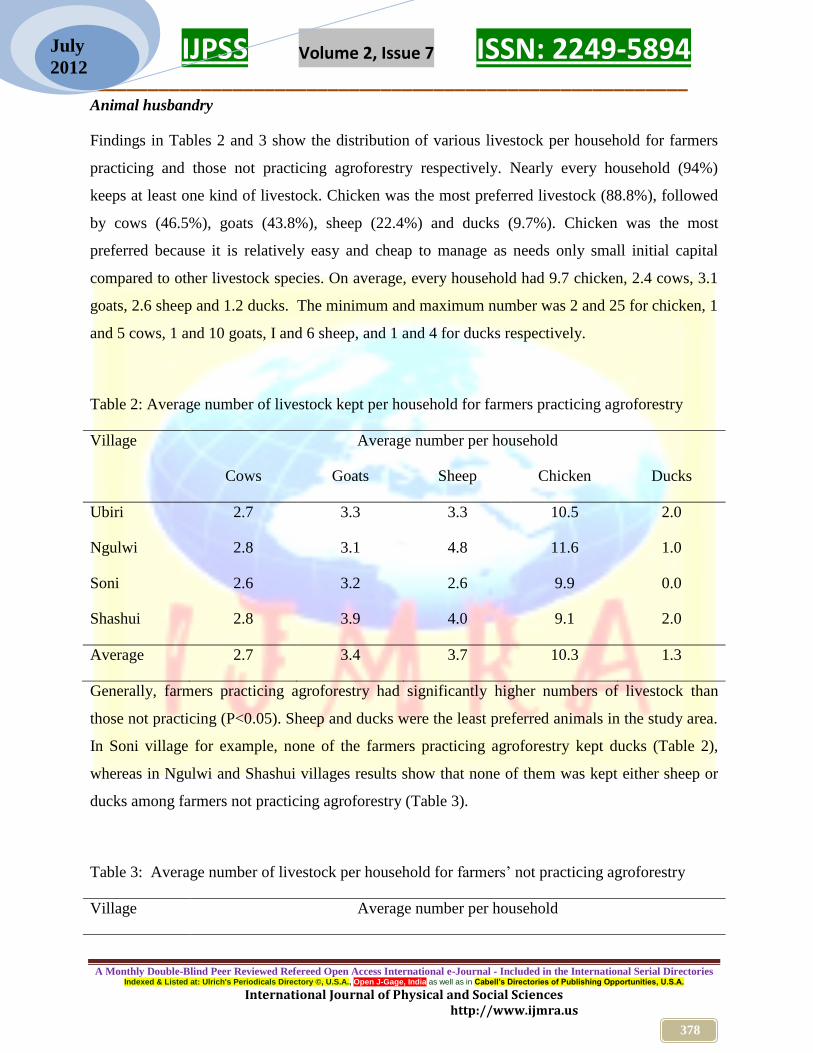
Animal husbandry
Findings in Tables 2 and 3 show the distribution of various livestock per household for farmers
practicing and those not practicing agroforestry respectively. Nearly every household (94%)
keeps at least one kind of livestock. Chicken was the most preferred livestock (88.8%), followed
by cows (46.5%), goats (43.8%), sheep (22.4%) and ducks (9.7%). Chicken was the most
preferred because it is relatively easy and cheap to manage as needs only small initial capital
compared to other livestock species. On average, every household had 9.7 chicken, 2.4 cows, 3.1
goats, 2.6 sheep and 1.2 ducks. The minimum and maximum number was 2 and 25 for chicken, 1
and 5 cows, 1 and 10 goats, I and 6 sheep, and 1 and 4 for ducks respectively.
Table 2: Average number of livestock kept per household for farmers practicing agroforestry
Village Average number per household
Cows Goats Sheep Chicken Ducks
Ubiri 2.7 3.3 3.3 10.5 2.0
Ngulwi 2.8 3.1 4.8 11.6 1.0
Soni 2.6 3.2 2.6 9.9 0.0
Shashui 2.8 3.9 4.0 9.1 2.0
Average 2.7 3.4 3.7 10.3 1.3
Generally, farmers practicing agroforestry had significantly higher numbers of livestock than
those not practicing (P<0.05). Sheep and ducks were the least preferred animals in the study area.
In Soni village for example, none of the farmers practicing agroforestry kept ducks (Table 2),
whereas in Ngulwi and Shashui villages results show that none of them was kept either sheep or
ducks among farmers not practicing agroforestry (Table 3).
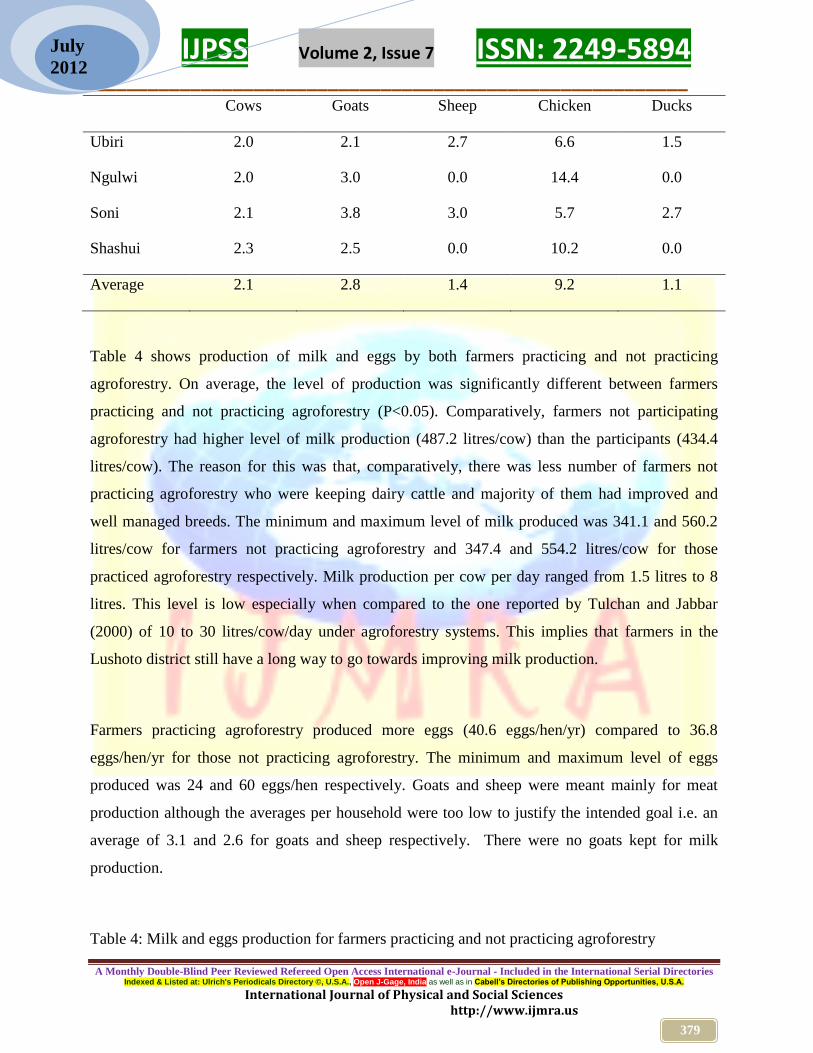
Table 3: Average number of livestock per household for farmers’ not practicing agroforestry
Village Average number per household
IJPSS Volume 2, Issue 7 ISSN: 2249-5894 _________________________________________________________
A Monthly Double-Blind Peer Reviewed Refereed Open Access International e-Journal - Included in the International Serial Directories Indexed & Listed at: Ulrich's Periodicals Directory ©, U.S.A., Open J-Gage, India as well as in Cabell’s Directories of Publishing Opportunities, U.S.A.
International Journal of Physical and Social Sciences http://www.ijmra.us
379
July
2012
Cows Goats Sheep Chicken Ducks
Ubiri 2.0 2.1 2.7 6.6 1.5
Ngulwi 2.0 3.0 0.0 14.4 0.0
Soni 2.1 3.8 3.0 5.7 2.7
Shashui 2.3 2.5 0.0 10.2 0.0
Average 2.1 2.8 1.4 9.2 1.1
Table 4 shows production of milk and eggs by both farmers practicing and not practicing
agroforestry. On average, the level of production was significantly different between farmers
practicing and not practicing agroforestry (P<0.05). Comparatively, farmers not participating
agroforestry had higher level of milk production (487.2 litres/cow) than the participants (434.4
litres/cow). The reason for this was that, comparatively, there was less number of farmers not
practicing agroforestry who were keeping dairy cattle and majority of them had improved and
well managed breeds. The minimum and maximum level of milk produced was 341.1 and 560.2
litres/cow for farmers not practicing agroforestry and 347.4 and 554.2 litres/cow for those
practiced agroforestry respectively. Milk production per cow per day ranged from 1.5 litres to 8
litres. This level is low especially when compared to the one reported by Tulchan and Jabbar
(2000) of 10 to 30 litres/cow/day under agroforestry systems. This implies that farmers in the
Lushoto district still have a long way to go towards improving milk production.
Farmers practicing agroforestry produced more eggs (40.6 eggs/hen/yr) compared to 36.8
eggs/hen/yr for those not practicing agroforestry. The minimum and maximum level of eggs
produced was 24 and 60 eggs/hen respectively. Goats and sheep were meant mainly for meat
production although the averages per household were too low to justify the intended goal i.e. an
average of 3.1 and 2.6 for goats and sheep respectively. There were no goats kept for milk
production.
Table 4: Milk and eggs production for farmers practicing and not practicing agroforestry

IJPSS Volume 2, Issue 7 ISSN: 2249-5894 _________________________________________________________
A Monthly Double-Blind Peer Reviewed Refereed Open Access International e-Journal - Included in the International Serial Directories Indexed & Listed at: Ulrich's Periodicals Directory ©, U.S.A., Open J-Gage, India as well as in Cabell’s Directories of Publishing Opportunities, U.S.A.
International Journal of Physical and Social Sciences http://www.ijmra.us
380
July
2012
Village Farmers practicing agroforestry Farmers not practicing agroforestry
Milk
(Litres/cow)
Eggs (Eggs/hen) Milk
(Litres/cow)
Eggs (Eggs/hen)
Ubiri 470.2 43.1 560.2 33.2
Ngulwi 554.2 45.4 510.0 33.5
Soni 347.4 38.1 537.7 44.8
Shashui 365.8 35.9 341.1 35.8
Average 434.4 40.6 487.2 36.8
Farmers were asked to give trends of the level of milk production for the past ten years. Close to
half (48.5%) said it was decreasing, 29.1% uniform, 17.2% increasing and 5.2% were not keeping
dairy cattle. Milk production have been going down among the majority probably due to poor
livestock management practices due to inadequate extension services, high costs of livestock
inputs, diseases and insufficient fodder supply from the agroforestry systems. It was however,
learnt from focus group discussions that, there are opportunities for farmers to improve their
livestock level of milk production. This is because most of the surveyed households (80%) had
crossbred stall-fed dairy cows of which if properly managed can improve milk production. The
problem was that some of the dairy cattle were not fed well because sometimes farmers were
forced to either buy fodder or hire labour to fetch them outside the agroforestry systems which
increased livestock production costs. To reduce the costs probably the animals do not get enough
fodder thus, the low milk production. Therefore if farmers could improve fodder production then
the animals will get enough to eat and thus improve milk production. Studies by ICRAF (1996)
and Gatsi et al. (2000) have shown higher level of milk production after the improved dairy cattle
got enough fodder.
Crop production
Tables 5 and 6 show household’s level of production of various crops for farmers practicing and
not practicing agroforestry respectively. The level of production was significantly different
between farmers practicing and not practicing agroforestry (P<0.05). Generally, farmers
IJPSS Volume 2, Issue 7 ISSN: 2249-5894 _________________________________________________________
A Monthly Double-Blind Peer Reviewed Refereed Open Access International e-Journal - Included in the International Serial Directories Indexed & Listed at: Ulrich's Periodicals Directory ©, U.S.A., Open J-Gage, India as well as in Cabell’s Directories of Publishing Opportunities, U.S.A.
International Journal of Physical and Social Sciences http://www.ijmra.us
381
July
2012
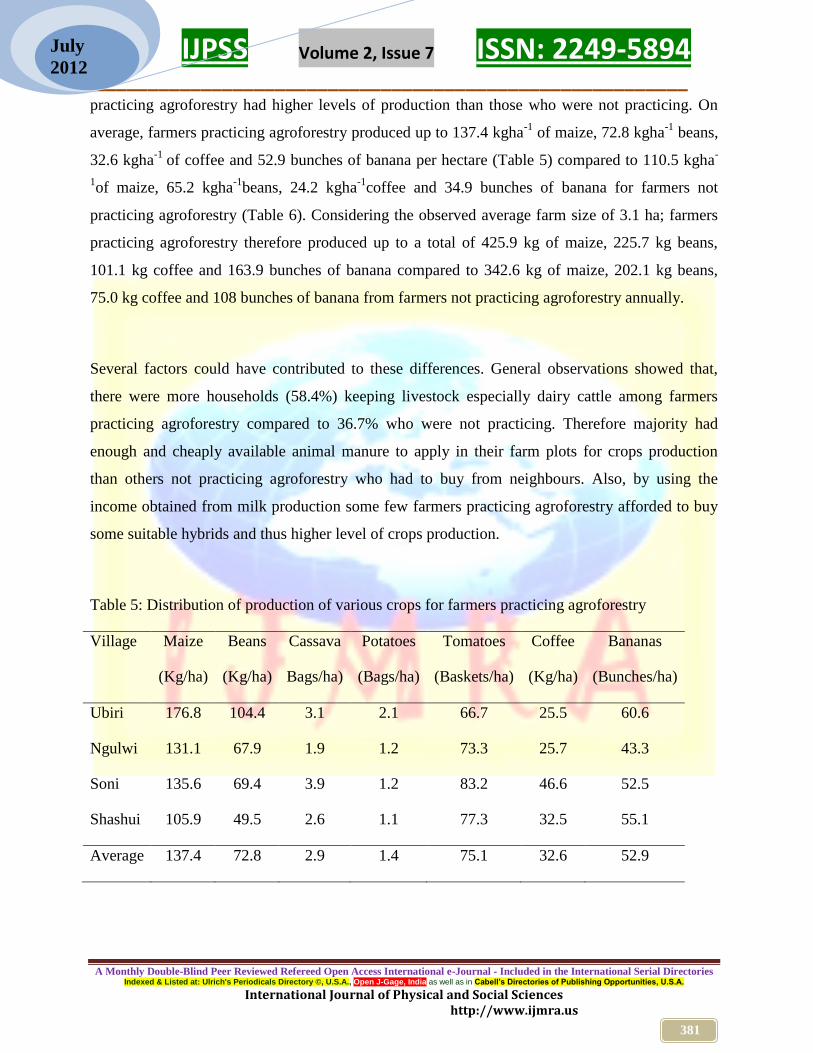
practicing agroforestry had higher levels of production than those who were not practicing. On
average, farmers practicing agroforestry produced up to 137.4 kgha-1
of maize, 72.8 kgha-1
beans,
32.6 kgha-1
of coffee and 52.9 bunches of banana per hectare (Table 5) compared to 110.5 kgha-
1of maize, 65.2 kgha
-1beans, 24.2 kgha
-1coffee and 34.9 bunches of banana for farmers not
practicing agroforestry (Table 6). Considering the observed average farm size of 3.1 ha; farmers
practicing agroforestry therefore produced up to a total of 425.9 kg of maize, 225.7 kg beans,
101.1 kg coffee and 163.9 bunches of banana compared to 342.6 kg of maize, 202.1 kg beans,
75.0 kg coffee and 108 bunches of banana from farmers not practicing agroforestry annually.
Several factors could have contributed to these differences. General observations showed that,
there were more households (58.4%) keeping livestock especially dairy cattle among farmers
practicing agroforestry compared to 36.7% who were not practicing. Therefore majority had
enough and cheaply available animal manure to apply in their farm plots for crops production
than others not practicing agroforestry who had to buy from neighbours. Also, by using the
income obtained from milk production some few farmers practicing agroforestry afforded to buy
some suitable hybrids and thus higher level of crops production.
Table 5: Distribution of production of various crops for farmers practicing agroforestry
Village Maize Beans Cassava Potatoes Tomatoes Coffee Bananas
(Kg/ha) (Kg/ha) Bags/ha) (Bags/ha) (Baskets/ha) (Kg/ha) (Bunches/ha)
Ubiri 176.8 104.4 3.1 2.1 66.7 25.5 60.6
Ngulwi 131.1 67.9 1.9 1.2 73.3 25.7 43.3
Soni 135.6 69.4 3.9 1.2 83.2 46.6 52.5
Shashui 105.9 49.5 2.6 1.1 77.3 32.5 55.1
Average 137.4 72.8 2.9 1.4 75.1 32.6 52.9

IJPSS Volume 2, Issue 7 ISSN: 2249-5894 _________________________________________________________
A Monthly Double-Blind Peer Reviewed Refereed Open Access International e-Journal - Included in the International Serial Directories Indexed & Listed at: Ulrich's Periodicals Directory ©, U.S.A., Open J-Gage, India as well as in Cabell’s Directories of Publishing Opportunities, U.S.A.
International Journal of Physical and Social Sciences http://www.ijmra.us
382
July
2012
Table 6: Distribution of production of various crops for farmers not practicing agroforestry
Village Maize Beans Cassava Potatoes Tomatoes Coffee Bananas
(Kg/ha) (Kg/ha) Bags/ha) (Bags/ha) (Baskets/ha) (Kg/ha) (Bunches/ha)
Ubiri 158.7 82.3 2.4 1.9 64.8 11.6 40.9
Ngulwi 92.3 60.9 1.7 0.6 31.5 8.7 30.1
Soni 108.7 56.7 3.1 0.9 60.7 56.7 38.5
Shashui 82.4 60.9 1.6 0.5 45.7 19.8 30.2
Average 110.5 65.2 2.2 0.9 50.7 24.2 34.9
Except for some few types of crops like maize, beans and cassava, which were commonly grown
by almost every farmer (practicing and not practicing agroforestry), generally the number and
types of crops cultivated varied from one household to another. Some farmers preferred to grow
more of the long rain crops while others short rain crops. However, 43% of the surveyed farmers
reported uniform trends of the levels of crop production for the past ten years, whereas 40%
decreasing and 17% increasing suggesting that majority (60%) are benefiting from the systems
productivity although not at optimal level because to them, production has either been uniform or
improve to some extent compared to the past. Furthermore, 47% were expecting future
productivity of their agroforestry systems to be the same as the present time while 28.4% poor
and 24.6% to improve.
Further observations showed that majority of farmers practicing agroforestry had managed to
arrest the problem of soil erosion to some extent; firstly by stopping the former system of free
livestock grazing of which was accelerating the problem and secondly by planting more plants.
With such achievements, future productivity of the systems could probably improve depending on
the management system. Apart from arresting soil erosion, farmers need also to frequently add
animal manure and plant the recommended improved crop seeds suitable to this area instead of
the commonly used local seeds. Study by ICRAF (1996) has shown improvement in productivity
of the agroforestry systems especially after using improved crop seeds. For example, yields of
IJPSS Volume 2, Issue 7 ISSN: 2249-5894 _________________________________________________________
A Monthly Double-Blind Peer Reviewed Refereed Open Access International e-Journal - Included in the International Serial Directories Indexed & Listed at: Ulrich's Periodicals Directory ©, U.S.A., Open J-Gage, India as well as in Cabell’s Directories of Publishing Opportunities, U.S.A.
International Journal of Physical and Social Sciences http://www.ijmra.us
383
July
2012
wool and mutton improved from 3.25 to 17.30 tones/ ha as a result of growing improved seeds,
which were also well managed.
Comparatively, the observed average yields from farmers practicing agroforestry (Table 5) were
generally lower than other yields reported by Fernandes et al. (1984), Frozen and Oberholzer
(1986), Rugalema (1992) and Moshi (1997). For example, Moshi (1997) reported 156.25 kgha-1
of coffee, 92.97 kgha-1
of beans, 235.16 kgha-1
of maize and 163.28 bunches of banana per
hectare from the west Usambaras homegardens. Study by Fernandes et al. (1984) showed a total
of 412 kgha-1
of coffee, 148 kgha-1
of beans and 404 bunches of banana per hectare from the
Chagga homegardens. In western Nepal, the average annual yield was 899kgha-1
for maize, 637
kgha-1
for wheat, 206 kgha-1
for millet and 186 kgha-1
for rapeseed (Frozen and Oberholzer,
1986). The Kagera home gardens were producing up to 200 kgha-1
of beans, 135 kgha-1
of maize,
175 bunches of banana ha-1
annually (Rugalema, 1992).
This implies that, farmers still have a long way to go towards improving the productivity of the
agroforestry systems in the study area. Several factors could have contributed to the observed
level of production including the problem of low soil fertility, expensive farm inputs, and
unattractive producer prices to some crops. There was also partial adoption of the agroforestry
technologies as shown by some farmers who had few numbers of tree species and shrubs in their
farms. Therefore, overcoming these constraints could probably lead to opportunities of improving
the systems’ productivity.
Trees and shrubs production
Table 7 shows the average, minimum and maximum number of trees planted by the farmers
practicing and not practicing agroforestry. The average, maximum and minimum number of trees
for farmers practicing agroforestry was 62.9, 238 and 23 trees/ha, and 10.36, 3 and 19 trees /ha
for those not practicing agroforestry respectively. Generally these are the multipurpose trees and
shrubs deliberately intended for production of timber, poles, fuelwood, fodder and food/fruits and

IJPSS Volume 2, Issue 7 ISSN: 2249-5894 _________________________________________________________
A Monthly Double-Blind Peer Reviewed Refereed Open Access International e-Journal - Included in the International Serial Directories Indexed & Listed at: Ulrich's Periodicals Directory ©, U.S.A., Open J-Gage, India as well as in Cabell’s Directories of Publishing Opportunities, U.S.A.
International Journal of Physical and Social Sciences http://www.ijmra.us
384
July
2012
provide shade, restore soil fertility, cut down soil erosion and improve the microclimate by
reducing temperature extremes.
Table 7: Number of trees planted by farmers in the study area
Village Farmers Number of trees planted (ha-1
)
Average Minimum Maximum
Ubiri Practicing agroforestry 43.05 30 69
Not practicing agroforestry 11.77 3 19
Ngulwi Practicing agroforestry 74.24 23 210
Not practicing agroforestry 9.82 5 14
Soni Practicing agroforestry 95.36 29 238
Not practicing agroforestry 7.28 3 10
Shashui Practicing agroforestry 47.53 31 79
Not practicing agroforestry 12.07 4 18
Most trees and shrubs were planted along the farm boundaries rather than contour lines. To the
majority (80%) this makes a considerable sense from the point of view that planting trees on the
boundaries causes less competition with crops. To some farmers the interval between trees was
too wide to effectively support the intended goal of controlling soil erosion. Furthermore, few
households had trees mainly Leucaena leucocephala meant for soil fertility restoration in their
farm plots and of which also were very few in numbers. The reason given during focus group
discussions was that these trees do not perform well in the study area. Most of the trees were
therefore planted to save other purposes including food, fodder, timber, firewood, poles and other
building materials and cut down soil erosion. According to Kerkhof (1990) and SECAP (1991)
some of the trees and shrubs introduced into the study area like Leucaena leucocephala, Leucaena
diversifolia, Calliandra callothyrsus, Stylocenthus spp. and Desmodium spp. for soil fertility

IJPSS Volume 2, Issue 7 ISSN: 2249-5894 _________________________________________________________
A Monthly Double-Blind Peer Reviewed Refereed Open Access International e-Journal - Included in the International Serial Directories Indexed & Listed at: Ulrich's Periodicals Directory ©, U.S.A., Open J-Gage, India as well as in Cabell’s Directories of Publishing Opportunities, U.S.A.
International Journal of Physical and Social Sciences http://www.ijmra.us
385
July
2012
improvement performed poorly due to edaphic and climatic factors. Therefore farmers have found
difficult to establish.
The fruit trees including mangoes, avocado, peaches, oranges, lemons, pawpaws, loquat etc to
mention a few provided farmers with fruits for consumption and cash income from sale of the
surplus. Through pruning of the trees and shrubs also farmers get firewood and building materials
and fodder for livestock. Results from the focus group discussion have shown that, on average a
household needed up to 4 head loads of firewood per week.
More than one third (38%) of farmers were obtaining firewood from trees planted on their farms,
implying that to this group of farmers the agroforestry systems had enough trees to meet the
household’s annual demand for firewood. Majority of them were from Soni and Shashui villages
with trees planted before SECAP under indigenous agroforestry systems. Forty five percent
(45%) of the farmers were depending both on trees planted on their farms and buying firewood
from neighbours. This represents both farmers practicing and not practicing agroforestry whose
systems were not supplying adequately annual firewood requirements. Majority of this group of
farmers had trees planted during SECAP i.e. trees were below 20 years. The remaining 17% of
the farmers were mainly buying firewood from the neighbours. This is the group of the farmers
who were not practicing agroforestry.
Household cash income
Table 8 shows distribution of the household’s annual net income for farmers practicing and not
practicing agroforestry. The calculated net income reflects aggregated values of the effects of
agroforestry to the households in the study area and thus its contribution to household income
poverty reduction. Comparatively, the net income for farmers practicing agroforestry was
significantly different (P<0.05) from those not practicing agroforestry. On average, farmers
practicing agroforestry had higher net income of Tshs 664,992 compared to Tshs 547,608 for
those not practicing. The calculated income per capita (average household size is 6.6 persons) was
Tshs 100,756 and Tshs 82,971 for farmers practicing and not practicing agroforestry respectively.

IJPSS Volume 2, Issue 7 ISSN: 2249-5894 _________________________________________________________
A Monthly Double-Blind Peer Reviewed Refereed Open Access International e-Journal - Included in the International Serial Directories Indexed & Listed at: Ulrich's Periodicals Directory ©, U.S.A., Open J-Gage, India as well as in Cabell’s Directories of Publishing Opportunities, U.S.A.
International Journal of Physical and Social Sciences http://www.ijmra.us
386
July
2012
Therefore, considering the observed average farm size of 3.1 ha, a farmer practicing agroforestry
was earning up to Tshs 214,513 ha-1
compared to Tshs 182,536 ha-1
for those not practicing. This
implies that farmers practicing agroforestry are better off than those not practicing. They have
relatively higher incomes that could help solve many of their daily socio-economic problems and
therefore contributing more to household income poverty reduction than those not practicing
agroforestry. However, the reported income from farmers practicing agroforestry was different
from that observed by Moshi (1997) in the west Usambaras home gardens who reported a total
income of Tshs 495, 091 yearly from 1.28 ha, which is equivalent to Tshs 386,789 per hectare,
and the income per capita of Tshs 56,260 (average household size of 8.8 persons).
Table 8: The household’s annual net income
Village Household’s annual net income (Tshs)
Farmers practicing agroforestry Farmers not practicing agroforestry
Ubiri 723,628 553,069
Ngulwi 715,359 696,535
Soni 588,780 516,479
Shashui 632,201 424,350
Average 664,992 547,608
The study also found that an overwhelming majority (90%) of the surveyed farmers were merely
depending on agroforestry as the main source of income. Based on these findings it can be argued
that, the per capita income of Tshs 100,756 for farmers practicing agroforestry is more than three
times lower than the average national per capita income for rural areas which is Tshs 314,016
(URT, 2007). For that reason farmers in the study area are still living in abject poverty spending
less than US$ 0.50 on consumption a day i.e. Tshs 276 or US$ 0.28. This suggests that, despite
the relatively higher contribution shown by agroforestry to household income poverty reduction,
the production level and net income is generally low and therefore more efforts and strategies are

IJPSS Volume 2, Issue 7 ISSN: 2249-5894 _________________________________________________________
A Monthly Double-Blind Peer Reviewed Refereed Open Access International e-Journal - Included in the International Serial Directories Indexed & Listed at: Ulrich's Periodicals Directory ©, U.S.A., Open J-Gage, India as well as in Cabell’s Directories of Publishing Opportunities, U.S.A.
International Journal of Physical and Social Sciences http://www.ijmra.us
387
July
2012
needed towards improving the systems’ productivity otherwise poverty will still remain a problem
in this area.
Farmers were asked to say whether the income was satisfactory to most of the household
requirements where as 85% said not satisfactory, 13.6% was satisfactory to some extent and only
two farmers (1.4%) said was very satisfactory. This implies that majority do not get enough
income to meet most of their daily family requirements. Most of the incomes although not enough
has been to the majority (80%) spend in basic needs, (16%) school fees and health services and
(4%) hired labour and purchase agricultural inputs.
Factors Influencing Household’s Net Income from the Agroforestry Systems
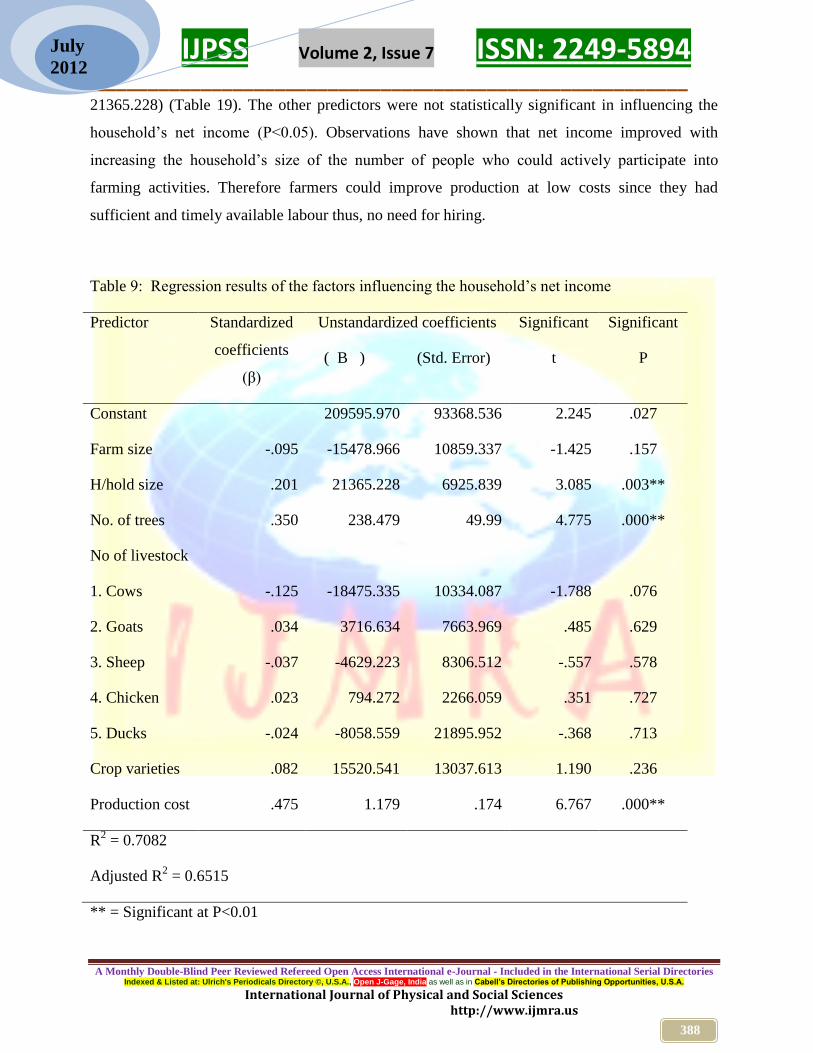
Table 9 presents the results of the regression model of the factors that were thought to account for
more of the variations in the household’s net income from agroforestry systems. Therefore the
predictors, that is, farm size, household size, number of trees planted, number of livestock kept,
and varieties of crops grown and cost of farm production were regressed against the household’s
net income. From the regression analysis, it was observed that the mentioned factors somehow
explained the household’s level of net income from the agroforestry systems because none of
their standard coefficients was equal to zero. The regression model explained 71% of the
variations in the factors affecting the household’s net income as indicated by the R2 (Table 9).
Results further show that three of the six predictors included in the analysis, that is, the household
size, number of trees planted and the annual cost of the household’s farm production were
statistically significant (P<0.01). This implies that the three predictors had an impact on the
household’s net income in the study area than others. Increase in size of these predictors brought
about an increase in the household’s annual net income at magnitudes indicated by their
respective coefficients, and thus contributing to poverty alleviation.
Production cost was the highest predictor of the household’s net income (β value of 0.475 with
unstandardized regression coefficient (B) of 1.179) while number of trees planted the second
predictor (β = 0.350 with B = 238.479) and household size the third predictor (β = 0.201 with B =
IJPSS Volume 2, Issue 7 ISSN: 2249-5894 _________________________________________________________
A Monthly Double-Blind Peer Reviewed Refereed Open Access International e-Journal - Included in the International Serial Directories Indexed & Listed at: Ulrich's Periodicals Directory ©, U.S.A., Open J-Gage, India as well as in Cabell’s Directories of Publishing Opportunities, U.S.A.
International Journal of Physical and Social Sciences http://www.ijmra.us
388
July
2012
21365.228) (Table 19). The other predictors were not statistically significant in influencing the
household’s net income (P<0.05). Observations have shown that net income improved with
increasing the household’s size of the number of people who could actively participate into
farming activities. Therefore farmers could improve production at low costs since they had
sufficient and timely available labour thus, no need for hiring.
Table 9: Regression results of the factors influencing the household’s net income
Predictor Standardized
coefficients
(β)
Unstandardized coefficients
( B ) (Std. Error)
Significant
t
Significant
P
Constant 209595.970 93368.536 2.245 .027
Farm size -.095 -15478.966 10859.337 -1.425 .157
H/hold size .201 21365.228 6925.839 3.085 .003**
No. of trees .350 238.479 49.99 4.775 .000**
No of livestock
1. Cows -.125 -18475.335 10334.087 -1.788 .076
2. Goats .034 3716.634 7663.969 .485 .629
3. Sheep -.037 -4629.223 8306.512 -.557 .578
4. Chicken .023 794.272 2266.059 .351 .727
5. Ducks -.024 -8058.559 21895.952 -.368 .713
Crop varieties .082 15520.541 13037.613 1.190 .236
Production cost .475 1.179 .174 6.767 .000**
R2 = 0.7082
Adjusted R2 = 0.6515
** = Significant at P<0.01

IJPSS Volume 2, Issue 7 ISSN: 2249-5894 _________________________________________________________
A Monthly Double-Blind Peer Reviewed Refereed Open Access International e-Journal - Included in the International Serial Directories Indexed & Listed at: Ulrich's Periodicals Directory ©, U.S.A., Open J-Gage, India as well as in Cabell’s Directories of Publishing Opportunities, U.S.A.
International Journal of Physical and Social Sciences http://www.ijmra.us
389
July
2012
The household’s annual net income improved significantly with increasing number of trees in the
farm plots implying that individual households, which had many tree species and shrubs, had
higher net incomes. However, observations have shown that farmers with many agroforestry trees
and /or shrubs had higher income because instead of buying fodder, firewood, timber and other
construction materials from neighbours could obtain them directly from the agroforestry systems
thus save money. They could also obtain income from sale of the surplus fruits from the
agroforestry system(s). The trees also helped to provide shade to some crops including coffee and
cut off soil erosion thus contribute to improving productivity of the agroforestry systems.
Results in Table 9 further show that the farm size and the number of cows, sheep and ducks kept
influenced the household’s annual net income negatively, and were not found statistically
significant. This implies that as the number of these animals increased, there was a decrease in the
household’s net income. However, further observations showed that majority of the farmers had a
problem of insufficient fodder production from the agroforestry systems. Therefore, including
other associated costs of the livestock inputs; increase in number of the livestock's decreases the
net income, as there were added costs of buying fodder and other inputs and since majority could
not afford then the livestock were poorly fed thus low production as well as net income. In
addition, there was a negative influence of the farm sizes to the net income probably because
productivity of the farming systems was depending mostly on how best the systems were
managed than their sizes. A farmer with a well-planed and managed agroforestry system could
have higher yield regardless of the farm size given that there is a good management systems.
The varieties of the agricultural crops grown under the agroforestry systems and the number of
livestock kept like goats and chicken had positive influence on the household’s annual net income
although they were not statistically significant. This implies that, farmers with many varieties of
crops associated with the agroforestry trees and /or shrubs had more yields and net income than
others. Goats and chicken also contribute to the net income probably because they require less
initial capital and management costs. For example, management of chicken in the study area was
basically through free-range system.
IJPSS Volume 2, Issue 7 ISSN: 2249-5894 _________________________________________________________
A Monthly Double-Blind Peer Reviewed Refereed Open Access International e-Journal - Included in the International Serial Directories Indexed & Listed at: Ulrich's Periodicals Directory ©, U.S.A., Open J-Gage, India as well as in Cabell’s Directories of Publishing Opportunities, U.S.A.
International Journal of Physical and Social Sciences http://www.ijmra.us
390
July
2012
Conclusions and recommendations
From this study it can be concluded that the level of the household’s farm production and net
income is greater among farmers practicing agroforestry than those who were not practicing,
implying that, agroforestry is significantly contributing to increased yields and income and thus
income poverty reduction at household level. The trees and crops into such systems produce both
food for subsistence and cash, fodder for the livestock, and reduce the problem of soil degradation
and water quality and quantity while solving the problem of energy crisis. The livestock are
mostly stall-fed and contribute to the household’s nutrition and income through sale of their
products like milk, eggs and meat. In order to improve productivity and sustainability of the
agroforestry systems in Lushoto District and contribute to income poverty reduction, there is need
for the government to promote efficient use of the farm inputs and labour along with policies,
which harness market incentives is a prerequisite. Improvement of the market opportunities and
extension services will also motivate farmers to invest in crop production and thus improve the
management and production at large. Overall, the present findings on poverty reduction were only
based on the household’s level of production and income from the agroforestry systems.
Therefore, to get a wider and clear picture of the poverty level in the study area, an assessment of
the contribution of both farm and off-farm activities to the household’s income is recommended.
References
ICRAF (1995). Annual Report of the International Center for Research in Agroforestry. ICRAF
Nairobi, Kenya, 288pp.
ICRAF (1996). Annual Report of the International Center for Research in Agroforestry. ICRAF
Nairobi, Kenya, 340pp.
Johansson, L. (2001). Ten Million Trees Later. Land Use Change in the West Usambara
Mountains. The Soil Erosion Control and Agroforestry Project in Lushoto District,
Tanzania. 1981 - 2000. GTZ. Eschborn, 163pp.

IJPSS Volume 2, Issue 7 ISSN: 2249-5894 _________________________________________________________
A Monthly Double-Blind Peer Reviewed Refereed Open Access International e-Journal - Included in the International Serial Directories Indexed & Listed at: Ulrich's Periodicals Directory ©, U.S.A., Open J-Gage, India as well as in Cabell’s Directories of Publishing Opportunities, U.S.A.
International Journal of Physical and Social Sciences http://www.ijmra.us
391
July
2012
Kayunze, K.A. (1998). Comparative contribution of non- farm and farm enterprises to rural
poverty alleviation in Mbeya Region, Tanzania: A case study of Ileje and Rungwe
Districts. Unpublished M.A Dissertation, Sokoine University of Agriculture, Morogoro,
Tanzania, pp. 10 - 145.
Kerkhof, P. (1990). Agroforestry in Africa. A survey of Project Experience, 216pp.
Aichi Kitalyi, Gerson Nyadzi, Mary Lutkamu, Remen Swai and Benjamin Gama (2009). The
policy brief is based on a paper entitled: New climate, new agriculture: How agroforestry
contributes to meeting the challenges of agricultural development in Tanzania (submitted
to Tanzania Journal of Agricultural Sciences)
Merina, Y.M. (2001). Gender Based Coping Strategies Against Food Insecurity in Dodoma Rural
District, Tanzania. Unpublished Dissertation for Award of a MSc Degree Award in
Management of Natural Resource and Sustainable Agriculture of Sokoine University of
Agricultural, Morogoro, Tanzania, pp. 1 - 130.
O’Kting’ati, A. (1985). An analysis of economics of agroforestry in Kilimanjaro. Unpublished Ph.
D. Thesis, University of Dar es Salaam, Dar es Salaam, Tanzania, pp.13 – 200.
Pfeiffer, R. (1990). Sustainable Agriculture in Practice – the Production potential and the
environmental Effects of Macro – contour lines in the West Usambara Mountains of
Tanzania. Hohenheim, 140pp.
Rocheleau, D., F. Weber and A. Field-Juma (1988). Agroforestry in Drylands Africa. ICRAF,
Nairobi, 311pp.
Rugalema, G.H.R. (1992). The traditional homegarden agroforestry system of Bukoba, Tanzania:
Description, critical constraints and farm economic analysis of possible solutions to falling
productivity. Unpublished MSc. Thesis submitted at the Agricultural University of
Norway, pp. 10 – 111.
SECAP (1991). Project review. Soil Erosion Control and Agroforestry Project, Lushoto,
Tanzania, 45pp.

IJPSS Volume 2, Issue 7 ISSN: 2249-5894 _________________________________________________________
A Monthly Double-Blind Peer Reviewed Refereed Open Access International e-Journal - Included in the International Serial Directories Indexed & Listed at: Ulrich's Periodicals Directory ©, U.S.A., Open J-Gage, India as well as in Cabell’s Directories of Publishing Opportunities, U.S.A.
International Journal of Physical and Social Sciences http://www.ijmra.us
392
July
2012
SECAP (1999). Project description. Soil Erosion Control and Agroforestry Project, Lushoto,
Tanga, Tanzania, 55pp.
Semgalawe, Z.M. (1998). Household Adoption Behaviour and Agricultural Sustainability in the
Northern Mountains of Tanzania: The Case of Soil Conservation in the North Pare and
Usambara Mountains. Wageningen Agricultural University, Norway, 189pp.
United Republic of Tanzania (URT) (1994). Household Budget Survey 1990/91. Bureau of
Statistics, Planning Commission, Dar-es-Salaam, Tanzania, pp 180.
Young, A. (1989). Agroforestry for Soil Conservation. Science and Practice of agroforestry.
IRAF, Nairobi and CAB International, Wallingford, UK. 270pp.