assessment of scale formation in the column of …
TRANSCRIPT

BRAZILIAN JOURNAL OF PETROLEUM AND GAS | v. 7 n. 1 | p. 015-029 | 2013 | ISSN 1982-0593
15
ASSESSMENT OF SCALE FORMATION IN THE COLUMN OF AN OIL AND NATURAL GAS PRODUCING WELL: A CASE STUDY
a Frota, T. M. P. 1;
b Silva, D. R.;
c Aguiar, J. R.;
a Anjos, R. B.;
a Silva, I. K. V.
a Federal University of Rio Grande do Norte, Graduate Program in Science and Petroleum Engineering – Natal, RN, Brazil
b Federal University of Rio Grande do Norte, Institute of Chemistry, Natal, RN, Brazil
c Petróleo Brasileiro S. A - Petrobras
ABSTRACT The present study investigated the influence of depth, pressure and temperature on the composition and behavior of scale formation along a column in a well that produces oil and natural gas. The objective was to improve treatments to remove precipitates formed on the column surface. Ten samples of residues were collected from several points along the production column (from 15.4 m to 4061.5 m) that exhibited scale formation or corrosion problems. Dissolution tests were performed in organic acids. The predominant composition was defined and confirmed by dissolution assays and characterization was determined using X-Ray Diffractometry (XRD), X-Ray Fluorescence Spectrometry (XRF) and Scanning Electron Microscopy (SEM). Residues with distinct characteristics were observed in different proportions, showing a tendency to increase or decrease in mass with depth. The results indicate that correlations can be established between the type of scale formation and depth and, consequently, thermodynamic conditions (pressure and temperature).
KEYWORDS scale formation; production column; XRD; XRF; SEM
1 To whom all correspondence should be addressed.
Address: Federal University of Rio Grande do Norte, Graduate Program in Science and Petroleum Engineering, Campus Universitário, Natal, Rio Grande do Norte, RN – Brazil - CEP 59072-970 Telephone: +55 84 4141-2992 / +55 84 9669-1009 | E-mail: [email protected] doi:10.5419/bjpg2013-0002
BRAZILIAN JOURNAL OF PETROLEUM AND GAS | v. 7 n. 1 | p. 015-029 | 2013 | ISSN 1982-0593
16
1. INTRODUCTION
Corrosion, inorganic and organic deposits and formation of stable emulsions often compromise oil flow, or even plug columns, lines and underwater and surface equipments (Oliveira, 1997).
A decline in production may be caused by damage or elevation problems within the formation (Mackay et al., 1999). Inorganic salt deposits, commonly known as scale, are some of the possible problems encountered during exploration and production, and can lead to reduced permeability in the hydrocarbon-producing formation due to the precipitation of inorganic salts in the reservoir, and perforations in the rock, production column and some surface equipments (Dyer and Graham, 2002; Marques et al., 2001; Mackay et al., 2003; Jordan et al., 2000; 2004).
Formation waters associated with hydrocarbons normally contain large concentrations of chloride (Cl–) and sodium (Na+) ions. Also present in significant concentrations are sulfate (SO4
2–), bicarbonate (HCO3
–), carbonate (CO32–), calcium
(Ca2+), magnesium (Mg2+), barium (Ba2+), potassium (K+), strontium (Sr2+) and bromide (Br–) ions. The most common scale formations found in oil fields contain calcium carbonate (CaCO3), calcium sulfate (CaSO4) and barium sulfate (BaSO4) (Chen et al., 2005; Eidelwein, 1992; Jordan et al., 2004; López-Sandoval et al., 2007; Salman et al., 2007). The solubility of these substances may be influenced by factors such as pressure (P) and temperature (T). The total mass precipitation depends on the degree of saturation (D.S.) of the medium and the disturbance to which the system is subjected (variations in turbulence, pressure, flow velocity, presence of nucleating agents, etc.). As the degree of saturation increases, the solution becomes supersaturated and, depending on P and T conditions, may lead to precipitation of excess salt. This is one of the primary causes for the occurrence of inorganic deposits (Akin and Lagerwerff, 1965; Chen et al., 2005; Mucci and Morse, 1983).
Calcium carbonate formation is a function of the combination of calcium ions (Ca2+) and bicarbonate ions (HCO3
–) present in water, or indirectly, by the action of carbon dioxide (CO2) from formation, which interact reversibly as shown by Equation 1
(Akin and Lagerwerff, 1965; Chen et al., 2005; Mucci and Morse, 1983; Tomson et al., 2003; Zhang et al., 2001):
Ca2+ + 2HCO-3 ↔ CaCO3 (s) + H2O + CO2 (g) (1)
Other types of rarely seen scale formation such as zinc sulfates, lead sulfates and nickel sulfates, usually associated with carbonates, have increased interest among researchers (Collins and Jordan, 2003; Jordan et al., 2000; Jordan et al., 2004). Thus, scale formation and inhibition mechanisms have been extensively investigated for several decades (Eidelwein, 1992; Jordan et al., 2000; Jordan et al., 2004; Tomson et al., 2003), in an attempt to address the numerous resulting problems which can have an impact on operational costs due to lost production, interventions in the wells, the need to remove chemicals, etc. The most widely used prevention method is the chemical treatment with inhibitors of scale formation (Salman et al., 2007). There is ample evidence in the literature (Chen et al., 2005; Collins and Jordan, 2003; López-Sandoval et al., 2007) that low concentrations of metal ions, including Zn2+, Cu2+, Fe2+, Fe3+ and Mg2+, may affect nucleation and the CaCO3 precipitation rate, inducing morphological alterations. Some scale formations are easily removed by acidification. Calcite, however, is difficult to predict using the existing models. The best way to identify the presence of carbonate is through monitoring.
The proper characterization of scale formation, which is very important in determining salt deposition on the internal walls of a well, is a serious operational problem for the oil industry due to lost productivity and time spent on equipment cleaning. This issue has been extensively studied in recent years, since oil companies are obtaining increasingly complex products and tend to produce more and more residues.
With the purpose of assessing the development of scale formation and showing the importance of characterization in a production column, we sought to associate the influence of depth, pressure and temperature on the composition and phases of scale formation, and suggest the most adequate treatment for their removal.

BRAZILIAN JOURNAL OF PETROLEUM AND GAS | v. 7 n. 1 | p. 015-029 | 2013 | ISSN 1982-0593
17
2. MATERIALS AND METHODS
2.1 Extraction of the organic phase
The procedure for extraction of the organic phase was carried out with the soxhlet method (Avanti Soxtec 2055). To do this, 5.0-g samples were extracted from each pre-determined depth with chloroform, which is the least toxic solvent among others tested and provides a more efficient extraction (Moura et al., 2006). The cycle of extraction was optimized for 120 minutes at a temperature of 140°C. Then the sample was cooled and pulverized in a ball mill, model RETSCH PM 200 planetary, at 500rpm for 10 minutes to obtain a lower average grain size (100 # mesh).
2.2 X-ray Fluorescence Spectrometry (XRF)
X-ray fluorescence spectrometry was conducted using a Shimadzu XRF–1800 spectrometer in the semi-quantitative mode, in which the wavelength dispersion methodology (WD-XRF) was employed. The detection limit of the device ranges from sodium (Na Z = 11) to uranium (U Z = 92), using RhKα radiation (λ = 0.615Å). The sample was pressed with boric acid, using a 6:1 ratio (boric acid:sample), with two 60-second pressing cycles and a load of 30kPa.
2.3 X-ray Diffraction (XRD)
X-ray diffraction was performed using a Shimadzu LabX XRD 6000 diffractometer, with
CuKα radiation (λ = 1.5418Ǻ). The diffractogram obtained was analyzed by Search Match 3.01 and Shimadzu Basic Process software with the JCPDS database (Joint Committee on Powder Diffraction Standards). Thus, qualitative information on scale formation and/or corrosion products can be available for the various crystalline phases present.
2.4 Scanning Electronic Microscopy (SEM)
Scanning electronic microscopy was carried out using a Philips XL-30 ESEM in low vacuum mode (environmental mode), which does not require sample metallization. Fragments of each sample were extracted (Soxhlet), removing organic matter to avoid contamination of the equipment. In this analysis, samples were not pulverized, allowing the study of scale formation, morphology and chemical composition using EDS (Energy Dispersive Spectrometry).
3. RESULTS AND DISCUSSION
3.1 Operational conditions of the production column
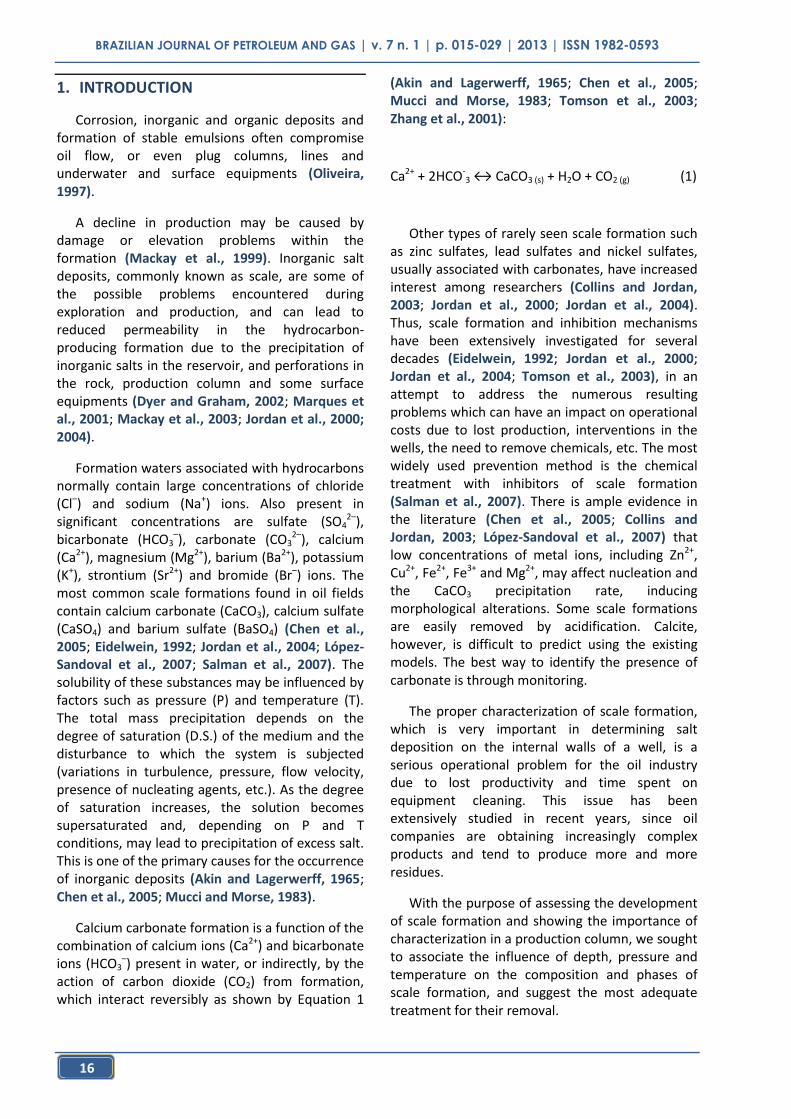
Fig. 1 illustrates the dynamic gradient profile of temperature-depth, showing that temperature increases with depth along the column, in accordance with the geothermal gradient of the oil field. According to Graham and Williams (2005), the primary elements responsible for scale
4500
4000
3500
3000
2500
2000
1500
1000
500
0
100 110 120 130 140 150 160 170 180 190 200
production zone
wellhead
Temperature (C)
co
lum
n l
en
gth
(m
)
Figure 1. Temperature behavior along the column (Bolonhini, 2008).
BRAZILIAN JOURNAL OF PETROLEUM AND GAS | v. 7 n. 1 | p. 015-029 | 2013 | ISSN 1982-0593
18
formation are abrupt changes in pressure and temperature during production, mainly due to alterations in the carbonate system. As the fluid flows through the production column, it passes through zones of lower temperature and pressure, releasing CO2 from the water produced along with the gas and condensate.
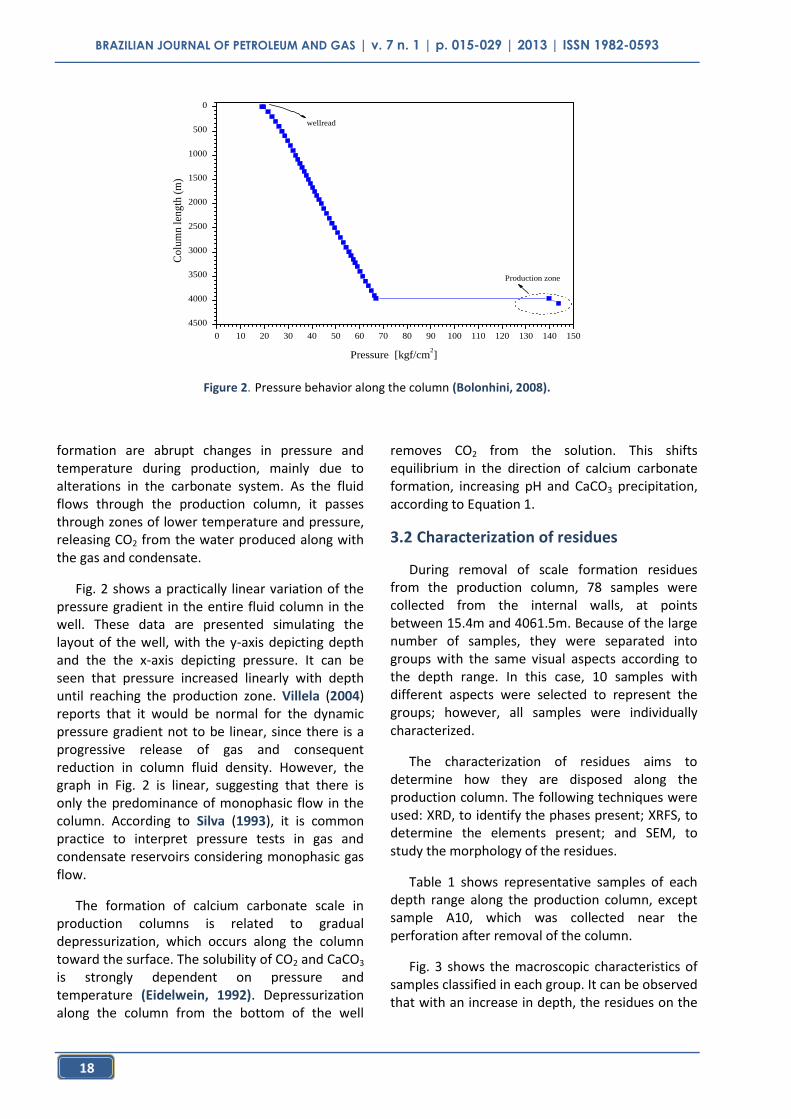
Fig. 2 shows a practically linear variation of the pressure gradient in the entire fluid column in the well. These data are presented simulating the layout of the well, with the y-axis depicting depth and the the x-axis depicting pressure. It can be seen that pressure increased linearly with depth until reaching the production zone. Villela (2004) reports that it would be normal for the dynamic pressure gradient not to be linear, since there is a progressive release of gas and consequent reduction in column fluid density. However, the graph in Fig. 2 is linear, suggesting that there is only the predominance of monophasic flow in the column. According to Silva (1993), it is common practice to interpret pressure tests in gas and condensate reservoirs considering monophasic gas flow.
The formation of calcium carbonate scale in production columns is related to gradual depressurization, which occurs along the column toward the surface. The solubility of CO2 and CaCO3 is strongly dependent on pressure and temperature (Eidelwein, 1992). Depressurization along the column from the bottom of the well
removes CO2 from the solution. This shifts equilibrium in the direction of calcium carbonate formation, increasing pH and CaCO3 precipitation, according to Equation 1.
3.2 Characterization of residues
During removal of scale formation residues from the production column, 78 samples were collected from the internal walls, at points between 15.4m and 4061.5m. Because of the large number of samples, they were separated into groups with the same visual aspects according to the depth range. In this case, 10 samples with different aspects were selected to represent the groups; however, all samples were individually characterized.
The characterization of residues aims to determine how they are disposed along the production column. The following techniques were used: XRD, to identify the phases present; XRFS, to determine the elements present; and SEM, to study the morphology of the residues.
Table 1 shows representative samples of each depth range along the production column, except sample A10, which was collected near the perforation after removal of the column.
Fig. 3 shows the macroscopic characteristics of samples classified in each group. It can be observed that with an increase in depth, the residues on the
4500
4000
3500
3000
2500
2000
1500
1000
500
0
0 10 20 30 40 50 60 70 80 90 100 110 120 130 140 150
wellread
Production zone
Pressure [kgf/cm2]
Co
lum
n l
eng
th (
m)
Figure 2. Pressure behavior along the column (Bolonhini, 2008).

BRAZILIAN JOURNAL OF PETROLEUM AND GAS | v. 7 n. 1 | p. 015-029 | 2013 | ISSN 1982-0593
19
production column display different aspects. Fig. 3(A1) depicts samples collected near the surface, exhibiting similar characteristics (large thin plates). Fig. 3(A2) presents iron-like characteristics (small thin orange plate-like encrustations). Fig. 3(A3) samples resemble sample 3(A2), but are more crumbly, their surface is rougher and they exhibit lighter color at the point of contact with the column. Samples from Figures 3(A4), (A5) and (A6) display similar characteristics (plate-like and granules, distinguished by roughness and color).
Fig. 3(A7) shows a different aspect from the others, with typically lighter granules in some of the plates. These are clear, well-defined crystals. The depth range where most of the restriction occurred was between 1850m and 2120m, where
scale formation was irregularly-shaped. At this range, the thickest scale formation was found at 2062m. Samples from Figures 3(A8), 3(A9) and 3(A10) exhibited very different characteristics from those of the previous samples, with darker and smaller plates.
3.3 Solubility assays
Solubility assays in acid were conducted, similarly to those carried out in the removal of scale formation [acetic acid 5% (v/v) + 7% formic acid (v/v)]. The images in Fig. 4 show the difference in reactivity between the groups near the head and at the bottom of the well. However, dissolution reactions of samples A1, A2, A3, A4, A5, A6 and A7 are quite severe, due to the reaction of the acid-carbonate mixture in the scale formation with the consequent release of CO2. However, samples A8, A9, A10 did not react with the acids.
3.4 XRF studies
The results of X-ray fluorescence (XRF) are presented in relative mass percentage. This means that the analysis must be made by comparing the relationship between percentage mass values of each element for every sample. The XRF results obtained in this study were not normalized to 100%, deducting the values of elements with low molecular weight (which are not detected by the equipment).
Again, the XRF values are presented simulating the layout of the well. The y-axis depicts depth, where point 0 (zero) is the head of the well and
Table 1. Samples selected and their depth ranges.
Sample depth range (m)
A1 15.40 – 55.90
A2 65.40 – 108.65
A3 322.05 – 766.80
A4 1617.45 – 1792.05
A5 1811.45 – 1908.45
A6 1918.15 – 1994,00
A7 2003.70 – 2100.70
A8 2110.40 – 2236.50
A9 2255.90 – 2535.95
A10 3987.00
Figure 3. Visual aspects of samples collected along the column (the scale shown in red is in centimeters).

BRAZILIAN JOURNAL OF PETROLEUM AND GAS | v. 7 n. 1 | p. 015-029 | 2013 | ISSN 1982-0593
20
4061.5m is the bottom of the well; the x-axis shows the percentage of each element analyzed in all the residues collected. Thus, it is important to determine how the elements in the scale formation are located in the production column.
Fig. 5 shows the percentage of lead (Pb) at different depths along the column. Despite exhibiting low concentrations, a number of oscillations can be observed, but from sample A7 onward its percentage tends to increase gradually, except the last sample (A10) at 3986 m. Sample A9
shows the higher percentage of Pb (2.33%) at a temperature of 160.96°C and pressure of 80.89kgf/cm2.
Fig. 6 depicts the rise in molybdenum (Mo) percentage with an increase in depth, except the last sample (A10), at 3986m. The presence of Mo was surprising, since it is not normally found, and because the percentage (2.80%) was close to that of the alloy material used in the column (Santanna et al., 2003); in sample A9 the percentage was 2.29%. Since sample A10 was not collected directly
Figure 4. Behavior of the samples during the acidification reaction with organic acids.
Figure 5. Variation of lead percentage with depth.

BRAZILIAN JOURNAL OF PETROLEUM AND GAS | v. 7 n. 1 | p. 015-029 | 2013 | ISSN 1982-0593
21
from the column wall, the Mo percentage decreased to 1.13%.
Fig. 7 shows that nickel (Ni) behaves similarly to Mo. But in sample A10, at a temperature of 180.66°C and pressure of 114.92kgf/cm2, the percentage of Ni increased to 6.15 %. The presence of nickel in the scale formation residue may originate by the dissolution of the metal alloy in the production column (Santanna et al., 2003).
Because of the acidification with HCl (15%), which aimed to clean the deepest regions of the well, and given that the column was in contact with the strong acid solution for an extended period of time, it is believed that chromium (Fig. 8), in addition to Mo, Pb and Ni, originated from dissolutions of the metal alloy in the column (Santanna et al., 2003), since similar percentages of these elements were detected in the alloy. It is therefore surmised that the column was oxidized at depths around 2500m.
Figure 6. Variation of molybdenum percentage with depth.
Figure 7. Variation of nickel percentage with depth.

BRAZILIAN JOURNAL OF PETROLEUM AND GAS | v. 7 n. 1 | p. 015-029 | 2013 | ISSN 1982-0593
22
Figures 8 and 9 show high percentages of chromium (Cr) and zinc (Zn), observed at depths of more than 2000m, that is, from sample A7 onwards there is continuous increase in both Cr and Zn contents, reaching 28% and 32%, respectively. The high Cr percentage may be associated with oxidation in the production column, which underwent acid attack (HCl, 15% v/v) in the deepest region. It is suggested that these results be compared with physical analyses of samples from the column itself. The high percentage of Zn
detected in the scale formation at a depth around 2500m is likely attributed to low ZnS solubility at high temperatures and pressures.
Fig. 10 shows the behavior of calcium (Ca), one of the most commonly found elements in the column (about 45%), declining to approximately 20% below a depth of 2400m (sample A9), when the column temperature reaches 160.96oC and the pressure is 80.89kgf/cm2. This high percentage of Ca explains the evolution of gaseous CO2 in the
Figure 8. Variation of chromium percentage with depth.
Figure 9. Variation of zinc percentage with depth.

BRAZILIAN JOURNAL OF PETROLEUM AND GAS | v. 7 n. 1 | p. 015-029 | 2013 | ISSN 1982-0593
23
solubility tests of organic acids (Figure 4), due to the calcium carbonate present in the samples.
The results of the iron (Fe) content analysis in the scales (Fig. 11), shows that iron is the predominant element in the sample (A10), which is probably the main cause of the corrosion on the metal surface.
Finally, Fig. 12 illustrates the variation of the sulfur (S) percentage along the column. This behavior is similar to that of zinc and iron (Figs. 9
and 11), that is, its percentage increases with depth, reaching approximately 13%. The presence of sulfur, zinc and iron is associated with the high pressure and high temperature in the well.
3.5 XRD studies
The diffractogram obtained for sample A1 is shown in Fig. 13, and the pattern corresponds to a predominantly crystalline material consisting primarily of calcium carbonate (calcite). The XRD results corroborate the XRF data (Fig. 10), which
Figure 10. Variation of calcium percentage with depth.
Figure 11. Variation of iron percentage with depth.

BRAZILIAN JOURNAL OF PETROLEUM AND GAS | v. 7 n. 1 | p. 015-029 | 2013 | ISSN 1982-0593
24
indicate that the percentage of calcium was 46.13%.
In Fig. 14, the diffractograms show that new peaks, corresponding to new phases, emerge for samples collected from deeper points. Moreover, from sample A6 onward low-intensity peaks of iron sulfide (FeS) and zinc sulfide (ZnS) appear, and suggest the existence of trace compounds. From sample A7 onward, that is, at depths below 2000m, the intensity of peaks related to these compounds
starts to increase in the diffractograms, and the galena (PbS) peak emerges as trace compounds, since its intensity is very low, whereas the intensity of the calcite peak (CaCO3) decreased.
The most common forms of iron, pyrite (FeS2) and iron oxide, were not found. However, the literature (Jordan et al., 2000; 2004) reports that zinc sulfide contains up to 36% iron. Since the crystals were quite characteristic, it is believed that the iron in the spectra is zinc sulfide.
Figure 12. Variation of sulfur percentage with depth.
20 30 40 50 60 70
0
1000
2000
3000
4000
5000
6000
CaC
O3
CaC
O3
CaC
O3
CaC
O3
CaC
O3
CaC
O3
CaC
O3
CaC
O3
CaC
O3
CaC
O3
CaC
O3
CaC
O3
CaC
O3C
aCO
3
CaC
O3
CaC
O3
Inte
nsi
ty
2
Sample A1
CaCO3 - Calcite
Figure 13. Diffractogram of sample A1 representing group I (the largest phase).

BRAZILIAN JOURNAL OF PETROLEUM AND GAS | v. 7 n. 1 | p. 015-029 | 2013 | ISSN 1982-0593
25
Samples A8, A9 and A10 contain different proportions of ZnS, showing a tendency to increased mass with depth. In addition to ZnS, there is a small amount of PbS, which may indicate that zinc comes from the formation. However, further data are needed to provide a more thorough conclusion, such as the presence of zinc in formation water and knowledge on the geochemistry of the reservoir rock.
3.6 SEM studies
Scanning Electron Microscopy (SEM) and Energy Dispersion Spectroscopy (EDS) images were used to obtain information on morphology and elementary semi-quantitative composition of solid residues attached to the inner walls of the well.
The SEM data generally corroborate those obtained with the XRD and XRF techniques.
20 30 40 50 60 70
0
2000
4000
6000
8000
10000
CaC
O3
CaC
O3
CaC
O3
CaC
O3
CaC
O3
CaC
O3
CaC
O3
CaC
O3
CaC
O3
CaC
O3
PbS
FeS/
ZnS
CaC
O3
PbS
FeS/
ZnSFe
S/Zn
S
PbS
FeS/
ZnS
FeS/
ZnS
Inte
nsity
2
Sample A10
Sample A9
Sample A8
Sample A7
Sample A6
Sample A5
Sample A4
Sample A3
Sample A2
Sample A1
Figure 14. Diffractograms of selected samples.
Figure 15. Scanning electron microscopy micrographs of samples (a) A1 and (b) A9.

BRAZILIAN JOURNAL OF PETROLEUM AND GAS | v. 7 n. 1 | p. 015-029 | 2013 | ISSN 1982-0593
26
However, sample A1, near the surface, exhibited homogeneous structures (Fig. 15) and the predominant matrix is calcium. Sample A9 shows the presence of crystals in a Ca matrix.
Fig. 16 shows details of sample A9, with well-defined galena (PbS) crystals, a cubic structure almost always in octahedra and zinc sulfide (ZnS) crystals.
Fig. 17 shows the images obtained on both sides of sample A9. On side 1, incrustation is on the tube
wall (visually smoother surface), while on side 2 it is located inside the column (visually rougher surface).
Details observed on side 1 reveal a homogeneous surface, suggesting a predominant element. The spectrum shows that the primary element is chromium, possibly due to scale formation in the production column, which is a metal alloy containing more than 20% chromium (Santanna et al., 2003).
Figure 16. Micrographs of sample A9 with details (a) of galena crystals (PbS) at 2000x amplification, and (b) zinc sulfide crystals, at 1000x amplification.
Figure 17. Micrograph of both sides of sample A9 at 20x amplification.

BRAZILIAN JOURNAL OF PETROLEUM AND GAS | v. 7 n. 1 | p. 015-029 | 2013 | ISSN 1982-0593
27
Fig. 18 presents the micrograph of side 2, scale formation in contact with the fluid, showing the presence of more than one element, due to the different densities in the elements. The spectra of the highlighted regions primarily show the presence of calcium, considered as the matrix, as well as sulfur and lead, with the same energy levels.
4. CONCLUSIONS
Based on the results of this study, the following conclusions can be drawn:
Samples of scale formation at lower pressures and temperatures, from A1 to A6, contain a higher percentage of CaCO3.
The presence of calcite (CaCO3) was confirmed by dissolution tests in a 5% (v/v) solution of acetic acid and 7% (v/v) formic acid and by XRD and XRF tests. However, samples A8, A9 and A10 exhibited low dissolution in the same solutions.
The presence of ZnS, PbS and FeS was detected in samples of scale formation at greater depths, pressure and temperature (A7, A8, A9 and A10).
X-ray fluorescence spectroscopy analyses revealed higher levels of zinc, chromium and sulfur in scale formation samples A8 and A9.
Homogeneous surfaces with calcium carbonate crystals (CaCO3) were observed by SEM in samples at depths with lower pressure and temperature (A1 to A6). Subsequent samples primarily exhibited ZnS and PbS crystals.
The presence of a high percentage of chromium in sample A9, in contact with the metal alloy of the column, may be associated to its degradation.
ACKNOWLEDGMENTS
The authors thank Petrobras for financing this study, through the "Cenpes/Incrustação" project, protocol no. 0050.0019787.06.2.
5. REFERENCES
Akin, G.W.; Lagerwerff, J.V. Calcium carbonate equilibrium in solutions open to the air. II. Enhanced solubility of CaCO3 in the presence of Mg2+ and SO4
2−. Geochimica et Cosmochimica Acta. v.29(4), p.353-360, 1965. http://dx.doi.org/10.1016/0016-7037(65)90026-8
Bolonhini, E.H. Avaliação de Pressões e Temperaturas de fluxo ao longo da coluna de produção e curva P&T versus profundidade. Relatório interno Petrobras, 2008. (In Portuguese)
Figure 18. Amplification of side 1 (250x) of sample A9, with EDS spectra highlighted.

BRAZILIAN JOURNAL OF PETROLEUM AND GAS | v. 7 n. 1 | p. 015-029 | 2013 | ISSN 1982-0593
28
Chen, T.; Neville, A.; Yuan, M. Calcium carbonate scale formation—Assessing the initial stages of precipitation and deposition. Journal of Petroleum Science and Engineering, v. 46, p.185–194, 2005. http://dx.doi.org/10.1016/j.petrol.2004.12.004
Collins, I.R.; Jordan, M.M. Occurrence, prediction, and prevention of zinc sulfide scale within Gulf Coast and North Sea high-temperature and high-salinity fields, SPE Production & Facilities, v.18(3), p. 200-209, 2003. http://dx.doi.org/10.2118/84963-PA
Dyer, S.J.; Graham G.M. The effect of temperature and pressure on oilfield scale formation. Journal of Petroleum Science and Engineering, v.35(1), p. 95-107, 2002. http://dx.doi.org/10.1016/S0920-4105(02)00217-6
Eidelwein, E. Interação rocha-fluido na fase de recuperação suplementar e seus reflexos nas propriedades das rochas, exemplos na bacia potiguar. Dissertation (Masters in Reservoir Geoengineering) - Instituto de Geociências, Universidade Estadual de Campinas - UNICAMP, São Paulo, Brazil, 1992. (In Portuguese)
Graham, G.M., Willams, H.L.; Tau, L.A.; Wennberg, K.E. Design and application of a novel ht/hp “stirred reactor” test rig to study scale formation and control, SPE International Symposium on Oilfield Chemistry, SPE 93425, 2005. http://dx.doi.org/10.2118/93425-MS
Jordan, M.M.; Sjursaether, K.; Edgerton, M.C.; Bruce, R. Inhibition of lead and zinc sulphide scale deposits formed during production from high temperature oil and condensate reservoirs. SPE Asia Pacific Oil and Gas Conference and Exhibition, SPE 64427, 2000.
Jordan, M.M.; Mackin, K.; Johnston, C.J.; Frasey, N.D. Control of hydrogen sulphide scavenger induced scale and the associated challenge of sulphide scale formation within a North Sea high temperature/high salinity fields production wells. Laboratory evaluation to field application. SPE International Symposium on Oilfield Scale, SPE 87433, 2004. http://dx.doi.org/10.2118/87433-MS
López-Sandoval, E.; Vázquez-López, C.; Zendejas-Leal, B.E.; Ramos, E.; San Martín-Martínez, Muñoz Aguirre, N.; Reguera, E. Calcium carbonate scale inhibition using the “allotropic cell” device. Desalination, v.217, p.85–92, 2007. http://dx.doi.org/10.1016/j.desal.2007.02.007
Marques, L.C.C.; Pereira, A Z.I.; Meirelles Jr, R.O.; Gonçalves, M.A.C. How Petrobras has faced oilfield scale problems: Evolution of concepts and lessons learned in Campos Basin, Brazil. International Symposium on Oilfield Scale, SPE 68327, 2001. http://dx.doi.org/10.2118/68327-MS
Mackay, E.J.; Sorbie, K.S. An evaluation of simulation techniques for modelling squeeze treatments, SPE Annual Technical Conference and Exhibition, SPE 56775, 1999.
Mackay, E.J.; Heriot-Watt, U.; Jordan, M.M.; Torabi, F. Predicting brine mixing deep within the reservoir and its impact on scale control in marginal and deepwater developments. SPE Production & Facilities, SPE 85104, v.18(3), p.210–220, 2003. http://dx.doi.org/10.2118/85104-PA
Moura, D.M.A.; Araújo, B.A.T. Machado, S.F.; Távora, M.P.; Silva, A.A.R.; Cunha, J.D.; Silva, D.R. Eficiência de solventes orgânicos apolares na extração de produtos de corrosão. In: VI Corrosion Congress Nace International Latin America Region, 2006, Proceeding of LatinCorr 2006, Fortaleza - CE, Brazil. CD-ROM. (In Portuguese)
Mucci, A.; Morse, J.W. The incorporation of Mg2+ and Sr2+ into calcite overgrowths: influences of growth rate and solution composition, Geochimica et Cosmochimica Acta. v. 47(2), p.217-233, 1983. http://dx.doi.org/10.1016/0016-7037(83)90135-7
Oliveira, R. Understanding adhesion: A means for preventing fouling, Experimental Thermal and Fluid Science. v.14(4), p.316-322, 1997. http://dx.doi.org/10.1016/S0894-1777(96)00134-3
Salman, M.; Qabazard, H.; Moshfeghian, M. Water scaling case studies in a Kuwaiti oilfield, Journal of Petroleum Science and Engineering. v.55(1), p.48–55, 2007. http://dx.doi.org/10.1016/j.petrol.2006.04.020

BRAZILIAN JOURNAL OF PETROLEUM AND GAS | v. 7 n. 1 | p. 015-029 | 2013 | ISSN 1982-0593
29
Santanna, V.C.; da Silva, D.R.; de Azevedo, F.G.; Pereira, M. R. Performance studies of a corrosion inhibitor for stainless steel in acid conditions and high temperatures. Corrosion, v.59(7), p.635-639, 2003. http://dx.doi.org/10.5006/1.3277594
Silva, C.T.S. Estudo das técnicas de interpretação de testes transientes de pressão em reservatórios de gás e condensado.. Dissertation (Masters in Reservoir Geoengineering) - Instituto de Geociências, Universidade Estadual de Campinas - UNICAMP, São Paulo, Brazil. 1993. (In Portuguese).
Tomson, M.B.; Fu, G.; Watson, M.A.;. Kan, A. T. Mechanisms of mineral scale inhibition. SPE Production & Facilities, SPE 84958, v.18(3), p.192–199, 2003. http://dx.doi.org/10.2118/84958-PA
Villela, M.J.R. Análise do comportamento da temperatura em sistemas de produção de petróleo: comparação entre completação seca e molhada. Dissertation (Master in Mechanical Engineering) – Departamento de Engenharia Mecânica, Pontifícia Universidade Católica do Rio de Janeiro – PUC, Rio de Janeiro, Brazil, 2004. (In Portuguese).
Zhang, Y.; Shaw, H.; Farquhar, R.; Dawe, R. The kinetics of carbonate scaling— application for the prediction of downhole carbonate scaling. Journal of Petroleum Science and Engineering. v.29(2), p.85-95, 2001. http://dx.doi.org/10.1016/S0920-
4105(00)00095-4