assessment of osteoporosis at the … · assessment of osteoporosis at the primary health care...
TRANSCRIPT

Report of a WHO Scientific Group
ASSESSMENT OF OSTEOPOROSIS AT THE PRIMARY
HEALTH CARE LEVEL
John A Kanis on behalf of the World Health Organization Scientific Group*
Organized by the World Health Organization Collaborating Centre for Metabolic Bone Diseases,University of Sheffield Medical School, UK and the World Health Organization
ReferenceKanis JA on behalf of the World Health Organization Scientific Group (2007)
Assessment of osteoporosis at the primary health-care level. Technical Report.World Health Organization Collaborating Centre for Metabolic Bone Diseases,
University of Sheffield, UK. 2007: Printed by the University of Sheffield.
Reference to summaryWorld Health Organization (2007) Assessment of osteoporosis at the primary health
care level. Summary Report of a WHO Scientific Group. WHO, Geneva,www.who.int/chp/topics/rheumatic/en/index.html
©World Health Organization Collaborating Centre for Metabolic Bone Diseases,University of Sheffield Medical School, UK
WHO Scientific Group Technical Report

Members, observers and secretariat
Prof Philippe BonjourHopital Cantonal Universitaire de GeneveGeneva, Switzerland
Prof Juliet CompstonUniversity of Cambridge Clinical SchoolCambridge, UK
Prof Bess Dawson-HughesTufts UniversityBoston, USA
Prof Pierre DelmasHopital Edouard HerriotLyon, France
Ms Helena JohanssonWHO Collaborating Centre for Metabolic BoneDiseasesSheffield, UK
Prof John A Kanis (Chairman)WHO Collaborating Centre for Metabolic BoneDiseasesSheffield, UK
Prof Edith LauLek Yuen Health CentreHong Kong, China
Dr Robert LindsayHelen Hayes Hospital, Rt 9WW Haverstraw, NY, USA
Prof L Joseph Melton III (Rapporteur)Mayo ClinicRochester, USA
Dr Michael R McClungOregon Osteoporosis CenterPortland, USA
Dr Anders OdenWHO Collaborating Centre for Metabolic BoneDiseases, Sheffield, UK
Dr Bruce PflegerChronic Respiratory Diseases & Arthritis (CRA)World Health Organisation, USA
Mr Ger TeilenTask Force Audern ArbeidDen Haag, The Netherlands
Dr Patricia ClarkHospital de Especialidades Bernardo SepulvedaMexico City, Mexico
Prof Cyrus CooperSouthampton General HospitalSouthampton, UK
Dr Chris De LaetInstitute for Public Health Brussels, Belgium
Prof Claus GlüerKlinikum fur Radiologische DiagnostikKiel, Germany
Prof Olof Johnell (Rapporteur)Malmo General HospitalMalmo, Sweden
Dr Nikolai KhaltaevChronic Respiratory Diseases & Arthritis (CRA),World Health OrganisationGeneva, Switzerland
Dr Mike LewieckiNew Mexico Clinical Research & OsteoporosisCenter, IncAlbuquerque, USA
Prof Paul T LipsVrije UniversityAmsterdam, The Netherlands
Dr Eugene V McCloskeyWHO Collaborating Centre for Metabolic BoneDiseases, Sheffield, UK
Prof Paul D MillerColorado Center for Bone ResearchColorado, USA
Prof Socrates E PapapoulosLeiden University Medical Center Leiden, The Netherlands
Prof Stuart SilvermanDavid Geffen School of Medicine UCLABeverly Hills, USA
Dr Natalia ToroptsovaInstitute of Rheumatology of RAMSMoscow, Russian Federation
*WHO Scientific Group onAssessment of Osteoporosis at the Primary Health Care Level
NOTE: THIS PAGE IS THE
INSIDE BACK COVER

1
Report of a WHO Scientific Group
ASSESSMENT OF OSTEOPOROSIS AT THE PRIMARY
HEALTH CARE LEVEL
John A Kanis on behalf of the World Health Organization Scientific Group*
Organized by the World Health Organization Collaborating Centre for Metabolic Bone Diseases,University of Sheffield Medical School, UK and the World Health Organization
WHO Scientific Group Technical Report

2
ReferenceKanis JA on behalf of the World Health Organization Scientific Group (2007)
Assessment of osteoporosis at the primary health-care level. Technical Report.World Health Organization Collaborating Centre for Metabolic Bone Diseases,
University of Sheffield, UK. 2007: Printed by the University of Sheffield.
Reference to summaryWorld Health Organization (2007) Assessment of osteoporosis at the primary health
care level. Summary Report of a WHO Scientific Group. WHO, Geneva,www.who.int/chp/topics/rheumatic/en/index.html
©World Health Organization Collaborating Centre for Metabolic Bone Diseases,University of Sheffield Medical School, UK

Contents
1. Introduction 61.1 Background 61.2 Risk factors 91.3 Model synthesis 91.4 Possibilities for the future 11References 12
2. Consequences of osteoporosis 132.1 Osteoporotic fractures 132.2 Incidence of osteoporotic fractures 162.3 Pattern of fractures 222.4 Mortality from osteoporotic fractures 252.5 Disability due to osteoporotic fracture 282.6 Global burden of disease 352.7 Future predictions 382.8 Costs 40References 44
3. Measurement of bone mineral and diagnosis of osteoporosis 533.1 Methods of assessment 533.2 Performance characteristics of bone mineral 59
measurements3.3 Definition of osteoporosis 603.4 Assessment of osteoporosis 69References 70
4. Overview of clinical risk factors for fracture 754.1 Risk factors related to impaired bone strength 764.2 Risk factors related to excessive bone loads 784.3 Use of clinical risk factors for fracture prediction 81References 83
5. Identification of risk factors for case finding 865.1 Levels of evidence 875.2 Meta-analyses of risk factors 905.3 Summary of effects 1215.4 Other risk factors 126References 131
6. Combining risk factors for risk assessment 1446.1 Population relative risks 1456.2 Gradients of risk 1496.3 Absolute probability of fracture 152References 166
3

7. Assessment tools for case finding 1687.1 Population screening 1687.2 Case finding 1747.3 Prediction of osteoporosis 1837.4 Prediction of fracture 1857.5 WHO fracture assessment tool (FRAX™) 1897.6 External validation 205References 208
8. Intervention thresholds 2178.1 Types of evaluation 2178.2 Selection of intervention thresholds 2188.3 Intervention thresholds in the UK 2208.4 Other socio-economic settings 2268.5 Individual patient-based scenarios 2318.6 Implications for case finding 233References 234
9. Assessment and therapeutic strategy 2379.1 Population-based prevention 2389.2 Case finding without measurement of measurement
of bone mineral density 2439.3 Case finding with measurement of bone mineral
density 2519.4 Selective use of measurement of bone mineral
density with clinical risk factors 2569.5 Resource implications for dual energy X-ray
absorptiometry 2669.6 Implementation of assessment guidance 271References 276
10. Summary and conclusions, recommendations for research 28110.1 Consequences of osteoporosis 28110.2 Bone mineral measurements and diagnosis of
osteoporosis 28210.3 Clinical risk factors for fracture 28310.4 Assessment tools for case finding 28410.5 Assessment and the formulation of therapeutic
strategy 24910.6 Recommendations for research 286
Acknowledgements 286
Annex 1 Ten-year probabilities of hip fracture (%) in the UK according to age, sex and gradient of risk 288
Available at www.shef.ac.uk/FRAX
4

Annex 2 Ten-year probabilities of hip fracture (%) in the UK population according to age, sex and risk ratio 295
Available at www.shef.ac.uk/FRAX
Annex 3 Ten-year probability of osteoporotic fracture (%) according to BMD, the number of clinical risk factors (CRF) and age. 308
Available at www.shef.ac.uk/FRAX
Annex 4 Ten-year probability of fracture (%) according to BMI, the number of clinical risk factors and age. 327
Available at www.shef.ac.uk/FRAX
Annex 5 Relationship between probability and hazard functions. 338
Available at www.shef.ac.uk/FRAX
5

1. Introduction
A WHO Scientific Group on the Assessment of Osteoporosis at the PrimaryHealth Care Level met in Brussels from 5 to 7 May 2004. The meeting wasopened by Dr N. Khaltaev, Responsible Officer for Chronic RespiratoryDiseases and Arthritis, who welcomed the participants on behalf of theDirector-General of the World Health Organization (WHO).
1.1 BackgroundFollowing the publication of the report of a WHO Study Group meeting onAssessment of fracture risk and its application to screening for postmenopausalosteoporosis, osteoporosis has been recognized as an established and well-defined disease that affects more than 75 million people in the United States,Europe and Japan (1). Osteoporosis causes more than 8.9 million fracturesannually worldwide, of which more than 4.5 million occur in the Americasand Europe (Table 1.1). The lifetime risk for a wrist, hip or vertebral fracturehas been estimated to be in the order of 30% to 40% in developed countries– in other words, very close to that for coronary heart disease. Osteoporosisis not only a major cause of fractures, it also ranks high among diseases thatcause people to become bedridden with serious complications. Thesecomplications may be life-threatening in elderly people. In the Americas andEurope osteoporotic fractures account for 2.8 million disability-adjusted lifeyears (DALYs) annually, somewhat more than accounted for by hypertensionand rheumatoid arthritis (2), but less than diabetes mellitus or chronicobstructive pulmonary diseases (Fig. 1.1). Collectively, osteoporotic fracturesaccount for approximately 1% of the DALYs attributable tononcommunicable diseases.
Fig. 1.1Burden of diseases estimated as disability-adjusted life years (DALYs) in 2002 in theAmericas and Europe combined
Source: reference 2 (data extracted from Annex Table 3, pp. 126-131) and WHO unpublished data.
6

Table 1.1Estimated number of osteoporotic fractures by site, in men and women aged 50 years ormore in 2000, by WHO region
Expected number of fractures All osteoporotic by site (thousands) fractures
ProximalWHO region Hip Spine humerus Forearm No. %
Africa 8 12 6 16 75 0.8Americas 311 214 111 248 1 406 15.7South-East Asia 221 253 121 306 1 562 17.4Europe 620 490 250 574 3 119 34.8Eastern Mediterranean 35 43 21 52 261 2.9Western Pacifica 432 405 197 464 2 536 28.6
Total 1 672 1 416 706 1 660 8 959 100
Source: O Johnell & J A Kanis, unpublished data, 2006.aIncludes Australia, China, Japan, New Zealand and the Republic of Korea.
Because of the morbid consequences of osteoporosis, the prevention of thisdisease and its associated fractures is considered essential to the maintenanceof health, quality of life, and independence in the elderly population. In May1998, the Fifty-first World Health Assembly, having considered The worldhealth report 1997: conquering suffering, enriching humanity (3), whichdescribed the high rates of mortality, morbidity and disability from majornoncommunicable diseases – including osteoporosis, adopted a resolutionrequesting the Director-General to formulate a global strategy for theprevention and control of noncommunicable diseases (4). A scientific groupmeeting subsequently reported on the prevention and management ofosteoporosis (5). The report of the present Scientific Group on Assessmentof Osteoporosis at the Primary Health Care Level is a further step in thedevelopment of cohesive strategies for tackling osteoporosis in response tothe World Health Assembly resolution (4). It is expected that the report ofthis meeting will lead to improvements in the assessment of osteoporosispatients throughout the world, and make a valuable contribution to thedevelopment of effective global strategies for the control of this importantdisease.
Osteoporosis has been operationally defined on the basis of bone mineraldensity (BMD) assessment. According to the WHO criteria, osteoporosis isdefined as a BMD that lies 2.5 standard deviations or more below the averagevalue for young healthy women (a T-score of <-2.5 SD) (1,6). This criterionhas been widely accepted and, in many Member States, provides both adiagnostic and intervention threshold. The most widely validated techniqueto measure BMD is dual energy X-ray absorptiometry (DXA), anddiagnostic criteria based on the T-score for BMD are a recommended entrycriterion for the development of pharmaceutical interventions inosteoporosis (7–9). Since therapeutic trials in osteoporosis usually require alow BMD value as an entry criterion, drugs are licensed for use in patients
7

below a given BMD threshold. The implication is that BMD should beassessed before treatment is considered.
There are, however, several problems with the use of BMD tests alone. Inmany Member States, BMD tests using DXA are not widely available, or areused predominantly for research, in part because of the high capital costs ofDXA. In other Member States, BMD tests are not reimbursed despite theavailability and approval of effective drug treatments. For this reason, manyother techniques for measuring bone mineral have been developed, whichhave lower costs and are more portable. The experience with several of theseis limited, however, and there is no clear guidance as to how these should beused with or without DXA, either for the diagnosis of osteoporosis or for theassessment of fracture risk. This report updates criteria for the diagnosis ofosteoporosis in the light of these developments.
A second major problem with bone mineral measurement is that these testsalone are not optimal for the detection of individuals at high risk of fracture.Over most reasonable assumptions, the tests have high specificity but lowsensitivity (1). In other words, the risk of fracture is very high whenosteoporosis is present, but by no means negligible when BMD is normal.Indeed, the majority of osteoporotic fractures will occur in individuals witha negative test. Thus, the potential impact of widespread testing of BMD onthe burden of fractures is less than optimal, and this is one of the reasons whymany agencies do not recommend population screening of BMD (1,10,11).Current recommendations for the assessment of patients also have severaldifficulties. None is suitable for international use. Those produced bynongovernmental organizations are either conservative, e.g. the EuropeanFoundation for Osteoporosis guidelines (12), or border on a populationscreening strategy, e.g. National Osteoporosis Foundation of the USA(13–15). Both approaches rely critically on testing of BMD, and there is littleguidance for Member States without such facilities.
In the past decade, a great deal of research has taken place to identify factorsother than BMD that contribute to fracture risk. Examples include age, sex,the degree of bone turnover, a prior fracture, a family history of fracture, andlifestyle risk factors such as physical inactivity and smoking. Some of theserisk factors are partially or wholly independent of BMD. Independent riskfactors used with BMD could, therefore, enhance the information providedby BMD alone. Conversely, some strong BMD-dependent risk factors can, inprinciple, be used for fracture risk assessment in the absence of BMD tests.For this reason, the consideration of well-validated risk factors, with orwithout BMD, is likely to improve fracture prognostication and the selectionof individuals at high risk for treatment.
Against this background, WHO approved a programme of work within theterms of reference of the WHO Collaborating Centre at Sheffield. Theproject also had the support of the International Osteoporosis Foundation,
8

the National Osteoporosis Foundation (USA), the International Society forClinical Densitometry and the American Society for Bone and MineralResearch. A position paper on the general approach was endorsed by theInternational Osteoporosis Foundation and the United States NationalOsteoporosis Foundation (16). The aims of the programme were to identifyand validate clinical risk factors for use in fracture risk assessment on aninternational basis, either alone, or in combination with bone mineral tests.A further aim was to develop algorithms for risk assessment that weresufficiently flexible to be used in the context of many primary care settings,including those where BMD testing was not readily available.
1.2 Risk factorsRisk factors for any osteoporotic fracture and for hip fracture were identifiedfrom 12 prospectively studied population-based cohorts in many geographicterritories using the primary databases. The cohorts included the EuropeanVertebral Osteoporosis Study (Pan-European), the Dubbo Osteoporosisstudy (Australia), the Canadian Multicentre Osteoporosis study (Canada),Rochester (USA), Sheffield (UK), Rotterdam (Netherlands), Kuopio(Finland), Hiroshima (Japan), the OFELY (L’os des femmes de Lyon) cohortfrom Lyon and the multicentre EPIDOS (Epidémiologie de l’osteoporose)cohort from France, and two cohorts from Gothenburg (Sweden). Thecohort participants had a baseline assessment documenting clinical riskfactors for fracture. Approximately 75% also had BMD measured at the hip.The follow-up was approximately 250 000 patient–years in 60 000 men andwomen during which more than 5000 fractures were recorded.
1.3 Model synthesisWork over the past few years has clarified many of the features necessary forimproved patient assessment. A central component is that the diagnosticcriterion for osteoporosis using the WHO definition is not always anappropriate threshold to identify patients at high fracture risk for treatment.The use of the T-score alone is inappropriate since age is as great a risk factoras BMD. Rather, thresholds should be based on a more global evaluation ofrisk, and in particular on that risk which is amenable to an intervention (i.e.modifiable risk). There are problems with the use of relative risks, and thesehave contributed to the view, now increasingly accepted, that the risk ofpatients for fracture should be determined according to absolute probabilityof fracture. A 10-year probability of fracture is preferred to lifetime risksbecause:
• Assumptions on future mortality introduce increasing uncertainties for risk assessment beyond 10 years.
• Treatments are not generally given feasibly over a lifetime.
• The long-term prognostic value of some risk factors may decrease with time.
• The 10-year interval accommodates clinical trial experience of
9

interventions (generally 3–5 years) and the reversal phase (offset time) when treatment is stopped.
Models have been created that are based on the hazard functions for fracturesand for death in Sweden, which are used to compute the long-termprobability of different fracture types. The models accommodate risk factorssuch as age, sex, BMD at the hip (femoral neck) and clinical risk factors thathave proven international validity.
The first operational model was based on Sweden because of the robustnessand extent of the epidemiological data available in that country. Fracturerates, however, differ markedly in different regions of the world. Even withinEurope, the risk of hip fracture varies more than 10-fold between countries(17,18), and there is comparable variation in the rate of hospitalization forvertebral fracture (19). The lowest absolute risk of hip fracture is found inthe developing world, in part because of the lower fracture risk, but alsobecause of lower life expectancy.
Notwithstanding, the general pattern of osteoporotic fracture is broadlysimilar across nations. Since extensive epidemiological data exist worldwidefor hip fracture, the methodology has been extended to quantify osteoporoticfracture probabilities where hip fracture rates alone are available. Thispermits probabilities of fracture to be quantified in many regions of theworld. Separate models have been constructed for countries with very highrisk (e.g. Scandinavia), high risk (e.g. western Europe), moderate risk (e.g.southern Europe) and low risk (e.g. the developing countries). The modelshave been validated in independent cohorts that did not participate in themodel construct.
The choice of risk factors examined was governed by availability of data, andthe ease with which the risk factors might be used in primary care. Potentialrisk factors were examined by a series of meta-analyses using Poisson modelsfor each risk factor in each of the study cohorts and for each sex. Covariatesexamined included age, sex, BMD, time since assessment and the covariateitself, e.g. to determine whether BMD or body mass index (BMI) are equallypredictive for fracture at different levels of BMD or BMI. Results from thedifferent studies were merged using the weighted β-coefficients.
Candidate risk factors included age, sex, glucocorticoid use, secondaryosteoporosis, family history, prior fragility fracture, low BMI, smoking,excess alcohol consumption, contraceptive pills, age at menopause, age atmenarche, hysterectomy, diabetes, consumption of milk and femoral neckBMD. Risk factors for falling were not considered, since there is some doubtwhether the risk identified would be modified by a pharmaceuticalintervention. Risk factors recommended for use were selected on the basis oftheir international validity and evidence that the identified risk was likely tobe modified by subsequent intervention (modifiable risk). Modifiable risk
10

was validated from clinical trials (BMD, prior fracture, glucocorticoid use,secondary osteoporosis), or partially validated by excluding interactions ofrisk factors on therapeutic efficacy in large randomized intervention studies(e.g. smoking, family history, BMI).
A further step was then to merge these meta-analyses of each risk factor sothat account could be taken of the interdependence of the risk factorschosen, and therefore the risk provided by any combination of risk factors,with and without the additional use of BMD.
Assessment algorithms (FRAX™) have been developed for the prediction ofhip fracture and other osteoporotic fractures, based on clinical risk factorsalone, or the combination of clinical risk factors plus BMD, available atwww.shef.ac.uk/FRAX The FRAX algorithms are suitable for men andwomen. Guidance is given on the economic use of BMD where resources forBMD exist but must be used sparingly.
Given that the probability of fracture can be quantified, information isrequired on the level of risk that is sufficiently high to merit intervention.This is a complex issue that depends on the wealth of Member States, theplace of osteoporosis in the health-care agenda and the proportion of grossdomestic product spent on health care, as well as on fracture risk. Againstthis background, intervention thresholds will vary markedly around theworld. Examples of intervention thresholds are provided, based on cost-effectiveness analyses which can be tailored to national requirements. Therewill be some Member States where supportive programmes only areappropriate, such as attention to adequate physical activity, nutrition and theavoidance of smoking. In other Member States, case-finding can be based onthe use of clinical risk factors alone. In many developed countries, the clinicalrisk factors can be used with the selective use of BMD. There will besegments of society or countries where BMD will always be used. Theguidance in this report accommodates these very different approaches tocase-finding.
1.4 Possibilities for the futureUntil recently, osteoporosis was an under-recognized disease and consideredto be an inevitable consequence of ageing. Perceptions have changed sinceepidemiological studies have highlighted the high burden of the disease andits costs to society and health care agencies, as well as the adverse effects onmillions of patients worldwide. The past 15 years have seen majorimprovements in diagnostic technology and assessment facilities; it is nowpossible to detect the disease before fractures occur. This has been associatedwith the development of treatments of proven efficacy (4).
The scope of this report is to direct attention away from the sole use of BMDto determine who will receive treatment and to shift towards the assessmentof absolute fracture risk, whether this be determined by BMD testing or
11

other validated instruments. The use of clinical risk factors together withBMD provides a mechanism for the effective and efficient delivery of healthcare to individuals at high risk and the avoidance of unnecessary treatmentto others. The application of this approach may be expected to reduce,though not eliminate, the burden of osteoporotic fractures.
Against this background, WHO has considered osteoporosis to be ofincreasing importance. The Director-General of WHO has stated that“WHO sees the need for a global strategy for prevention and control ofosteoporosis focusing on three major functions; prevention, managementand surveillance” (20). In order to amplify the existing and past activities ofWHO in osteoporosis, the object of this Scientific Group meeting was toreview the scientific basis for the identification of patients at high or low riskof osteoporotic fracture with or without the use of BMD. The aim was tooptimize the detection of high risk patients so that therapy can be betterdirected. The meeting did not consider specific pharmacologicalinterventions. Rather, the approach to be developed was a case-findingstrategy where risk factors are identified to quantify absolute risks.
References1. Assessment of fracture risk and its application to screening for postmenopausal
osteoporosis. Report of a WHO Study Group. Geneva, World Health Organization,1994 (WHO Technical Report Series, No. 843).
2. The world health report 2004: changing history. Geneva, World Health Organization,2004.
3. The world health report 1997: conquering suffering, enriching humanity. Geneva, WorldHealth Organization, 1997.
4. Resolution WHA51.18. Noncommunicable disease prevention and control. In:Fifty-first World Health Assembly, Geneva, 11 –16 May 1998. Volume 1. Resolutionsand decisions, annexes. Geneva, World Health Organization, 1998(WHA51/1998/REC/1).
5. Prevention and management of osteoporosis. Report of a WHO Scientific Group.Geneva, World Health Organization, 2003 (WHO Technical Report Series, No.921).
6. Kanis JA et al. The diagnosis of osteoporosis. Journal of Bone and MineralResearch, 1994, 9: 1137–1141.
7. Guidelines for preclinical and clinical evaluation of agents used in the prevention ortreatment of postmenopausal osteoporosis. Rockville, MD, Food and DrugAdministration, Division of Metabolism and Endocrine Drug Products, 1994.
8. Committee for Proprietary Medicinal Products. Note for guidance onpostmenopausal osteoporosis in women. European Agency for the Evaluation ofMedicinal Products, London, 2001 (CPMP/EWP/552/95 rev. 1).
9. Guidelines for preclinical evaluation and clinical trials in osteoporosis. Geneva, WorldHealth Organization, 1998.
10. Report on osteoporosis in the European Community. Strasbourg, EuropeanCommunity, 1998.
12

11. Osteoporosis: clinical guidelines for the prevention and treatment. London, RoyalCollege of Physicians, 1999.
12. Kanis JA et al. Guidelines for diagnosis and management of osteoporosis.Osteoporosis International, 1997, 7:390–406.
13. National Osteoporosis Foundation. Physicians guide to prevention and treatmentof osteoporosis. Excerpta Medica, 1998.
14. Nelson HD et al. Screening for postmenopausal osteoporosis: a review of theevidence for the U.S. Preventive Services Task Force. Annals of Internal Medicine,2002, 137:529–541 and 526–528.
15. Nelson HD et al. Osteoporosis in postmenopausal women: diagnosis and monitoring.Evidence Report / Technology Assessment No. 28 (Prepared by the OregonHealth and Science University Evidence-based Practice Center under contractNo. 290-97-0018). Rockville, MD, Agency for Healthcare Research and Quality,2002(AHRQ Publication No. 01-EO32).
16. Kanis JA et al. A new approach to the development of assessment guidelines forosteoporosis. Osteoporosis International, 2002, 13: 527–536.
17. Elffors L et al. The variable incidence of hip fracture in southern Europe: theMEDOS study. Osteoporosis International, 1994, 4: 253–263.
18. Johnell O et al. The apparent incidence of hip fracture in Europe: a study ofnational register sources. Osteoporosis International, 1992, 2: 298–302.
19. Johnell O, Gullberg B, Kanis JA. The hospital burden of vertebral fracture inEurope: a study of national register sources. Osteoporosis International, 1997, 7:138–144.
20. Genant HK et al. Interim report and recommendations of the World HealthOrganization Task Force for Osteoporosis. Osteoporosis International, 1999, 10:259–264.
2. Consequences of osteoporosis
Age-related bone loss appears to be asymptomatic, and the morbidity ofosteoporosis is secondary to the fractures that occur.
2.1 Osteoporotic fractures
The definition of an osteoporotic fracture is not straightforward. Irrespectiveof the methods used, opinions differ concerning the inclusion or exclusion ofdifferent sites of fracture. A widely adopted approach is to consider fracturesfrom low energy trauma as being osteoporotic. “Low energy” may variouslybe defined as a fall from a standing height or less, or trauma that in a healthyindividual would not give rise to fracture. The attribution can either be doneby coding fractures or by expert opinion, an approach that has been used inSwitzerland (1) and the United States of America (2,3). Thischaracterization of low trauma indicates that the vast majority of hip andforearm fractures are low energy injuries. At the age of 50 years,approximately 75% of people hospitalized for vertebral fractures havefractures that are attributable to low energy injuries, increasing to 100% by
13

the age of 90 years (4). The consideration of low energy has the merit ofrecognizing the multifactorial causation of fracture, but osteoporoticindividuals are more likely to fracture than their normal counterpartsfollowing high energy injuries (5). As might be expected, there is also animperfect concordance between low energy fractures and those associatedwith reductions in BMD (6,7).
The rising incidence of fractures with age does not provide direct evidence forosteoporosis, since a rising incidence of falls could also be a cause. Bycontrast, a lack of increasing incidence with age is reasonable presumptiveevidence that a fracture type is unlikely to be osteoporosis-related. Anindirect arbiter of an osteoporotic fracture is the finding of a strongassociation between the fracture and the risk of classical osteoporoticfractures at other sites. Vertebral fractures, for example, are a very strong riskfactor for subsequent hip and vertebral fracture (8–10), whereas forearmfractures predict future spine and hip fractures (11).
The approach used here was to characterize fracture sites as osteoporoticwhen they are associated with low bone mass and their incidence rises withage after the age of 50 years (12). The most common fractures defined in thisway are those at the hip, spine and forearm, but many other fractures afterthe age of 50 years are related at least in part to low BMD and should beregarded as osteoporotic (6,13,14). These include fractures of the humerus,ribs, tibia (in women, but not including ankle fractures), pelvis and otherfemoral fractures. Their neglect underestimates the burden of osteoporosis,particularly in younger individuals. Under this schema, the fracture sites thatwould be excluded include those at the ankle, hands and feet, including thedigits, skull and face, and kneecap.
2.1.1 Hip fracture
Hip fracture is the most serious osteoporotic fracture. Most hip fracturesfollow a fall from the standing position, although they sometimes occurspontaneously (13). The risk of falling increases with age and is somewhathigher in elderly women than in elderly men. About one third of elderlyindividuals fall annually, and 5% will sustain a fracture and 1% will suffer ahip fracture (15). Hip fracture is painful and nearly always necessitateshospitalization.
A hip fracture is a fracture of the proximal femur, either through the femoralcervix (sub-capital or trans-cervical: intra-capsular fracture) or through thetrochanteric region (intra-trochanteric: extra-capsular fracture). The two hipfracture types, cervical or trochanteric, have a somewhat different naturalhistory and treatment. Trochanteric fractures are more characteristicallyosteoporotic, and the increase in age-specific and sex-specific risks for hipfracture is greater for trochanteric than for cervical fractures (16).Trochanteric fractures are also more commonly associated with a prior
14

fragility fracture. In many countries both fracture types occur with equalfrequency, though the average age of patients with trochanteric fractures isapproximately 5 years older than for cervical fractures.
Displaced cervical fractures have a high incidence of malunion andosteonecrosis following internal fixation, and the prognosis is improved withhip replacement. Trochanteric hip fractures appear to heal normally afteradequate surgical management. For both fracture types, there is a high degreeof morbidity and appreciable mortality that depends in part on age, thetreatment given and the associated morbidity (17). Both morbidity andmortality are greater with trochanteric than with cervical fractures (18).Complications may arise because of immobility. The outcome is much poorerwhere surgery is delayed for more than 3 days. Up to 20% of patients die inthe first year following hip fracture, mostly as a result of serious underlyingmedical conditions (19), and less than half of survivors regain the level offunction that they had prior to the hip fracture (20).
2.1.2 Vertebral fracture
Vertebral fracture has been the most difficult osteoporosis-related fracture todefine. The problem arises in part because the diagnosis is made on a changein the shape of the vertebral body. The deformities that result fromosteoporotic fracture are usually classified as a crush fracture (involvingcompression of the entire vertebral body), a wedge fracture (in which there isanterior height loss), and biconcavity (where there is relative maintenance ofthe anterior and posterior heights with central compression of the end-plateregions). A number of morphometric approaches have been developed toquantify the shape of the vertebral body, and this has helped in defining theprevalence and incidence of vertebral fracture. A widely used clinical systemis to classify vertebral fractures as mild (20%–25% height loss), moderate(>25%–40% height loss), or severe (>40% height loss).
A further problem in describing the epidemiology of vertebral fracture is thatnot all fractures come to clinical attention (21–23). In the United States,about one in three vertebral deformities reaches immediate clinical attentionthrough either back pain, height loss or other functional impairment (24).Estimates for the proportion of vertebral deformities that reach primary careattention vary, however, in different countries (21,24,25). In Sweden,approximately 23% of vertebral deformities come to clinical attention inwomen, and a somewhat higher proportion in men (26) (Table 2.1). A similarproportion has been observed in the placebo wing of multinationalintervention studies (27).
15

Table 2.1 Incidence of all morphometric and clinically evident vertebral fractures and the firstmorphometric and clinical fracture (per 100 000 per year) by age and site in men andwomen
Any fracture First fracture Ratio (%)
Morphometric Clinical Morphometric Clinical Clinical/morphometric
Age range(years) Men Women Men Women Men Women Men Women Men Women
50–54 365 874 153 190 244 577 81 104 33 1955–59 462 1164 193 253 311 762 111 148 36 2060–64 592 1562 248 339 392 1021 155 215 39 2165–69 767 2115 322 459 511 1376 215 303 42 2270–74 1011 2891 424 628 666 1880 296 422 44 2375–79 1348 3986 566 865 888 2583 407 599 46 2380–84 1820 5544 744 1204 1191 3574 562 844 47 2485–89 2485 7776 1043 1688 1613 4995 777 1184 48 24
Source: reference 26 (Table 2).
Falls account for only about one third of new clinical vertebral fractures, andmost are associated instead with other activities such as lifting or changingposition. The vast majority of vertebral fractures are a result of moderate orminimal trauma.
2.1.3 Distal forearm fracture
The most common distal forearm fracture is Colles fracture. This fracture lieswithin 2.5 cm of the wrist joint margin and is associated with dorsalangulation and displacement of the distal fragment of the radius. It may beaccompanied by a fracture of the ulna styloid process. A Smith fractureresulting in ventral angulation usually follows a forcible flexion injury to thewrist and is relatively uncommon in the elderly.
The cause of fracture is usually a fall on the outstretched hand (28).Although fractures of the wrist cause less morbidity than hip fractures, arerarely fatal, and seldom require hospitalization, the consequences are oftenunderestimated. Fractures are painful, usually require one or morereductions and need 4–6 weeks in plaster. Approximately 1% of patients witha forearm fracture become dependent as a result of the fracture (29), butnearly half report only fair or poor functional outcome at 6 months (30).There is a high incidence of algodystrophy which gives rise to pain,tenderness, stiffness and swelling of the hand, and more rarely to frozenshoulder syndrome (31). Moreover, the risk of other osteoporotic fracturesin later life is much increased after Colles fracture (32).
2.2 Incidence of osteoporotic fractures
Despite a large number of studies that have examined the incidence offractures by age and sex, our knowledge of the incidence and the pattern offractures worldwide is incomplete.
16

2.2.1 Hip fracture
The incidence of hip fracture has been characterized in just over 30 countriesworldwide (33). In general, incidence rates for hip fracture increaseexponentially with age in both men and women. In Scandinavia and theUnited States, the annual incidence rises from about 0.4 per 1000 in womenat the age of 50 years, reaching about 68 per 1000 at the age of 85 years andover. Rates for white men at any age are about half this figure (13). Overall,approximately 90% of all hip fractures occur among people aged 50 yearsand over, and 80% occur in women. The reason for the very high frequencyin women is attributable to their longevity compared to men. The average ageat which hip fractures occur is about 80 years in industrialized countries, butis less in countries with lower life expectancies. Age-adjusted and sex-adjusted hip fracture incidence rates are generally higher in white than inblack or Asian populations (34), although urbanization has led to higher hipfracture rates in Asia and certain parts of Africa. Furthermore, thepronounced female preponderance observed in white populations is not seenin countries with low fracture rates, e.g. among blacks or Asians, in whom themale and female rates are broadly similar.
Hip fractures also show a seasonal variation in incidence, being morefrequent in the winter months in temperate climates. This is not, however, aresult of slipping on snow or ice since hip fractures most commonly occurindoors, suggesting a contribution of vitamin D nutrition in theirpathophysiology.
There is a remarkable heterogeneity in the age-adjusted and sex-adjustedincidence for hip fracture in various regions of the world (13,34–37). Thehighest incidence rates have been observed in northern Europe and theUnited States. Even within Europe, there is considerable variation in hipfracture incidence. Thus, rates vary approximately 10-fold between Swedenand Turkey (36,37). In the United States, the higher hip fracture rates amongCaucasians than among people of African descent may be in part explicableon the basis of differences in BMD, but differences in BMD do not explainthe lower rates in Hispanics and Asians (38,39). Differences in BMD mayexplain differences in fracture risk between men and women within a country.They may also explain regional differences between urban and rural areas(40,41). Differences in BMD worldwide are too small, however, to accountfor the very large variations in age-specific and sex-specific incidence (seesection 3). Indeed in Asia, hip fracture rates are lower than in developedcountries, despite lower values for BMD (42). These variations imply animportant role of environmental factors in the incidence of hip fractures.Ecological studies do not suggest important roles for body weight, cigarettesmoking, alcohol, or calcium nutrition (36,43). Nonetheless, the observationthat differences in incidence between countries are much larger than thoseobserved between men and women suggests that factors other than oestrogendeficiency play a crucial role. A plausible hypothesis is differences in the risk
17

of falls (44) and the force of impact. Asians, for example, appear to fall lessthan Caucasian populations (45) and their shorter stature provides a lowerfall energy. The identification of these factors is an important area for furtherresearch.
2.2.2 Spine fracture
Epidemiological information on vertebral fractures is limited by the lack of auniversally accepted definition of what constitutes a vertebral deformity, andbecause a substantial proportion of vertebral deformities are clinically silentor not attributable to osteoporosis. Scheuermann disease (osteochondritis)and vertebral osteoarthritis are common disorders that give rise todeformities not attributable to osteoporosis. The problem is compounded inthat radiologically evident fractures are commonly not reported (46).
Until recently, most information on spine fracture was from studies ofprevalence. Radiographic surveys indicate that 19%–26% of postmenopausalwhite women have a morphometric vertebral fracture (13,47–49). Most suchfractures involve the mid-thoracic vertebra or the thoracolumbar junction.They are as frequent in Asians and native Mexicans as in white women(50–52), but are less common in African American and Hispanicpopulations (53,54).
It is of interest that the prevalence of morphometric vertebral deformities inmen is as great as it is in women up to the age of 60 years (49), possiblybecause some deformities in men are not related to fractures. In addition,severe trauma may account for over a third of clinically detected vertebralfractures in men, but only about 10% of those in women. It is also notablethat the international variation in the prevalence of morphometric vertebralfractures is much less than that for hip fracture. Rates appear to vary 2-foldto 3-fold in different countries (42) (Table 2.2).
Table 2.2 Prevalence by age of vertebral fracture assessed by vertebral morphometry among womenfrom different regions
Age range(years) Beijing Europe Hawaii Hiroshima Minnesota Taiwan
50–54 4.9 11.5 0 5.4 4.7 4.555–59 - 14.6 0 4.1 5.8 4.860–64 16.2 16.8 10 4.9 6.3 6.765–69 - 23.5 6.1 8.2 13.2 13.970–74 19.0 27.2 14.8 24.8 15.0 20.775–79 - 34.8 25.0 36.8 22.2 24.380–84 36.6 - 26.3 42.9 50.8 29.7>85 - - - 25.0 50.8 -
Source: reference 42 (Table 3).
18

Incidence rates can be expressed as the incidence of vertebral deformity(morphometric fractures) or the incidence of clinically overt fractures(clinical vertebral fractures). Incidence rates for morphometric vertebralfractures have been obtained through the European Prospective OsteoporosisStudy, representing many European countries. The available data indicatethat the incidence of vertebral morphometric deformities, like that of otherosteoporotic fractures, is greater in women than in men, and rises with age.The age-related increase is less steep than that of hip fractures and thevariation between countries is less marked (55). In the European ProspectiveOsteoporosis Study, men and women aged 50–79 years were enrolled frompopulation registers in 19 European countries, and the incidence of newvertebral deformities was estimated from radiographs at baseline and atfollow-up 4 years later. Overall, age-adjusted and sex-adjusted incidence ratesfor vertebral morphometric fractures were 1% per year among women and0.6% per year among men (55). Similar incidence estimates have beenreported from the Study of Osteoporotic Fractures in the USA (55), wherespinal radiographs have been obtained in some 5000 women. Other sourcesof data for vertebral fracture incidence have included the Rotterdam study,and studies from Sweden (see Table 2.1), Japan and Mexico (26,52,56–58).
The age-adjusted incidence of clinically diagnosed vertebral fractures hasbeen estimated in Sweden. (see Table 2.3), the northern United States, andfrom the placebo arm of multinational studies of intervention (21,26,27).Between the ages of 50 and 80 years, the incidence rises approximately 10-fold in women but only 5-fold in men (26). The incidence of clinically evidentvertebral fractures is 20%–40% that of morphometric fractures. For whitewomen aged 50 years and over this has been estimated at 5.3 per 1000person–years with comparable male rates being about half this figure.
The incidence of vertebral fractures can also be studied from hospitaldischarge rates. As calculated from register-based studies, the incidence ofhospitalized vertebral fracture is substantially smaller than estimates ofclinical vertebral fracture (22). There is, however, a marked variation in theestimated number of people with vertebral fractures who are hospitalizedbetween different countries, with a range from 2% to 10% (17,22,25,59). Ina study of hospitalization discharge rates in Europe, there was a strikinggeographic correlation among countries between the incidence ofhospitalization for vertebral fractures and for those of the hip (22).
2.2.3 Forearm fracture
Forearm fractures display a different pattern of incidence from that of hip orspine fractures. In many countries, rates increase linearly in white womenbetween the ages of 40 and 65 years and then stabilize (13). In othercountries, Sweden for example, incidence rises progressively with age.Forearm fractures are much less frequent in men; the incidence is commonlyconstant between the ages of 20 and 80 years, and where this rises, it does so
19

at a much slower rate than in women (13). The reason for the plateau infemale incidence in some countries is not known, but may relate to a changein the pattern of falling with advancing age (60). As in the case of hipfractures, the majority of wrist fractures occur in women and around halfoccur in women aged 65 years and over. Forearm fractures are less frequentin African American (61,62) and Japanese populations (63), but there is stilla substantial excess female risk. In Africa and South-East Asia, however,distal forearm fractures are even less common and rates for women are littlemore than those for men (64).
2.2.4 All fractures
A majority of fractures in patients aged 50 years or more is attributable toosteoporosis. As mentioned, attempts to classify fractures as being a result ofosteoporosis are imperfect. Fractures considered in this report to beosteoporotic are shown in Table 2.3 (12). The incidence rates of proximalhumeral, pelvic and proximal tibial fractures rise steeply with age and aregreater among women than among men. At the age of 50 years, rib, vertebraland forearm fractures are the most commonly found fractures in men,whereas in women the most common fractures comprise distal forearm,vertebral, rib and proximal humeral fractures. Over the age of 85 years, hipfracture is the most frequent fracture among men and women, but stillaccounts for only approximately one third of all osteoporotic fractures (Table2.4).
20

Table 2.3 Incidence of osteoporotic fractures (per 100 000 population per year) by age and site in menand women from Sweden
Site of fracture Age range (years)
50–54 55–59 60–64 65–69 70–74 75–79 80–84 85–89MenVertebra 195 119 226 242 499 619 933 1 194Ribs 324 750 399 790 855 805 3 072 3 007Pelvis 12 16 21 31 51 80 179 288Humeral shaft 22 10 20 31 69 60 78 168Proximal humerus 65 31 60 92 207 179 235 505Clavicle, scapula, sternum 116 139 89 216 198 81 659 859Hip 42 68 134 274 495 940 1 923 3 241Other femoral fractures 15 18 24 41 43 51 88 128Tibia and fibulaa - - - - - - - -Distal forearm 101 151 140 282 89 175 259 323Total 892 1 302 1 113 1 999 2 506 2 990 7 430 9 713
WomenVertebra 161 158 303 439 778 1 111 1 163 1 641Ribs 126 162 167 340 433 903 1 400 3 194Pelvis 9 16 29 47 125 203 436 698Humeral shaft 41 42 42 117 128 210 195 373Proximal humerus 124 127 126 352 384 629 585 1 120Clavicle, scapula, sternum 77 97 42 145 121 362 415 356Hip 41 91 181 387 817 1 689 3 364 5 183Other femoral fractures 11 17 36 52 89 150 239 404Tibia and fibula 60 79 88 98 106 145 146 207Distal forearm 417 456 568 691 904 1 032 1 208 1 387Total 1 067 1 245 1 582 2 668 3 885 6 434 9 151 14 563
Source: reference 12 (Table 2).aExcluded in men.
21

Table 2.4 Proportion (%) of osteoporotic fractures at different sites in men and women from Swedenby age
Site of fracture Age range (years)
50–54 55–59 60–64 65–69 70–74 75–79 80–84 85–89MenVertebra 21.9 9.1 20.3 12.1 19.9 20.7 12.6 12.3Ribs 36.3 57.6 35.8 39.5 34.1 26.9 41.3 31.0Pelvis 1.3 1.2 1.9 1.6 2.0 2.7 2.4 3.0Humeral shaft 2.5 0.8 1.8 1.6 2.8 2.0 1.0 1.7Proximal humerus 7.3 2.4 5.4 4.6 8.2 6.0 3.2 5.1Clavicle, scapula, sternum 13.0 10.7 8.0 10.8 7.9 8.7 8.9 8.8Hip 4.7 5.2 12.0 13.7 19.8 31.4 25.9 33.3Other femoral 1.7 1.4 2.1 2.1 1.7 1.7 1.2 1.3Tibia and fibulaa - - - - - - - -Distal forearm 11.3 11.6 12.6 14.1 3.6 5.9 3.5 3.3
WomenVertebra 15.1 12.7 19.2 16.4 20.0 17.3 12.7 11.3Ribs 11.8 13.0 10.6 12.7 11.1 14.0 15.3 21.9Pelvis 0.8 1.3 1.8 1.8 3.2 3.2 4.8 4.8Humeral shaft 3.8 3.4 2.7 4.4 3.3 3.3 2.1 2.6Proximal humerus 11.6 10.2 8.0 13.2 9.9 9.8 6.4 7.7Clavicle, scapula, sternum 7.2 7.8 2.7 5.4 3.1 5.6 4.5 2.4Hip 3.8 7.3 11.4 14.5 21.0 26.3 36.8 35.6Other femoral 1.0 1.4 2.3 1.9 2.3 2.3 2.6 2.8Tibia and fibula 5.6 6.3 5.6 3.7 2.7 2.3 1.6 1.4Distal forearm 39.1 36.6 35.9 25.9 23.2 16.0 13.2 9.5
Source: reference 12 (Table 3).aExcluded in men.
2.3 Pattern of fractures
The available information suggests that the pattern of fractures is similar inAustralia, Sweden, the United Kingdom and the United States, despitedifferences in the absolute incidence (1,38,65,66). For example, the annualincidence of forearm, proximal humeral and hip fracture in women aged80–84 years is 5157 per 100 000, 2558 per 100 000, and 3206 per 100 000 inSweden, the United Kingdom and the United States, respectively (12,38,65),but the pattern of these fractures with age is remarkably similar (Fig. 2.1).The relationship between the incidence of hip, vertebral and forearm fractureis also similar between these series and in Australia (66). Within the USA,the pattern appears to be similar among blacks and whites. For example,among white women aged 65–79 years, the relative frequency of hip, distalforearm and proximal humerus fractures is 43%, 38% and 19%, respectively.For black women, the distribution is 45%, 36% and 18% (61).
22

Fig. 2.1Pattern of common osteoporotic fractures expressed as a proportion (%) of the total inSweden, the United Kingdom and the United States
Source: reference 12 (Fig. 3).
This commonality of pattern is supported by register studies which indicatethat in those regions where hip fracture rates are high, so too is the risk ofColles’ fracture and vertebral fractures that require hospital admission(13,22). Studies of the incidence of morphometric vertebral fractures,however, indicate less commonality.
Since the pattern of osteoporotic fractures appears to be broadly similar inthe developed countries, this permits the size of the problem of osteoporosisto be determined in those countries where the epidemiological information isnot complete. For example, between the ages of 50 and 54 years, fractures ofthe hip account for 4.7% of all osteoporotic fractures in men and for 3.8% inwomen. Thus, osteoporotic fractures account in this age range for 21 times or26 times the number of hip fractures in men and women, respectively. Suchcalculations have been used to estimate the burden of osteoporotic fractures(see later in this section).
The societal burden of osteoporosis is highest in North America and inEuropean countries, particularly in Scandinavia (22,35,37). The risk ofosteoporotic fractures is lower in other regions such as Africa and Asia(67,68). Osteoporotic fractures are also less common in men. The reasonsrelate to the higher skeletal mass in men than in women at the time of skeletalmaturity (69) and the slower rates of bone loss in men compared to women.In addition, men live several years less than women, so that they are exposedto lower BMD for a shorter period of their lifetime.
23

Lifetime risk depends both on fracture incidence and life expectancy. At theage of 50 years, the lifetime risk of hip fracture in women in Scandinaviaexceeds 20% and is nearly as high in North America (70) (Table 2.5). In theUSA, the lifetime risk of a hip, spine or forearm fracture has been estimatedat 40% in white women from the age of 50 years onwards, and 13% in whitemen (13). These figures are conservative, since they take into account onlyvertebral fractures that have come to clinical attention, and do not includeosteoporotic fractures at other sites. Estimates of the variation in lifetime riskare more complete for hip fracture than other fractures. Such data suggestthat lifetime risks vary markedly around the world (33,71,72) (Fig. 2.2). Thevariation is related more to variations in hip fracture incidence than tovariations in mortality risk.
Table 2.5 Remaining lifetime probability (%) of common osteoporotic fractures in Swedish men andwomen aged 50 years
Site of Women aged Men agedfracture 50 years 50 years
Hip 22.9 10.7Distal forearm 20.8 4.6Spine (clinical) 15.1 8.3Proximal humerus 12.9 4.9Any of the above 46.4 22.4
Source: reference 70 (Table 3).
Fig 2.2International variations in remaining lifetime probability of hip fracture at the age of 50 yearsin men and women
Source: references 33, and new data from references 71, 72.
24

Calculations of lifetime risk based on current life expectancy assume that lifeexpectancy will no longer continue to improve, which given past trends is anunreasonable assumption. Factoring in improvements in life expectancyincreases estimates of lifetime risk. Based on current mortality in Swedishmen and women, the lifetime risk of hip fracture is 8.1% and 19.5%,respectively, but these figures rise to 11.1% and 22.7%, respectively, whenbased on predicted mortality trends (73).
2.4 Mortality from osteoporotic fractures
It is widely recognized that osteoporosis is associated with increasedmortality (74–77). For each standard deviation decrease in bone mineraldensity, the mortality risk is increased approximately 1.5-fold. Excessmortality is also well described in patients who develop fractures at sitescharacteristic for osteoporosis, including the spine (radiographic and clinicalfractures) and hip (17,75,78–86). For morphometric vertebral deformities,the increase in risk is lower than that for clinical vertebral fractures butincreases with the number of prevalent fractures (82,83). For clinicallyapparent vertebral fractures the risk of death appears to be much higher, andthe presence of multiple fractures further increases this risk (79, 83,87).Some studies suggest that the mortality risk appears to be higher aftervertebral fracture in men than in women, even accounting for the highermortality rates for men in the general population. In the larger studies, thedifferences in mortality between men and women after vertebral fracturewere not marked when account was taken of age (88).
In contrast, no excess mortality has been shown following fractures of thedistal forearm (79,80,89).
In the case of hip fracture, most deaths occur in the first 3–6 monthsfollowing the event (81,84,86,90), and excess mortality decreases thereafter,though the mortality does not reach that of the general population (91).Comparisons of death rates by age suggest that the relative mortality risk ishigher at lower ages, and figures for Sweden are supplied in Table 2.6 (92).The reason for the difference in mortality by age is unclear. This might be aresult of greater comorbidity among those who have a hip fracture at the ageof 60 years than at the age of 80 years. Some investigators have reportedincreased mortality in men compared with women, but others show thatwhen standardized to the higher mortality of men, the excess mortality inmen and women is approximately the same.
25

Table 2.6 Relative risk of death after fracture at the sites shown in men and women from Swedencompared with that of the Swedish general population, by age (years)
Spine Hip Shoulder ForearmYear afterfracture Age 60 Age 80 Age 60 Age 80 Age 60 Age 80 Age 60 Age 80
Men0 13.4 3.9 11.6 3.1 4.7 3.7 1.1a 0.9a
1 10.7 3.2 10.2 3.7 4.0 3.2 1.1a 0.9a
2 8.5 2.5 8.8 3.3 3.4 2.8 1.1a 0.9a
3 6.8 2.0 7.7 2.9 2.9 2.4 1.2a 1.0a
4 5.4 1.6 6.7 2.5 2.5 2.0 1.2a 1.0a
5 4.3 1.3 5.8 2.2 2.1a 1.8a 1.2a 1.0a
Women0 12.9 3.4 10.4 3.4 3.1 2.2 1.8 1.3a
1 10.3 2.7 9.1 3.0 2.7 1.9 1.8 1.32 8.3 2.1 8.0 2.5 2.3 1.6 1.8 1.33 6.6 1.7 7.0 2.2 2.0 1.3a 1.8 1.34 5.3 1.3 6.2 1.9 1.7a 1.1a 1.9 1.3a
5 4.3 1.0a 5.4 1.6 1.4a 0.9a 1.9 1.2a
Source: reference 92 (Table 5).aNot significantly different from the general population.
In large series it has been possible to characterize the pattern of mortalitywith time after hip fracture (91) (Fig. 2.3). Note the steep decrease inmortality following the fracture. After a nadir value, mortality increases at arate greater than that of the general population. This type of analysissuggests that 24% (17%–32% depending on age) of all deaths associated withhip fracture might be causally related to the fracture itself. Other approachesto quantify the components of hip fracture mortality (19,93,94) come tobroadly similar conclusions. The estimates of deaths in Sweden that arecausally related to hip fracture are appreciable, suggesting that more than 1%of all deaths are attributable to hip fracture, a somewhat higher proportionthan that of deaths attributed to pancreatic cancer and somewhat lower thanthat of deaths attributed to breast cancer (Table 2.7).
26

Table 2.7 Principal causes of death from selected diseases in Swedish men and women in 1998
Men Women Total %
Acute myocardial infarction 7 113 5 335 12 448 13.3Cardiovascular accident 4 411 6 069 10 480 11.2Lung cancer 1 761 1 112 2 873 3.1Prostate cancer 2 480 0 2 480 2.6Chronic obstructive airways disease 944 723 1 667 1.8Diabetes 744 819 1 563 1.7Breast cancer 11 1 549 1 560 1.7Hip fracture 566 854 1 420 1.5Pancreatic cancer 603 736 1 339 1.4Suicide 880 349 1 229 1.3Atrial fibrillation 413 687 1 091 1.2Stomach cancer 489 334 823 0.9Transport accidents 422 142 564 0.6Smoke inhalation and fire 85 53 138 0.2
All deaths 46 840 46 788 93 628 100
Source: reference 91 (Table 4).
Fig. 2.3Pattern of mortality in the general population following hip fracture at the ages shown
Source: reference 91 (Fig. 2, p. 471).
By contrast to hip fracture, where most excess deaths occur early after theevent, the pattern of mortality following morphometric vertebral fracturesshows that survival decreases progressively with time (80). For clinicalvertebral fracture there appears, however, to be a high mortality risk thatdecreases with time, though does not reach that of the general population(see Table 2.6). In a large series of 16 000 hospitalized patients, approximately28% of deaths were considered to be causally related to the fracture event
27

(88). It should be noted that the causal attribution of deaths following avertebral fracture relates only to patients admitted to hospital who may havehigher comorbidity than those with asymptomatic fractures or those treatedat home. In Sweden, approximately 10% of women with vertebral fractures(15% of men) are admitted to hospital. The low admission rate may result inlarge selection biases that may affect estimates of both the causally-relatedand the associated deaths.
More recently, it has become apparent that similar patterns of mortality arefound after other osteoporotic fractures. In one series, excess mortality,shown for spine, hip and shoulder fractures, was higher at younger ages anddeclined significantly with time after the fracture event (see Table 2.6) (89).In common with the findings of other investigators, no excess mortality wasobserved for forearm fractures. The declining death risk with time afterhumeral fractures suggests that there may also be causally-related deaths, butmuch larger numbers of fractures would be needed to quantify this.
If some deaths are causally related to vertebral, hip and other osteoporoticfractures, then it might be expected that interventions that decreased the riskof these fractures would also increase survival. This has importantimplications for health economic modelling, and increased survival (at leastfor a short period after fracture) would be an important dividend oftreatment. Previous studies have shown lower morbidity in patients treatedwith bisphosphonates because of the decrease in subsequent fracture risk(95,96). There are, however, no data to suggest that there is a survivaladvantage associated with the prevention of fracture. This question isunlikely to be resolved from empirical observation. Assume, for example, thata random sample of women at the age of 80 years are recruited from thenormal population and enrolled into a placebo controlled trial for 3 years. Onthe assumption that the intervention decreased vertebral fracture frequencyby 50%, the probability of dying as a consequence of vertebral fracturewould be 14.104% for the placebo group and 14.099% for the actively treatedgroup. In order to achieve power of 80% at a significance level of 0.05 with atwo tailed test, the sample size in each group would need to be 533 million,exceeding the world population at this age. For this reason, knowledge in thisfield is likely to remain based on indirect calculations of the type presentedabove.
2.5 Disability attributable to osteoporotic fracture
The common osteoporotic fractures are a major cause of morbidity in thepopulation. Hip fractures cause acute pain and loss of function, and nearlyalways lead to hospitalization. Recovery is slow and rehabilitation is oftenincomplete, with many patients permanently institutionalized in nursinghomes. Vertebral fractures may cause acute pain and loss of function but mayalso occur without serious symptoms (97–99). Vertebral fractures oftenrecur, however, and the consequent disability increases with the number of
28

fractures. In Sweden, approximately 10% of women with a vertebral fracture(15% of men) are admitted to hospital (26). Distal radial fractures also leadto acute pain and loss of function, but functional recovery is usually good orexcellent. In addition to pain and disturbance of physical function, a fracturemay decrease mobility and social interaction and cause emotional problems(100). All these characteristics determine quality of life.
There are two approaches to the estimation of quality of life. The first is ageneric approach which poses general questions on health status that couldbe used to compare various diseases. Whereas the strength of this approachlies in the ability to compare different diseases, it is not specific for anydisease or age group. Examples of generic questionnaires are the NottinghamHealth Profile (101), the Sickness Impact Profile (102), the Short Form 36of the Medical Outcomes Study (103,104), and the EuroQOL (EQ-5D)(105).
In contrast, disease-specific or disease-targeted questionnaires are designedfor patients with a specific disease or specific outcome, such as osteoporosisin general or a type of fracture. These questionnaires contain more specificquestions and thus discriminate between individuals with and without thedisease, but a disadvantage is that different diseases cannot be compared(106,107). Both generic and disease-specific questionnaires usually compriseseveral domains, such as pain, physical function, mobility, general health,emotional impact and fears. Some of the characteristics of disease-specificinstruments for osteoporosis are shown in Table 2.8 (100,108-115).
29

Table 2.8 Characteristics of quality of life questionnaires specific for osteoporosis
Number ofInstrument Acronym questions Domains References
Osteoporosis quality OQLQ 30 Physical function, Cook et al., of life questionnairea activities of daily living, 1993 (109)
emotional function Osteoporosis Quality of Life Study Group, 1997 (110)
Osteoporosis OFDQ 69 General health and back Helmes et al., functional disability pain, activities of daily 1995 (111)questionnairea living, socialization,
depression, confidence
Osteoporosis OPTQOL 33 Physical activity, Lydick et al.,targeted quality adaptation, fears 1997 (112)of life Chandler et al., questionnairea 1998 (113)
Osteoporosis OPAQ 67 Physical function, Randell et al.,assessment emotional status, 1998 (114)Questionnaireb symptoms, social
interactions
Quality of life QUALEFFO-41 41 Pain, physical function, Lips et al., 1997, questionnaire of social function, general 1999 (100,108)the European health perception,Osteoporosis mental functionFoundation (now the InternationalOsteoporosis Foundation)b
Questionnaire QUALIOST 23 Physical function, Marquis, Cialdellaquality of life emotional & De La Loge, in osteoporosisb status 2001 (115)
a Interviewer-based.b Can be self-administered.
2.5.1 Quality of life following osteoporotic fractures
Impairments of quality of life following fracture are ill-documented for manyfracture outcomes, but a considerable body of information exists for hipfracture, somewhat less for vertebral fracture and even less for forearmfractures (116). This relates to the paucity of disease-specific instruments.
Hip fractureCollection of data on quality of life is impaired by the advanced age of thepatients. Many patients have impaired cognition before the fracture and, inaddition, the hospital admission and operation may cause disorientation.Notwithstanding, it is clear that morbidity is considerable. Only half of the
30

hip fracture patients who survive will walk again, but often not to the samedegree as before the hip fracture event (117). The best predictor of recoveryis pre-fracture health status (118). In a prospective study of individuals withhip fracture (119), only 8% were able to climb stairs compared with 63%before the fracture; and only 6% could walk half a mile compared with 41%before the fracture. In a case-control study, hip fracture patients were 4.2times more likely to be unable to function in a wider community two yearsafter the fracture and 2.6 times more likely to be functionally dependent thancontrols (120).
Vertebral fractureA number of studies have shown impairment of health status in patients withvertebral fractures (95,121–126). Osteoporosis-specific questionnaires havedocumented significant decrements in patients with prevalent vertebralfractures compared to non-fracture controls in the context of a clinical trialin osteoporosis (24,123,127). Quality of life decreased significantly withincreasing number of prevalent vertebral fractures and the impact of lumbarfractures appeared to be greater than that of thoracic fractures. For example,with the QUALEFFO instrument, patients without vertebral fractures had amean total score of 25.6 ± 14.3 and those with more than three thoracicfractures a score of 35.8 ± 19.7, whereas patients with more than threelumbar fractures had a score of 53.2 ± 15.8.
Approximately 4% of women with a clinical vertebral fracture becomedependent in the activities of daily living (28). Quality of life becomesprogressively impaired as the number and severity of vertebral fracturesincreases (24). Most of these difficulties are confined to those with severe ormultiple vertebral deformities (23), but the adverse influence of vertebralfractures on many of the activities of daily living is almost as great as thatseen for hip fracture (128), and is reviewed later.
Changes in quality of life following incident vertebral fractures have alsobeen assessed in the context of clinical trials (123,127). Quality of life wassignificantly worse in those with a new vertebral fracture. This was also truefor patients who had vertebral fractures that were only diagnosed on ascheduled radiograph and did not, therefore, come to clinical attention at thetime of fracture (96). This confirms the view that sub-clinical vertebralfractures, even when not immediately diagnosed, cause a decrease in qualityof life (127).
Forearm fracturesThere are no disease-specific instruments available for forearm fractures,though these are being developed by the International OsteoporosisFoundation.
31

2.5.2 Utility and disutility following osteoporotic fractures
Utility is a value attached to a specific health state and is derived from genericrather than disease-specific instruments. Utility takes the preferences ofindividuals into account (129) using a standard gamble or time trade-offmethod. Utility assessment results in one single value for the patient’s healthstatus, ranging from zero (death) to one (perfect health). These values can beused to calculate loss or gain of quality-adjusted life years (QALYs). Thus,when a certain disease causes a utility change from 1.0 to 0.6 for one year, theutility loss is 0.4 and the QALY loss is 0.4. When the same disease causes autility loss of 0.4 for 6 months or 2 years, the QALY loss is 0.2 or 0.8,respectively. The QALY loss (or disutility) is equivalent to utility loss withtime. Instruments used for the calculation of utility and QALYs include theEQ-5D or EuroQOL (105), and the health utility instrument (130). The mostwidely used for economic modelling in osteoporosis is the EQ-5D. Valuationscan be done by expert panels and by the time trade-off method amonghealthy controls to obtain the utility values (105,131,132) or utility valuescan be obtained from patients. The utility values obtained by experts or fromhealthy controls may differ substantially from data obtained in patients(133).
Utility data for patients with different fractures have recently been reviewed(134). Most data have been obtained with the time trade-off method. Theseindicate that utility is lower in patients after hip and vertebral fracture. Othermethods such as the standard gamble and health utility index yield somewhatdifferent results (130,133,135,136). Two studies in older women who wereasked to value different outcomes for hip or vertebral fractures showed thatolder women without osteoporotic fractures judged a worse quality of lifeafter fracture than the patients themselves (133,136).
The utility loss after fracture has also been estimated by expert panels(137,138). Although fracture outcomes may be given different weights fromthose obtained from patients or the general population, they have the meritof being able to consider all osteoporotic fractures and form the basis forcomputing the burden of osteoporosis in society. The health state values ofthe National Osteoporosis Foundation have recently been modified in thelight of empirical prospective information available for vertebral fracturewhich indicates that disutility may have been markedly underestimated. In aprospective study, 40 patients attending the Accident and EmergencyDepartment at Malmo Hospital were studied by administering the EQ-5D at14 days, and 6, 9 and 12 months after the fracture event (26). From a clinicalvertebral fracture, the utility loss was 0.260 in the first year, which was greaterthan that for hip fracture (0.149), or fracture of the proximal humerus(0.153) and forearm fracture (0.017). The utility loss after a clinicalvertebral fracture is much greater than previously recognized, but accordswith independent observations that the effect of vertebral fracture on manyof the activities of daily living is almost as great as that for hip fracture(128). Utility values of health state, according to the site of fracture, are
32

shown in Table 2.9 (26). These are shown as multipliers. This means that theaverage health state value for the age-matched and sex-matched populationneeds to be multiplied by the given value to estimate the health state value inthe first or second year after a fracture.
Table 2.9 Utility values of health state, by site of fracture
Multiplier for utility Multiplier for utility loss
Fracture site 1st year 2nd year 1st year 2nd year
Spine (clinical) 0.626 0.909 0.374 0.091Spine (morphometric)
Men 0.777 0.912 0.223 0.088Women 0.820 0.913 0.180 0.087
Ribs 0.977 0.999 0.003 0.001Pelvis 0.794 0.815 0.206 0.185Humerus 0.794 0.973 0.206 0.027Clavicle, scapula, sternum 0.977 0.999 0.003 0.001Hip 0.792 0.813 0.208 0.187Other femoral 0.792 0.813 0.208 0.187Tibia 0.794 0.926 0.206 0.074Forearm 0.977 0.999 0.003 0.001
Source: reference 26 (Table 1).
The utility loss after a morphometric deformity not coming to clinicalattention is not known. Patients with sub-clinical fractures are reported tohave impaired activities of daily living (ADLs) that are about one third to onehalf of the ADL impairment seen in patients with clinical fractures (95,96).They also have impaired scores on the QALEFFO scale (24). On this basis,it has been assumed that the utility loss of subclinical fracture is about onethird that of a clinically overt fracture, since a proportion of the decrementobserved may have resulted from comorbidity. From the ratio of clinical tonon-clinical fractures (42% in men and 23% in women), the utility loss fromall vertebral fractures can be computed (see Table 2.9).
When utility loss cumulated over a lifetime is computed (disutility), theburden of different types of fracture can be compared (26). As expected,average disutility is greatest in the case of hip fractures over all ages,intermediate for vertebral fractures and lower for humeral and Collesfracture (Table 2.10). Disutility values are higher for the younger age groupsbecause of their higher life expectancy and higher population tariff value.Considering all vertebral fractures, rather than clinical spine fractures alone,decreases the average disutility of vertebral fractures by 15%–30% dependingon age. In men and women aged 50 years, a clinical spine fracture incurred adisutility of 62% of that for a hip fracture, and was substantially higher thanthe loss incurred from humeral fractures (23% of the loss incurred by a hipfracture). The comparative disability from each fracture type can becomputed, which varies somewhat by age (see Table 2.10). For example, inwomen between the ages of 85 and 89 years, a hip fracture would incur a
33

disutility of 0.57, whereas a morphometric spine fracture would incur adisutility of 0.32. Thus approximately two spine fractures incur the samedisability as one hip fracture. Similarly, three humeral fractures areapproximately equivalent to the disutility incurred by one hip fracture.
Table 2.10 Disutility for different fracture types by age, adjusted for the population tariffs
Age range (years)Site offracture 50-54 55-59 60-64 65-69 70-74 75-79 80-84 85-89
MenMorphometric spine 0.887 0.800 0.757 0.713 0.714 0.557 0.420 0.350Clinical spine 1.026 0.938 0.895 0.850 0.768 0.687 0.538 0.472Humerus 0.383 0.353 0.339 0.327 0.301 0.277 0.228 0.212Hip 1.643 1.491 1.402 1.304 1.148 0.980 0.701 0.943Forearm 0.010 0.009 0.009 0.009 0.008 0.007 0.005 0.005
WomenMorphometric spine 0.857 0.640 0.621 0.733 0.622 0.545 0.444 0.321Clinical spine 1.053 0.751 0.734 0.917 0.790 0.706 0.594 0.460Humerus 0.392 0.282 0.278 0.349 0.305 0.279 0.243 0.200Hip 1.692 1.193 1.149 1.430 1.202 1.041 0.829 0.570Forearm 0.011 0.007 0.007 0.009 0.008 0.007 0.006 0.004
Source: reference 26 (Table 6).
Such data permit the quantification of the morbidity of different fracturetypes in the population. For example, in women between the ages of 50 and54 years, clinical spine fractures account for 17% of all osteoporotic fractures.When this incidence is adjusted for disutility, then clinical spine fracturesaccount for 48% of the morbidity at that age. In women aged 80–84 years, hipfractures account for 37% of all fractures but, when adjusted for disutility,account for 65% of the morbidity in that age group. Further examples areprovided in Fig. 2.4 (26). An appreciation of the disutility in populationspermits the computation of the burden of disease in society.
34

Fig. 2.4The proportion of osteoporotic fractures by age at different sites (left-hand panel) and theirproportional morbidity (right-hand panel) in men and women from Sweden
Source: reference 26 (Table 7, p. 24).
2.6 Global burden of disease
Osteoporosis is increasingly recognized as an important public healthconcern because of the fractures that arise (139). Of the fractures associatedwith osteoporosis, most attention has been given to hip fracture, in partbecause of the more complete epidemiological information availablecompared with other fractures, and particularly because hip fractureaccounts for the majority of direct medical costs and morbidity in thecommunity (17,140–145). Despite its significance worldwide, there are fewestimates of the global burden of osteoporosis. Three studies have providedcalculations of the current number of hip fractures and those expected in thefuture, based on the expected changes in the population demography with orwithout assumptions concerning secular trends in fracture incidence(67,68,89). These studies arrive at broadly similar conclusions and indicatethat the number of hip fractures is now greatest in the developed world, butis set to increase markedly in developing countries, particularly in Asia. In theabsence of information on health-care costs worldwide, it has been difficultto assess the global burden of disease in monetary units (142).
A general approach to quantifying the burden of disease, favoured by WHOand the World Bank, is to assess the disability incurred by disease, includingdeaths attributable to the disorder as well as the disability that arises insurvivors (146). The approach, based on disability and life years lost,permits a comparison across diseases (147).
35

The number of hip fractures worldwide estimated for 1990 amounted to 1.3million in men and women (92) (Table 2.11). Of these, 69% occurred inwomen. The female to male ratio (2.2 in the world overall) varied betweenregions, being highest in Eastern Europe and the established marketeconomies (4.0 and 3.2, respectively). In India and China, more hip fracturesoccurred in men than in women (female to male ratios of 0.8 and 0.9,respectively). In other regions, the female to male ratio varied from 1.2 to 2.2.Slightly more than half of all hip fractures occurred in the established marketeconomies (north America, Australasia, western Europe and Japan).
Table 2.11 Estimated burden of hip fracture worldwide in 1990
Men Women Total
Number of hip fractures 404 912 908 613 1 313 525
Patients suffering consequencesof hip fracture 1 206 051 3 275 490 4 481 541
Deaths after hip fracture 246 289 491 818 738 107
Deaths attributable to hip fracture 61 572 122 954 184 526
Years of life disabled 332 370 880 812 1 213 182
Years of life lost 355 038 595 846 950 884
Disability-adjusted life years 924 000 1 998 000 2 922 000
Source: reference 92 (Tables 1–6).
By estimating the time course of disutility, the number of patients sufferingthe consequences of hip fracture can be computed. In 1990, these amountedto 4.5 million worldwide, estimated from an average duration of disabilityfollowing hip fracture of 3.0 and 3.6 years in men and women, respectively.The annual number of deaths in 1990 was estimated at 738 000, of which 67%were in women. Approximately half were in the established marketeconomies (49%). From previous calculations, it can be inferred thatapproximately 25% of associated deaths resulted from the hip fracture eventitself. Thus, deaths causally related to hip fracture amounted to 185 000 in1990. The estimated number of life years disabled is also shown in Table 2.11.A total of 1.2 million years of life disabled occurred in 1990, the majority ofwhich (55%) were in the established market economies. The life-years lostfrom hip fracture amounted to 951 000 years in 1990 alone. Note that the lifeyears lost are weighted by age, and the weighting attributes a greater value toa year during young adult life than to a year in the life of a child or an elderlyperson (146). For example, a life year valued at 1.0 at the age of 55 years isvalued at 0.8 at the age of 60 years and 0.7 at the age of 70 years. Theweighting is used to assess disability-adjusted life years and, in 1990, thesewere estimated to be 2.9 million.
36

In the present analysis, hip fractures were identified as a major cause ofpremature death. In the established market economies, the global burden interms of disability was somewhat less than that for rheumatoid arthritis, butgreater than that of cancer of the stomach, ovaries or cervix (Table 2.12). Inthese regions, hip fracture accounted for 1.4% of the burden of disease,though much less (0.1%) worldwide (92). The burden of disease is, however,greater when account is taken of all osteoporotic fractures, rather than hipfracture alone (see section1).
Table 2.12 Disability-adjusted life years (DALYs) lost among women from established marketeconomies, by cause
Cause DALYs (thousand) %
All causes 437 714 100Ischaemic heart disease 3 407 7.8Cardiovascular disease 2 510 5.7Breast cancer 1 436 2.8Diabetes mellitus 1 203 2.8Lung cancer 970 2.2Chronic obstructive pulmonary disease 953 2.2Colon and rectal cancer 786 1.8Rheumatoid arthritis 762 1.7Hip fracture 591 1.4Cirrhosis of the liver 500 1.1Stomach cancer 403 0.9Ovarian cancer 377 0.9Iron deficiency anaemia 364 0.8Parkinson disease 285 0.7Cervical cancer 191 0.4Source: reference 92 (Table 8).
It should be recognized that epidemiological information on hip fracturerates is scanty in several regions of the world. Indeed, there are no reliabledata for India, where it has been assumed that hip fracture rates are similarto those of China. India, however, contributed only 8% to the global burdenof osteoporosis. The greatest confidence can be placed on incidence rates inthe established market economies, a region that accounted for the greatestmorbidity. There are also scanty data on the mortality attributable to hipfracture worldwide. In the analysis above, it has been assumed that theproportional excess mortality is similar to that of Sweden and the causalmortality is also consistent with that derived from Sweden. The data onoutcomes in Sweden may not be applicable elsewhere, where surgicalmanagement and post-fracture care may be less than optimal. If so, theassumptions made here would underestimate the mortality after hip fracture.The same holds true for morbidity. Estimates of morbidity are criticallydependent on the adequacy of estimates of the QALYs lost, which are alsoderived from the established market economies. Thus, the assumptions madeare conservative, but nevertheless indicate that hip fracture is an importantcause of death and disability, particularly in the developed regions of theworld. In view of the high morbidity occasioned by other osteoporotic
37

fractures, particularly in young people, it will be important to document theglobal burden of disease taking these additional fractures into account.
2.7 Future predictions
The financial and health-related costs of osteoporosis can only rise in futuregenerations (148). Life expectancy is increasing around the globe, and thenumber of elderly individuals is rising in every geographic region. There arean estimated 323 million individuals aged 65 years or more at present, andthis number is expected to reach 1555 million by the year 2050 (149). Thesedemographic changes alone can be expected to cause the number of hipfractures to increase from about 1.5 million in 1990 to between 4.5 and 6.3million in 2050 (67,68). Using current hip fracture incidence in various partsof the world, it can be estimated that about half of all hip fractures amongelderly people in 1990 occurred in north America and Europe. By 2050,however, the rapid ageing of the Asian and Latin American populations willresult in the north American and European contribution falling to only 25%,with over half of all hip fractures then occurring in Asia.
In Europe, the size of the population is expected to increase by 26% inwomen and by 35% in men between the years 2000 and 2050. The increasewill be most marked in elderly people at the age when hip fractures are mostcommon (150). Between 2000 and 2050, the population aged 80 years ormore will increase by 160% in women and by 239% in men (Table 2.13).
Table 2.13 Percentage increase expected in the male and female population of Europe, by agecategory in years (the population in thousands in 2000 is shown in parentheses)
Calendar Men Women Men Women Men Womenyear 50+ 50+ 65+ 65+ 80+ 80+
(99 433) (130 786) (41 032) (66 146) (6 205) (15 042)
2000 0 0 0 0 0 02010 15 12 12 8 49 382020 29 22 34 23 85 612030 37 28 60 42 122 812040 42 31 75 52 187 1302050 36 26 81 55 239 160Source: reference 150 (Table 6).
38

Even more marked increases are projected in different regions of the world,particularly in Asia. In Asia, a 7.6-fold increase in elderly people is predictedbetween the years 2000 and 2050 (Table 2.14). In 2000, approximately 46% ofmen aged 80 years and older were from Asia; this proportion is expected torise to 60% in 2050. For women the figures are 41% and 59%, respectively.
Table 2.14 Demographic projections for different regions of the world
Population (thousand) Increase (multiplier)
Region Year Men Women Men Women
Africa 2000 1 168 1 6962050 7 882 11 798 6.75 6.96
Asia 2000 11 190 18 2122050 85 212 138 505 7.62 7.61
Europe 2000 6 205 15 0422050 21 006 39 090 3.39 2.60
Latin America 2000 1 914 2 986and Caribbean 2050 13 737 24 156 7.18 8.09
North America 2000 3 472 6 5272050 12 622 20 459 3.64 3.13
Oceania 2000 245 4392050 1 048 1 760 4.28 4.01
World 2000 24 193 44 9052050 141 506 235 767 5.84 5.25
Source: World population prospects: the 2002 revision and world urban prospects. New York,United Nations Population Division, Department of Economic and Social Affairs, 2003(http://esa.un.org/unpp/, accessed 12 February 2005).
Such projections are worsened by increases in fracture incidence seen in somecountries, even after adjustment for growth of the elderly population (151).Although age-adjusted hip fracture rates appear to have levelled off in thenorthern area of the USA, in parts of Sweden and in the United Kingdom(84,152–154), rates in other parts of the world have risen substantially. If thesecular trend continues in regions other than north America and Europe, hipfracture totals may double again to over 8 million by 2050 (68).
There are three broad explanations for the secular trends. First, they mightreflect the influence of some increasingly prevalent risk factor for bone lossor falling. Secular changes in BMD are unlikely. In Sweden, for example, theage-specific incidence of hip fractures rose by 100% between 1970 and 2001,but without measurable changes in BMD, at least at the forearm (155). Timetrends for a number of other risk factors, including oophorectomy, oestrogenreplacement therapy, cigarette smoking, alcohol consumption and lowdietary calcium intake do not match those observed for hip fractures.
39

Physical activity, however, appears to be a likely candidate. There is ampleepidemiological evidence linking inactivity to the risk in hip fractureincidence (36,156,157), whether this effect is mediated through bone density,the risk of falls, or both. There may also be important secular trends inenvironmental factors and the surfaces on which individuals fall. Thus,urbanization has resulted in a progressive increase in harder surfaces. Asecond possible explanation for these secular changes is that the elderlypopulation is becoming increasingly frail. The prevalence of disability isknown to rise with age, and to be greater among women than men at any age.Since many of the disorders contributing to frailty are independentlyassociated with osteoporosis and the likelihood of falling, this tendencymight have contributed to the secular increases in fracture risk in developedcountries during earlier decades. Finally, the trends could arise from a cohortphenomenon: some adverse influence on bone mass or falling risk whichacted at an earlier time but is now being manifested as rising fractureincidence in successive generations of elderly people (158). Generationaleffects do explain some of the secular trends in adult height during thiscentury. Similar effects on the skeleton are likely, and might be mediatedthrough intrauterine or early postnatal programming, as well as childhoodnutrition and physical activity.
2.8 Costs
The burden of osteoporosis in terms of the number of fractures has beenevaluated in several national studies. There has, however, been no cohesiveattempt to translate this into estimates of the global economic burden. Doingso is not without difficulty because the costs of health care differ as widely asthe patterns of treatment. For example, in the United Kingdom the averageduration of hospital stay after hip fracture is close to 30 days (17), whereasin Sweden it is closer to 15 days (4). In a large southern European study (theMediterranean Osteoporosis Study) a substantial minority of hip fractureswere treated conservatively in Portugal, whereas in many other countries theoverwhelming majority are treated surgically (159). Even characterizing theburden of disease in a single country is problematic in the sense that there aremultiple fracture types, each with different consequences, which also differ byage.
All estimates that have been made indicate very substantial costs attributableto osteoporotic fractures. In England and Wales, for example, the cost wasrecently estimated at £1.7 billion each year (160), and this figure will increaseas the proportion of elderly people in society rises. In Europe, direct medicalexpenditures for osteoporotic fractures were estimated at €36 billionannually (150), of which two thirds were accounted for by hip fracture(Table 2.15). These costs are expected to double by the year 2050. In theUSA, direct medical expenditures for osteoporotic fractures were estimatedat US$ 20 billion in 2000 (42).
40

Table 2.15 Estimated costs of osteoporotic fractures in Europe (in thousands of Euros) by fracture site,age and sex, in 2000
Age Fracture siterange(years) Hip Spine Other Total
Men50–64 544 69 473 1 08665–74 1 111 63 389 1 56375–84 1 637 45 360 2 04285+ 1 264 21 2 781 4 067
50+ 4 556 198 4 003 8 757
Women50–64 813 101 1 253 2 16865–74 2 751 165 1 376 4 29375–84 9 120 152 2 553 11 82485+ 7 112 102 1 992 9 206
50+ 19 796 521 7 173 27 491
Total50–64 1 358 171 1 725 3 25465–74 3 863 230 1 764 5 85675–84 10 757 197 2 915 13 86885+ 8 376 123 4 773 13 272
50+ 24 353 719 11 177 36 248
Source: reference 150 (Table 5).
Financial analyses of the costs of osteoporosis have considered principally,though not exclusively, the most common osteoporotic fractures (142). Inthe case of hip fracture, cost estimates differ for patients discharged home(45% of cases in the United Kingdom), for those discharged to long-termresidential care (25%), and for patients dying within the first year of hipfracture (30%) (161). Age is also an important determinant of cost, so thatcosts rise progressively with age (162). Aggregate costs of hip fracture(1999–2000 prices) in the United Kingdom were £13 519 in the first year, and£5291 in the second year, giving a total cost of £18 810 per hip fracture. Costsof vertebral fractures were estimated at £771 but age-weighted. In the USA,the average direct cost of hip fracture was estimated at US$ 21 000 in the firstyear; that for vertebral fracture was US$ 1200 per patient and that of a Collesfracture US$ 800 (137).
Hip fractures account for the greatest costs because of the long duration ofhospitalization and the frequent need for after-hospital care. In Australia, hipfractures account for 63% of the total health-care expenditure forosteoporosis (163). For Europe, the figure is 67% (150). In Holland, hipfractures account for about 85% of the hospital costs of osteoporosis, ofwhich 80% results from hospital admissions (140,163). In the UnitedKingdom, hip fractures account for more than 90% of all hospital bed–days
41

attributable to osteoporosis (17) because of the lengthy hospital admissionfor hip fracture. Indeed, hospitalization for hip fracture accounts for directin-patient medical costs that are comparable with many other chronicdiseases in the Netherlands (140), Sweden (4) (Table 2.16; Fig. 2.5) and theUnited Kingdom (17).
Table 2.16 Hospital burden of different disorders in Sweden, 1996
Men Women
Number of Hospital Number of Hospital CostDisease cases stay (days) Bed days cases stay Bed days (US$ million)a
Myocardial 47 171 5.05 238 214 29 358 5.67 166 460 263infarction
Stroke 26 668 15.70 418 688 20 548 12.98 266 713 446
Prostate 12 285 7.77 95 454 62cancer
Breast cancer 11 078 7.06 78 211 51
Hip fracture 7 151 12.22 87 385 18 684 13.11 244 475 216
Osteoporotic 12 357 11.00 135 916 34 380 11.81 406 192 351fracture
All fractures 15 825 10.24 162 050 38 278 11.25 437 283 388
Source: reference 4 (Table 7).aDaily cost of hospital bed estimated at US$ 648.
Fig. 2.5Inpatient hospital costs of fractures (US$ million) in Sweden Source: reference 4.
42

Vertebral fracture rarely leads to hospitalization. In Europe, approximately8% of people with vertebral fractures are admitted to hospital (59). In theUnited Kingdom, as few as 2% of patients may be admitted, althoughclinical coding inaccuracies may underestimate this figure (164). In Sweden,the admission rate is higher at 10% for women and 15% for men. The cost ofeach hospital stay has been estimated at €3900 for men and women in theEuropean Union (59) (Table 2.17). This represents about 48% of the cost ofa hip fracture.
Table 2.17 Hospital costs of vertebral fracture in the European Union
Discharge Hospitalization Length Hospital cost per Cost per hip Cost per vertebralCountry rate (per 100 000)a rate (%)b of stay day (€) fracture (€ thousand) fracture (€ thousand)c
Austria 140 11 8 370 13.4 2.7Belgium 69 7 16 255 9.1 4.3Denmark 49 5 14 220 7.4 3.0Finland 100 10 13 210 7.1 2.8France 49 5 20 310 12.2 6.1Germany 112 14 17 240 13.8 4.4Greece 39 4 5 85 3.8 0.4Ireland 55 9 8 395 3.7 3.6Italy 95 12 7 300 4.7 2.1Luxembourg 83 8 12 255 11.5 3.0Netherlands 27 4 14 255 12.1 3.9Portugal 39 5 12 120 5.8 1.4Spain 38 6 10 260 5.8 2.6Sweden 144 18 9 440 5.6 4.0United Kingdom 24 3 15 230 8.9 3.5European Union 69 8 13 8.1 3.9
Source: reference 59 (Tables 1–3, 5).aAged 50+ years; 45+ years for Germany and Spain.bEstimated from the European Prospective Osteoporosis Study (2002).cFractures in women without neurological involvement.
The economic burden results, therefore, mainly from outpatient care,provision of nursing care and lost working days, particularly in patients withsevere or multiple vertebral fractures (23,128). Few studies have, however,examined the additional costs of re-fracture following a vertebral fracture.Estimates from Sweden and the United States suggest that the incrementalcosts of further fractures in the subsequent year are €2712 and US$ 4361,respectively (165).
In the USA, the medical expenditure for osteoporotic fracture has beenassessed by sex and ethnicity (145). Of US$ 13.8 billion spent on thetreatment of osteoporotic fractures in 1995 for individuals aged 45 years andolder, 75% was accounted for by treating white women, 18% for treatingwhite men, 5% for treating non-white women, and 2% for treating non-whitemen. Of the total cost, 62.4% was for inpatient care, 28.2% for nursing homecare and 9.4% for outpatient care, consistent with estimates from other
43

industrialized countries. These relative costs cannot be universally appliedbecause the risk of fracture varies widely. So too does the sex ratio. Thus, asnoted previously, osteoporotic fractures are as prevalent in men as in womenin developing countries.
As mentioned, the estimated cost of osteoporotic fractures in Europe was€36.3 billion in 2000. Based on the expected changes in demography thisfigure is set to rise to €76.9 billion in 2050 (150). These estimates may beconservative since they do not take into account any changes in the seculartrend for fracture incidence that may occur.
References
1. Lippuner K et al. Incidence and direct medical costs of hospitalizations due toosteoporotic fractures in Sweden. Osteoporosis International, 1997, 7:414–425.
2. Phillips S et al. The direct medical cost of osteoporosis from American womenaged 45 and older, 1986. Bone, 1988, 9:271–279.
3. Melton LJ III et al. Fractures attributable to osteoporosis: report from the NationalOsteoporosis Foundation. Journal of Bone and Mineral Research, 1997, 12:16–23.
4. Johnell O et al. The burden of hospitalised fractures in Sweden. OsteoporosisInternational, 2005, 16: 222–228.
5. Sanders KM et al. The exclusion of high trauma fractures may underestimate theprevalence of bone fragility fractures in the community: the GeelongOsteoporosis Study. Journal of Bone and Mineral Research, 1998,13:1337–1342.
6. Seeley DG et al. Which fractures are associated with low appendicular bone massin elderly women? Annals of Internal Medicine, 1991, 115: 837–842.
7. Stone KL et al. BMD at multiple sites and risk of fractures of multiple types: long-term results from the Study of Osteoporotic Fractures. Journal of Bone and MineralResearch, 2003, 18: 1947–1954.
8. Melton LJ III et al. Vertebral fractures predict subsequent fractures. OsteoporosisInternational, 1996, 10: 214–221.
9. Kotowicz MA et al. Risk of hip fracture in women with vertebral fracture. Journalof Bone and Mineral Research, 1994, 9:599–605.
10. Ross PD et al. Pre-existing fractures and bone mass predict vertebral fractureincidence in women. Annals of Internal Medicine, 1991, 114:919–923.
11. Cuddihy M-T et al. Forearm fractures as predictors of subsequent osteoporoticfractures. Osteoporosis International, 1999, 9: 469–475.
12. Kanis JA et al. The burden of osteoporotic fractures: a method for settingintervention thresholds. Osteoporosis International, 2000, 12:417–427.
13. Melton LJ III. Epidemiology of fractures. In: Riggs BL, Melton LJ III, eds.Osteoporosis: etiology, diagnosis, and management, 2nd ed. Philadelphia, Lippincott-Raven, 1995:225-247.
14. Nguyen EJ, Kelly PJ, Sambrook PN. Risk factors for osteoporotic fractures: asummary of the literature and statistical synthesis. American Journal ofEpidemiology, 1996, 144:255–263.
44

15. Gibson MJ. The prevention of falls in later life. Danish Medical Bulletin, 1987,34(Suppl. 4):1–24.
16. Michaelsson K et al. Differences in risk factor patterns between cervical andtrochanteric hip fractures. Osteoporosis International, 1999, 10:487–494.
17. Kanis JA, Pitt FA. Epidemiology of osteoporosis. Bone, 1992, 13:S7–S15.
18. Keene GS, Parker MJ, Pryor GA. Mortality and morbidity after hip fractures.British Medical Journal. 1993, 307:1248–1250.
19. Poor G et al. Determinants of reduced survival following hip fractures in men.Clinical Orthopaedics and Related Research, 1995, 319:260–265.
20. Melton LJ III. Adverse outcomes of osteoporotic fractures in the generalpopulation. Journal of Bone and Mineral Research, 2003, 18:1139–1141.
21. Cooper C et al. The incidence of clinically diagnosed vertebral fracture: apopulation-based study in Rochester, Minnesota. Journal of Bone and MineralResearch, 1992, 7:221–227.
22. Ettinger B et al. Contribution of vertebral deformities to chronic back pain anddisability. Journal of Bone and Mineral Research, 1992, 7:449–456.
23. Johnell O, Gullberg B, Kanis JA. The hospital burden of vertebral fracture: a studyof national register sources. Osteoporosis International, 1997, 7:138–144.
24. Oleksik A et al. Health-related quality of life (HRQOL) in postmenopausal womenwith low BMD with or without prevalent vertebral fractures. Journal of Bone andMineral Research, 2000, 15:1384–1392.
25. Van Staa TP et al. Epidemiology of fractures in England and Wales. Bone, 2001,29:517–522.
26. Kanis JA et al. Risk and burden of vertebral fractures in Sweden. OsteoporosisInternational, 2004, 15:20–26.
27. Lindsay R et al. Risk of new vertebral fracture in the year following a fracture.Journal of the American Medical Association, 2001, 285:320–323.
28. WHO Scientific Group on the Burden of Musculoskeletal Conditions at the Start of theNew Millennium. The burden of musculoskeletal conditions at the start of the newmillennium. Geneva, World Health Organization, 2003 (WHO Technical ReportSeries, No. 919).
29. Chrischilles EA et al. A model of lifetime osteoporosis impact. Archives of InternalMedicine, 1991, 151:2026–2032.
30. Kaukonen JP et al. Functional recovery after fractures of the distal forearm:analysis of radiographic and other factors affecting the outcome. AnnalsChirurgiae et Gynaecologiae, 1988, 77:27–31.
31. Bickerstaff DR, Kanis JA. Algodystrophy: an under-recognised complication ofminor trauma. British Journal of Rheumatology, 1994, 33:240–248.
32. Silman AJ. The patient with fracture: the risk of subsequent fractures. AmericanJournal of Medicine, 1995, 98(Suppl. 2A):12–16.
33. Kanis JA et al. International variations in hip fracture probabilities: implications forrisk assessment. Journal of Bone and Mineral Research, 2002, 17:1237–1244.
34. Maggi S et al. Incidence of hip fractures in the elderly: a cross-national analysis.Osteoporosis International, 1991, 1:232–241.
45

35. Bacon WE et al. International comparison of hip fracture rates in 1988-1989.Osteoporosis International, 1996, 6:69–75.
36. Elffors L et al. The variable incidence of hip fracture in Southern Europe: theMEDOS Study. Osteoporosis International, 1994, 4:253–263.
37. Johnell O et al. The apparent incidence of hip fracture in Europe: a study ofnational register sources. MEDOS Study Group. Osteoporosis International, 1992,2:298–302.
38. Melton LJ III, Cooper C. Magnitude and impact of osteoporosis and fractures. In:Marcus R, Feldman D, Kelsey J, eds. Osteoporosis, 2nd ed. Vol. 1. San Diego,Academic Press, 2001:557–567.
39. Lauderdale DS et al. Hip fracture incidence among elderly Asian-Americanpopulations. American Journal of Epidemiology, 1997, 146:502–509.
40. Gardsell P et al. Bone mass in an urban and a rural population: a comparativepopulation based study in Southern Sweden. Journal of Bone and MineralResearch, 1991, 6:67–75.
41. Specker B, Binkley T, Fahrenwald N. Rural versus non-rural differences in BMC,volumetric BMD and bone size: a population based cross-sectional study. Bone,2004, 35:1389–1398.
42. Cummings SR, Melton LJ. Epidemiology and outcomes of osteoporotic fractures.Lancet, 2002, 359:1761–1767.
43. Jacobsen SJ et al. Regional variation in the incidence of hip fracture. Journal ofthe American Medical Association, 1990, 264:500–502.
44. Roy DK et al. Falls explain between centre differences in the incidence of limbfracture across Europe. Bone, 2002, 31:712–717.
45. Davis JW et al. A cross-cultural comparison of neuromuscular performance,functional status and falls between Japanese and White women. Journal ofGerontology, 1999, 54:M288–M292.
46. Delmas PD et al. Underdiagnosis of vertebral fractures is a worldwide problem:the Impact study. Journal of Bone and Mineral Research, 2005, 20:557–563.
47. Melton LJ III et al. Prevalence and incidence of vertebral deformities. 1993,3:113–119.
48. Jones G et al. Prevalent vertebral deformities: relationship to bone mineraldensity and spinal osteophytosis in elderly men and women. OsteoporosisInternational, 1996, 6:233–239.
49. O'Neill TW et al. The prevalence of vertebral deformity in European men andwomen: the European Vertebral Osteoporosis Study. Journal of Bone and MineralResearch, 1996, 11:1010–1018.
50. Ross PD et al. Vertebral fracture prevalence in women in Hiroshima compared toCaucasians or Japanese in the U.S. International Journal of Epidemiology, 1995,24:1171–1177.
51. Lau EMC et al. Normal ranges for vertebral height ratios and prevalence ofvertebral fracture in Hong Kong Chinese: a comparison with AmericanCaucasians. Journal of Bone and Mineral Research, 1996, 11:1364–1368.
52. Clark, P. Prevalence of vertebral fractures in Brazil, Puerto Rico and Mexico.Preliminary report of the Latin American Vertebral Osteoporosis Study LAVOS.
46

Journal of Bone and Mineral Research, 2004, 19(Suppl. 1):S87.
53. Jacobsen SJ et al. Hospitalization with vertebral fracture among the aged: anational population-based study, 1986-1989. Epidemiology, 1992, 3:515–518.
54. Bauer RL, Deyo RA. Low risk of vertebral fracture in Mexican American women.Archives of Internal Medicine, 1987, 147:1437–1439.
55. Felsenberg D et al. Incidence of vertebral fracture in Europe: results from theEuropean Prospective Osteoporosis Study Epos. Journal of Bone and MineralResearch, 2002, 17:716–724.
56. Black DM et al. A new approach to defining vertebral dimensions. Journal of Boneand Mineral Research, 1991, 6:883–892.
57. Van der Klift M et al. The incidence of vertebral fractures in men and women: theRotterdam Study. Journal of Bone and Mineral Research, 2002, 17:1051–1056.
58. Kung AWC. Epidemiology and diagnostic approaches to vertebral fractures inAsia. Journal of Bone and Mineral Research, 2004, 22:170–175.
59. Finnern HW, Sykes DP. The hospital cost of a vertebral fracture in the EU:estimates using national data sets. Osteoporosis International, 2003, 14:429–436.
60. Nevitt MC, Cummings SR, Study of Osteoporotic Fractures Research Group.Type of fall and risk of hip and wrist fractures: the study of osteoporotic fractures.Journal of the American Geriatric Society, 1993, 41:1226–1230.
61. Griffin MR et al. Black-white differences in fracture rates. American JournalEpidemiology, 1992, 136:1378–1385.
62. Baron JA et al. Racial differences in fracture risk. Epidemiology, 1994, 5:42–47.
63. Hagino H et al. The incidence of fractures of the proximal femur and the distalradius in Tottori prefecture, Japan. Archives of Orthopedic Trauma Surgery, 1990,109:43–44.
64. Adebajo A, Cooper C, Evans JG. Fracture of the hip and distal forearm in WestAfrica and the United Kingdom. Age Ageing, 1991, 20:435–438.
65. Singer BR et al. Epidemiology of fracture in 1000 adults: the influence of age andgender. Journal of Bone and Joint Surgery, 1998, 80B:234–238.
66. Sanders KM et al. Health burden of hip and other fractures in Australia beyond2000: projections based on the Geelong Osteoporosis Study. Medical Journal ofAustralia, 1999, 170:467–470.
67. Cooper C, Campion G, Melton LJ III. Hip fractures in the elderly: a world-wideprojection. Osteoporosis International, 1992, 2:285–289.
68 Gullberg B, Johnell O. Kanis JA. World-wide projections for hip fracture.Osteoporosis International, 1997, 7:407–413.
69. Thomsen K, Gotfredsen A, Christiansen C. Is postmenopausal bone loss an agerelated phenomenon. Calcified Tissue International, 1996, 39:123–127.
70. Kanis JA et al. Long-term risk of osteoporotic fracture in Malmo. OsteoporosisInternational, 2000, 11:669–674.
71. Clark P et al. Incidence rates and life-time risk of hip fractures in Mexican’s over50 years of age: a population-based study. Osteoporosis International, 2005,16:2025–2030.
47

72. Zebaze RM, Seeman E. Epidemiology of hip and wrist fractures in Cameroon,Africa. Osteoporosis International, 2003, 14:301–305.
73. Oden A et al. Lifetime risk of hip fractures is underestimated. OsteoporosisInternational, 1998, 8:599–603.
74. Browner WS et al. Mortality following fractures in older women. Archives ofInternal Medicine, 1996, 156:1521–1525.
75. Browner WS et al. Non-traumatic mortality in elderly women with low bonemineral density. Lancet, 1991, 338:355–358.
76. Gardsell P, Johnell O. Bone mass – a marker of biological age? ClinicalOrthopaedics, 1993, 287:90–93.
77. Johansson C et al. Bone mineral density is a predictor of survival. Calcified TissueInternational, 1998, 63:190–196.
78. Cauley JA et al. Risk of mortality following clinical fractures. OsteoporosisInternational, 2000, 11:556–561.
79. Center JR et al. Mortality after all major types of osteoporotic fracture in men andwomen: an observational study. Lancet, 1999, 353:878–882.
80. Cooper C et al. A population based study of survival after osteoporotic fractures.American Journal of Epidemiology, 1993, 137:1001–1005.
81. Forsen L et al. Survival after hip fracture: short and long-term excess mortalityaccording to age and gender. Osteoporosis International, 1999, 10:73–78.
82. Ismail AA et al. Mortality associated with vertebral deformity in men and women:results from the European Prospective Osteoporosis Study (EPOS). OsteoporosisInternational, 1998, 8:291–297.
83. Kado DM et al. Vertebral fractures and mortality in older women. Archives ofInternal Medicine, 1999, 159:1215–1220.
84. Melton LJ III, Therneau TM, Larsen DR. Long-term trends in hip fractureprevalence: the influence of hip fracture incidence and survival. OsteoporosisInternational, 1998, 8:68–74.
85. Sernbo I, Johnell O. Consequences of a hip fracture: a prospective study overone year. Osteoporosis International, 1993, 3:148–153.
86. Parker MJ, Anand JK. What is the time mortality of hip fractures. Public Health,1991, 105: 443–446.
87. Jalava T et al. Association between vertebral fracture and increased mortality inosteoporotic patients. Journal of Bone and Mineral Research, 2003, 18:1254–1260.
88. Kanis JA et al. Excess mortality after hospitalisation for vertebral fracture.Osteoporosis International, 2004, 15:108–112.
89. Johnell O et al. Mortality after osteoporotic fractures. Osteoporosis International,2004, 15:38–42.
90. Todd C et al. Differences in mortality after fracture of the hip. British MedicalJournal, 1995, 310:904–908.
91. Kanis JA et al. The components of excess mortality after hip fracture. Bone, 2003,32:468–473.
48

92. Johnell O, Kanis JA. An estimate of the worldwide prevalence, mortality anddisability associated with hip fracture. Osteoporosis International, 2004,15:897–902.
93. Todd C et al. Anglican audit of hip fracture II. Oxford, Institute of Public Health,University of Cambridge, 1999.
94. Johnell O, Haglund B. Comorbidity and mortality in hip fracture patients: thepopulation based study. Journal of Bone and Mineral Research, 1999, 14(Suppl.1):S160.
95. Nevitt MC et al. Effect of alendronate on limited activity days and bed disabilitydays caused by back pain in postmenopausal women with existing vertebralfractures. Archives of Internal Medicine, 2000, 160:77–85.
96. Nevitt MC et al. The association of radiographically detected vertebral fractureswith back pain and function: a prospective study. Annals of Internal Medicine,1998, 128:793–800.
97. Leidig G et al. A study of complaints and their relation to vertebral destruction inpatients with osteoporosis. Bone and Mineral, 1990, 8:217–229.
98. Ross PD et al. Pain and disability associated with new vertebral fractures andother spinal conditions. Journal of Clinical Epidemiology, 1994, 47:231–239.
99. Gold DT. The clinical impact of vertebral fractures: quality of life in women withosteoporosis. Bone, 1996, 18(Suppl. 3):185s–189s.
100. Lips P et al. Quality of life as outcome in the treatment of osteoporosis: thedevelopment of a questionnaire for quality of life by the European Foundation forOsteoporosis. Osteoporosis International, 1997, 7:36–38.
101. Hunt S, McEwen J, McKenna SP. Measuring health status: a new tool forclinicians and epidemiologists. Journal of the College General Practitioners, 1985,35:185–188.
102. Bergner M et al. The sickness impact profile: development and final revision of ahealth status measure. Medical Care, 1981, 19:787–805.
103. Ware JE, Kosinski M, Keller SD. SF-36 physical and mental health summaryscales: a user’s manual. Boston, MA, Health Institute, 1994.
104. Brazier JE et al. Validating the SF-36 health survey questionnaire: new outcomemeasures for primary care. British Medical Journal, 1992, 305:160–164.
105. Kind P et al. Variations in population health status: results from a United Kingdomnational questionnaire survey. British Medical Journal, 1998, 316:736–741.
106. Fitzpatrick R et al. Quality of life measures in health care I: applications and issuesin assessment. British Medical Journal, 1992, 305:1074–1077.
107. Fletcher A et al. Quality of life measures in health care II: design, analysis andinterpretation. British Medical Journal, 1992, 305:1145–1148.
108. Lips P et al. Quality of life in patients with vertebral fractures: validation of thequality of life questionnaire of the European Foundation for Osteoporosis(QUALEFFO). Osteoporosis International, 1999, 10:150–160.
109. Cook DJ et al. Quality of life issues in women with vertebral fractures due toosteoporosis. Arthritis and Rheumatism, 1993, 36:750–756.
110. Osteoporosis Quality of Life Study Group. Measuring quality of life in women withosteoporosis. Osteoporosis International, 1997, 7:478–487.
49

111. Helmes E et al. A questionnaire to evaluate disability in osteoporotic patients withvertebral compression fractures. Gerontology Medical Science, 1995,50A:M91–M98.
112. Lydick E et al. Development and validation of a discriminative quality of lifequestionnaire for osteoporosis (the OPTQoL). Journal of Bone and MineralResearch, 1997, 12:456–463.
113. Chandler JM et al. Reliability of an osteoporosis-targeted quality of life surveyinstrument for use in the community: OPTQoL. Osteoporosis International, 1998,8:127–135.
114. Randell AG et al. Quality of life in osteoporosis: reliability, consistency and validityof the osteoporosis assessment questionnaire. Journal of Rheumatology, 1998,25:1171–1179.
115. Marquis R, Cialdella P, De La Loge C. Development and validation of a specificquality of life module for postmenopausal women with osteoporosis: the Qualiost.Quality of Life Research, 2001, 10:555–566.
116. Lips P, van Schoor NM. Quality of life in patients with osteoporosis. OsteoporosisInternational, 2005, 16:447–455.
117. Magaziner J et al. Predictors of functional recovery one year following hospitaldischarge for hip fracture: a prospective study. Journal of Gerontolology, 1990,45:M101–M107.
118. Cooper C. The crippling consequences of fractures and their impact on quality oflife. American Journal of Medicine, 1997, 103(Suppl. 2A):12S–19S.
119. Marottoli RA, Berkman LF, Cooney LM. Decline in physical function following hipfracture. Journal of the American Gerontology Society, 1992, 40:861–866.
120. Norton R et al. Declines in physical functioning attributable to hip fracture amongolder people: a follow-up study of case-control participants. DisabilityRehabilitation, 2000, 22:345–351.
121. Pluijm SMF et al. Consequences of vertebral deformities in older men andwomen. Journal of Bone and Mineral Research, 2000, 15:1564–1572.
122. Oleksik AM et al. Impact of incident vertebral fractures on health related qualityof life (HRQOL) in postmenopausal women with prevalent vertebral fractures.Osteoporosis International, 2005, 16:861–870.
123. Silverman SL et al. The relationship of health-related quality of life to prevalentand incident vertebral fractures in postmenopausal women with osteoporosis:results from the Multiple Outcomes of Raloxifene Evaluation Study. Arthritis andRheumatism, 2001, 44:2611–2619.
124. Cook DJ, Guyatt GH, Adachi JD. Measuring quality of life in women withosteoporosis. Osteoporosis International, 1997, 7:478–487.
125. Cook DJ et al. Development and validation of the Mini-Osteoporosis Quality ofLife Questionnaire (OQLQ) in osteoporotic women with back pain due to vertebralfractures. Osteoporosis Quality of Life Study Group. Osteoporosis International,1999, 10:207–213.
126. Cockerill W et al. Health-related quality of life and radiographic vertebral fracture.Osteoporosis International, 2004, 15:113–119.
127. Oleksik A. Vertebral fractures in postmenopausal women with osteoporosis [thesis].Amsterdam, Free University, 2001.
50

128. Greendale GA et al. Late physical and functional effects of osteoporotic fracturein women: the Rancho Bernardo study. Journal of the American Geriatric Society,1995, 43:955–961.
129. Tosteson ANA. Quality of life in the economic evaluation of osteoporosisprevention and treatment. Spine, 1997, 22:58S–62S.
130. Tosteson ANA et al. Impact of hip and vertebral fractures on quality-adjusted lifeyears. Osteoporosis International, 2001, 12:1042–1049.
131. Dolan P. Modeling valuations for EuroQol health states. Medical Care, 1997,35:1095–1108.
132. Dolan P, Torgerson D, Kumar Kakarlapadi T. Health-related quality of life in Collesfracture patients. Osteoporosis International, 1999, 9:196–199.
133. Gabriel SE et al. Health-related quality of life in economic evaluations forosteoporosis: whose values should we use? Medical Decision Making,1999,19:141–148.
134. Brazier J, Green C, Kanis JA, on behalf of the Committee of Scientific Advisors,International Osteoporosis Foundation. A systematic review of health state utilityvalues for osteoporosis. Osteoporosis International, 2002, 13:768–776.
135. Cranney A et al. A review of economic evaluation in osteoporosis. Arthritis Careand Research, 1999, 12:425–434.
136. Salkeld G et al. Quality of life related to fear of falling and hip fracture in olderwomen: a time trade off study. British Medical Journal, 2003, 320:241–246.
137. National Osteoporosis Foundation. Osteoporosis: cost-effectiveness analysisand review of the evidence for prevention, diagnosis and treatment. OsteoporosisInternational, 1998, 8(Suppl. 4):S1–S88.
138. Kwaliteitsinstituut voor de Gezondheidszorg CBO, Osteoporose Tweede HerzieneRichtlijn [Osteoporosis, second revision], Utrecht 2002(www.cbo.nl/product/richtlijnen/ , accessed 14 November 2006). Englishsummary in: Pols HA Wittenberg J. CBO guideline: osteoporosis. NederlandsTijdschrift voor Geneeskunde, 2002, 146:1359–1363.
139. Bone health and osteoporosis: a report of the Surgeon General. Rockville, MD, UnitedStates Department of Health and Human Services, Office of the Surgeon General,2004.
140. De Laet CE et al. Kosten wegens osteoporotische fracturen in Nederland;mogelijkheden voor kostenbehersing [Costs due to osteoporosis-inducedfractures in the Netherlands: possibilities for cost control]. Nederlands Tijdschriftvoor Geneeskunde, 1996, 140:1684–1688.
141. Lau EMC et al. Vertebral deformity in Chinese men: prevalence, risk factors, bonemineral density and body composition measurement. Calcified TissueInternational, 2000, 66:47–52.
142. Johnell O. The socioeconomic burden of fractures: today and in the 21st century.American Journal of Medicine, 1997, 103(Suppl. 2A):20S–25S; discussion25S–26S.
143. Randell A et al. Direct clinical and welfare costs of osteoporotic fractures inelderly men and women. Osteoporosis International, 1995, 5:427–432.
144. Ray NF et al. Medical expenditures for the treatment of osteoporotic fractures inthe United States in 1995: report from the National Osteoporosis Foundation.
51

Journal of Bone and Mineral Research, 1997,12:24–35.
145. Fox N et al. Medical expenditures for the treatment of osteoporotic fractures inthe United States in 1995: report from the National Osteoporosis Foundation.Journal of Bone and Mineral Research, 1997,12:24–35.
146. Murray CJL, Lopez AP. Global and regional descriptive epidemiology of disability:incidence, prevalence, health expectancies and years lived with disability. In:Murray CJL, Lopez AD, eds. The global burden of disease: a comprehensiveassessment of mortality and disability from diseases, injuries and risk factors in 1990 andprojected to 2020. Cambridge, Cambridge University Press, 1996:201–246.
147. Murray CJL. Rethinking DALYs. In: Murray CJL, Lopez AD, eds. The global burdenof disease. Geneva, World Health Organization, 1996:1–89.
148. Cooper C, Melton LJ III. Magnitude and impact of osteoporosis and fractures. In:Marcus R, Feldman D, Kelsey J eds. Osteoporosis. San Diego, CA, AcademicPress, 1996: 414–434.
149. Christodoulou C, Cooper C. What is osteoporosis? Postgraduate Medical Journal,2002, 79:133–138.
150. Kanis JA, Johnell O, on behalf of the Committee of Scientific Advisors of theInternational Osteoporosis Foundation. Requirements for DXA for themanagement of osteoporosis in Europe. Osteoporosis International, 2005,16:229–238.
151. Obrant KJ et al. Increasing age-adjusted risk of fragility fractures: a sign ofincreasing osteoporosis in successive generations? Calcified Tissue International,1989, 44:157–167.
152. Naessén T et al. Time trends in incidence rates of first hip fracture in the Uppsalahealth care region, Sweden, 1965–1983. American Journal of Epidemiology, 1989,130:289–299.
153. Spector TD, Cooper C, Lewis AF. Trends in admission for hip fracture in Englandand Wales, 1968-85. British Medical Journal, 1990, 300:1173–1174.
154. Lau EMC. Admission rates for hip fracture in Australia in the last decade: the NewSouth Wales scene in a world perspective. Medical Journal of Australia, 1993,158:604–606.
155. Ahlborg GH et al. Prevalence of low bone mass in women: secular trends over 30years. Journal of Bone and Mineral Research, 2004, 19(Suppl. 1):S49.
156. Joakimsen R, Magnus J, Fonnebo V. Physical activity and predisposition for hipfractures: a review. Osteoporosis International, 1997, 7:503–513.
157. Berard A, Bravo G, Gauthier P. Meta-analysis of the effectiveness of physicalactivity for the prevention of bone loss in postmenopausal women. OsteoporosisInternational, 1997, 7:331–337.
158. Martyn CN, Cooper C. Prediction of burden of hip fracture. Lancet, 1999,353:769–770.
159. Lopez Vaz A. Epidemiology and costs of osteoporotic hip fractures in Portugal.Bone, 1993, 14(Suppl. 1):S9.
160. Woolf AD, Akesson K. Preventing fractures in elderly people. British MedicalJournal, 2003, 327:89–95.
52

161. Dolan P, Torgerson DJ. The cost of treating osteoporotic fractures in the UnitedKingdom female population. Osteoporosis International, 1998, 8:611–617.
162. Kanis JA et al. Treatment of established osteoporosis: a systematic review andcost-utility analysis. Health Technology Assessment, 2002, 6:1–146.
163. Polder JJ et al. Costs of disease in the Netherlands 1994. Rotterdam, ErasmusUniversiteit, Instituut Maatschappelijke Gezondheidszorg, Instituut voorMedische Technology Assessment, 1997:1–295.
164. Kanis JA, McCloskey EV. Epidemiology of vertebral osteoporosis. Bone, 1992,13:S1–S10.
165. Lindsay R, Burge RT, Strauss DM. One year outcomes and costs following avertebral fracture. Osteoporosis International, 2005, 16:78–85.
3. Measurement of bone mineral and definition ofosteoporosisThe internationally agreed description of osteoporosis is: “A systemicskeletal disease characterised by low bone mass and microarchitecturaldeterioration of bone tissue with a consequent increase in bone fragility andsusceptibility to fracture” (1,2). This description captures the notion that lowbone mass is an important component of the risk of fracture, but that otherabnormalities occur in the skeleton that contribute to skeletal fragility. Thus,ideally, clinical assessment of the skeleton should capture all these aspects offracture risk. At present, the assessment of bone mineral is the only aspectthat can be readily measured in clinical practice, and it forms the cornerstonefor the general management of osteoporosis. The objectives of bone mineralmeasurements are to provide diagnostic criteria, prognostic information onthe probability of future fractures, and a baseline on which to monitor thenatural history of the treated or untreated patient.A wide variety of techniques is available to assess bone mineral. These arereviewed briefly below.
3.1 Methods of assessmentBone mineral density (BMD) is the amount of bone mass per unit volume(volumetric density), or per unit area (areal density), and both can bemeasured in vivo by densitometric techniques. The most widely usedtechniques are based on X-ray absorptiometry in bone, since the absorptionof X-rays is particularly sensitive to the calcium content of the tissue, ofwhich bone is the most important source. Techniques using quantitativeultrasound (QUS) provide information on the attenuation of ultrasound orthe speed of sound in skeletal tissue. Thus, the determinants of QUS arequite different from X-ray attenuation. Ultrasound variables depend not onlyon bone mineral, but also the microstructure, anisotropy, or elasticity of themineralized matrix. It can be expected, therefore, that results derived fromQUS or BMD – even from the same site – do not correlate perfectly, partlybecause of the different aspects of skeletal status that are captured and thedifferent sources of error.
53

Techniques for the measurement of bone mineral can be divided into centraltechniques that give information on the spine or hip, and peripheraltechniques applied to the forearm and bones of the hand, leg and foot.
3.1.1 Central techniquesDual energy X-ray absorptiometry Dual energy X-ray absorptiometry (DXA) is the most widely used bonedensitometric technique. It is versatile in the sense that it can be used to assessbone mineral content of the whole skeleton as well as specific sites, includingthose most vulnerable to fracture (3–5). The term “bone mineral content”describes the amount of mineral in the specific bone site scanned. Bonemineral content can then be used to derive a value for BMD by dividing theamount of mineral by the area measured. BMD is, therefore, an areal density(g/cm2) rather than a true volumetric density (g/cm3) since the scan is two-dimensional.
The widespread clinical use of DXA, particularly at the proximal femur andlumbar spine, arises from many prospective studies that have documented astrong gradient of risk for fracture prediction. For example, a widely citedmeta-analysis (6) indicated that the risk of hip fracture increased 2.6-fold foreach standard deviation decrease in BMD. This gradient of risk is better thanmany other techniques, and the use of central DXA predicts other types offracture with as high a gradient of risk as other competing techniques.
DXA measurements at the hip have particular utility in the diagnosis ofosteoporosis (see later), but measurements at the lumbar spine are also widelyused. In early postmenopausal women in whom vertebral fractures arecommon, vertebral fractures may be predicted with greater effect bymeasurements at the lumbar spine than with measurements made at the hip.With advancing years, however, osteoarthritis progressively confoundsmeasurements in the spine. Notwithstanding, spinal measurements aresensitive to treatment-induced changes, and the spine represents the mostwidely used site for monitoring the response to treatment. The use of DXAtechniques on the lateral spine rather than in the customary postero-anteriorprojection further improves the responsiveness of the measurement totreatment-induced changes, but at the expense of precision. Lateral DXAmay, however, have advantages in subjects with marked degenerative changes.
There are a number of limitations to the general application of DXA whichshould be recognized in its use (7) (Table 3.1). The presence of osteomalacia,a complication of poor nutrition in elderly people, will underestimate totalbone mass because of decreased mineralization of bone. Osteoarthrosis atthe spine or osteoarthritis at the hip are common in elderly people, andcontribute to the density measurement, but not necessarily to skeletalstrength. Heterogeneity of density attributable to osteoarthrosis, previousfracture or scoliosis can often be detected on the scan and in some casesexcluded from the analysis. Some of these problems can be overcome with
54

adequately trained staff and rigorous quality control. As mentioned, theimage is two-dimensional and therefore provides an areal BMD rather thana volumetric BMD. The computation of BMD is sensitive to changes in bonesize. For example, areal bone density will overestimate volumetric bonedensity in individuals with large bones. In adults, this error is fortuitouslybeneficial since larger bones in general have higher strength. Thus, this“error” may improve fracture prediction in adults.
Table 3.1 Sources of error in the diagnosis of osteoporosis by dual energy X-ray absorptiometry (DXA)
Osteomalacia
Osteoarthritis (particularly spine but also the hip)
Soft tissue calcification (especially aortic calcification for spine measurements)
Overlying metal objects
Contrast media and recent technecium-99m bone scan
Previous fracture (spine, hip and wrist)
Severe scoliosis
Extreme obesity or ascites
Vertebral deformities attributable to osteoarthritis, Scheuermann disease
Inadequate reference ranges
Inadequate operating procedures (e.g. calibration, region selection, acquisition mode, positioning)
Source: reference 7 (Table 3).
The vast amount of information available for central DXA has meant that ithas now become the reference standard. The adoption of DXA as a referencestandard provides a platform on which the performance characteristics ofless well established methods can be compared.
Quantitative computed tomographyQuantitative computed tomography (QCT) has been applied both to theappendicular skeleton and to the spine (8,9). Conventional whole-body CTscanners, which typically generate density information in terms ofHoundsfield units, need calibration to convert their results into units relevantto bone mineral density. QCT allows the assessment of skeletal status ofcancellous bone of the vertebral bodies from the twelfth thoracic to thefourth lumbar vertebra. The patient is usually scanned simultaneously with acalibration phantom which can be used to standardize the machineautomatically. The major advantage of QCT is that, in the assessment ofcancellous bone, the result provides a measure of true volumetric density(mg/mm3) rather than an area-adjusted result as is the case with DXA. Thetechnique is thus one of the most sensitive techniques for the assessment ofearly postmenopausal skeletal losses. Indeed, case-control studies have shownbetter discrimination of fractures cases and unfractured controls using QCTcompared to DXA. Cancellous bone is more responsive to manyinterventions than cortical bone, so the technique is also suitable for
55

monitoring treatment (3). The technique avoids the influence ofdegenerative disease, which is a particular problem with DXA at the spine. Itis also free from the artefact of bone size, but is not accurate with metallicobjects in the scan field of view.
QCT radiation levels are somewhat higher than for DXA. In adults, radiationexposure is smaller than the radiation dose required for antero-posterior andlateral spine X-rays (typically 500–1500 mSv). Newer approaches available onspiral CT scanners permit the measurement of volumetric BMD at higherlevels of spatial resolution and are capable of generating three-dimensionalimages of the disposition of trabecular elements in cancellous bone, but atthe expense of a higher radiation dose. The technique has been successfullyapplied on a research basis at the proximal femur, and may be available in thefuture for clinical use.
The major disadvantage with QCT is the relatively high radiation exposurecompared to DXA, difficulties with quality control and the high costscompared with DXA.
3.1.2 Peripheral techniquesPeripheral DXAThe application of DXA to peripheral sites has supplanted the use of singleenergy absorptiometry either based on X-rays or single photonabsorptiometry. The sites most widely measured include the radius and thecalcaneus. Both sites have been shown to predict future fractures, but thepredictive value for hip fracture is somewhat less than that provided bycentral DXA measurements.
Dual X-ray laser is a variant of peripheral DXA. A laser is used to measurethe thickness of the calcaneus and thereby reduces accuracy errorsattributable to variable soft tissue thickness. Early validation studies havebeen published (10,11).
Peripheral QCTPeripheral QCT measurements are typically obtained at the radius or thetibia (12). As in the case for spinal QCT, cancellous bone can be evaluatedselectively. Recently high resolution QCT has permitted quantitation oftrabecular numbers and disposition in cancellous bone. There is, however, alack of prospective studies on which to judge the performance characteristicsof peripheral QCT for fracture risk assessment. In addition, biomechanicallyrelevant properties of bone can be computed, such as the areal moment ofinertia and other indices of bone strength. It is, however, uncertain whetherthese additional measurements provide greater clinical value in the predictionof fracture risk.
56

Digital X-ray radiogrammetryStandardized radiographs of the hand and forearm, including the radius andmetacarpals, provide the basis for digital X-ray radiogrammetry. The mostwidely applied technique is the estimation of cortical width, most commonlyapplied to the 2nd, 3rd and 4th metacarpals (13). The size of tubular bonesincreases with age, and thinning of the cortex represents an increase in netendocortical bone resorption. The cortical width divided by the total widthor the cortical area divided by the total cross-sectional area are commonlyused indices. Evaluation can be improved by magnification and the use offine grain films, and can be semi-automated (14).
Automated image processing techniques have been developed to measure avariety of structure-related features (15). Mathematical modelling allowsestimation of areal BMD and in some instances some aspects of bonestructure (16,17). Direct comparisons with central DXA suggest that thetechnique has predictive ability for fracture risk, but perhaps with a lowerpredictive value. Nonetheless, these low cost techniques have the potential forwidespread application where access to more sophisticated technology islimited.
Radiographic absorptiometryRadiographic absorptiometry has been established for a long time. Thetechnique allows the measurement of BMD either by digitizing conventionalradiographs, or by directly measuring X-ray absorption using coupled devicesas detectors. An index of mineral density is derived by comparing theabsorption with appropriate standards. Measurement sites include peripheralbones like the phalanges or metacarpals (14). Central processing ofradiographs has been used to improve quality control.
3.1.3 Other radiographic techniquesThe diagnosis of osteoporosis can often be made from visual inspection ofplain radiographs, albeit with low sensitivity. There are also a number ofcharacteristic features of osteoporosis which help in diagnosis, or indifferential diagnosis (18).
In many regions of the world, X-rays will be the sole assessment toolavailable. A decrease in the apparent density of bone is not specific forosteoporosis and is more appropriately termed osteopenia. In addition toosteopenia, osteoporosis is associated with abnormalities in the trabeculararchitecture of bone, a decrease in cortical width and visible evidence of pastfractures. Fractures are particularly prominent in the spine, and of thevertebral deformities seen on X-ray approximately one third will come toclinical attention (see section 2).In postmenopausal osteoporosis, trabecular number decreases. Theremaining trabeculae hypertrophy, particularly the vertebral trabeculae. Thepreferential loss of horizontal trabeculae relative to vertical trabeculae givesrise to a striated appearance. These changes in trabecular markings differ
57

from those observed in glucocorticoid-induced osteoporosis or inosteomalacia, where trabecular markings usually become indistinct, givingrise to a fuzzy or ground glass appearance. In glucocorticoid inducedosteoporosis, pseudo-callus may also be found in the absence of overtvertebral deformities. It is important to recognize that abnormalities invertebral shape are not invariably a result of osteoporosis. Common othercauses include osteoarthrosis and Scheuermann disease.
The proximal femur has a distinctive pattern of trabecular architecture,which is disturbed in the course of osteoporosis. The pattern of loss providesa semi-quantitative estimate of trabecular losses (19) that can be used topredict hip fracture.
3.1.4 Quantitative ultrasound techniquesMany quantitative ultrasound (QUS) methods have been introduced for theassessment of skeletal status in osteoporosis. The most widely evaluatedassessments are broadband ultrasound attenuation and speed of sound (orultrasound velocity) at the heel. There is interest in their use because they donot involve ionizing radiation and may provide some information concerningthe structural organization of bone as well as bone mass. In addition, thetechniques are easily portable and may be cheaper than DXA. This makesQUS an attractive technology for assessing risk of fracture in largerpopulations, where use of DXA may be unsuitable or unfeasible.
Transverse transmission QUS of the calcaneusThe calcaneus is the most commonly measured site and comprises largelycancellous bone. In experimental settings, the technique captures somestructural aspects, as shown from scans undertaken in different axes of cubesof bone (20). In the clinical setting, however, both speed of sound andbroadband ultrasound attenuation largely reflect calcaneal BMD. Theperformance of these QUS techniques has been evaluated in a large numberof studies (21,22). The technique cannot currently provide diagnosticcriteria for osteoporosis, but current evidence supports its use for theassessment of fracture risk in elderly women where the prognostic value offuture hip fracture is as good as several other peripheral measurements(23,24). Indeed, in elderly people, QUS may perform as well as central DXA(25–28). It also appears to predict hip fracture and non-spine fracture in men(29). Since calcaneal QUS has not been used as an entry criterion in largerandomized control studies of treatment, it is not proven that patientsselected on the basis of low QUS results would benefit from treatment.
Transverse transmission of QUS of the phalangesA substantial body of evidence has accumulated for the utility of this site. Inthe phalanges, amplitude dependent speed of sound is typically assessed,which integrates both attenuation and speed of sound. Cross-sectionalstudies have, with few exceptions, shown that fracture cases can bediscriminated from controls, though not as well as by central DXA
58

techniques (30,31). A small prospective study has also shown the predictivevalue of the technique for incident appendicular fractures (32). Some, butnot all, studies show that the technique can detect treatment-inducedchanges, but further studies are required. The use of the technique fordiagnostic criteria is problematic since there is a relatively weak correlation ofmeasured values with those obtained by DXA at the femoral neck.
Axial transmission of QUSAxial transmission techniques rely on the placing of transducers on the samesurface of a long bone such as the radius, the phalanges or the metacarpals.The ultrasound wave travels along the cortex and thus the technique isdependent upon the cortical properties of bone. Confounding effects of softtissues can be minimized by arrays of multiple pairs of transducers in thesame probe. The technique has shown some validity in cross-sectional studies(33–35).
3.2 Performance characteristics of bone mineral measurementsThe performance characteristics of many measurement techniques have beenwell documented (6,21,36). For the purpose of risk assessment and fordiagnosis, the characteristic of major importance is the ability of a techniqueto predict fractures. This is traditionally expressed as the increase in relativerisk per standard deviation (SD) unit decrease in bone mineralmeasurements. This is termed the gradient of risk.
There are significant differences in the performance of different techniques atdifferent skeletal sites. In addition, the performance depends on the type offracture that is to be predicted (6). For example, BMD assessments by DXAto predict hip fracture are better when measurements are made at the hiprather than at the spine or forearm (Table 3.2). For the prediction of hipfracture, the gradient of risk provided by hip BMD is 2.6. In other words, thefracture risk increases 2.6-fold for each SD decrease in hip BMD. Thus, anindividual with a Z-score of –3 at the hip would have a 2.63 or greater than15-fold higher risk than an individual of the same age with a Z-score of 0 SD.Where the intention is to predict any osteoporotic fracture, the commonlyused techniques are comparable: the risk of fracture increases approximately1.5-fold for each standard deviation decrement in the measurement. Thus, anindividual with a measurement of 3 SD below the average value for age wouldhave a 1.53 or greater than 3-fold higher risk than an individual with anaverage BMD. Note that the risk of fracture in individuals with an averageBMD is lower than the average fracture risk, since BMD is normallydistributed whereas the risk of fracture increases exponentially withdecreasing BMD.
These considerations indicate the importance of gradient of risk. Consider,for example, two techniques which at the same site give a gradient for hipfracture risk of 1.5 and 2.6, as illustrated above. Assume that it might beconsidered desirable to intervene in individuals with a risk of hip fracture
59

that was four times that of individuals with an average BMD. In the formerscenario with a gradient of risk of 1.5/SD, almost no patients at the age of 60years would exceed this risk and be selected for treatment, but a substantialminority would be detected using a test with the higher gradient of risk. Theformalization of the relationship between gradient of risk and the populationselected is considered in section 6.
Table 3.2 Age-adjusted increase in risk of fracture (with 95% confidence interval) in women for every1 SD decrease in bone mineral density (by absorptiometry) below the mean value for age
Site of Forearm Hip Vertebral All fracturesmeasurement fracture fracture fracture
Distal radius 1.7 (1.4–2.0) 1.8 (1.4–2.2) 1.7 (1.4–2.1) 1.4 (1.3–1.6)
Femoral neck 1.4 (1.4–1.6) 2.6 (2.0–3.5) 1.8 (1.1–2.7) 1.6 (1.4–1.8)
Lumbar spine 1.5 (1.3–1.8) 1.6 (1.2–2.2) 2.3 (1.9–2.8) 1.5 (1.4–1.7)
Source: reference 6 (adapted from Table 2).
A further point of relevance is the level of evidence on which informationabout performance characteristics has been obtained. The most secure levelof evidence comes from population-based prospective studies. Less reliancecan be placed on retrospective cohort studies and cross-sectional or case-control studies. The grading of levels of evidence for prognostic risk factors,including BMD, is reviewed in section 6.
The gradient of risk depends on the technique used, the site measured andthe fracture of interest. In general, site-specific measurements show highergradients of risk for fractures at their respective sites. For example,measurements at the hip predict hip fracture with greater power than domeasurements at the heel, lumbar spine or forearm (6,37). For othercombinations of measurement sites and fractures, gradients of risk rangefrom 1.5 to 3.0 for each standard deviation decrease in bone mineralmeasurement (see Table 3.2). The performance characteristics of ultrasoundare similar. Most studies suggest that measurements of broadbandultrasound attenuation or speed of sound at the heel are associated with a1.5-fold to 2-fold increase in risk for each standard deviation decrease in bonemineral density (21). Comparative studies indicate that these gradients ofrisk are very similar to those provided by peripheral assessment of bonemineral density at appendicular sites by absorptiometric techniques topredict any osteoporotic fracture (6,38).
3.3 Definition of osteoporosisSkeletal mass and density remain relatively constant once growth has ceased,until the age of 50 years or so (39). The distribution of bone mineral contentor density in young healthy adults (“peak bone mass”) is approximatelynormal (in a statistical sense), irrespective of the measurement techniqueused. Because of this normal distribution, bone density values in individuals
60

may be expressed in relation to a reference population in standard deviationunits. This reduces the problems associated with differences in calibrationbetween instruments. When standard deviations are calculated in relation tothe young healthy population, this is referred to as the T-score.
3.3.1 Diagnostic thresholdsThe following four general descriptive categories are proposed for men andwomen using measurements of DXA.
• Normal. A value for BMD that is higher than 1 SD below the young adult female reference mean (T-score greater than or equal to –1 SD).
• Low bone mass (osteopenia). A value for BMD more than 1 SD below the young female adult mean, but less than 2.5 SD below this value (T-score less than -1 and greater than -2.5 SD).
• Osteoporosis. A value for BMD that is 2.5 SD or more below the young female adult mean (T-score less than or equal to –2.5 SD).
• Severe osteoporosis (established osteoporosis). A value for BMD that is 2.5 SD or more below the young female adult mean in the presence of one or more fragility fractures.
The recommended reference range is the NHANES III reference database forfemoral neck measurements in women aged 20–29 years (40,41), aspreviously recommended by the International Osteoporosis Foundation(42).
These diagnostic criteria for osteoporosis are similar to those previouslyproposed by the World Health Organization in 1994 (36,43), but differ byspecifying a reference site (the femoral neck), providing a young normalreference range, and by accommodating diagnostic criteria for men. Thereasons for these clarifications are reviewed briefly below.
3.3.2 Choice of reference site and technologyThe original 1994 WHO criteria provided for diagnosis of osteoporosis at thehip, lumbar spine or forearm. With the techniques available for measuringbone mineral at that time, the prevalence of osteoporosis was roughly equalat any one of these sites. Since introduction of the operational definition ofosteoporosis, much attention has focused on its application to epidemiology,clinical trials and patient care. Several problems have emerged. The first isthat there has been a plethora of new measurement techniques applied tomany different skeletal sites. It is now clear that the same T-score derivedfrom different sites and techniques yields different information on fracturerisk. Reasons relate to differences in the gradient of risk for techniques topredict fracture (42,44), discrepancies in the population standard deviationat different sites and with different equipment (22,45), and differences in theapparent rate of bone loss with age (46). A second problem that arises is thatthe inter-site correlations, though of statistical significance, are inadequate
61

for predictive purposes (38,47,48). For example (Fig. 3.1), with a T-score of0 SD at the spine, the T-score at the hip varied from –1 to +1. The problemarises because of biological variations that occur in the composition of bonebetween sites, as well as technical errors of accuracy in the variousmeasurements (42).
Fig. 3.1Bone mineral density (BMD) T-scores measured at the total hip and lumbar spine in asequential series of post-menopausal women referred for BMD tests
Source: J.A. Kanis, unpublished data.
For these reasons, it is evident that the T-score cannot be usedinterchangeably with different techniques and at different sites. For example,in Caucasian women at the age of 60 years, the T-score may vary from –0.7to –2.5 SD, depending on the technique used (42) (Table 3.3). Theseconsiderations indicate that a reference standard should be adopted in termsof skeletal site and measurement technology for descriptive purposes. DXAis the most widely available and validated technique. Measurements at thefemoral neck have the highest predictive value for hip fracture, and this hasbeen well established in many prospective studies (6,49). Moreover, the hipis the site of highest biological relevance, since hip fracture is the dominantcomplication of osteoporosis in terms of morbidity and cost. The choice ofa reference site holds true in principle for many other multifactorial diseases.For example, in essential hypertension, measurements made at the leg maydiffer substantially from measurements made at the arm. In the field ofosteoporosis, as for hypertension, it is appropriate to select a standardizedsite for descriptive purposes. This does not preclude the use of othervalidated technologies for diagnostic use in clinical medicine, though accountshould be taken of any difference in performance characteristics.
62

Table 3.3 Estimate of the average T-score at the age of 65 years in women
Measurement T-score atsite Technique age 60 years
Spine QCT –2.5
Spine Lateral DXA –2.2
Heel Achilles –1.5
Spine DXA –1.3
Forearm DXA –1.4
Femoral neck DXA –1.2
Total hip DXA –0.9
Heel Sahara –0.7
Source: reference 42 (adapted from Table 3).QCT, quantitative computed tomography; DXA, dual energy X-ray absorptiometry.
There is, however, an argument to be made for using the total hipmeasurement, since this site has a better reproducibility than measurementsmade at the femoral neck because a larger area of bone is involved. Referencedata are also available for the total hip (41). A similar argument can be madefor the diagnostic use of measurements at the lumbar spine, which are widelyused in clinical practice. The principal reason why these sites are not currentlyfavoured as the reference standard is that their ability to predict fracture hasnot been as adequately validated as BMD measurements derived from thefemoral neck (see section 5 for further details). As mentioned, theseconsiderations should not be taken to infer that the use of other techniquesor other sites do not have clinical utility for diagnosis or prognosis where theyhave been shown to provide information on fracture risk.
In order to avoid confusion, it may be preferable to reserve the T-score for thediagnostic use of BMD measured by DXA at the femoral neck. In the caseof other sites and techniques it may be preferable that deviations ofmeasurement from normal values are expressed in the units of measurementor in units of risk (42).
3.3.3 Descriptive criteria for menSuitable diagnostic cut-off values for osteoporosis in men are less welldefined than for women. Many studies that have examined fracture risk inmen and women have come to disparate conclusions concerning therelationship between fracture risk and BMD or the gradient of risk (50–54).There are several reasons for these discrepancies. First, the relation betweenBMD and fracture risk changes with age (55,56), so that age-adjustment isrequired. Second, a difference between sexes in the gradient of risk (relativerisk per SD increase in BMD) could be the result of differences in the SD ofmeasurements. Third, data derived from referral populations of osteoporoticmen and women are likely to be biased. These difficulties are overcome bypopulation-based sampling and expressing fracture risk as a function of
63

BMD or standardized T-scores, with age adjustment. The few studiesavailable show that the risk of hip fracture is similar in men and women forany given absolute value for BMD (49,57–59). Likewise, the risk of vertebralfracture is also similar in men and women for any given BMD (52,60). Thesestudies indicate that a cut-off value for hip BMD similar to that used inwomen can be used in the description of osteoporosis in men – namely, avalue for BMD 2.5 SD or more below the average for young adult women.
3.3.4 Normative reference rangesThe prevalence of osteoporosis, as defined by the T-score, depends criticallyupon the reference range adopted. Normal ranges for DXA are available formany countries including France (47), Germany (61), the Netherlands(58,62), the United Kingdom (63–65), and several other Europeancountries (66), where the differences in mean BMD and standard deviationsare relatively small. For the proximal femur it is suggested that the UnitedStates reference data generated from the NHANES III study (41) serve as areference standard. The NHANES III data come from a large population-based study of a representative sample of the United States population. Theadoption of this reference population implies that different countries ordifferent races should not use their own reference ranges. The use of referenceranges in whites in the USA accommodates, however, the higher bone massand lower fracture risk in blacks (40).
There are differences in BMD in different regions of the world. Nevertheless,although the differences between the centres listed in Table 3.4 are highlysignificant (p<0.001 for all), they vary only by approximately one standarddeviation (67). Variations in BMD between populations appear to besubstantially less, therefore, than variations in fracture risk (see section 2.3).Age-specific and sex-specific risks of hip fracture differ more than 10-fold,even within Europe (68). These differences are very much larger than can beaccounted for by any differences in BMD between communities. Indeed, inAsia, hip fracture risk is lower than in northern Europe or the USA, butBMD is also lower (67,69,70). In view of the disparity between populationfracture risks and BMD, it is uncertain whether reference ranges drawn fromlocal populations would be of any added value. It would seem appropriate touse the large and adequately sampled NHANES reference values untilfurther research tempers this view (42). A caveat, however, is that the sameBMD in different geographic locations does not necessarily carry the samerisk of fracture.
64

Table 3.4 Mean and SD of spine and femoral neck BMD (g/cm2) adjusted using linear regression to age35 years, height 170cm and weight 70 kg in men, and age 35 years, height 160 cm and weight60 kg for women
Men Women
Spine Femoral neck Spine Femoral neck (g/cm2) (g/cm2) (g/cm2) (g/cm2)
Mean SD Mean SD Mean SD Mean SDAnkara 1.060 0.147 0.946 0.139 1.037 0.130 0.872 0.109
Beijing 1.082 0.128 0.908 0.121 1.115 0.105 0.857 0.102
Cape Town 1.077 0.172 0.898 0.131 1.109 0.150 0.864 0.115
Debrecen 0.967 0.124 0.874 0.137 1.033 0.104 0.818 0.087
Manila 1.054 0.144 0.920 0.134 1.055 0.143 0.817 0.111
Moscow 1.067 0.152 0.969 0.144 1.058 0.136 0.868 0.131
Obninsk 1.132 0.139 0.950 0.115 1.085 0.129 0.849 0.111
Santiago 1.080 0.137 0.935 0.128 1.103 0.126 0.874 0.110
Sao Paulo 0.957 0.166 0.852 0.147 0.998 0.151 0.840 0.142
Shanghai 0.992 0.103 0.832 0.094 1.000 0.117 0.793 0.105
Singapore 1.058 0.148 0.920 0.133 1.083 0.135 0.842 0.119
Toronto 1.062 0.159 0.882 0.183 1.139 0.148 0.860 0.123
Zagreb 0.998 0.144 0.854 0.110 1.042 0.099 0.850 0.114
Source: reference 67 (Table 6).
3.3.5 Prevalence of osteoporosisThe threshold for diagnosing osteoporosis using DXA at the femoral neck is0.577g/cm2 derived from the young white female population aged 20–29 yearsusing the Hologic device. Approximately 10 million men and women over theage of 50 years have osteoporosis in the United States. The prevalence ofosteoporosis in Sweden using these criteria is shown for Swedish men andwomen in Table 3.5 (71) and for various other places in Table 3.6.Approximately 6% of men and 21% of women aged 50–84 years are classifiedas having osteoporosis. The prevalence of osteoporosis in men over the age of50 years is three times less frequent than in women – comparable to thedifference in lifetime risk of an osteoporotic fracture in men and women(71). In the United States, the prevalence of osteoporosis in postmenopausalwhite women is 17% compared with 21% in the United Kingdom. Within theUSA the prevalences are 6% for black women and 14% for MexicanAmericans (40). Prevalence is approximately 8% in Canada (72). Thesedifferences may explain in part the differences in fracture rates (see section 2),and support the need for a standardized normative reference range.
65

Table 3.5 Prevalence of osteoporosis at the age intervals shown in Sweden using female-derivedreference ranges at the femoral neck
Men Women
Age range % of Number affected % of Number affected(years) population (thousand) population (thousand)
50–54 2.5 7.0 6.3 17.055–59 3.5 7.6 9.6 21.160–64 5.8 11.4 14.3 30.065–69 7.4 14.2 20.2 43.770–74 7.8 14.6 27.9 63.075–79 10.3 13.7 37.5 68.380–84 16.6 14.7 47.2 67.8
50–80 6.3 83.2 21.2 310.9
Source: reference 71 (Table 3).
Table 3.6 Prevalence (%) of osteoporosis in different regions of the world
Age (years)
Study populationa 50 60 70 80 90
MenEVOS, Europe 0.6 1.4 3.7 9.2 21.0CaMos, Canada 0.5 1.5 4.3 11.6 27.9Rotterdam, Netherlands 1.0 2.2 4.8 10.4 20.8Dubbo, Australia 0.5 1.4 4.1 11.4 28.2Rochester, USA 1.0 2.0 4.1 8.2 15.7Hiroshima, Japan 0.9 2.2 5.1 11.4 23.5All cohorts 0.6 1.7 4.3 10.4 22.6
WomenEVOS, Europe 3.8 8.5 17.9 33.9 54.6CaMos, Canada 2.9 7.8 19.1 39.8 64.9Rotterdam, Netherlands 4.0 9.2 19.8 37.6 59.4Dubbo, Australia 3.6 8.8 20.0 39.1 62.2Rochester, USA 1.9 6.2 18.8 44.8 73.9Hiroshima, Japan 5.6 10.7 19.5 32.8 49.7All cohorts 3.4 8.5 19.2 37.7 61.3a See Section 5.2.EVOS, European Vertebral Osteoporosis Study.
The use of a male reference range to denote osteoporosis would increase theapparent prevalence of osteoporosis in that group. For example, theprevalence of osteoporosis in Swedish men aged 70 years is 7.6%, butincreases to 8.6% using male values to derive the diagnostic threshold (71).
The prevalence of osteoporosis obtained using either the total hip or thefemoral neck is similar, suggesting that the total hip could eventuallysupplant the femoral neck when adequate meta-analyses have delineated theperformance of total hip BMD to estimate fracture risk. This is discussedfurther in section 5.
66

3.3.6 Measurement of multiple skeletal sitesA number of investigators favour the concurrent use of BMD at the proximalfemur and at the lumbar spine for patient assessment. Patients are defined ashaving osteoporosis on the basis of the lower of two T-scores. For example,the International Society for Clinical Densitometry recommends thatpatients who have a BMD test receive scans of both the lumbar spine and hip(72). Patients are characterized as having osteoporosis where the T-score is–2.5 SD or less at the spine, femoral neck, total hip or trochanter. Thereasons for this are not entirely clear, but may relate to the assumption thatthe combined use of two or more sites may improve prognostic ability. Thebasis for this belief is, however, erroneous as shown on theoretical grounds(4). A recent meta-analysis undertaken on seven population-based cohortsshowed that for the prediction of any osteoporotic fracture, the gradient ofrisk provided by femoral neck BMD was 1.51/SD. That provided by BMD atthe lumbar spine was 1.47/SD, and that provided by the minimum value ateither site was 1.55/SD (73). Thus, the choice of the minimum value does notimprove the gradient of risk. The same pertains to the prediction of hipfracture (73) (Table 3.7). This suggests that there is no diagnostic advantagefor combining sites in this way. The view is supported by an independentstudy of the predictive value of hip, spine or the combination for vertebralfracture risk in the placebo arm of a large multicentre intervention study ofvertebral fracture. In this instance, the combined measurement gave lowerrisk ratios than for measurements either at the lumbar spine or the femoralneck (74). In a further cross-sectional study the sensitivity for vertebralfracture was increased using the lowest T-score of each of the lumbarvertebral bodies, rather than the average value of the lumbar spine, but at theexpense of reduced specificity (75).
Table 3.7 Gradient of risk (GR) for each SD decrease in bone mineral density at the femoral neck,lumbar spine or the minimum of the two sites in men and women combined
Femoral neck Lumbar spine Minimum value
Outcome fracture GR 95% CI GR 95% CI GR 95% CI
Any fracture 1.43 1.37–1.51 1.42 1.35–1.49 1.45 1.38–1.52
Any osteoporotic fracture 1.51 1.42–1.61 1.47 1.38–1.56 1.55 1.45–1.64
Hip fracture 2.45 2.10–2.87 1.57 1.36–1.82 2.11 1.81–2.45
Vertebral fracturea 2.47 1.79–3.42 1.84 1.19–2.85 1.75 1.23–2.49
Source: reference 73 (Table 2).aRisk ratio comparing women with and without osteoporosis (74).
Selection of patients on the basis of a minimum value from two or more testswill, however, increase the number of patients selected. For example, thecorrelation coefficient between BMD at the lumbar spine and femoral neckwas 0.638 in the 19 000 patients assessed in the meta-analysis described inTable 3.6. From the correlation coefficient, if 10% of individuals in apopulation were characterized as having osteoporosis on the basis of BMDat the femoral neck, the prevalence of osteoporosis would increase to 15.3%
67

with the addition of lumbar spine measurements and taking the minimumvalue to dichotomize an osteoporotic population. Where 50% of thepopulation are characterized by a single technique to have osteoporosis, theapparent prevalence increases to 64.1% with the additional measurement.Thus, the sole effect of using this approach is to increase the apparentprevalence of osteoporosis, but not to improve fracture prediction. Theapparent prevalence would increase still further with the minimum valuefrom multiple sites. The same result can be achieved by less stringent criteriafor the definition of osteoporosis, by defining osteoporosis, for example, as aT-score of <–2.0 SD rather than <–2.5 SD. This would undermine, however,the value of a single descriptive threshold.
3.3.7 OsteopeniaProvision is still made for the description of osteopenia, but osteopeniashould not be considered to be a disease category. This is intended more fordescriptive purposes for the epidemiology of osteoporosis rather than as adiagnostic criterion. Also, the identification of osteopenia will capture themajority of individuals who will develop osteoporosis in the next 10 years.The original intention of WHO was to choose a threshold that would makeosteopenia and osteoporosis uncommon at the time of the menopause, onthe assumption that bone loss began at that time. Thus, the diagnosticcategory of a T-score between –1 SD and –2.5 SD was anticipated to captureapproximately 50% of the population. It is now evident that bone loss occursfrom the proximal femur at a much earlier age (76). If peak bone mass wereconstant up to the average age of menopause, then the expected frequency ofosteopenia would be 16% at the age of 50 years, whereas it is actually muchhigher. By the age of 50 years, the prevalence of osteopenia is 35.5% inwomen and 21.8% in men (Table 3.8) (71). The high prevalence poses someproblems in risk assessment. For example, in women at the age of 50 years, aT-score of –1 SD would carry a relative risk of 0.79 compared to the generalpopulation of the same age. This is because the general population onaverage has a T-score that is <–1 SD.
Table 3.8 The prevalence of osteopenia and the population relative risk (RR) of hip fracture at the bonemineral density threshold for osteopenia (T-score = –1 SD) at the ages shown in Swedishmen and women
Men Women
Age Prevalence Prevalence(years) (%) RR (%) RR
50 21.8 1.2 35.5 0.855 24.7 1.1 44.8 0.660 27.6 1.0 49.2 0.565 29.4 0.9 51.8 0.470 33.8 0.8 55.6 0.375 39.1 0.7 64.3 0.280 45.9 0.6 49.5 0.2
Source: reference 71(Table 4).
68

3.4 Assessment of osteoporosis3.4.1 Diagnostic approach
The same diagnostic approach should be undertaken in all patients withosteoporosis irrespective of the presence or absence of fragility fractures.However, the range of clinical and biological tests will depend on the severityof the disease, the age at presentation and the presence or absence ofvertebral fractures. The aims of the clinical history, physical examination andclinical tests are:• to exclude a disease which can mimic osteoporosis (e.g.osteomalacia, myelomatosis);
• to elucidate causes of osteoporosis and contributory factors;
• to assess the severity of osteoporosis to determine the prognosis ofthe disease, i.e. the risk of subsequent fractures;
• to select the most appropriate form of treatment;
• to perform baseline measurements for subsequent monitoring oftreatment.
The procedures that may be relevant to the investigation of osteoporosis areshown in Table 3.9. These investigations may be used to:
• establish the diagnosis of osteoporosis (e.g. DXA or X-rays);
• establish the cause (e.g. thyroid function tests for hyperthyroidism,and urinary free cortisol for Cushing syndrome);
• establish differential diagnosis (e.g. protein electrophoresis for myeloma, and serum calcium and alkaline phosphatase for osteomalacia).
Table 3.9 Routine procedures that have been proposed in the investigation of osteoporosis
* History and physical examination
* Blood cell count, sedimentation rate, serum calcium, albumin, creatinine, phosphate, alkalinephosphatase and liver transaminases
* Lateral radiograph of lumbar and thoracic spinal column
* Bone densitometry (dual energy X-ray absorptiometry, single energy X-ray absorptiometry,quantitative ultrasound, quantitative computed tomography)
* Sex hormones (particularly in men)
Investigations commonly reserved for specialist centres include measurementof the biochemical indices of bone turnover, serum parathyroid hormone,serum 25-hydroxyvitamin D, serum or urine protein electrophoresis, fastingand 24-hour urinary calcium, urinary free cortisol, thyroid function tests andtransiliac bone biopsy. Free testosterone, gonadotrophin and prolactinmeasurements may be of value in men. Assessment is guided by the clinicalfindings, and some patients who apparently have primary osteoporosis, aresubsequently found to have mild hyperparathyroidism or hyperthyroidism,systemic mastocytosis, the late appearance of osteogenesis imperfecta orosteomalacia.
69

3.4.2 Differential diagnosis of osteoporosisSpecific underlying causes of bone loss are more commonly found in menthan in women. A high proportion of men presenting with symptomaticvertebral crush fractures have an underlying cause of osteoporosis identified,such as hypogonadism, oral steroid therapy or alcoholism (77,78). A case-control study from the Mayo Clinic showed a significantly increased risk ofvertebral fractures with smoking, alcohol consumption and underlyingcauses of osteoporosis (79). A recent case-control study of men fromNewcastle shows an increased risk of vertebral fractures with oralglucocorticoid therapy, anticonvulsant treatment, smoking, alcoholism andhypogonadism (80). For hip fractures, the risk factors in men are similar tothose found in women (81–83).
Osteomalacia and malignancy commonly induce bone loss and fractures.Osteomalacia is characterized by a defect of mineralization of bone matrixmost commonly attributable to impaired intake, production or metabolism ofvitamin D. Other causes include impaired phosphate transport or the chronicuse of some drugs such as aluminium salts (and other phosphate bindingantacids), high doses of fluoride or etidronate, and the chronic use ofanticonvulsants. In most cases, the diagnosis of osteomalacia is suspected bythe clinical history and by abnormalities in biochemical tests such as lowvalues of serum and urinary calcium, serum phosphate and 25-hydroxyvitamin D, and high values for alkaline phosphatase and parathyroidhormone. A transiliac bone biopsy after tetracycline labelling may benecessary to demonstrate unequivocally a defect in mineralization.Diffuse osteoporosis with or without pathological fracture is common inpatients with multiple myeloma, a condition suspected by the severity ofbone pain, increased sedimentation rate and Bence Jones proteinuria, andidentified by marrow aspirate, and serum and urine (immuno) electrophoresisof proteins. Similarly, pathological fractures resulting from metastaticmalignancies can mimic osteoporosis and can be excluded by clinical andradiological examination, biological tests such as tumour markers, andscintigraphy or other imaging techniques. Vertebral fractures in osteoporosisshould be differentiated from vertebral deformities attributable to otherdisorders such as scoliosis, osteoarthrosis and Scheuermann disease.
References1. Consensus development conference. Diagnosis, prophylaxis and treatment of
osteoporosis. American Journal Medicine, 1991, 90:170–110.
2. Consensus Development Conference. Diagnosis, prophylaxis and treatment ofosteoporosis. American Journal Medicine, 1993, 94:646–650.
3. Genant HK et al. Non invasive assessment of bone mineral and structure: stateof the art. Journal of Bone and Mineral Research, 1996, 11:707–730.
4. Blake GM et al. Does the combination of two BMD measurements improvefracture discrimination? Journal of Bone and Mineral Research, 2003,18:1955–1963.
70

5. Mazess R et al. Performance evaluation of a dual energy X-ray bonedensitometer. Calcified Tissue International, 1998, 44:228–232.
6. Marshall D, Johnell O, Wedel H. Meta-analysis of how well measures of bonemineral density predict occurrence of osteoporotic fractures. Britsh MedicalJournal, 1996, 312:1254–1259.
7. Kanis JA et al. Guidelines for diagnosis and management of osteoporosis.Osteoporosis International, 1997, 7:390–406.
8. Genant HK et al. Qualitative computed tomography of vertebral spongiosa: asensitive method for detecting early bone loss after oophorectomy. Annals ofInternal Medicine, 1982, 97:699–705.
9. Lang T et al. Non-invasive assessment of bone density and structure usingcomputed tomography and magnetic resonance. Bone, 1998, 2(Suppl. to No.5):149–153.
10. Hakulinen MA et al. Dual energy X-ray laser measurement of calcaneal bonemineral density. Physics in Medicine and Biology, 2003, 48:1741–1752.
11. Kullenberg R, Falch JA. Prevalence of osteoporosis using bone mineralmeasurements at the calcaneus by dual X-ray and laser (DXL). OsteoporosisInternational, 2003, 14:823–827.
12. Ruegsegger P et al. Quantification of bone mineralisation using computedtomography. Radiology, 1976, 121:93–97.
13. Exton-Smith AN et al. Method for measuring quantity of bone. Lancet, 1969,2:1153–1154.
14. Dey A et al. Metacarpal morphometry using a semi-automated technique in theassessment of osteoporosis and vertebral fracture risk. Osteoporosis International,2000, 11:953–958.
15. Beck TJ et al. Predicting femoral neck strength from bone mineral data: astructural approach. Investigative Radiology, 1990, 25:6–18.
16. Pothnaud I et al. Three-dimensional-line skeleton graph analysis of high-resolution magnetic resonance images: a validation study from 34-micron-resolution microcomputed tomography. Journal of Bone and Mineral Research,2002, 17:1883–1895.
17. Benhamou CL et al. Fractal analysis of radiographic trabecular bone texture andbone mineral density: two complementary parameters related to osteoporoticfractures. Journal of Bone and Mineral Research, 2001, 16:697–704.
18. Kanis JA. Assessment of bone mass. In: Textbook of osteoporosis. Chapter 3(Assessment of osteoporosis). Blackwell Science, Oxford, 1996:226–278.
19. Singh M et al. Changes in trabecular pattern of the upper end of the femur as anindex for osteoporosis. Journal of Bone and Mineral Research, 1994, 9:671–677.
20. Nicholson PH et al. Do quantitative ultrasound measurements reflect structureindependently of density in human vertebral cancellous bone? Bone, 1998,23:425–431.
21. Glüer CC, for the International Quantitative Ultrasound Consensus Group.Quantitative ultrasound techniques for the assessment of osteoporosis: expertagreement on current status. Journal of Bone and Mineral Research, 1997,12:1280–1288.
71

22. Gregg EW et al. The epidemiology of quantitative ultrasound: a review of therelationship with bone mass, osteoporosis and fracture risk. OsteoporosisInternational, 1997, 7:89–99.
23. Porter RW et al. Prediction of hip fractures in elderly women: a prospective study.British Medical Journal, 1990, 301:638–641.
24. Hans D et al. Ultrasonographic heel measurements to predict hip fracture inelderly women: the EPIDOS prospective study. Lancet, 1996, 348:511–514.
25. Schott AM et al. Ultrasound discriminates patients with hip fracture equally wellas dual energy X-ray absorptiometry and independently of bone mineral density.Journal of Bone and Mineral Research, 1995, 10:243–249.
26. Bauer DC et al. Broadband ultrasound attenuation predicts fractures strongly andindependently of densitometry in older women. Archives of Internal Medicine,1997, 157:629–637.
27. Huopio J et al. Calcaneal ultrasound predicts early postmenopausal fractures aswell as axial BMD: a prospective study of 422 women. Osteoporosis International,2004, 15:190–195.
28. Gnudi S, Ripamonti C, Malavolta N. Quantitative ultrasound and bonedensitometry to evaluate the risk of nonspine fractures: a prospective study.Osteoporosis International, 2000, 11:518–523.
29. Bauer DC et al. Quantitative ultrasound predicts hip and non-spine fractures inmen: the MrOS study. Journal of Bone and Mineral Research, 2004, 19 (Suppl.1):S7.
30. Wuster C et al. Age-related changes, diagnostic sensitivity and discriminationpower. Journal of Bone and Mineral Research, 2000, 15:1603–1614.
31. Glüer CC et al. Association of five quantitative ultrasound devices and bonedensitometry with osteoporotic vertebral fractures in a population-based sample:the OPUS study. Journal of Bone and Mineral Research, 2004, 19:782–793.
32. Mele R et al. Three-year longitudinal study with quantitative ultrasound at thehand phalanx in a female population. Osteoporosis International, 1997, 7:550–557.
33. Foldes AJ et al. Quantitative ultrasound of the tibia: a novel approach for theassessment of bone status. Bone, 1995, 17:363–367.
34. Stegman MR et al. Cortical ultrasound velocity as an indicator of bone status.Osteoporosis International, 1995, 5:349–353.
35. Orgee JM et al. A precise method for the assessment of tibial ultrasound velocity.Osteoporosis International, 1996, 6:1–7.
36. Assessment of fracture risk and its application to screening for postmenopausalosteoporosis. Geneva, World Health Organization, 1994 (WHO Technical ReportSeries, No. 843).
37. Cummings SR et al. Bone density at various sites for prediction of hip fractures.The Study of Osteoporotic Fractures Research Group. Lancet, 1993, 341:72–75.
38. Grampp S et al. Comparisons of non-invasive bone mineral measurements inassessing age related loss, fracture discrimination, and diagnostic classification.Journal of Bone and Mineral Research, 1997, 12:697–711.
39. Bonjour JP, Rizzoli R. Bone acquisition in adolescence. In: Marcus R, Feldman D,Kelsey J, eds. Osteoporosis. San Diego, Academic Press, 1996:465–476.
72

40. Looker AC et al. Prevalence of low femoral bone density in older US adults fromNHANES III. Journal of Bone and Mineral Research, 1997, 12:1761–1768.
41. Looker AC et al. Updated data on proximal femur bone mineral levels of USadults. Osteoporosis International, 1998, 8:468–486.
42. Kanis JA, Glüer CC for the Committee of Scientific Advisors, InternationalOsteoporosis Foundation. An update on the diagnosis and assessment ofosteoporosis with densitometry. Osteoporosis International, 2000, 11:192–202.
43. Kanis JA et al. The diagnosis of osteoporosis. Journal of Bone and MineralResearch, 1994, 9:1137–1141.
44. Kroger H et al. Bone density reduction in various measurement sites in men andwomen with osteoporotic fractures of spine and hip: the European Quantitationof Osteoporosis Study. Calcified Tissue International, 1999, 64:191–199.
45. Simmons AD et al. The effects of standardisation and reference values on patientclassification for spine and femur dual-enery X-ray absorptiometry. OsteoporosisInternational, 1997, 7:200–206.
46. Faulkner KG, von Stetten E, Miller P. Discordance in patient classification using T-scores. Journal of Clinical Densitometry, 1999, 2:343–350.
47. Arlot ME et al. Apparent pre and postmenopausal bone loss evaluated by DXA atdifferent skeletal sites in women: the OFELY cohort. Journal of Bone and MineralResearch, 1997, 12:683–690.
48. Sosa M. The range of bone mineral density in healthy Canarian women by dualx-ray absorptiometry, radiography and quantitative computer tomography.Journal of Clinical Densitometry, 1998, 1:385–393.
49. Johnell O et al. Predictive value of bone mineral density for hip and otherfractures. Osteoporosis International, 2005, 20:1185–1194.
50. Orwoll E. Assessing bone density in men. Journal of Bone and Mineral Research,2000, 15:1867–1870.
51. Selby PL, Davies M, Adams JE. Do men and women fracture bones at similarbone densities? Osteoporosis International, 2000, 11:153–157.
52. Lunt M et al. Bone density variation and its effects on risk of vertebral deformityin men and women studied in 13 European centres: the EVOS study. Journal ofBone and Mineral Research, 1997, 12:1883–1894.
53. Nguyen T et al. Prediction of osteoporotic fractures by postural instability andbone density. British Medical Journal, 1993, 307:1111–1115.
54. Melton LJ III et al. Bone density and fracture risk in men. Journal of Bone andMineral Research, 1998, 13: 1915–1923.
55. Kanis JA et al. Ten year probabilities of osteoporotic fractures according to BMDand diagnostic thresholds. Osteoporosis International, 2001, 12:989–995.
56. Hui SL, Slemenda CW, Johnston CC. Age and bone mass predictors of fracturein a prospective study. Journal of Clinical Investigation, 1998, 81:1804–1809.
57. DeLaet CED et al. Bone density and risk of hip fracture in men and women: crosssectional analysis. British Medical Journal, 1997, 315:221–225.
58. DeLaet CEDH et al. Hip fracture prediction in elderly men and women: validationin the Rotterdam Study. Journal of Bone and Mineral Research, 1998,13:1587–1593.
73

59. Kanis JA et al. Diagnosis of osteoporosis and fracture threshold in men. CalcifiedTissue International, 2001, 69: 218–221.
60. Wasnich RD, Davis JW, Ross PD. Spine fracture risk is predicted by non spinefractures. Osteoporosis International, 1994, 4:1–5.
61. Lehmann R et al. Dual energy X-ray absorptiometry at the lumbar spine inGerman men and women: a cross-sectional study. Calcified Tissue International,1995, 56:350–354.
62. Smeets-Goevaers CG et al. The prevalence of low bone mineral density in Dutchperimenopausal women: the Eindhoven perimenopausal osteoporosis study.Osteoporosis International, 1998, 8: 404–409.
63. Shipman AJ et al. Vertebral bone mineral density, content and average in 8789normal women aged 33–73 years who have never had hormone replacementtherapy. Osteoporosis International, 1999, 9: 420–426.
64. Ryan PJ et al. A comparison of reference bone mineral density measurementsderived from two sources: referenced and population based. British Journal ofRadiology, 1993, 6:1138–1141.
65. Holt G et al. Prevalence of osteoporotic bone mineral density at the hip in Britaindiffers substantially from the US over 50 years of age: implications for clinicaldensitometry. British Journal of Radiology, 2002, 75:736–742.
66. Lunt M et al. Population based geographic variations in DXA bone density inEurope: the EVOS study. Osteoporosis International, 1997, 7:175–189.
67. Parr RM et al. Contribution of calcium and other dietary components to globalvariations in bone mineral density in young adults. Food and Nutrition Bulletin,2002, 23 (Suppl 3):180–184.
68. Elffors L et al. The variable incidence of hip fracture in Southern Europe: theMEDOS Study. Osteoporosis International, 1994, 4:253–263.
69. Melton LJ III. The prevalence of osteoporosis. Journal of Bone and MineralResearch, 1997, 12:1769–1771.
70. Ross PD et al. Body size accounts for most differences in low density betweenAsian and Caucasian women: the EPIC study group. Calcified Tissue International,1996, 59:339–343.
71. Kanis JA et al. Risk of hip fracture according to the World Health Organizationcriteria for osteopenia and osteoporosis. Bone, 2000, 27:585–590.
72. Lewiecki EM et al. Official position of the International Society for ClinicalDensitometry. Journal of Clinical Endocrinology and Metabolism, 2004,89:3651–3655.
73. Kanis JA et al. The use of multiple sites for the diagnosis of osteoporosis.Osteoporosis International, 2006, 17:527–534.
74. Kanis JA, Barton IP, Johnell O. Risedronate decreases fracture risk in patientsselected solely on the basis of prior vertebral fracture. Osteoporosis International,2005, 16:475–482.
75. Hansen KE et al. Use of lowest vertebral body T-score to diagnose lumbarosteoporosis in men. Journal of Clinical Densitometry, 2004, 7:376–381.
74

76. Melton LJ III et al. Determinants of bone loss from the femoral neck in women ofdifferent ages. Journal of Bone and Mineral Research, 2000, 15:24–31.
77. Francis RM et al. Spinal osteoporosis in men. Bone and Mineral, 1989, 5:347–357.
78. Baillie SP et al. Pathogenesis of vertebral crush fractures in men. Age and Ageing,1992, 21:139–141.
79. Seeman E et al. Risk factors for spinal osteoporosis in men. American Journal ofMedicine, 1983, 75:977–983.
80. Scane AC et al. Case-control study of vertebral fractures in men. Age and Ageing,1996, 25(Suppl. 2):P6.
81. Poor G et al. Predictors of hip fractures in elderly men. Journal of Bone and MineralResearch, 1995, 10:1900–1907.
82. Johnell O et al. Risk factors for hip fracture in European women: the MEDOSStudy. Journal of Bone and Mineral Research, 1995, 10:1802–1815.
83. Kanis JA et al. Risk factors for hip fracture in European men: the MEDOS study.Osteoporosis International, 1999, 9:45–54.
4. Overview of clinical risk factors for fracturesThe skeleton is designed to accommodate the stresses encountered ineveryday activities. The structure of limb bones, for example, is optimized toresist bending and twisting forces by concentrating a dense layer of corticalbone on the outer surface where such forces are greatest. These bones aretherefore quite strong, and any fractures result from severe trauma, such asroad traffic accidents. Patients with osteoporosis are not immune to severetrauma such as this, but they are uniquely at risk of fractures from so-called“low energy” trauma, e.g. falling from a standing height or less. Thesefractures mainly occur at the ends of long bones or sites in the axial skeleton,such as the vertebrae, where cancellous (trabecular) bone predominates. Inthese patients, osteoporosis may compromise the ability of bones towithstand even normal skeletal loads.
Conceptually, then, clinical risk factors for osteoporotic fractures can beseparated into those that impair bone strength and those that lead toexcessive loads on weakened bone from falls or, in some cases, ordinaryactivities of daily living. Many risk factors have been identified, although itis not always possible to confidently place them in one of these twocategories. Moreover, the relative influence of specific risk factors may varyfrom one type of fracture to another. These issues are reviewed in thefollowing sections. Even though our understanding of the pathogeneticmechanisms that underlie these various risk factors remains somewhatlimited, it is still possible to exploit them empirically to refine the assessmentof fracture risk for individual patients.
75

4.1 Risk factors related to impaired bone strength4.1.1 Bone density
There are many determinants of bone strength, including the size of bone, itsshape, microarchitectural arrangement, mineralization and microdamage.These cannot be directly measured for clinical use. It is estimated that thestrength of cortical bone decreases by about 2% per decade inpostmenopausal women and cancellous bone by 12% per decade. Thus, thestrength of cortical and cancellous bone decreases by about 11% and 68%,respectively, throughout life (1). From a clinical perspective, most of ourcurrent knowledge of fracture risk factors relates to those that aredeterminants of BMD, which is a surrogate measure of bone strength and astrong predictor of future fracture risk (see section 3). A large number ofclinical risk factors may exert their effects partly through BMD as shown inTable 4.1 (2,3). It is possible, however, to reduce this long list to a smallergroup of more general categories.
Table 4.1 Risk factors for fracture related to bone mineral density (BMD)
High fracture risk Moderate fracture risk
Ageing (> 70 years) Female sex
Low body weight Current smoking
Weight loss Low sunlight exposure
Physical inactivity Family history of osteoporotic fracture
Corticosteroids Surgical menopause
Anticonvulsant drugs Short fertile period (< 30 years)
Primary hyperparathyroidism No lactation
Diabetes mellitus (type I) Low calcium intake (< 500–850 mg/day)
Anorexia nervosa Hyperparathyroidism
Gastrectomy Hyperthyroidism
Pernicious anaemia Diabetes mellitus (type II)
Prior osteoporotic fracture Rheumatoid arthritis
Source: adapted from reference 3 (Table 5).
AgeAlmost all studies indicate that increasing age is a strong determinant offracture risk (4). Greater age is associated with lower BMD in both sexes andall races, but age also predicts fracture risk independently of BMD. Atpresent, it is still not clear to what extent age is independent of unmeasuredrisk factors such as calcium or vitamin D deficiency, the onset of gait andbalance disorders that increase the risk of falling, or reductions in physicalactivity that may induce a form of disuse osteoporosis (5).
Hormonal abnormalities Excessive hormone production may be associated with increased fracture riskin patients with hyperthyroidism (including overdoses of thyroid hormonereplacement), primary or secondary (e.g. chronic renal disease)
76

hyperparathyroidism, hyperprolactinemia and Cushing syndrome (6).However, insufficient hormone production poses a greater problem. Inparticular, estrogen deficiency has long been blamed for rapid bone loss seenat the menopause, but it also appears to be responsible in part for later age-related bone loss in both men and women (7). A number of fracture riskfactors probably act through estrogen deficiency, including female sex,premature ovarian failure, surgical menopause and a short fertile period(menarche to menopause) (8,9). Since testosterone is converted to estrogen,hypogonadism in men may also be related to low estrogen levels. Further,hypogonadism may account for the association of bone loss and fracture riskwith some specific diseases such as acromegaly, haemochromatosis and otherchronic liver diseases (10). While many of these diseases are uncommon,iatrogenic hypogonadism from the use of gonadotropin-releasing hormoneagonists and aromatase inhibitors in breast and prostate cancer, for example,is becoming more widespread (11). The endocrine abnormalities seen inTurner or Klinefelter syndromes, athletic amenorrhoea, anorexia nervosaand insulin-dependent diabetes mellitus may also enhance future fracture riskby impeding growth and compromising the peak bone mass (and bone size)attained during adolescence (12).
Nutritional deficiencies Nutritional deficits can also impair the development of optimal peak bonemass (13). If the supply from the diet is insufficient, calcium is withdrawnfrom the skeleton. Low calcium intake per se is obviously a problem,especially when combined with general nutritional deficits as seen in youngerpatients with anorexia nervosa and in frail elderly people. Even if dietaryintake were adequate, absorption of calcium and other nutrients from thegastrointestinal tract may be directly impaired by gastrectomy, perniciousanaemia and various malabsorption syndromes, all of which have beenassociated with increased fracture risk (14). Calcium intake may beindirectly impaired by a deficiency of vitamin D, which enhances calciumabsorption and conservation, and that may lead to rickets or osteomalacia.Insufficient vitamin D levels may result from low sun exposure, especially inhousebound elderly individuals, certain liver diseases such as cirrhosis andchronic hepatitis, or the use of drugs that interfere with vitamin Dmetabolism, e.g. some anticonvulsants (15). Vitamin D deficiency alsoaccelerates the catabolism of active forms of vitamin D (16).
Specific pathological processes In addition to hormonal and nutritional disturbances, some patients areaffected by specific diseases, surgical procedures or drug exposures that occursporadically in the population and exacerbate bone loss (so-called“secondary” osteoporosis). For instance, bone loss may be increased inpatients with serious inflammatory diseases such as systemic lupuserythematosis, rheumatoid arthritis and Crohn disease (6,17), although thismay be partly attributable to the need for glucocorticoid therapy, animportant risk factor reviewed in section 5. Whether the increase in fracture
77

risk is independent of corticosteroid use remains equivocal in inflammatorybowel disease, asthma and chronic obstructive pulmonary disease. Otherdiseases may increase fracture risk by distorting or destroying bone tissue.Thus, Paget disease produces foci of disorganized bone structure susceptibleto pathological fractures (18). Such fractures may also occur through regionswhere bone has been destroyed by multiple myeloma or other marrowproliferative disorders, by primary bone tumors such as osteosarcoma or bymalignant lesions that have metastasized to the skeleton from other areas(19).
Toxins Adverse effects on bone of these malignant conditions may be exacerbated bytreatment, especially chemotherapy and radiation, although effects can bedifficult to distinguish from the underlying disease or from hypogonadisminduced by toxic therapies. Much more common, obviously, are potentialtoxic effects on bone from cigarette smoking and excessive alcoholconsumption, as reviewed in section 5.
4.1.2 Bone qualityIt is important to keep in mind that fractures are related to the biomechanicalcharacteristics of the skeleton, not to abnormal bone metabolism itself. Thus,bone strength may also be compromised by elevated bone turnover, a featureof estrogen deficiency and some other conditions such as hyperthyroidism. Inaddition, some measures of bone strength, e.g. the section modulus, arerelated more to bone diameter than to BMD (1). The fact that bigger bonesare more resistant to breaking may account for the lower fracture risk amongmen compared to women, as well as the protective effect of height found insome studies. Conversely, smaller bone size may partly account for thenegative influence on future fracture risk of a personal history ofosteoporotic fracture (see section 5) or a family history of such fractures (seesection 5). A positive family history is often presumed to reflect anunderlying genetic predisposition. Certainly, bone size is heritable, and thereis a bewildering array of mostly rare genetic disorders (e.g. cystic fibrosis,osteogenesis imperfecta and osteopetrosis) that increase fracture risk (20).Nevertheless, family history reflects similar behaviours and sharedenvironments, as well as the effects of multiple genes, and the specificmechanisms responsible for the familial increase in fracture risk remainsomewhat uncertain.
4.2 Risk factors related to excessive bone loads4.2.1 Fall predisposition
Some fractures occur “spontaneously” in the course of everyday activities.Vertebral fractures, in particular, frequently result from seemingly innocuousbehaviours such as opening a stuck window, although it has been shown thatsuch activities can result in surprisingly large compression forces on the spine(1). However, most osteoporotic fractures are precipitated by a “simple” fall,and these are very common: the likelihood of falling in a given year rises from
78

about one in five women 45–49 years old to nearly half of women aged 85years and over, along with a third of elderly men (21). Essentially all distalforearm fractures result from a fall to the ground, along with at least 90% ofhip fractures and about a third of vertebral fractures. However, thepathogenesis of falls is anything but simple. Thus, many falls are causedprimarily by so-called “extrinsic” factors such as slippery surfaces orobstacles such as steps, curbs or electric cords (2). Although clinicians canadvise patients about environmental hazards such as these, the clinically-evident risk factors for falling relate more to intrinsic characteristics of thepatient and, again, a large number have been identified (Table 4.2). Mostfallers have more than one deficit, and the risk of falling increases with thenumber of them that are present. These diverse factors can also be combinedinto a number of more general groupings.
Table 4.2 Intrinsic risk factors for falls among elderly people
Strong evidence Moderate evidence
Older age Arthritis
Female sex Acute illness
Reduced functional level Anti-Parkinson drugs
Cane or walker use Cardiac and antihypertension drugs
History of falls Alcohol use
Low walking speed
Reduced lower extremity strength
Increased postural sway
Impaired reflexes
Impaired vision
Reduced lower extremity sensory perception
Neuromuscular diseases (e.g. stroke)
Urinary incontinence
Hypnotic and sedative drugs
Antipsychotic drugs
Cognitive impairment
Depression, antidepressant drugs
Source: adapted from reference 2 (Table 1).
Reduced sensory input Visual problems that have been linked to an increased risk of falling includeblindness, cataracts, diabetic retinopathy, etc. More generally, decreasedvisual acuity, depth perception and contrast sensitivity impair the ability toidentify and navigate environmental hazards. Poor vision and auditoryproblems may also exacerbate balance disturbances (22).
Balance and gait problems Any number of gait and balance disorders increase the risk of falling (2).Such difficulties are obviously enhanced by a variety of neuromuscular
79

diseases such as polio, cerebral palsy, multiple sclerosis, paraplegia,Parkinson disease and stroke. However, risk assessment is not necessarilystraightforward. Thus, fractures are not much increased in patients with mildstrokes who recover completely nor in patients with severe strokes who areunable to ambulate without assistance (23). Instead, fracture risk isconcentrated among the patients who attempt to ambulate independently buthave residual hemiplegia or hemiparesis.
Impaired strength and reflexes Intact reflexes and adequate strength are essential to remaining upright.Impaired physical performance assessed by a variety of objective methods isan important risk factor for fractures (24,25). Differences in neuromuscularcompetence may also explain regional differences in fracture risk. Forexample, the lower risk of falling, and of hip fracture, among Asiancompared to white women has been attributed to their greatermusculoskeletal competence; the risk of vertebral fractures, which derive lessfrom falling, is comparable in the two groups (26).
Drug side-effects Some drugs, particularly psychotropic medication and sedatives, increase thelikelihood of falls and fractures (2). Such agents may also help explain thefracture risk associated with Alzheimer disease and depression. Likewise,postural hypotension from aggressive antihypertensive therapy mayprecipitate falls and fractures, as does syncope from other causes.
4.2.2 Fall mechanicsUnfortunately, it has proven difficult to prevent falls. A recent Cochranreview concluded that a comprehensive intervention to reduce multiple riskfactors for falling lowered the likelihood of falling by only 14%–27% and hadlittle influence on reducing actual fracture risk (27). Moreover, even amongelderly fallers, fewer than 5% experience a fracture. Therefore, it is importantto also consider risk factors that relate to the actual mechanics of falling.These include the energy generated by the fall, protective responses whichmitigate that potential energy and any factors that help absorb the energybefore it is delivered to the skeleton (28). Some clinically evident risk factorsfor fracture relate to these aspects of the problem. Thus, hip fractures aremore likely upon falling backwards and forearm fractures more likely whenfalling forwards. Falling backwards, in turn, is a consequence of slow gaitspeed and impaired neuromuscular coordination. The limited musclestrength and impaired reflexes that characterize a large number ofneuromuscular disorders also reduce the effectiveness of automatic protectiveresponses that are initiated by falling. Finally, the protective effects of fat (e.g.body mass index) on bone density, brought about by enhanced endogenousestrogen production by fat tissue, extend to energy-absorbing properties offat that help decrease fracture risk. The importance of soft tissue loss over thehip in elderly individuals is shown by the substantial reduction in hipfractures achieved with the use of energy-absorbing hip pads in some settings(29).
80

4.3 Use of clinical risk factors for fracture predictionIn the absence of other risk predictors, such as BMD, clinical risk factors canbe used to assess fracture risk. Interestingly, most such risk factors haveeffects of similar magnitude, generally increasing the likelihood of fractureby 1.5 to 3 times more than that seen among unaffected individuals(8,30–38). This suggests that different clinical risk factors may be substitutedone for another in a fracture prediction algorithm. Although there is goodevidence that these clinical risk factors exacerbate fracture risk, it is less clearthat this is separate from their adverse effects on BMD. Few studies havequantified the independent influence of these conditions on fracture risk, butthis information is needed if clinical risk factors are to be combined withBMD in predicting fractures (see section 5). Thus, hyperthyroidism isassociated with fracture risk (39), and data from the Study of OsteoporoticFractures show that the 1.8-fold excess of hip fractures in women withhyperthyroidism is reduced only to 1.7 by adjusting for bone density and apersonal history of fractures (30). Likewise, after adjustment for BMD,significant associations with fractures have been shown for type I diabetes(40), ankylosing spondylitis (41) and menopause (42), as well as rheumatoidarthritis (see section 5). Risk factors for falling may also be independent ofBMD. In the Study of Osteoporotic Fractures, for example, the relative riskof hip fracture associated with poor visual depth perception fell only from 1.5to 1.4, and that associated with the use of long-acting benzodiazepine drugswas unchanged (1.6 versus 1.6), before and after adjustment for low bonedensity and fracture history (30). However, risk factors for falling may notbe responsive to pharmacologic treatments for osteoporosis (43). If so,including them in a fracture prediction algorithm designed to identify highrisk individuals for such therapy would be inappropriate.
Based on the evidence available, the Osteoporosis Society of Canada (44)has recommended that physicians focus on a limited number of clinical riskfactors (Table 4.3), the more important of which (e.g. personal and familyhistory of fracture, glucocorticoid use and rheumatoid arthritis) are reviewedin detail in other chapters of this report. The potential value of focusing onthese clinical risk factors is illustrated in Fig. 4.1, where it can be seen that hipfracture incidence is 17 times greater among older women with five or moreclinical risk factors, exclusive of bone density, than women with two riskfactors or fewer (30). However, even women with five or more risk factorsare at greater risk of fracture if their BMD is in the lowest third (30). It istherefore apparent that clinical risk factors could help refine fracture riskprediction, but the choice of which ones to use for this purpose is lessobvious. Data concerning many clinical risk factors are equivocal, andvarious risk factors themselves may be correlated. Adding to the confusion isthe fact that different sets of potential risk factors have been assessed in theinvestigations completed to date. In addition, conditions that can have adevastating effect on the individual patient, but which are uncommon (e.g.Cushing syndrome), rarely appear among the independent risk factorsidentified in population-based studies.
81

Table 4.3 Factors that identify people who should be assessed for osteoporosis
Major risk factors Minor risk factors
Age > 65 years Rheumatoid arthritis
Vertebral compression fracture Past history of clinical hyperthyroidism
Fragility fracture after age 40 years Chronic anticonvulsant therapy
Family history of osteoporotic fracture Low dietary calcium intake(especially maternal hip fracture) Smoker
Systemic glucocorticoid therapy Excessive alcohol intakeof > 3 months duration Excessive caffeine intake
Malabsorption syndrome Weight < 57 kg
Primary hyperparathyroidism Weight loss > 10% of weight at age 25
Propensity to fall Chronic heparin therapy
Osteopenia on X-ray
Hypogonadism
Early menopause (before age 45 years)
Source: reference 44 (Table 3).
Fig 4.1Annual risk of hip fractures according to bone mineral density (BMD) at the calcaneus andthe number of clinical risk factors
Source: reference 30 (Fig. 2).
There are then many clinically evident risk factors for fracture that might beused to identify high-risk patients for further evaluation and treatment.Although some of these conditions are rare, they are common in aggregate.Indeed, a third of affected women have at least one of them (45), as do mostmen with osteoporosis (46), and these are often the patients who present forcare. Moreover, specific disorders associated with bone loss or falling have
82

been shown to account for 72% of the hip fractures in men (31). What hasbeen missing is a coordinated effort to identify a robust set of clinicalpredictors of fracture risk that are consistent across countries and easilyascertainable by the attending physicians (47). This has now beenaccomplished as described in more detail in section 5. Thus, it is now possibleto combine standard BMD measurements with clinical risk factors, such asthose mentioned above, to improve the prediction of fracture risk forindividual patients.
References1. Bouxsein ML. Biomechanics of age-related fractures. In: Marcus R, Feldman D,
Kelsey J, eds. Osteoporosis, 2nd ed. Vol. 1. San Diego, CA, Academic Press,2001:509–531.
2. Schwartz AV, Capezuti E, Grisso JA. Falls as risk factors for fractures. In: MarcusR, Feldman D, Kelsey J, eds. Osteoporosis, 2nd ed. Vol 1. San Diego, CA,Academic Press, 2001:795–807.
3. Espallargues M et al. Identifying bone-mass-related risk factors for fracture toguide bone densitometry measurements: a systematic review of the literature.Osteoporosis International, 2001, 12:811–822.
4. Bone health and osteoporosis: a report of the Surgeon General. Rockville, MD,United States Department of Health and Human Services, Office of the SurgeonGeneral, 2004.
5. Frost HM. On our age-related bone loss: insights from a new paradigm. Journalof Bone and Mineral Research, 1997, 12:1539–1546.
6. Stein E, Shane E. Secondary osteoporosis. Endocrinology and Metabolism Clinicsof North America, 2003, 32:115–134.
7. Riggs BL, Khosla S, Melton LJ III. Sex steroids and the construction andconservation of the adult skeleton. Endocrine Reviews, 2002, 23:279–302.
8. Johnell O et al. Risk factors for hip fracture in European women: the MEDOSStudy. Journal of Bone and Mineral Research, 1995, 10:1802–1815.
9. Melton LJ III et al. Fracture risk after bilateral oophorectomy in elderly women.Journal of Bone and Mineral Research, 2003; 18:900–905.
10. Khosla S, Melton LJ III. Secondary osteoporosis. In: Riggs BL, Melton LJ III, eds.Osteoporosis: etiology, diagnosis and management, 2nd ed. Philadelphia, PA,Lippincott-Raven, 1995:183–204.
11. Smith MR. Diagnosis and management of treatment-related osteoporosis in menwith prostate carcinoma. Cancer, 2003, 97(Suppl. 3):789–795.
12. Sowers MF. Lower peak bone mass and its decline. Best Practice and ResearchClinical Endocrinology and Metabolism, 2000, 14:317–329.
13. Heaney RP et al. Peak bone mass. Osteoporosis International, 2000, 11:985–1009.
14. von Tirpitz C, Reinshagen M. Management of osteoporosis in patients withgastrointestinal diseases. European Journal of Gastroenterology and Hepatology,2003, 15:869–876.
15. Pettifor JM. Nutritional and drug-induced rickets and osteomalacia. In: Favus MJ,ed. Primer on the metabolic bone diseases and disorders of mineral metabolism, 5th ed.Washington, DC, American Society for Bone and Mineral Research,2003:399–407.
83

16. Lips P. Vitamin D deficiency and secondary hyperparathyroidism in the elderly:consequences for bone loss and fractures and therapeutic implications.Endocrine Reviews, 2001:22:477–501.
17. American Gastroenterological Association medical position statement: guidelineson osteoporosis in gastrointestinal diseases. Gastroenterology, 2003:124:791–794.
18. Siris ES, Roodman GD. Paget’s disease of bone. In: Favus MJ, ed. Primer on themetabolic bone diseases and disorders of mineral metabolism, 5th ed.Washington, DC, American Society for Bone and Mineral Research, 2003:495–506.
19. Whyte MP. Skeletal neoplasms. In: Favus MJ, ed. Primer on the metabolic bonediseases and disorders of mineral metabolism, 5th ed. Washington, DC, AmericanSociety for Bone and Mineral Research, 2003:479–487.
20. Shapiro JR. Osteogenesis imperfecta and other defects of bone development asoccasional causes of adult osteoporosis. In: Marcus R, Feldman D, Kelsey J, eds.Osteoporosis, 2nd ed. Vol. 2, San Diego, CA, Academic Press, 2001:271–301.
21. Winner SJ, Morgan CA, Evans JG. Perimenopausal risk of falling and incidenceof distal forearm fracture. British Medical Journal, 1989, 298:1486–1488.
22. De Boer MR et al. Different aspects of visual impairment as risk factors for fallsand fractures in older men and women. Journal of Bone and Mineral Research,2004:19:1539–1547.
23. Melton LJ III et al. Long-term fracture risk following ischemic stroke: a population-based study. Osteoporosis International, 2001, 12:980–986.
24. Stel VS et al. Functional limitations and poor physical performance asindependent risk factors for self-reported fractures in older persons. OsteoporosisInternational, 2004, 15:742–750.
25. Nguyen T et al. Prediction of osteoporotic fractures by postural instability andbone density. British Medical Journal, 1993, 307:1111–1115.
26. Melton LJ III. Epidemiology worldwide. Endocrinology and Metabolism Clinics ofNorth America, 2003, 32:1–13.
27. Gillespie LD et al. Interventions for preventing falls in elderly people. The CochraneDatabase of Systematic Reviews, Vol. 3, 2004.
28. Greenspan SL et al. Fall severity and bone mineral density as risk factors for hipfracture in ambulatory elderly. Journal of the American Medical Association, 1994,271:128–133.
29. Parker MJ, Gillespie LD, Gillespie WJ. Hip protectors for preventing hip fracturesin the elderly. The Cochrane Database of Systematic Reviews, Vol. 3, 2004.
30. Cummings SR et al. Risk factors for hip fracture in white women. Study ofOsteoporotic Fractures Research Group. New England Journal of Medicine, 1995,332:767–773.
31. Poór G et al. Predictors of hip fractures in elderly men. Journal of Bone and MineralResearch, 1995, 10:1900–1907.
32. Moritz DJ, Kelsey JL, Grisso JA. Hospital controls versus community controls:differences in inferences regarding risk factors for hip fracture. American Journalof Epidemiology, 1997, 145:653–660.
33. Kanis J et al. Risk factors for hip fracture in men from southern Europe: theMEDOS study. Osteoporosis International, 1999, 9:45–54.
84

34. Burger H et al. Added value of bone mineral density in hip fracture risk scores.Bone, 1999, 25:369–374.
35. Melton LJ III et al. Secondary osteoporosis and the risk of vertebral deformitiesin women. Bone, 1999, 24:49–55.
36. van Staa TP, Leufkens HGM, Cooper C. Utility of medical and drug history infracture risk prediction among men and women. Bone, 2002, 31:508–514.
37. Ivers RQ et al. Risk factors for fractures of the wrist, shoulder and ankle: the BlueMountains Eye Study. Osteoporosis International, 2002, 13:513–518.
38. Chu SP et al. Risk factors for proximal humerus fracture. American Journal ofEpidemiology, 2004, 160:360–367.
39. Vestergaard P, Mosekilde L. Fractures in patients with hyperthyroidism andhypothyroidism: a nationwide follow-up study in 16,249 patients. Thyroid, 2002,12:411–419.
40. Schwartz AV et al. Study of Osteoporotic Fractures Research Group. Olderwomen with diabetes have an increased risk of fracture: a prospective study.Journal of Clinical Endocrinology and Metabolism, 2001, 86:32–38.
41. Mitra D et al. The prevalence of vertebral fractures in mild ankylosing spondylitisand their relationship to bone mineral density. Rheumatology, 2000, 39:85–89.
42. Torgerson DJ et al. Prediction of perimenopausal fractures by bone mineraldensity and other risk factors. Journal of Bone and Mineral Research, 1996,11:293–297.
43. McClung MR et al. Hip Intervention Program Study Group. Effect of risedronateon the risk of hip fracture in elderly women. New England Journal of Medicine,2001, 344:333–340.
44. Brown JP, Josse RG. Scientific Advisory Council of the Osteoporosis Society ofCanada. 2002 clinical practice guidelines for the diagnosis and management ofosteoporosis in Canada. Canadian Medical Association Journal, 2002, 167(Suppl.10):S1–S34.
45. Tannenbaum C et al. Yield of laboratory testing to identify secondary contributorsto osteoporosis in otherwise healthy women. Journal of Clinical Endocrinology andMetabolism, 2002, 87:4431–4437.
46. Orwoll ES. Osteoporosis in men. Endocrinology and Metabolism Clinics of NorthAmerica, 1998, 27:349–367.
47. Kanis JA et al, on behalf of the International Osteoporosis Foundation and,National Osteoporosis Foundation. A new approach to the development ofassessment guidelines for osteoporosis. Osteoporosis International, 2002,13:527–536.
85

5. Identification of risk factors for use in case-findingAlthough osteoporosis is defined by measurement of BMD, its clinicalsignificance rests with the fractures that arise as a consequence of thecondition. Low bone mass is an important component of fracture risk, butother abnormalities arise in the skeleton that contribute to skeletal fragility.Moreover, various non-skeletal factors, such as the liability to falls,contribute to fracture risk. Thus, ideally, assessment of fracture risk shouldencompass all these aspects, and there is a distinction to be made, therefore,between the diagnosis of osteoporosis and the assessment of risk. From thisperspective, BMD provides but one index of risk, albeit of considerableimportance.
Interest in the use of clinical risk factors to assess fracture risk arises forseveral reasons. Measurements of bone mineral are not available in allMember States and several clinical risk factors act as surrogates for lowBMD. Thus, clinical risk factors alone might be useful to identify a level offracture risk sufficiently high that interventions could be directed on thisbasis alone. In the context of limited resources, the use of clinical risk factorsmight also be used to direct sub-populations at high risk for further testing,and economize thereby on the use of BMD. Finally, some risk factors provideinformation over and above that provided by BMD and can, therefore, beused to enhance risk prediction with BMD.
There are a number of factors to be considered in the selection of risk factorsfor case-finding. Of particular importance, in the setting of primary care, isthe ease with which they might be used. For example, calcium intake has beenshown in many studies to be an important determinant of fracture risk in theelderly. There are many sources of dietary calcium, and although intakes canbe accurately acquired by food frequency questionnaires, such questionnairesare cumbersome to administer. A possible surrogate is intake of milk. Inseveral countries milk provides approximately 50% of the total dietary intakeof calcium. In large case-control studies, a low dietary intake of milk (lessthan 1 glass/day) was associated with a significant increase in hip fracture riskin men and women (1,2).
The proportion of dietary calcium provided by milk, however, varies aroundthe world and a simple question such as “do you take less than one glass ofmilk per day” does not reliably identify patients at risk of hip or otherosteoporotic fractures (3).
A second consideration is the intuitive value of the risk factors. For example,dementia is a strong risk factor for hip fracture (4). In the context of case-finding, it would be difficult to persuade physicians or relatives thatosteoporosis and fracture risk was high on the health-care agenda for thesepatients. By contrast, a prior fragility fracture or a family history of fracturehas high intuitive appeal to physicians and patients, and its use may aid inmotivating compliance with subsequent intervention.
86

A further factor to be considered is the international validity of the riskfactors to be used. For example, is the gradient of fracture risk per unitchange in BMD similar in different geographic settings? The same generalquestion must also be asked of dichotomous variables such as the presenceor absence of a family history of (hip) fracture. A final consideration is thereversibility of risk, i.e. is there evidence that the risk identified by a riskfactor is amenable to therapeutic intervention. An example ad absurdum isthe high risk of fracture when jumping from a 10th floor window. Althoughthe fracture risk is high, there is little reason to believe that a pharmacologicalintervention would in any way affect the risk. It would be inappropriate,therefore, to identify such populations in a case-finding strategy. In a morerealistic context, there is some evidence that the efficacy of bisphosphonatesis questionable when elderly patients are selected for treatment because ofstrong risk factors for falling (5). It is notable that in this latter study, theprecise criteria for inclusion were not documented, and further work isrequired to determine whether risk factors for falls or a history of falls wouldidentify a risk that was modifiable by pharmacological intervention.
5.1 Levels of evidenceThe international validity of candidate risk factors and the extent to whichthey identify a reversible risk is amenable to an evidence-based approach.
There are well-established methods for evaluating the quality of evidence ofthe effectiveness of interventions (6). The gold standard is meta-analysis ofhigh quality randomized controlled studies that show consistent effects of anintervention. Though widely accepted, this criterion is inappropriate forstudies that evaluate diagnostic tests or risk factors (7). The evaluation ofrisk factors can, however, be based on similar principles. Ideally, thepredictive value of such tests should be subject to meta-analyses, and beshown to have a high degree of consistency in populations similar to those inwhom the test would apply (level I). Thus, the demonstration of a significantrisk in postmenopausal women would not provide adequate information foruse in men. The inclusion of an internal control is appropriate for the highestlevel of evidence. Take, for example, a study showing that smoking was asignificant risk factor for fracture. The demonstration in the same study thatBMD provides the expected gradient of risk for fracture, provides an internalcontrol. Where appropriate, the demonstration of a dose-dependent effect orreversibility of effect may also be helpful in assigning high validity.
A lower level of evidence (level II studies and below) is provided by studieswith any of the following deficits: a narrow population or a sample framethat does not capture the population in whom the test would be applied; thelack of a reference standard and case-control studies, or the use of a poorinternal control. The lowest level of evidence is provided by expertcommittees or clinical experience. This provides a framework for gradinglevels of evidence (Table 5.1).
87

Table 5.1 Levels of evidence for studies of the use of risk factors
Levels of evidence Type of evidence
Ia Systematic reviews or meta-analysis of level I studies with ahigh degree of homogeneity
Ib Systematic reviews or meta-analysis with moderate or poorhomogeneity
Ic Level I studies (with appropriate populations and internalcontrols)
IIa Systematic reviews or meta-analysis of level II studies
IIb Level II studies (inappropriate population or lacking an internalcontrol)
IIIa Systematic reviews or meta-analysis of level III studies
IIIb Case-control studies
IV Evidence from expert committees without explicit criticalscientific analysis or that based on physiology, basic research orfirst principles.
As mentioned, the use of risk factors for case-finding presupposes that therisk so identified is responsive to a therapeutic intervention. To test thishypothesis, it would be necessary to recruit patients selected on the basis ofthe risk factor to a randomized controlled trial. The risk factor that is bestevaluated in this way is BMD, and indeed the vast majority of therapeuticstudies have recruited patients on the basis of low BMD, as recommended byregulatory agencies in the United States and Europe (8,9). In recent years,other trials have recruited patients on the basis of age, sex, a prior vertebralfracture, and current exposure to glucocorticoids irrespective of BMD, andhave shown therapeutic effects similar to those noted in randomizedcontrolled trials based on BMD selection (10–13).
For other risk factors, comparable data are lacking. In the absence ofempirical data, an alternative approach is to demonstrate that the presence(or absence) of a risk factor does not adversely influence therapeutic efficacyagainst fractures. Several studies have shown no significant interactionbetween response to treatment and the presence or absence of other riskfactors, including age, height, family history of fracture, low body weight orBMI, smoking, alcohol intake, biochemical markers of bone turnover,ultrasound attenuation or prior non-vertebral fracture (13–17). In contrast,some risk factors may be associated with less therapeutic efficacy. Forexample, patients selected on the basis of risk factors for falling may respondless completely to agents that preserve bone mass than those selected on thebasis of low BMD (5).
88

These considerations provide four categories of risk factors, based on levelsof evidence (Table 5.2):A. those validated by use as inclusion criteria in randomized controlled
trials;
B. those shown not to affect fracture outcomes adversely in randomized controlled trials;
C. those untested;
D. those shown to affect intervention outcomes adversely.
Note that A and B are not mutually exclusive.
Table 5.2 Categorization of risk factors for fracture according to evidence for reversible risk
Grade Description Risk factor
A Validated by use as Low BMD (DXA spine or hip)inclusion criteria in Prior vertebral fracturerandomized controlled Long-term glucocorticoid treatmenttrials Age
Postmenopausal status
B Do not adversely affect Low BMD (DXA spine or hip)fracture outcomes in Family history of fracturerandomized controlled trials Prior non-vertebral fracture
Prior vertebral fractureBiochemical markers of bone turnoverQUS (at the heel)SmokingBody weight or BMIAgeAlcohol intake
C Untested Other risk factors
D Adversely affect intervention Risk factors for fallingoutcomes
BMD, bone mineral density; DXA, dual energy X-ray absorptiometry; QUS, quantitative ultrasound;BMI, body mass index.
89

5.2 Meta-analyses of risk factorsVery many risk factors for fracture have been proposed which arise fromobservations in cross-sectional and case-control studies or prospectivecohorts. Of those listed in Table 5.2, the general validity of candidate riskfactors on an international basis is less secure. Meta-analyses are, however,available for the dependence of fracture risk on smoking (18), and BMD(19), use of oral glucocorticoids (20), as well as the influence of a priorfragility fracture on the risk of a future fracture (21). Even with these riskfactors, uncertainties remain concerning differences between men andwomen, dependence upon age, and attenuation of the predictive value of therisk factors with time.
The WHO Collaborating Centre at Sheffield has examined a series ofcandidate risk factors from 12 prospectively studied cohorts drawn from thegeneral population, using the primary data from each study (Table 5.3).Individual participant data were available for almost 60 000 men and womenfrom 12 prospective population-based cohorts comprising: the Rotterdamstudy in the Netherlands; the European Vertebral Osteoporosis Study(EVOS) – later the European Prospective Osteoporosis Study (EPOS) – from13 centres in Europe; the Canadian Multicentre Osteoporosis Study(CaMos); and cohorts from Rochester (USA), Sheffield (England), theDubbo Osteoporosis Epidemiology Study (DOES, Australia), the EPIDOSand OFELY studies (France), as well as from Kuopio (Finland), Hiroshima(Japan), and two from Gothenburg (Sweden) (22–38). The total follow-upwas somewhat over 250 000 person–years (Table 5.3).
Table 5.3 Details of cohorts studied by meta-analysis of risk factors
Cohort Number % female Person– Any Hip Osteoporotic Mean ageyears fracture fracture fracture (years)
CaMos 9 101 69 25 834 571 40 307 62DOES 2 089 61 15 994 519 103 407 70EPIDOS 1 183 100 3 947 NR 291 NR 82EVOS/EPOS 13 490 52 40 681 719 50 719 64Gothenburg I 7 065 100 29 603 440 29 312 59Gothenburg II 1 970 59 15 201 350 271 350 78Hiroshima 2 603 70 9 825 187 32 90 64Kuopio 11 691 100 56 091 1043 NR NR 52OFELY 430 100 2 144 50 NR NR 64Rochester 1 001 65 6 227 289 42 244 56Rotterdam 6 851 59 39 593 861 220 646 69Sheffield 2 170 100 6 894 292 63 243 80
TOTAL 59 644 75 252 034 5321 1141 3318 63
NR, not recorded; EVOS, European Vertebral Osteoporosis Study; EPOS, European ProspectiveOsteoporosis Study; CaMos, Canadian Multicentre Osteoporosis Study; DOES, DubboOsteoporosis Epidemiology Study; OFELY, L’os des femmes de Lyon, EPIDOS, Epidémiologie del’osteoporose.
90

Risk factors were selected on the basis of their availability and reasonableuniformity in the construct of the questionnaire used in each study.Neuromuscular disorders such as Parkinsonism and liability to falls were notassessed, since there is some doubt as to whether the risk identified on thebasis of such factors would be amenable to pharmacological intervention.Additional risk factors were assessed, but were excluded because of markedheterogeneity in the acquisition of data between cohorts or because of theirlow prevalence in the general population. These included low intakes ofcalcium (3), a premature menopause, osteoarthrosis, bilateral oophorectomyand endocrine disorders affecting the skeleton.
The following risk factors were selected on the basis of the likelihood that therisk identified would be amenable to pharmaceutical manipulation and theease with which the risk factor could be used in clinical practice as a baselineor outcome variable:• age• bone mineral density• body mass index• prior fragility fracture• ever use of oral glucocorticoids• parental history of fracture• current smoking• alcohol intake• rheumatoid arthritis.
The cohorts with risk factors contributing to each analysis are shown inTable 5.4.
Table 5.4 Risk factors for osteoporosis, examined by cohort
Body BoneRheumatoid mass Family mineral PriorCohort index history density Glucocorticoids fracture Smoking Alcohol arthritis
CaMos + + + + + + + +DOES + + + + + + + +EPIDOS + - + - - - - -EVOS/EPOS + + + + + + - -Gothenburg I + - + + + - -Gothenburg II + + + + + + - -Hiroshima + - + + + + - -Kuopio + - + - + + - -OFELY + - + - + - - -Rochester + + + + + + - -Rotterdam + + + + + + + -Sheffield + + + + + + - +
+, contributing; –, missing; EVOS, European Vertebral Osteoporosis Study; EPOS, EuropeanProspective Osteoporosis Study; CaMos, Canadian Multicentre Osteoporosis Study; DOES,Dubbo Osteoporosis Epidemiology Study; EPIDOS, Epidémiologie de l’osteoporose; OFELY, L’osdes femmes de Lyon.
91

Height and weight were measured using standard techniques in all cohorts.BMI was calculated as weight in kilograms divided by height squared inmetres. BMD tests were available in 70% of individuals. BMD was measuredat the femoral neck by DXA, except in the two Gothenburg cohorts whereBMD was assessed by DXA at the distal forearm or by Dual photonabsorptiometry at the right heel. The BMD data were also analysed excludingthese two cohorts. BMD was expressed as sex-specific and cohort-specific Z-scores.
A history of current or past smoking was obtained by self-report. There wasinadequate information to assess possible dose-response effects. Theassessment of alcohol intake differed between cohorts, and was convertedinto a daily intake expressed as units/day. A unit of alcohol is equivalent to 8g in the United Kingdom, though varies somewhat in different countries. Afamily history was collected of any fracture in first-degree relatives. Inaddition, a family history of hip fracture was noted but was available only inthree of the cohorts (39). Prior fracture history of each individual wasdocumented, though the construct of the question varied, particularly theage from which a fracture had occurred (40). Use of oral glucocorticoidsever during a person’s lifetime (ever use) was used to characterize steroidexposure, because all but three cohorts did not distinguish between ever useand current use. Neither the dose nor the duration of use was analysed. Thepresence or absence of rheumatoid arthritis was by self-report.
Fracture ascertainment was undertaken by self-report (Sheffield,EVOS/EPOS, Hiroshima, Kuopio, EPIDOS, OFELY) or verified fromhospital or central databases (Gothenburg, CaMos, DOES, Kuopio,Sheffield, EVOS/EPOS, Rochester, Rotterdam). The EPOS, OFELY,Hiroshima and the Rotterdam studies also included sequential systematicradiography to define incident vertebral deformities, but these were not usedin the analyses presented here. In the analyses, information was used on anyclinical fracture considered to be osteoporotic. In the EVOS/EPOS andCaMos studies, an osteoporotic fracture was one considered to beattributable to osteoporosis by the investigators. For the EVOS/EPOS study,osteoporotic fractures comprised hip, forearm, humeral or spine fractures.For the CaMos study they comprised fractures of the spine, pelvis, ribs, distalforearm, forearm and hip. In the other cohorts, fractures at sites consideredto be characteristic for osteoporosis were extracted (41). In addition, hipfracture alone was considered separately in the analysis.
The effect of the candidate risk factor, age and sex on the risk of any fracture,any osteoporotic fracture and hip fracture alone was examined using Poissonregression models in each cohort separately. A Poisson model was chosensince it has greater power than logistic regression and can accommodate allinformation with variable durations of follow-up. In addition, time can beaccommodated as an interaction term, and for some risk factors, relative riskmay decrease with longer durations of observation. For each risk factor
92

studied, covariates included current age and time since follow-up, with andwithout BMD. Where appropriate, interaction terms were included. Outcomevariables comprised any fracture, any osteoporotic fracture and hip fracturealone. The results of different cohorts (men separate from women) were thenmerged using weighted coefficients.
A fixed-effects model, rather than a random-effects model was used since thelatter weights the smaller cohorts disproportionately. In addition, the fixed-effects model generally gives a more conservative point estimate for the riskratio, albeit with wider confidence estimates. Heterogeneity between cohortswas tested by means of the I2 statistic (42). Where more than moderateheterogeneity was found (>50%), risk ratios were computed using therandom-effects model to determine whether the significance of estimates hadchanged. The following section summarizes the information derived from themeta-analyses.
5.2.1 AgeAge is a particularly strong risk factor for fracture, especially for hip fracture.From the known relationship of BMD and fracture risk, it might be expectedthat hip fracture risk would increase approximately 4-fold between the age of55 and 85 years in women because of the age-related decrease in bone mass.In practice, hip fracture risk in many countries increases 40-fold (43). Thus,over this age range, the impact of increasing age is 11-fold greater than theimpact of decreasing BMD. The interaction of age and BMD has beenformalized in several studies (43,44). In the case of DXA at the femoralneck, the risk of fracture by age varies markedly at the threshold ofosteoporosis, i.e. with a T-score of exactly –2.5 SD. Thus, at the age of 50years the 10-year hip fracture probability is approximately 2% in women butat the age of 80 years it is 12% for the same T-score. For any osteoporoticfracture (hip, forearm, shoulder or clinical spine fracture), the 10-yearprobability in women with a T-score of –2.5 SD varies from 11% at the ageof 50 years to 26% at the age of 80 years (Fig. 5.1) (43). Since age is such astrong determinant of fracture risk, each risk factor was examined by age.
93

Fig. 5.1 The relationship between bone mineral density at the femoral neck expressed as a T-scoreand 10-year hip fracture probability in women from Sweden according to age
Source: reference 43 (Fig. 3).BMD, bone mineral density; SD, standard deviation.
5.2.2 Bone mineral density A large number of studies have examined the relationship between BMDmeasured at various sites and fracture risk, and the available data weresummarized by meta-analysis in 1996 and 2002 (19,45). With DXAmeasured at the hip, hip fracture risk increased 2.6-fold per SD decrease inBMD, and the risk of any fracture increased 1.6-fold per SD. Since then,many additional studies with longer follow-up times have shown broadlysimilar findings (23,46–53).
Although the general relationship between BMD and fracture risk measuredat different sites has been well characterized (19), there are still gaps in ourknowledge even when using the reference of DXA at the hip. These gapsinclude whether the predictive value varies by age and sex, the stability ofpredictive value with time and whether its performance is similar at differentlevels of BMD.
SexThe meta-analysis derives values similar to those found in the previousstudies and is summarized in Table 5.5 (54). BMD measurement at thefemoral neck with DXA was a strong predictor of hip fractures. For anyfracture and for any osteoporotic fracture, the gradient of risk was lower thanfor hip fractures. For hip fracture risk, the gradient of risk was somewhathigher in men than in women since the sex-specific standard deviation differsbetween men and women. The difference in gradient of risk became lessapparent when a common SD was applied to both men and women.
94

Table 5.5 Gradient of risk (RR/SD) per SD decrease in Z-score of bone mineral density at the femoralneck in men and women
Outcome fracture RR/SDa 95% confidence RR/SDb 95% confidence interval interval
Any Men 1.47 1.34–1.60 1.44 1.32–1.58Women 1.45 1.39–1.51 1.46 1.39–1.53Combined 1.45 1.39–1.51 1.46 1.40–1.52
Osteoporotic Men 1.60 1.43–1.79 1.55 1.40–1.73Women 1.53 1.46–1.62 1.56 1.47–1.64Combined 1.55 1.47–1.62 1.56 1.49–1.64
Hip Men 2.42 1.90–3.09 2.28 1.81–2.87Women 2.03 1.87–2.21 2.18 1.99–2.39Combined 2.07 1.91–2.24 2.21 2.03–2.41
Source: reference 54 (Table 2).RR, relative risk; SD, standard deviation.aSD is age-specific and sex-specific for each cohort.bSD used is that of the young female reference range of NHANES III.
There has been some debate as to whether the gradient of risk of BMD forfracture is the same or differs between men and women (55). Differences aredescribed in selected cohorts, or when sex-specific standard deviations areused (56,57). In the present analysis, no significant difference between menand women was found, as in other population-based samples (23,58).Indeed, the age-specific risk of hip fracture at a given femoral neck BMD inmen appears to be the same in women with the same BMD and age.
AgeAge at assessment was an important factor that affected the predictive valueof femoral neck BMD. For the prediction of osteoporotic fracture, there wasa modest and not significant increase in gradient of risk with age (Table 5.6).This might be expected since osteoporotic fractures include hip fractures,which increase with age and are predicted more accurately by BMD at the hipthan is the case for other fractures. The exclusion, however, of hip fracturesin the analysis did not markedly alter the relationship of osteoporoticfracture risk with age. A much more marked and significant relationship wasfound between the gradient of risk for hip fracture and age. Gradients of risk(RR/SD) were higher at younger ages than in the elderly, and decreasedsignificantly with age (Table 5.7). For example, the gradient of risk was3.68/SD at the age of 50 years and decreased progressively with age so that atthe age of 85 years it was 1.93/SD. Similar findings have been reported in theEPIDOS study, with a lower predictive ability of DXA for hip fractures inwomen at the higher ages (46,59). In the EPIDOS study the gradient of riskfor hip fractures with a T-score of –2.5 SD or less was 4.4 at ages less than 80years and 2.5 at ages of 80 years or more. In the Study of OsteoporoticFractures (SOF), differences with age were less marked. For hip fractures inwomen assessed by DXA at the hip, the gradient of risk between the ages of65 and 79 years was 2.9, and in women aged 80 years or more was 2.1 (60).
95

Table 5.6 Gradient of risk (RR/SD) provided by bone mineral density of the femoral neck forosteoporotic fracture in men and women by age
Men Women Men and womenAge(years) Risk ratio 95 % CI Risk ratio 95 % CI Risk ratio 95 % CI
50 1.27 1.13–1.42 1.22 1.07–1.39 1.37 1.23–1.5255 1.31 1.19–1.45 1.27 1.14–1.41 1.40 1.29–1.5260 1.36 1.26–1.47 1.32 1.21–1.44 1.43 1.34–1.5365 1.41 1.33–1.51 1.38 1.28–1.48 1.45 1.37–1.5370 1.49 1.41–1.58 1.46 1.37–1.56 1.49 1.42–1.5775 1.59 1.50–1.68 1.57 1.48–1.67 1.57 1.50–1.6680 1.66 1.57–1.76 1.66 1.56–1.76 1.62 1.54–1.7185 1.66 1.54–1.78 1.65 1.53–1.79 1.54 1.44–1.63All ages 1.60 1.43–1.79 1.53 1.46–1.62 1.55 1.47–1.62
Source: reference 54 (Table 3).RR, relative risk; SD, standard deviation.
Table 5.7 Gradient of risk (RR/SD) with bone mineral density at the femoral neck for hip fracture in menand women combined by age
Age Relative(years) risk 95% confidence interval
50 3.68 2.61–5.1955 3.35 2.51–4.4760 3.07 2.42–3.8965 2.89 2.39–3.5070 2.78 2.39–3.2375 2.58 2.30–2.9080 2.28 2.09–2.5085 1.93 1.76–2.10
Source: reference 54 (Table 4).RR, risk ratio; SD, standard deviation.
The clinical significance of variations in the gradients of risk with age isnoteworthy. For example, an individual with a Z-score of –2 SD at the age of50 years would have a hip fracture risk that was 13-times that of an individualwith an average BMD (Z-score = 0) at that age (see Table 5.7), whereas therisk would be increased only 5-fold at the age of 80 years. This may befortuitously advantageous in the assessment of risk. In younger patients,greater reliance can be placed on BMD, whereas in the elderly, risk can beadditionally assessed by clinical risk factors, many of which increase infrequency with age.
Time since assessmentA concern with long-term prediction is that the predictive value of riskfactors may decrease with time as a result of variable rates of bone loss withtime. A previous study (61) modelled the decrease in the predictive ability ofBMD with time after measurement, a phenomenon that has been supportedby some but not all empirical studies (29,62,63). Huang, Ross & Wasnich(62) showed a non-significant reduction in predicting vertebral fractures bytime after measurement. After 2.7 years of follow-up, the relative risk per SD
96

decrease in BMD was 1.7 at the forearm and 1.8 at the lumbar spine. After 8years, the gradients of risk were 1.5 and 1.7, respectively. A reduction withtime after measurement was also observed by Düppe et al. (63). In thepresent analysis, there was a slight but non-significant attenuation in thepredictive ability of BMD for hip fractures the longer the follow-up. Theimmediate risk of hip fracture was 2.18/SD and the risk was 1.91/SD at 10years. There was no effect of time since assessment for any fracture or anyosteoporotic fracture. A similar result was found by Melton et al. (29) wherefemoral neck BMD predicted the risk of osteoporotic fracture as well in thefirst 10 years of follow-up (HR = 1.38) as in the subsequent 10 years (HR =1.39). Since the decrease in predictive ability was rather small, it will notmarkedly affect the computation of 10-year fracture probability that isproposed as an index of risk assessment.
Baseline bone mineral densityA more important interaction was the effect of the baseline BMD value itselfon predictive value. Gradients of risk were lower the higher the Z-score (Fig.5.2). The effect was marked for the prediction of osteoporotic fracture or anyfracture, and was also evident for hip fracture prediction, though notstatistically significant. Reasons for this are conjectural but might be relatedto the lower body mass index which is associated with lower values of BMD,and also perhaps to co-morbidity, muscle weakness or less padding with fatto protect against injury (32,64,65). In addition, lower BMD values may beassociated with structural changes in bone (e.g. increased bone area butthinner cortices or higher rates of bone remodelling) that reduce resistance tofracture (66). Irrespective of the mechanism, the effect is large in the case ofosteoporotic fracture risk, so that account should be taken of this for theoptimal assessment of patients.
97

Fig. 5.2 Risk ratio for 1 SD change in Z-score for bone mineral density in men and women combined(Z-score range from –5.1 to +5.8)
Source: reference 54 (adapted from Table 6).RR, risk ratio; SD, standard deviation.
These analyses indicate that assessment of femoral neck BMD provides astrong indicator for fracture risk that is largely independent of sex. Itspredictive value is not significantly attenuated with time after assessment overa 10-year interval, suggesting that it can be used to compute long-termfracture probabilities. The significance of BMD as a risk factor dependsupon the absolute level of BMD when used to predict any fracture or anyosteoporotic fracture. In addition, the gradient of risk for hip fracture ishigher in younger individuals. These characteristics need to be accounted forto make best use of BMD in a clinical setting.
5.2.3 Body mass indexLow weight, or low BMI, is a well-documented risk factor for future fracture,whereas a high BMI appears to be protective (67–76). The increasingprevalence of overweight and obesity in high-income societies (77,78) mightat first seem a promising development from the point of view of osteoporosisand fracture prevention. From a public health point of view, however, beingoverweight or obese is associated with increased morbidity from diabetes,hypertension and cardiovascular diseases, as well as increased mortality (79).Recently it was estimated that overweight (BMI>25 kg/m2) 40-year-oldfemale non-smokers lost on average 3.3 years of life, whereas obese (BMI>30kg/m2) female non-smokers lost 7.1 life years (80). It is important, therefore,to quantify the association between BMI and fracture risk, and to explore itsrelationship to age, sex and BMD, with the aim of being able to give balancedadvice on lifestyle. These relationships are also important when using BMI toassess fracture risk in case-finding (68,81–84).
98

The present meta-analysis explored the relationship of BMI with fracturerisk (any fracture, any osteoporotic fracture and hip fracture alone) in menand women. BMI was chosen rather than weight to explore this associationbecause of the wide variation in average weight and height between differentcountries, which is reduced by adjusting weight for height. Moreover, BMI isas good a predictor of fractures as weight in most studies of hip fractureoutcomes (2,85).
Sex and ageThe principal finding of this analysis was the confirmation that low BMI isassociated with a substantial increase in fracture risk, of similar magnitudein men and women, whereas a high BMI is protective (86). This riskassociated with a low BMI was present at most ages and for all types offracture studied, but was strongest for hip fracture. Without information onBMD, the risk ratio per unit increase in BMI for any fracture was 0.98, forosteoporotic fracture 0.97 and for hip fracture 0.93 (Fig. 5.3). As this figureshows, the RRs per unit change of BMI in men and women were very similarand not significantly different (p>0.30).
Fig. 5.3 Risk ratio for fracture per unit increase in body mass index: (a) adjusted for current age andtime in study; (b) additionally adjusted for bone mineral density
Source: reference 86 (Fig. 1).RR, risk ratio; BMI, body mass index; BMD, bone mineral density; M, male; F, female.
Although there were no significant differences in the gradients of fracturerisk between men and women, there was a significant increase in riskassociated with low BMI with age, for any fracture and for osteoporoticfractures, but an opposite trend for hip fractures (Fig. 5.4). For any fractureand for any osteoporotic fracture, the gradient of risk per unit of BMIincreased with advancing age (without adjustment for BMD). In contrast, forhip fractures the gradient of risk decreased with age, although this trend wasnot significant. When hip fractures were excluded from the osteoporotic
99

fractures, a similar trend with age was observed as seen for all osteoporoticfractures. After correction for BMD, the risk gradients showed similar, butnon-significant trends with age, but at most ages were not significantlydifferent from 1.
Fig. 5.4 Relative fracture risk per unit increase in body mass index by age for men and womencombined: (a) adjusted for current age and time in study; (b) additionally adjusted for bonemineral density
Source: reference 86 (Fig. 2).BMI, body mass index; BMD, bone mineral density.
In the case of any fracture or osteoporotic fracture, the higher risk with agemay be the result of longer exposure to gonadal deficiency (87). A furtherpossible explanation is that in young individuals, low BMI may be associatedwith physical fitness and a lower risk of fracture. In contrast, in elderlypeople, where hip fractures are more common, low BMI may more likely berelated to frailty.
Baseline body mass indexAlthough the risk of fracture increased with decreasing BMI, the risk ratiowith BMI was non-linear (Table 5.8). The risk ratio was markedly higher atthe lower values of BMI, particularly with a BMI of 20 kg/m2 or less. Bycontrast, between a BMI of 25 and 35 kg/m2, the differences in risk ratio weresmall. For example, when compared with a BMI of 25 kg/m2, a BMI of 20kg/m2 was associated with a nearly 2-fold increase in risk ratio (RR = 1.95)for hip fracture. In contrast, a BMI of 30kg/m2 when compared with a BMIof 25 kg/m2 was associated with only a 17% reduction in hip fracture risk (RR= 0.83).
100

Table 5.8 Risk ratio for fracture at various levels of body mass index (kg/m2) for men and womencombined, adjusted for current age and time in study, without and with adjustment for bonemineral density (the reference is a body mass index of 25 kg/m2)
Any fracture Osteoporotic fracture Hip fracture
BMI RR 95 % CI RR 95 % CI RR 95 % CI
Not adjusted for BMD15 1.66 1.31–2.09 1.79 1.35–2.37 4.48 3.11–6.4520 1.21 1.12–1.30 1.27 1.16–1.38 1.95 1.71 –2.2225 1.00 Reference 1.00 Reference 1.00 Reference30 0.92 0.85–1.00 0.89 0.81–0.98 0.83 0.69–0.9935 0.85 0.74–0.98 0.74 0.62–0.90 0.75 0.50–1.1140 0.80 0.62–1.03 0.57 0.39–0.85 0.53 0.18–1.56
Adjusted for BMD15 1.00 0.75–1.33 1.07 0.78–1.48 2.16 1.42–3.2820 0.98 0.9–1.08 1.02 0.92–1.13 1.42 1.23–1.6525 1.00 Reference 1.00 Reference 1.00 Reference30 1.01 0.91–1.11 0.96 0.86–1.08 1.00 0.82–1.2135 0.99 0.82–1.19 0.91 0.73–1.13 1.18 0.78–1.8040 0.99 0.68–1.43 0.89 0.56–1.4 1.25 0.44–3.57
Source: reference 86 (Table 3).RR, risk ratio; BMI, body mass index; BMD, bone mineral density; CI, confidence interval.
There appears to be, therefore, an inflection point such that increased BMIover 22 kg/m2 is associated with modest decreases in fracture risk, whereasbelow this threshold the risk is markedly increased (Fig. 5.5).
Fig. 5.5 Relative fracture risk at various levels of body mass index (BMI) for men and womencombined (reference level: BMI=25 kg/m2): (a) adjusted for current age and time in study; (b)additionally adjusted for bone mineral density
Source: reference 86 (Fig. 3). RR, risk ratio; BMI, body mass index; BMD, bone mineral density.
101

The threshold of 22 kg/m2 and lower corresponded overall in these cohorts toabout 10% of men and 17% of women. A non-linear relationship of BMIwith fracture risk, with thresholds of BMI of approximately 22 kg/m2 and 26kg/m2, has been described previously in case-control studies of men andwomen, respectively (2,85). These studies all indicate that obesity should notbe regarded as an important protective factor for fracture risk (88,89).Rather, leanness should be regarded as a significant risk factor. The findingthat leanness is much more important as a risk factor, than obesity is as aprotective factor, means that advice concerning body weight and osteoporosisneed not be inconsistent with the weight control advocated for the preventionof cardiovascular disease or diabetes.
Bone mineral densityThe analysis additionally demonstrates that this gradient of risk with BMI ismarkedly reduced when adjusted for BMD (see Fig. 5.3), suggesting thatBMD is an important intermediary or confounder. In contrast, the use of lowBMI as a risk factor in the absence of BMD, will identify populations with alow BMD and hence a high risk of fracture.
After adjustment for BMD, a low BMI was not predictive of fracture riskexcept for hip fracture at a BMI of 20 kg/m2 or less. Since low BMI remaineda significant risk factor for hip fracture, it can still contribute to enhance thepredictive value of BMD in case-finding. The mechanisms for this effect areconjectural but might include muscle weakness (90), perhaps associated withnutritional deficiencies of protein or vitamin D (90,91), decreased paddingover the greater trochanter (92), or a greater liability to fall (76).
For BMD, it is customary to express the relation with fracture risk as agradient of risk per SD change. For hip fracture, for example, the mostcommonly cited number is that of a relative risk of 2.6/SD decrease in BMD(19). In the populations that we studied, the average SD for BMI was around4 kg/m2, corresponding to a RR for hip fracture of 1.4/SD decrease in BMI,much lower than the estimate for BMD. The analogy is, however, not whollyappropriate in view of the non-linearity of risk with BMI.
Overall, the analysis indicates that low BMI confers a risk of fracture ofsubstantial importance that is largely independent of sex. The significance ofBMI as a risk factor varies according to the level of BMI and to a lesserextent with age. Its validation on an international basis permits the use of thisrisk factor, at least in the absence of a BMD measurement, in case-findingstrategies. Even with BMD included in the assessment, a low BMI remains anindependent risk factor for hip fracture.
5.2.4 Previous fractureIt is well established from many cohort, case-control and cross-sectionalstudies that a prior osteoporotic fracture increases the risk of future fractures(93–100). A prior forearm fracture is associated with about a 2-fold increase
102

in the subsequent risk of fracture (101–105). More recently, significantincreases in risk have been described for prior fractures at other sitescharacteristic of osteoporosis (99,106–114). The risk of another vertebralfracture is particularly high after a spine fracture (106,115–117). Similarobservations are found in the setting of randomized clinical trials. In theplacebo arm, the risk of vertebral deformities is approximately 5-fold higherin patients with a prior vertebral deformity than in those without(96,118,119). The interrelationships between the site of prior fracture andsite of subsequent fracture have been summarized by meta-analysis (21), anda large case-control study, published more recently, found broadly similarrelationships (100). The increase in fracture risk appears to be highestimmediately after a fracture event, particularly in the first year. The riskdecreases over subsequent years, but remains higher than that of the generalpopulation (96–98).
Increased fracture risk may be in part attributable to the fact that patientswith fracture have low BMD. Studies that have adjusted for BMD suggestthat the relative risk is only modestly downwardly adjusted(64,67,95,117,120–122).
The consistent association between a prior fracture and subsequent fracturerisk has led to the inclusion of prior fracture as a risk factor to be used inassessment guidelines (81–83,123). There are still some unresolved questionsthat concern the effect of age, sex and BMD on this risk.In the present analysis (40), the probability of a positive fracture history rosealmost linearly with age from about 24% at the age of 30 years to 45% at theage of 90 years. The probability of a prior fracture was significantly higher inmen than in women (odds ratio = 1.19; 95% CI = 1.14 – 1.25).
Sex and fracture outcomeThe present study confirms that a history of prior fracture is a significant riskfactor for future fractures. Previous fracture was associated with asignificantly increased risk of any subsequent fracture (Table 5.9). There wasno difference in the risk ratio between men and women. Previous fracture wasalso associated with a significantly increased risk of an osteoporotic fractureat all ages, with and without adjustment for BMD. The unadjusted risk ratiosfor an osteoporotic fracture were almost identical with the risks of a priorfracture for any fracture. For example, at the age of 80 years the risk of anyfracture was 1.88 in men and women combined, and for an osteoporoticfracture was 1.89. A prior fracture history was a significant risk factor for hipfracture at all ages.
103

Table 5.9 Risk ratio and 95% confidence interval of fracture associated with a history of prior fracturein men and women, without and with adjustment for bone mineral density
Men Women Men and women
Outcome fracture RR 95% CI RR 95% CI RR 95% CI
Without BMDAny 2.02 1.73–2.38 1.84 1.72–1.96 1.86 1.75–1.98Osteoporotic 1.93 1.61–2.33 1.85 1.70–2.01 1.86 1.72–2.01Hip 2.30 1.56–3.41 1.77 1.49–2.11 1.85 1.58–2.17
With BMDAny 2.04 1.67–2.48 1.73 1.59–1.88 1.77 1.64–1.91Osteoporotic 1.91 1.50–2.43 1.74 1.57–1.92 1.76 1.60–1.93Hip 1.97 1.12–3.48 1.56 1.23–1.98 1.62 1.30–2.01
Source: reference 40 (Table 4).RR, risk ratio; CI, confidence interval; BMD, bone mineral density.
The risk of subsequent fractures is not as great as that identified in somestudies (100) but, as expected, falls within the confidence intervals of mostestimates (21). Discrepancies may be related to the duration of follow-up,since the risk of subsequent fracture may not be linear over time (96–98).Other possible reasons may relate to differences in the populations studiedand the questionnaire used to identify prior fractures.
AgeThe large sample size permitted the quantification of risk by age. For allfractures and for osteoporotic fractures, the risk ratios were relativelyconstant with age. In the case of hip fracture, risk ratios decreased (Table5.10) by about 10% per decade of age (Fig. 5.6) but the trend was short ofconventional significance (p=0.089). The risk ratio was highest at youngerages and decreased progressively with age (p<0.002 for the interaction term).The risk ratio was significantly increased at all ages, but at ages less than 60years, the confidence estimates were wide (because of the small number ofhip fractures). There was no difference in the risk ratio between men andwomen.
104

Table 5.10 Risk ratio for any fracture and 95% confidence interval and for hip fracture comparing withand without adjustment for bone mineral density when combining men and women as wellas with and without a previous fracture by age
Any fracture Hip fracture
RR without BMDa RR with BMDa RR without BMD RR with BMDAge(years) Mean 95% CI Mean 95% CI Mean 95% CI Mean 95% CI
50 1.92 1.63–2.20 1.91 1.59–2.29 5.04 2.66–9.56 3.88 1.79–8.4355 1.90 1.73–2.09 1.83 1.60–2.10 4.20 2.46–7.15 3.98 2.08–7.6260 1.98 1.80–2.18 1.94 1.73–2.17 3.40 2.21–5.24 3.16 1.88–5.3265 2.02 1.86–2.20 1.99 1.81–2.20 2.60 1.85–3.64 2.28 1.52–3.4170 2.03 1.87–2.21 1.98 1.79–2.18 2.31 1.76–3.02 1.90 1.37–2.6575 1.96 1.80–2.13 1.82 1.65–2.02 2.14 1.71–2.68 1.64 1.24–2.1780 1.88 1.72–2.06 1.72 1.54–1.91 1.90 1.58–2.28 1.41 1.12–1.7885 1.83 1.65–2.04 1.72 1.51–1.96 1.66 1.39–1.98 1.32 1.04–1.68
All ages 1.86 1.75–1.98 1.77 1.64–1.91 1.85 1.58–2.17 1.62 1.30–2.01
Source: reference 40 (Tables 5 and 6).RR, risk ratio; CI, confidence interval; BMD, bone mineral density.aPrior fracture versus no fracture.
Fig. 5.6 Risk ratio for an osteoporotic fracture in men and women combined, with a prior history offracture, with and without adjustment for bone mineral density
Source: reference 40 (Fig. 1). RR, risk ratio; BMD, bone mineral density
Bone mineral densityIn addition, the effect of fracture history is over and above that which can beexplained by variations in BMD. The risk ratio was marginally lower, byapproximately 10%, when account was taken of BMD. If it is assumed thatthe risk of any fracture increases 1.60-fold for each SD deviation decrease in
105

femoral neck BMD, then the difference in risk between those with andwithout a prior fracture is equal to an expected difference in BMD of 1.32SD. In reality the overall difference in BMD at all ages in men and womencombined was approximately 0.11 SD. Thus, low BMD accounts for onlyabout 8% of the difference in risk between those with or without a priorfracture.
Adjustment for BMD had an effect on the risk estimate for hip fracture thatwas quantitatively greater than for all fractures. The risk ratio adjusted forBMD fell by approximately 30%. As in the case of all fractures, differences inBMD explained a minority of the increased risk ratio for hip fracture. In menand women combined, low BMD explained 22% of the increase in risk ratioattributable to a prior fracture and was constant by age (assuming a gradientof risk for hip fracture of 2.6/SD decrease in BMD).
The mechanism for the BMD-independent increase in risk could not bedetermined from this analysis but is likely to be attributable, in part, to co-existing morbidity that might increase the risk of falls or impair theprotective responses to injury (99,114,121,124). In addition, changes in themicro-architecture of cancellous and cortical bone with rapid bone loss afterfracture or immobilization (125–127) may weaken the resistance tomechanical force out of proportion to any effect on BMD. Irrespective of theunderlying mechanism, these data indicate that the risk of fractures issubstantially greater in individuals with a prior fragility fracture than inindividuals of the same age, sex and BMD without such a fracture.
5.2.5 GlucocorticoidsThe adverse effects of glucocorticoids on bone fragility have been appreciatedfor many years. A major mechanism relates to the progressive loss of bonethat occurs once glucocorticoids are started, but the underlying condition forwhich they are used may also be a factor. Irrespective of the mechanism,epidemiological data suggest that the risk of hip, forearm and shoulderfractures is increased approximately 2-fold in patients taking glucocorticoids(128–130). The risk for vertebral fracture may be somewhat higher (130).The largest and most recent study examined fracture risk in the generalpractice research data base of the United Kingdom (130), whereapproximately 250 000 glucocorticoid users were compared with age-matched and sex-matched controls. A dose-dependent effect on fracture riskwas noted, and at a dose of prednisolone or its equivalent greater than 7.5 mgdaily, the relative risk of vertebral fracture was 5.2, whereas between 5 mgand 7.5 mg daily the risk was lower (relative risk = 2.6). The dependence ofthis risk on BMD is not known. Of particular interest was the observationthat the increase in fracture risk had a rapid onset when startingglucocorticoids, and waned rapidly when they were stopped (130). Thisrapid onset and offset of effect suggests that risk may in part be independentof BMD, since BMD does not change so quickly.
106

Glucocorticoid use has been recognized as a significant risk factor in currentclinical guidelines for the assessment of osteoporosis (81–83, 131–134).Under most of these guidelines, patients taking glucocorticoids should beconsidered for treatment if BMD falls below the threshold for osteoporosis.If, however, the use of glucocorticoids is not wholly dependent on BMD, thenfracture risk assessment should take into account the independent riskassociated with glucocorticoids. This is not well established, nor is thepossible variation of risk with age and sex well understood. Theseuncertainties motivated the present analysis.
The principal finding was that prior glucocorticoid use confers a substantialincrease in fracture risk (135), as was shown in the large United Kingdomgeneral practice study (130). The present analysis additionally demonstratedthat this risk is largely independent of BMD or a prior fragility fracture.
The ever use of glucocorticoids was associated with a significantly increasedrisk of any fracture at all ages, compared to the risk faced by people with nohistory of the use of glucocorticoids (Table 5.11). This increase in relativerisk was not explained by differences in BMD. For example, for individualsaged 50 years, the relative risk for any fracture for a person ever treated withglucocorticoids was 1.98 compared to an individual never treated withglucocorticoids when adjusted for BMD; and the relative risk was also 1.98when the model did not take account of BMD. The relative risk ranged from1.98 at the age of 50 years to 1.66 at the age of 85 years. Although theincrease in relative risk was most marked at ages younger than 65 years, aspreviously observed (46), there was no statistical difference in relative risk byage, or between men and women.
Table 5.11 Risk ratio of any fracture, osteoporotic fracture and hip fracture, and 95% confidenceinterval, associated with ever use of glucocorticoids in men and women combined,according to age and adjusted for bone mineral density
Any fracture Osteoporotic fracture Hip fractureAge (years) Risk ratioa 95% CI Risk ratio 95% CI Risk ratio 95% CI
50 1.98 1.35–2.92 2.63 1.68–4.13 4.42 1.26–15.4955 1.83 1.35–2.47 2.32 1.63–3.30 4.15 1.50–11.4960 1.67 1.33–2.09 2.00 1.52–2.62 3.71 1.67–8.2365 1.56 1.29–1.88 1.81 1.43–2.27 2.98 1.55–5.7470 1.55 1.30–1.86 1.76 1.42–2.19 2.44 1.37–4.3675 1.64 1.37–1.97 1.70 1.36–2.11 2.22 1.35–3.6380 1.62 1.31–2.00 1.59 1.26–2.02 2.13 1.39–3.2785 1.66 1.26–2.17 1.71 1.29–2.28 2.48 1.58–3.89
All ages 1.57 1.37–1.80 1.66 1.42–1.92 2.25 1.60–3.15All agesb 1.53 1.61 2.13
Source: reference 135 (Table 3).CI, confidence interval.aEver use versus no use.bEver use versus population risk.
107

For osteoporotic fractures, risk ratios were higher than those for all fracturescombined (see Table 5.11). As in the case for all fractures, relative risk washigher at younger ages, but not significantly so. Nor was there a significantdifference in relative risk between men and women. There was a smallincrease in relative risk when BMD was excluded from the model, but thequantitative effect was small: relative risk at 50 years with and without BMDin the model was 2.54 and 2.63, respectively.
The highest gradients of risk were observed for hip fracture (see Table 5.11).The risk ratios ranged between 2.13 and 4.42, depending on age. As in thecase of osteoporotic fractures, the relative risk was higher at younger ages,but not significantly so. Also, there was no significant difference between menand women. When BMD was excluded from the model, the risk ratio waslower up to the age of 75 years (Fig. 5.7).
Fig. 5.7 Relative risk of hip fracture associated with ever use of glucocorticoids according to age,with and without adjustment for bone mineral density, in men and women combined
Source: reference 135 (Fig. 1). RR, risk ratio; BMD, bone mineral density.
Current use of glucocorticoids was documented in cohorts from Rotterdam,Dubbo and Sheffield. BMD at the femoral neck was lower in current users ofglucocorticoids, but the effect was small (Table 5.12).
108

Table 5.12 Bone mineral density at the femoral neck according to use of glucocorticoids
Use of glucocorticoids
Never Past Ever Current
(a) Rotterdam studySample size 5665 116Age (years)a 70.3 ± 9.6 69.7 ± 9.6BMD (g/cm2) 0.84 ± 0.14 0.80 ± 0.12b
(b) Sheffield cohortSample size 1942 137 64Age (years)a 80.0 ± 3.9 79.5 ± 3.7 79.6 ± 3.3BMD (g/cm2) 0.65 ± 0.12 0.64 ± 0.13 0.62 ± 0.10c
(c) DOESSample size 1980 24 56Age (years)a 70.7 ± 7.2 71.1 ± 7.4 70.0 ± 5.5BMD (g/cm2) 0.83 ± 0.15 0.78 ± 0.13 0.77 ± 0.15d
Source: reference 135 (Table 4).BMD, bone mineral density; DOES, Dubbo Osteoporosis Epidemiology Study.aAge in individuals where use is documented.bP<0.01 compared with past use.cP<0.05 compared with never use.dP<0.01 compared with never use.
The mechanism for the BMD-independent increase in risk could not bedetermined from this analysis, but could be attributable, at least in part, tothe nature of the underlying diseases for which glucocorticoids wereprescribed. In the cohorts in which this could be examined, rheumatoidarthritis was associated with an independent risk of fracture which persistedwhen adjusted for glucocorticoid use (see below). There was, however, asignificant effect of glucocorticoid treatment on fracture risk even whenadjusted for rheumatoid arthritis. Adverse effects of glucocorticoids onmuscle strength and metabolism may also have increased the liability offalling or impaired protective responses to falling, thereby increasing fracturerisk. A further possibility is the effects of these agents on skeletalarchitecture, which appear to differ from the effects of gonadal deficiency atsites of cancellous bone (136,137). It is also suggested that glucocorticoidsaffect osteocyte viability (138) resulting in alterations in the materialproperties of bone.
Irrespective of the mechanism, these data indicate that the risk of allfractures is substantially greater in glucocorticoid-induced osteoporosis thanin postmenopausal osteoporosis for the same level of BMD.
5.2.6 Family historyThere is a great deal of evidence for the importance of genetic factors in thedetermination of BMD (139–143). Studies in twins have shown lessdifference in bone mass between monozygotic than dizygotic twins(144–147). With few exceptions (148), however, studies that have measured
109

BMD have used absorptiometric techniques, so that it is difficult todistinguish the component of skeletal size from true differences in bonedensity. Indeed, the hereditability of height is probably as great as thatreported for apparent bone density (149). The genetic component of peakbone mass appears to vary between skeletal sites, and is more marked at thelumbar spine than at the forearm, hip or calcaneus (150). With advancingage, differences in BMD between monozygotic and dizygotic twins are lessapparent, suggesting that environmental factors assume greater importancethan earlier in life (144–145).
A family history of fracture appears also to be a risk factor for fracture(47,73). Hip fracture risk is increased among daughters whose mothers hada prior history of fragility fractures after the age of 50 years (151–153). Inthe Study of Osteoporotic Fractures in the United States, the risk of hip orwrist fracture was increased in those women with a family history of wrist orhip fracture and was not wholly dependent on BMD (67,154). This is notwell established in other communities, nor has the possible variation of riskwith age and sex been well studied. Nonetheless, a family history of fracturehas been recognized as a significant risk factor in current clinical guidelinesfor the assessment of osteoporosis (81–83, 123,133,134,155).
In the present meta-analysis, 16% of individuals reported a maternal historyof any fracture (39). A paternal and sibling history of fractures was reportedby 13% and 15% of individuals, respectively. Maternal, paternal or siblinghistories of hip fracture were reported by 6%, 4% and 2% of individuals,respectively.
Family history of fractureThere was no significant difference in fracture risk ratios between men andwomen, even though the point estimates were generally higher in men than inwomen. The risk ratios of men and women combined are shown in Table5.13. A parental history of fracture was associated with a significantlyincreased risk of any fracture, any osteoporotic fracture or hip fracture. Riskratios were slightly higher for hip fracture (RR = 1.63) than for any fracture(RR = 1.18) or for any osteoporotic fracture (RR = 1.22).
110

Table 5.13 Risk ratio and 95% confidence interval associated with (a) a parental history of fracture inmen and women combined, with and without adjustment for bone mineral density and (b) aparental history of hip fracture in men and women combined
Without BMD With BMD
Outcome fracture RR 95% CI RR 95% CI
Parental history of fracturea
Any 1.18 1.06–1.31 1.18 1.07–1.31Osteoporotic 1.22 1.08–1.37 1.22 1.08–1.38Hip 1.63 1.25–2.12 1.63 1.24–2.13
Parental history of hip fracturea
Any 1.42 1.19–1.71 1.41 1.17–1.71Osteoporotic 1.54 1.25–1.88 1.54 1.25–1.88Hip 2.27 1.47–3.49 2.28 1.48–3.51
Source: reference 39 (Table 7).BMD, bone mineral density; RR, risk ratio; CI, confidence interval.a The analysis only includes individuals for whom a BMD test was available.
The association of maternal or paternal history was stronger for hip fracturerisk than for the risk of osteoporotic or any fracture. When maternal,paternal and sibling history was combined, risk ratios were marginally higher,but the findings were similar to the combination of maternal and paternalhistory.
Thus, the present analysis confirms that a family history of fracture confersa small increase in fracture risk, as has been shown in several observationalstudies (47,67,73,154).
Family history of hip fracture A parental history of hip (rather than any) fracture gave a risk ratio for anyfracture of 1.42, similar to that for any osteoporotic fracture (RR = 1.54).The highest risk was for hip fracture (RR = 2.27; see Table 5.13).
Family history and ageAnalyses were undertaken for a parental history of osteoporotic fracture andof hip fracture. There were no differences between men and women (p>0.3),and the data were combined. For a family history of any fracture, risk ratiosremained stable up to the age of 70 years and thereafter appeared to decrease,and the risk ratio was no longer significantly increased at the age of 80 yearsor more (Table 5.14). The changes with age were not significant. For hipfracture outcomes, the risk ratios were higher than for osteoporotic fracture,but the confidence intervals were wide and the association not significant atages 50 or 55 because of the small number of fractures (Table 5.15). Riskratios appeared to decrease with age but the trend was not significant for hipfracture (p>0.30), for any osteoporotic fracture (p>0.2) or for osteoporoticfracture (p = 0.08).
111

Table 5.14 Risk ratio with 95% confidence interval for osteoporotic fracture and for hip fracture, with aparental history of fracture, in men and women combined, by age
Osteoporotic fracture Hip fractureAge(years) RR 95% CI RR 95% CI
50 1.31 1.02–1.69 1.63 0.69–3.8655 1.29 1.05–1.59 1.73 0.84–3.5860 1.28 1.08–1.51 1.82 1.01–3.2765 1.27 1.11–1.46 1.86 1.17–2.9670 1.25 1.10–1.42 1.79 1.24–2.5775 1.20 1.06–1.35 1.53 1.14–2.0780 1.12 0.98–1.28 1.35 1.04–1.7585 1.08 0.91–1.27 1.31 0.99–1.73
Source: reference 39 (Table 5).RR, risk ratio; CI, confidence interval.
Table 5.15 Risk ratio with 95% confidence interval for osteoporotic fracture and for hip fracture with aparental history of hip fracture, by age, in men and women combined
Osteoporotic fracture Hip fractureAge(years) RR 95% CI RR 95% CI
50 1.80 1.19–2.72 2.34 0.64–8.5255 1.66 1.21–2.30 2.36 0.81–6.9060 1.56 1.22–1.98 2.41 1.03–5.6465 1.50 1.23–1.82 2.44 1.27–4.6870 1.47 1.21–1.77 2.57 1.53–4.3075 1.31 1.07–1.61 1.75 1.08–2.8280 1.14 0.91–1.44 1.26 0.82–1.9485 1.14 0.86–1.51 1.33 0.87–2.02
Source: reference 39 (Table 6).RR, risk ratio; CI, confidence interval.
Family history and bone mineral densityThe influence of a maternal or paternal history of fracture on osteoporoticfracture or hip fracture was not affected by the inclusion of BMD in themodels (see Table 5.13). For a family history of hip fracture, the risk ratioswere also unaffected by the inclusion of BMD.
The total independence of this risk factor from BMD is consistent with somereports (122,156), but several studies suggest that a family history isassociated with modest reductions in BMD (153,157–160). Geneticinfluences on BMD, however, appear to wane with time (144,145), and thisview is consistent with the trend that we observed with parental history andage on the risk of fracture.
The mechanism for the BMD-independent increase in risk could not bedetermined from this analysis, but it may not be entirely attributable toskeletal factors, at least as captured by the measurement of BMD. A family
112

history may act, for example, as a surrogate for falls. The frequency of fallingis less in black people than among whites (161), as is the risk of fracture,which might indicate an important genetic factor related to falls. It was notpossible to investigate other important skeletally-related factors such as thesize and shape of bone or the micro-architecture of trabecular elements incancellous bone. It was possible, however, to determine that height did notaffect the relationship between family history and fracture outcome.Increasing height was associated with an increased risk of osteoporoticfracture independently of a parental history of fracture. For osteoporoticfracture, the risk ratio increased by 1.02 for each centimetre increase inheight. A similar effect was noted for hip fracture (RR = 1.03). There was,however, little or no effect of the adjustment on the RR associated with aparental history.
Although the separate effects of maternal, paternal or sibling history, eitheralone or in combination, have been assessed (39), attention is focused on thecombination of a maternal or paternal history of fracture. This may bepreferred to a combination of maternal, paternal and sibling history, eventhough the risk ratio of the latter may be somewhat higher, since theprobability of a positive sibling fracture history varies markedly around theworld.
5.2.7 SmokingIt is well established that smoking is associated with a reduction in BMD inpostmenopausal women and in men (139). A meta-analysis has suggestedthat the risk of hip fracture may also be markedly increased (18). In currentsmokers compared with non-smokers, the risk of hip fracture was similar inwomen up to the age of 50 years, but increased thereafter with age, with a riskratio of 1.17, 1.41 and 1.71 at the ages of 60, 70 and 80 years, respectively. Inwomen at the age of 90 years, the risk ratio was 2.08 (18). In population-based samples, the risk of other osteoporotic fractures appears also to beincreased (162), but this is not an invariant finding (163). The risk offorearm fractures does not appear to be increased among smokers(162,164–166).
Increased fracture risk may in part be attributable to the fact that patientswho smoke have low BMD. Studies that have adjusted for BMD suggest thatthe relative risk is only modestly downwardly adjusted (67). In the meta-analysis of Law and Hackshaw (18), the difference in bone density betweensmokers and non-smokers was not apparent at the age of 50 years, butincreased with increasing age, so that at the age of 80 years BMD at the hipwas 0.45 SD lower in smokers compared to non-smokers. From therelationship between hip BMD and hip fracture risk, the risk ratio in smokerswas estimated at 1.56, compared with a direct estimate of 1.71 for hipfractures, leading the authors to suppose that the majority of any risk wasattributable to decreased bone density. The aim of the present analysis was toexamine the relationship between fracture risk and smoking, and the
113

interactions with age and BMD (167).The prevalence of smoking among the cohorts decreased almost linearly withage in men and women. At all ages, current smoking was higher in men thanin women. At the age of 50 years a smoking history was obtained in 41% ofmen and 27% of women and, by the age of 85 years, was 17% and 6%,respectively.
Current smoking and sexCurrent smoking was associated with a significantly increased risk of anyfracture, any osteoporotic fracture or a hip fracture in both men and women(Table 5.16). For any fracture and for osteoporotic fracture, the risk insmokers was significantly higher in men than in women. For hip fracture,there was no difference in the risk ratio between men and women. For hipfracture risk in women, the increase in risk ratio (RR = 1.85) was comparableto that described in the meta-analysis by Law and Hackshaw (18). In menand women combined, the risk of fracture with current smoking was highestfor hip fracture (RR = 1.84), lowest for any fracture (RR = 1.25) andintermediate for osteoporotic fracture (RR = 1.29).
Table 5.16 Risk ratio of fracture and 95% confidence interval associated with current smoking, byfracture outcome in men and women
Outcome Sex RR 95% CI RRa 95% CI
Any fracture M 1.50b 1.26–1.77 1.49b 1.20–1.84F 1.18 1.07–1.30 1.02 0.90–1.16
M+F 1.25 1.15–1.36 1.13 1.01–1.25
Osteoporotic M 1.53b 1.27–1.83 1.54b 1.21–1.95fracture F 1.20 1.06–1.35 1.01 0.87–1.17
M+F 1.29 1.17–1.43 1.13 1.00–1.28
Hip fracture M 1.82 1.34–2.49 1.69 1.16–2.48F 1.85 1.46–2.34 1.55 1.16–2.07
M+F 1.84 1.52–2.22 1.60 1.27–2.02
Source: reference 167 (Table 3).RR, risk ratio; CI, confidence interval.aAdjusted for bone mineral density.bSignificantly higher RR compared with women.
AgeThe large sample size studied permitted the examination of risk by age. Riskratios attributable to smoking increased with age for any fracture and forosteoporotic fracture (Table 5.17) and were significantly higher than unity atall ages. In contrast, for hip fracture risk, the risk ratio decreased with age butwas significantly higher than unity at all ages. This contrasts with the findingsof Law and Hackshaw (18), where risk ratios increased with age. Thedecrease with age was, however, not significant and, if real, much largersamples would be needed to verify such an effect.
114

Table 5.17 Risk ratio and 95% confidence interval for osteoporotic fracture and hip fracture in currentsmokers, for men and women combined
Without BMD Adjusted for BMDAge(years) RR 95% CI RR 95% CI
Osteoporotic fracture50 1.05 0.80–1.37 0.82 0.57–1.1855 1.06 0.86–1.30 0.85 0.65–1.1260 1.08 0.92–1.26 0.88 0.72–1.0865 1.14 1.00–1.30 0.91 0.76–1.0970 1.27 1.12–1.45 1.01 0.85–1.2075 1.45 1.28–1.65 1.20 1.01–1.4380 1.54 1.34–1.77 1.30 1.08–1.5785 1.52 1.28–1.80 1.28 1.00–1.63
Hip fracture50 2.52 1.24–5.10 2.28 0.94–5.5155 2.35 1.32–4.19 2.09 1.03–4.2460 2.17 1.38–3.44 1.87 1.07–3.2565 1.98 1.38–2.86 1.68 1.07–2.6570 1.92 1.42–2.60 1.69 1.15–2.4875 1.94 1.52–2.49 1.76 1.30–2.3780 1.91 1.55–2.35 1.69 1.31–2.1985 1.80 1.43–2.26 1.57 1.16–2.13
Source: reference 167 (Table 5).BMD, bone mineral density; RR, risk ratio; CI, confidence interval.
Bone mineral density and body mass indexThe present analysis also quantified the independent contributions of lowBMD or BMI to the risks associated with smoking. Risk ratios were adjusteddownwards somewhat when account was taken of BMD (see Tables 5.16 and5.17). In women, the associations between smoking and osteoporotic fracturewere no longer significant. In men, the effect was less marked or notapparent. In men and women together, after adjustment for BMD, currentsmoking was a significant risk for fractures only from the age of 70 years. Forany osteoporotic fracture, 40% of the risk was explained by BMD. For hipfracture, the risk of smoking was adjusted downwards but the effect was lessmarked and remained significantly higher than unity at all ages. For hipfracture, only 23% was explained by BMD. Low BMD explained a minorityof the total risk, a result which is in contrast with the findings of Law andHackshaw (18) but in agreement with others (67).
The risk ratios for smokers were also adjusted downwards with adjustmentfor BMI, though all ratios remained significantly increased compared withnon-smokers (Table 5.18). The downward adjustment was less than with theadjustment for BMD. When smoking, BMI and BMD were entered into themodel, a further decrease in risk ratio was observed, although the risk ratiosremained above unity, and significantly so for the risk of any fracture and forhip fracture.
115

Table 5.18 Risk ratio for fracture and 95% confidence interval in current smokers (men and womencombined) adjusted for age, BMD, BMI, and both BMD and BMI
Outcome fracture
Any Osteoporotic Hip
Adjustment RR 95% CI RR 95% CI RR 95% CI
Age 1.25 1.15–1.36 1.29 1.17–1.43 1.84 1.52–2.22Age, BMD 1.13 1.01–1.25 1.13 1.00–1.28 1.60 1.27–2.02Age, BMI 1.19 1.09–1.30 1.21 1.08–1.34 1.65 1.34–2.03Age, BMI, BMD 1.12 1.01–1.25 1.11 0.98–1.26 1.55 1.23–1.96
Source: reference 167 (Table 4).BMD, bone mineral density; BMI, body mass index; RR, risk ratio; CI, confidence interval.
With regard to BMD, there are several mechanisms whereby smoking mightadversely affect fracture risk. Female smokers may have increased rates ofbone loss after the menopause (168), but this is not consistently found(120,169). Women smokers also have a younger age at menopause(169–171). It has been suggested that smoking may enhance estrogencatabolism (172), and the effects of hormone replacement therapy have insome, but not all, studies been attenuated among smokers (173–175).Smokers are also thinner and hence have lower body mass index (1,170), sothat the protective effects of adipose tissue and peripheral estrogenmetabolism are impaired. Bone loss is reported to be higher in men thanwomen who smoke (170), perhaps because of the higher exposure tocigarette smoking of men than women. In the present analysis, higher riskratios were found for men than for women for any fracture and forosteoporotic fracture. Such effects may explain the component of fracturerisk attributable to low BMD or BMI, but as shown in the present analysis,this represents a minority of the risk.
The mechanism for the BMD-independent increase in risk could not bedetermined from this analysis, but might be attributable in part to lower levelsof physical activity or to co-existing morbidity that might in turn increase therisk of falls or impair the protective responses to injury (99,121,124). It isalso possible that changes in the micro-architecture of cancellous bone, ifinduced by smoking, would weaken the resistance to mechanical force out ofproportion to any effect on BMD. Finally, accuracy errors inherent in themeasurement of BMD (176) will result in the underestimation of thecontribution of bone to fracture risk.
A limitation of this study was that we were unable to examine the dosedependency of the association because of the differences in the manner thata smoking history was ascertained. In this regard, men tend to smoke moreheavily than women and this may account for the slightly higher risk ratiosobserved in men. Indirect evidence for exposure dependency is that the riskratios for ever smoking were lower than for current smoking (data notshown), consistent with the view that the effect of smoking appears to wane
116

slowly after stopping smoking (177). As in the case for current smoking, riskratios were highest for hip fracture. There was no significant difference in riskratio between men and women, no difference when adjusted for BMD, andno significant effect of age on the risk ratio.
These findings indicate that a history of smoking confers a substantial riskfor future fractures and that this risk is largely independent of BMD.
5.2.8 Alcohol intakeExcessive alcohol intake is a well-recognized cause of secondaryosteoporosis, particularly in men (178–180). The effects of more moderateintakes are not thought to be deleterious to skeletal health. Indeed, intakes of210 g (26 units) per week may be associated with a higher BMD than inindividuals who abstain from alcohol (179,181–183) and a lower risk of hipfracture (174) and other atraumatic fractures (64).
By contrast, higher intakes appear to be associated with an increased fracturerisk (110) and hip fracture risk (38,175,181). The threshold intake for highrisk appears to be approximately 100g per week in women (110) but is higherin men (174,181). In one study, hip fracture risk was not increased in womenwho had less than 14 units per week or in men who took less than 28 unitsper week (174).
The standard alcoholic measure (= 1 unit) used in the present analysiscontains 10 g ethanol. This is equivalent to a standard glass of beer (285 ml),a single measure of spirits (30 ml), a medium-sized glass of wine (120 ml) orone measure of aperitif (60 ml). There are, however, some differences in thedefinition of a unit in different countries (e.g. 8 g ethanol in the UnitedKingdom).
Current assessment guidelines for osteoporosis do not include a high intakeof alcohol as a risk factor for use in case-finding strategies. The questionarises whether a high alcohol intake might be used as a risk factor in thestratification of fracture risk. The aim of the present analysis was to quantifythe fracture risk associated with alcohol consumption and to identify thethreshold risk.
Intake of alcohol was higher in men than in women: 77% of womenabstained from alcohol, whereas 49% of men took no alcohol. At the otherextreme, 8% of men took 5 or more units per day compared with 1% ofwomen. Overall, 19% of men and 4% of women drank more than 2 unitsdaily.
Age, sex and dose–responseThe present analysis confirms that a high intake of alcohol confers asignificant risk of future fracture. When alcohol intake was assessed as acontinuous variable, high intakes of alcohol were associated with an
117

increased risk of osteoporotic fracture or of hip fracture (184).As found in previously published studies, there was a threshold effect, and noincreased risk of osteoporotic or hip fracture was found in individuals whotook 2 units or less per day of alcohol. When the risk ratio was assessedaccording to units of alcohol consumed (using 1 unit as the reference) riskratio increased with more than 2 units per day in both men and women in adose-dependent manner (Table 5.19), but was not increased below this level.When the data for alcohol intake were dichotomized by intake of more than2, more than 3 or more than 4 units daily (versus those who took less), therisk of any osteoporotic fracture or of hip fracture was somewhat, but notsignificantly, higher in men than in women (Fig. 5.8 and Table 5.20).
Table 5.19 Risk ratio for fracture of the type indicated and 95% confidence interval, according to intakeof alcohol, in men and women
Men Women
Osteoporotic Osteoporoticfracture Hip fracture fracture Hip fracture
Alcohol intake(units/day) RR 95% CI RR 95% CI RR 95% CI RR 95% CI
0 1.06 0.83–1.34 0.94 0.58–1.54 0.96 0.85–1.08 0.98 0.75–1.271 1.00 NA 1.00 NA 1.00 NA 1.00 NA2 1.05 0.92–1.20 1.21 0.92–1.59 1.07 0.99–1.16 1.09 0.91–1.293 1.38 0.87–2.18 1.91 1.21–3.03 1.20 0.91–1.58 1.33 1.01–1.754 1.81 1.24–2.64 2.84 1.21–6.64 1.38 1.12–1.69 1.72 1.08–2.73
Source: reference 184 (Table 4).RR, risk ratio; CI, confidence interval; NA, not applicable.
Table 5.20 Risk ratio for fracture and 95% confidence interval according to intake of alcohol in men andwomen combined, with and without bone mineral density
Without BMD Adjusted for BMDCategorization(units/day) RR 95% CI RR 95% CI
Any fracture>2 1.23 1.06–1.43 1.24 1.06–1.45>3 1.33 1.10–1.60 1.34 1.11–1.62>4 1.51 1.20–1.91 1.51 1.19–1.93
Any osteoporotic fracture>2 1.38 1.16–1.65 1.36 1.13–1.63>3 1.55 1.26–-1.92 1.53 1.23–1.91>4 1.70 1.30–2.22 1.64 1.24–2.17
Hip fracture>2 1.68 1.19–2.36 1.70 1.20–2.42>3 1.92 1.28–2.88 2.05 1.35–3.11>4 2.26 1.35–3.79 2.39 1.39–4.09
Source: reference 184 (Table 5).BMD, bone mineral density; RR, risk ratio; CI, confidence interval.
118

Fig. 5.8Relative risk of an osteoporotic fracture or hip fracture in men and women according to theintake of alcohol without adjustment for bone mineral density
Source: reference 184 (Fig. 1). RR, risk ratio
This threshold is comparable to that advocated for cardiovascular health andis similar to that noted in other studies (110,174). Using the level of >2 unitsdaily as an indication of high intake of alcohol, the data showed that 19% ofmen and 4% of women exceeded this intake. Assuming a causal relationship,the data suggest that 7% and 2% of hip fractures in men and women,respectively, might be attributable to a high intake of alcohol. Causality,however, is conjectural and these results should not form the basis for anyrecommendations on the intake of alcohol.
In contrast with some studies, there was no evidence for a different thresholdin men compared with women in the present analysis (174,181). Somestudies have shown that the relationship between alcohol intake and hipfracture risk or BMD is J-shaped (1,64,174,176,182,183) in that abstainersfrom alcohol have a higher risk than that of individuals consuming 1 or 2units daily. In the present analysis, no difference in the risk between thesecategories or any systematic difference in femoral neck BMD was found.There were no differences in femoral neck BMD between individuals whoabstained from alcohol (Z-score = -0.03 ± SD 1.02), those taking 1–2 unitsdaily (Z-score = 0.02 ± 0.99) and those taking >2 units daily (Z-score = 0.01± 1.00).
Not all studies show an association between alcohol and fracture risk(1,2,185–188). A weakness of cross-sectional studies may be that individualswho have suffered fracture have higher co-morbidity and their intake ofalcohol may be less. However, not all prospective studies show an increasedfracture risk with intake of alcohol either (67,75,162,189–192). The
119

discrepancy in results may be related to the low proportion of heavy drinkers,and the lack of power to examine threshold effects.
Bone mineral densityThe effect of high alcohol consumption is over and above that which can beexplained by variations in BMD. Indeed, low BMD explained a minority ofthe total risk attributable to alcohol (see Table 5.20). With regard to BMD,there are several mechanisms whereby alcohol might adversely affect fracturerisk. Alcohol is shown to have direct adverse effects on osteoblasts (193), andalso increases the endogenous secretion of calcitonin (194). In addition,heavy drinkers may have poor nutrition with respect to calcium, vitamin D orprotein (195). The mechanism for the BMD-independent increase in riskcould not be determined from this analysis, but it was not accounted for bycurrent smoking or low BMI (Table 5.21). It might be attributable in part tocoexisting morbidity that in turn increases the risk of falls (89) or interfereswith the protective response to injury (99,121,124).
Table 5.21 Risk ratio for fracture and 95% confidence interval associated with a consumption of >2units daily of alcohol, with and without adjustment for smoking, body mass index and bonemineral density
Any fracture Any osteoporotic fracture Hip fracture
Model RR 95% CI RR 95% CI RR 95% CI
Base case 1.23 1.06–1.43 1.38 1.16–1.65 1.68 1.19–2.36+ smoking 1.22 1.03–1.43 1.36 1.13–1.63 1.50 1.05–2.15+ smoking + BMD 1.24 1.05–1.46 1.38 1.14–1.66 1.54 1.07–2.22+ BMI 1.21 1.04–1.41 1.35 1.13–1.61 1.64 1.16–2.32+ BMI + BMD 1.22 1.04–1.43 1.34 1.11–1.61 1.67 1.16–2.38
Source: reference 184 (Table 6).RR, risk ratio; CI, confidence interval; BMD, bone mineral density; BMI, body mass index.
5.2.9 Secondary osteoporosisThere is some evidence that several secondary causes of osteoporosis mayprovide a risk of fracture over and above that provided by BMD. Thesedisorders include rheumatoid arthritis, hyperthyroidism, type I diabetes andankylosing spondylitis (see section 4). However, there were insufficient casesof classic causes of secondary osteoporosis such as hyperparathyroidism anduntreated thyroid disease to provide a general category of secondaryosteoporosis for use in this analysis. Instead, a surrogate for secondaryosteoporosis was provided by rheumatoid arthritis.
Previous studies have documented an association between rheumatoidarthritis and fractures of the hip (128,129,196), spine (197–199) and pelvis(128). The excess risk has usually been attributed to glucocorticoid-inducedbone loss in these patients (200), although functional limitations related torheumatoid arthritis could be as important (129). Some inconsistency inresults stems from the limited sample size in many studies.
120

With the additional data available, it was possible to show that rheumatoidarthritis is a significant risk factor for any fracture (RR = 1.45; 95% CI =1.16–1.80), osteoporotic fracture (RR = 1.56) and hip fracture (RR = 1.95).The risk persisted after adjustment for glucocorticoid use, BMD and priorfracture (Table 5.22). The results are consistent with the finding that vertebralfracture risk is approximately 2-fold higher in patients with rheumatoidarthritis than in population-based controls, independently of BMD and prioruse of glucocorticoids (199).
Table 5.22 Risk ratio for fracture and 95% confidence interval associated with rheumatoid arthritis, withand without adjustment for glucocorticoids, prior fracture and bone mineral density
Any fracture Any osteoporotic fracture Hip fracture
Model RR 95% CI RR 95% CI RR 95% CI
Base case 1.45 1.16–1.80 1.56 1.20–2.02 1.95 1.11–3.42+ BMD 1.38 1.10–1.73 1.47 1.12–1.92 1.73 0.94–3.20Glucocorticoids 1.38 1.11–1.72 1.46 1.12–1.90 1.76 0.97–3.19+ BMD 1.30 1.03–1.64 1.35 1.02–1.77 1.46 0.75–2.83Prior fracture 1.40 1.12–1.73 1.49 1.15–1.94 1.85 1.05–3.26+ BMD 1.36 1.08–1.71 1.45 1.11–1.91 1.71 0.93–3.17
Source: reference 135 (table constructed from results in text).RR, risk ratio; CI, confidence interval; BMD, bone mineral density.
5.3 Summary of effectsThis series of meta-analyses has characterized several important aspects ofthe assessment of risk for fracture that need to be taken into account. In thecase of BMD, account needs to be taken of age and the prevailing BMDvalue, since the risk of osteoporotic fracture is dependent on both variables.Several other risk factors have been identified which add to riskindependently of BMD (Tables 5.23 and 5.24) and represent the variables tobe used in the synthesis of assessment algorithms (see section 7).
Table 5.23 Risk ratio for osteoporotic fracture and 95% confidence interval associated with risk factorsadjusted for age, with and without adjustment for bone mineral density
Without BMD With BMD
Risk indicator RR 95% CI RR 95% CI
Body mass index (20 versus 25 kg/m2) 1.27 1.16–1.38 1.02 0.92–1.13(30 versus 25 kg/m2) 0.89 0.81–0.98 0.96 0.86–1.08
Prior fracture after 50 years 1.86 1.72–2.01 1.76 1.60–1.93
Parental history of hip fracture 1.54 1.25–1.88 1.54 1.25–1.88
Current smoking 1.29 1.17–1.43 1.13 1.00–1.28
Ever use of systemic corticosteroids 1.65 1.42–1.90 1.66 1.42–1.92
Alcohol intake 3+ units daily 1.38 1.16–1.65 1.36 1.13–1.63
Rheumatoid arthritis 1.56 1.20–2.02 1.47 1.12–1.92
BMD, bone mineral density; RR risk ratio; CI, confidence interval.
121

Table 5.24 Risk ratio for hip fracture and 95% confidence interval associated with risk factors adjustedfor age, with and without adjustment for bone mineral density
Without BMD With BMD
Risk indicator RR 95% CI RR 95% CI
Body mass index (20 versus 25 kg/m2) 1.95 1.71–2.22 1.42 1.23–1.65(30 versus 25 kg/m2) 0.83 0.69–0.99 1.00 0.82–1.21
Prior fracture after 50 years 1.85 1.58–2.17 1.62 1.30–2.01
Parental history of hip fracture 2.27 1.47–3.49 2.28 1.48–3.51
Current smoking 1.84 1.52–2.22 1.60 1.27–2.02
Ever use of systemic corticosteroids 2.31 1.67–3.20 2.25 1.60–3.15
Alcohol intake 3+ units daily 1.68 1.19–2.36 1.70 1.20–2.42
Rheumatoid arthritis 1.95 1.11–3.42 1.73 0.94–3.20
BMD, bone mineral density; RR, risk ratio; CI, confidence interval.
Several important interactions were noted. The interactions tested for eachrisk factor were: the attenuation of the risk with time; the dependency on age,sex and BMD; and, for continuous variables, the interaction with the riskfactor itself. An example of the latter is for BMI where an increase of 1 unitfrom a low value (e.g. from 20 kg/m2 to 21 kg/m2) is more protective than froma high value (e.g. 30 kg/m2 to 31 kg/m2). The interactions found aresummarized in Table 5.25.
Table 5.25 Significant interactions determined from meta-analyses of risk factors for hip fracture or anyosteoporotic fracture
BMD Age Variablea Sex Time
Risk factor HF OPF HF OPF HF OPF HF OPF HF OPF
BMI – – – ++ ++ – – – ++ +Prior fracture – – ++ + – – – +Corticosteroids – + – + – – – –Family history _ _ – + – – – +Smoking – – – – – – – –Rheumatoid arthritis – – – – – – – –BMD ++ ++ – ++ – – – –Alcohol – – – – – – – +
BMD, bone mineral density; HF, hip fracture; OPF, any osteoporotic fracture; BMI, body massindex; –, no effect (p>0.1); +, a trend (0.05 <p<0.10); ++, a significant interaction.a Denotes an interaction of the variable with the variable, e.g. BMI⋅BMI.
Although many interactions were found for each risk factor, it is necessary todetermine the interactions between each of the risk factors, e.g. to whatextent does the risk of glucocorticoid treatment depend upon smoking andhow does this affect the interaction of smoking with age. This requires ameta-analysis of the meta-analyses (referred to as a mega-analysis), which isconsidered further in section 7.
122

It is important to recognize that the strength of the risk factors variesaccording to fracture outcome. In general, risk factors were more stronglyassociated with hip fracture risk than with the risk of any osteoporoticfracture. This consideration indicates that integrated models to assess overallfracture risk should use risk ratios separately determined for hip fracture andfor other osteoporotic fracture (without hip fracture). These risk ratios aresummarized in Table 5.26.
Table 5.26 Risk ratio for osteoporotic fracture other than hip fracture and 95% confidence intervalassociated with risk factors adjusted for age, with and without adjustment for bone mineraldensity
Without BMD With BMD
Risk indicator RR 95% CI RR 95% CI
Body mass index (20 versus 25 kg/m2) 1.07 0.96–1.20 1.07 0.95–1.22(30 versus 25 kg/m2) 0.98 0.89–1.09 0.90 0.80–1.02
Prior fracture after 50 years 1.92 1.75–2.10 1.78 1.59–1.99
Parental history of hip fracture 1.52 1.21–1.91 1.51 1.20–1.91
Current smoking 1.16 1.03–1.31 1.03 0.89–1.20
Ever use of systemic corticosteroids 1.55 1.30–1.84 1.56 1.27–1.90
Alcohol intake 3+ units daily 1.24 1.01–1.53 1.19 0.96–1.49
Rheumatoid arthritis 1.48 1.09–2.02 1.42 1.03–1.95
BMD, bone mineral density; RR, risk ratio; CI, confidence interval.
5.3.1 HeterogeneityThe generalizability of these data to all countries is uncertain, though thestudies reported included many European countries, and cohorts from NorthAmerica, Japan and Australia. Within the cohorts examined, an index ofapplicability is provided by tests for heterogeneity. Where there is no evidencefor heterogeneity, the case is stronger for the generalizability of combineddata. For each of the risk factors examined, heterogeneity was tested for bymeans of the I2 statistic (42). No or little heterogeneity is denoted by a valueof <25%, and moderate heterogeneity by a value of <50%. For the riskfactors examined, most showed little or moderate heterogeneity (Table 5.27).For several risk factors there was evidence for heterogeneity (attributable tothe difference in age between cohorts), but when age was used as aninteraction term there was very low heterogeneity between cohorts,suggesting the general applicability of the use of these factors for fractureprediction, at least in high-income countries. For a prior fracture, there wassome evidence for greater heterogeneity between cohorts for osteoporotic andhip fracture outcome.
123

Table 5.27 Tests for heterogeneity (I2) between cohorts according to risk factors for hip fracture and allosteoporotic fractures
Hip fracture Osteoporotic fracture
Risk factor I2 95% CI p I2 95% CI p
BMI 8 0–44 NS 0a 0–51 NSFamily history 43 0–79 NS 0 0–69 NSBMD 27b 0–62 NS 0b 0–49 NSSmoking 0c 0–99 NS 0c 0–26 NSAlcohol 0 0–92 NS 0 0–72 NSPrior fracture 44 0–69 0.04 64d 38–79 <0.001Rheumatoid arthritis 0 0–97 NS 0 0–53 NSGlucocorticoids 0e 0–95 NS 14e 0–54 NS
CI, confidence interval; p, probability; BMI, body mass index; BMD, bone mineral density; NS, notsignificant.aWhen used with the interaction with age (age⋅BMI). bWhen used with the interaction with age (age⋅BMD). cWhen used with the interaction with age (age⋅smoking).dWhen used with the interaction with age (age⋅prior fractures).eWhen used with the interaction with age (age⋅glucocorticoids).
5.3.2 Strengths and weaknessesThe strength of this analysis is that estimates of risk are derived from severalstudies from a wide international setting using population-based cohorts andthe individual participant data. The large sample permitted the examinationof the general relationship of each risk factor by age, sex, duration of follow-up and, for continuous variables (BMD, BMI, alcohol), the relationship ofrisk with the variable itself in a manner hitherto not possible. The use ofprimary data also eliminates the risk of publication biases. The validity of theclinical risk factors identified is supported by the expected relationshipsbetween BMD and fracture risk. Thus, these analyses fulfil the criteria for thehighest level of evidence outlined in section 5.1.
There are several limitations that should be mentioned. As with nearly allrandomly drawn populations, non-response biases may have occurred whichwere not completely documented in all cohorts. The effect is likely to excludesicker members of society, and may underestimate the absolute risk offracture. Thus, the probability of fracture associated with a given risk factormay be underestimated from a societal perspective, but this is unlikely toaffect risk ratios.
The analyses also have significant limitations that relate to the outcomevariables and the characterization of risk factors. The definition of what wasconsidered to be an osteoporotic fracture was not the same in all cohorts, butthe effect of this inconsistency is likely to underestimate rather thanoverestimate the associations that were found. For the hip fracture outcome,the definition was similar in all cohorts, and may explain in part the higher
124

risk ratios associated for this fracture rather than for osteoporotic fracture.Also, the analyses were confined to clinical fractures, and the results mightdiffer from those for vertebral fractures diagnosed by morphometry or as anincidental radiographic finding. This possibility is addressed further insection 5.4.
There are also limitations with regard to the risk factors themselves. We choseBMI, rather than weight, as the measure for body composition. This has theadvantage that there is less variability across countries and between sexes. Apotential drawback, however, is that BMI can be influenced by height lossassociated with vertebral deformities. Therefore, in individuals withimportant loss of height, the risk conferred through BMI could beunderestimated (201). The use of maximal attained height, rather thancurrent height, might be a solution in the future, if it were shown that riskprediction could be improved.
Further problems relate to the construct of the questions, which variedbetween cohorts. These included questions on family history, prior fracture,smoking and glucocorticoid use. The effect of this heterogeneity is likely toweaken rather than strengthen the associations found. Recall is also subjectto errors and was not validated in any of these cohorts. This is particularlyproblematic in elderly people. In addition, the validity of self-reportedalcohol intake is notoriously unreliable (202). Indeed, alcohol consumptionwas significantly less in both men and women than that assessed in theUnited Kingdom (203). Given that these studies were prospective, however,much of this error should be random, giving rise to non-directionalmisclassification. Thus, the associations may actually be stronger thanreported here. It is, however, possible that recall is more accurate inindividuals with other risk factors for fracture. If true, this wouldoverestimate a true effect. Any overestimate would have limited consequencesfor case-finding since the populations to be tested are similar to thepopulations interrogated. Biases that arise have more significance wherecausality is inferred.
A further limitation is that several of the clinical risk factors identified takeno account of dose-response, but give risk ratios for an average dose orexposure. By contrast, there is good evidence that the risk associated withexcess alcohol consumption and the use of glucocorticoids is dose-responsive(204). In addition, the risk of fracture increases progressively with thenumber of prior fractures (205).
These limitations are nearly all conservative. In addition, a fixed effectsmodel was used, justified by the low heterogeneity between cohorts. The useof a fixed effects rather than random effects model is also conservative wherepoint estimates are used for model building.
125

5.4 Other risk factorsThe updated diagnostic criteria for osteoporosis, outlined in section 3, useBMD measurements at the femoral neck as the reference standard, and thequestion arises whether the total hip measurement is to be preferred becauseof the lower errors of precision. In addition, there are several other riskfactors (Grade B in Table 5.2) that are of potential interest in risk assessmentbut which are not covered by this series of meta-analyses. These includeperipheral bone mineral measurements including quantitative ultrasoundand biochemical indices of bone turnover. The available cohorts thatincorporated these variables were too few to provide a meta-analyticframework of high international validity. Moreover, for ultrasonography andindices of bone turnover, there are a large number of techniques available, allof which have variable degrees of biological validity and may also differ inthe gradients of risk. The following analyses of limited material and a reviewof the evidence suggest, however, that these indices of risk should beincorporated into risk assessment algorithms when they are more adequatelycharacterized on an international basis.
5.4.1 Total hip bone mineral densityFew cohorts examined BMD at both the femoral neck and total hip in menand women. Data for men were confined to the cohorts from Rochester andHiroshima. For women, additional information was available from thecohorts at Sheffield. Because of the limited material, the data were enrichedby adding data from the Osteoporosis Ultrasound Study (OPUS), avalidation cohort – discussed further in section 7. When the data werecombined, there was no difference between men and women and nosignificant differences between femoral neck and total hip BMD in thegradients of fracture risk (206) (Fig. 5.9). For osteoporotic fractures, thefemoral neck gave slightly lower gradients of risk compared with the total hip(RR = 1.44/SD and 1.48/SD, respectively). The gradients of risk for hipfracture outcome were marginally better with the femoral neck site (RR =2.33/SD and 2.17/SD, respectively). These data suggest that the two regionscan be used interchangeably, consistent with previous reports (207), but donot indicate a clear superiority of one measurement site over the other.
126

Fig. 5.9 Prediction of any fracture, any osteoporotic fracture and hip fracture (risk ratio/SD) in menand women combined, with bone mineral density measurements at the femoral neck andtotal hip
Source: O. Johnell and J.A. Kanis (unpublished data). RR, risk ratio; SD, standard deviation; OP, osteoporotic fracture.
5.4.2 Quantitative ultrasoundFrom the cohorts used for the meta-analysis, ultrasound measurements(broadband ultrasound attenuation and speed of sound) were made at theheel in women only from the EPIDOS and the Sheffield cohorts. Because ofthe limited material, the data were enriched by adding data from the OPUScohort. The OPUS cohort was used to validate the assessment tool and isdescribed in section 7. The cohort comprised random population-basedsamples of 2374 women aged 55–80 years from five European towns (Paris,France; Berlin and Kiel, Germany; Aberdeen, Scotland, and Sheffield,England ). Ultrasound measurements were taken at the heel using theAchilles and at baseline, and fracture outcomes recorded prospectively.
Broadband ultrasound attenuation significantly predicted any fracture andany osteoporotic fracture (Table 5.28). For speed of sound, the gradient ofrisk was not significantly greater than unity for these fracture outcomes(RR/SD = 0.91 and 1.05, respectively). Gradients of risk for hip fractureoutcomes were higher, significantly so as measured with both broadbandultrasound attenuation and speed of sound.
With adjustment for BMD, gradients of risk decreased but remainedsignificantly increased in the case of broadband ultrasound attenuation andspeed of sound measurements for hip fracture risk. The gradient of risk forhip fracture decreased significantly with age in much the same way as thatseen for hip fracture risk prediction with BMD using DXA. For broadbandultrasound attenuation, the gradient of risk was 3.79 at the age of 50 years
127

and fell to 2.00 at the age of 80 years (Fig. 5.10). For speed of sound, thegradient of risk fell from 3.14 at the age of 50 years to 1.77 at the age of 80years.
Table 5.28 Gradients of risk (RR/SD) for broadband ultrasound attenuation and speed of sound usingquantitative ultrasound in women, with and without adjustment for bone mineral density atthe hip
Without BMD With BMD
Variable Outcome fracture RR/SD 95% CI RR/SD 95% CI
BUAa Any 1.40 1.25–1.58 1.22 1.06–1.41
BUAa Osteoporotic 1.40 1.26–1.56 1.20 1.06–1.36
BUAa Hip 1.72 1.52–1.95 1.40 1.22–1.61
SoSa Hip 1.51 1.33–1.71 1.24 1.09–1.40
Peripheral BMD Any 1.30 1.22–1.39Osteoporotic 1.35 1.25–1.45
Hip 1.30 1.15–1.48
Source: O. Johnell and J.A. Kanis, unpublished data, 2005.BMD, bone mineral density; RR, risk ratio; SD, standard deviation; CI, confidence interval; BUA,broadband ultrasound attenuation; SoS, speed of sound.aWomen only.
Fig. 5.10 Hip fracture prediction (risk ratio/SD) with broadband ultrasound attenuation in menand women, by age, with and without adjustment for bone mineral density
Source: J.A. Kanis and O. Johnell (unpublished data). RR, risk ratio; SD, standard deviation; BMD, bone mineral density.
These data, though limited, confirm the potential utility of quantitativeultrasound in the evaluation of fracture risk. It should be noted that greatestexperience of the technique is available for women (19,208), though it hasbeen shown recently that quantitative ultrasound predicts hip and all non-spine fractures in men (209).
128

5.4.3 Peripheral bone mineral densityPeripheral BMD measurements were obtained in three cohorts: Rochester(1/3 radius); Gothenburg I (dual photon absorptiometry at the heel); andGothenburg II (DXA at the forearm). Gradients of fracture risk weresignificant for all fracture outcomes but, as expected, were lower than thoseobserved for BMD at the femoral neck by DXA (see Table 5.28).
5.4.4 Biochemical indices of bone turnoverA second risk factor of high potential importance is high bone turnover.Recent reviews (210,211) have considered the use of biochemical indices ofbone turnover as a predictor of fracture risk in postmenopausal osteoporosis.A review of prospective and cross-sectional studies concluded that increasedresorption markers were associated with an increase in fracture risk in women(212). For example, in the EPIDOS study in elderly women, the risk of hipfracture increased by 1.4 for each SD increase in urinary freedeoxypyridinoline (D-Pyr) and by 1.3 for urinary type I C-telopeptide ofcollagen (CTX) (213). If instead the highest quartile was examined, the oddsratio for hip fracture was 2.1 with CTX and 1.5 with free D- Pyr. Thepredictive value of indices of skeletal turnover appears to be independent ofbone mass in that the risk persists even after adjustment for BMD. Thus, thecombination of high CTX and low BMD had an odds ratio of 4.8 for hipfracture in elderly women. In the OFELY study, the same combination inwomen aged 65 years gave a relative risk of 4.2 for all fractures (34). Similarfindings were reported for undercarboxylated osteocalcin, an index ofimpaired bone formation (214). The analyte predicted hip fracture risk in thehighest quartile with an odds ratio of 1.9, a risk that persisted (with an oddsratio of 1.8) after adjustment for BMD. A combination of the lowest quartileof BMD and the highest quartile of undercarboxylated osteocalcin wasassociated with an odds ratio of 5.5 (214). Associations have also been foundbetween later spine and non-spine fracture and high serum bone alkalinephosphatase, with an odds ratio of 1.5–1.88 per SD increase, which persistedafter adjustment for BMD (49). In the same study, urinary CTX predictedfracture with an odds ratio of 1.43–1.84 per SD change, which also remainedafter adjustment for BMD (1.33/SD–1.70/SD). These various studies indicatethat indices of skeletal turnover give information on fracture riskindependently of BMD and might therefore complement and augmentfracture risk assessment by BMD.
The biochemical markers have not been evaluated in this series of meta-analyses because of the lack of availability of internationally representativematerial. Moreover, many potential analytes have been examined and there isinsufficient information available to select a reference standard, both in termsof the analyte and the technique for measurement. Notwithstanding, themarkers clearly hold promise as risk prediction tools and should beconsidered for inclusion in assessment algorithms as the body of informationincreases. Although no intervention trials have selected patients for treatment
129

on the basis of bone resorption measurements, the responses to treatmentappear to be greater in patients with increased resorption rates (215).
5.4.5 Morphometric vertebral fractureOne of the limitations of the meta-analyses is that vertebral fractures are notincluded as an outcome variable nor have they been assessed as a specific riskfactor. The reason is that fewer cohorts were available that documentedprevalent and incident fractures assessed clinically (480 fractures in 7cohorts) or by morphometry (819 fractures in 3 cohorts). The available dataare summarized briefly below.
Risk factors for clinical vertebral fractures (Table 5.29) were similar to thosereported for any osteoporotic fracture (see Table 5.23). The risk associatedwith a parental history was somewhat lower than for osteoporotic fracture(RR = 1.29 versus 1.54) and was not significant. For alcohol intake, the riskratio was comparable (RR = 1.49 versus 1.38) but was also not significant.Femoral neck BMD predicted clinical fractures as strongly as BMD at thelumbar spine. The risk ratios for morphometric fractures were qualitativelysimilar, though the mid-point estimates were generally lower than for clinicalfractures. Note that some caution is required in the comparison since, formorphometric fractures, only three cohorts could be examined (Hiroshima,EVOS and Rotterdam; 819 fractures in 13 344 individuals).
Table 5.29 Risk factors, risk ratio and 95% confidence interval for clinical vertebral fracture andmorphometric vertebral fractures
Clinical fracturea Morphometric fractureb
Risk factor RR 95% CI RR 95% CI
BMI (per unit) 0.96 0.93–0.98 0.96 0.94–0.98Prior fracture 1.80 1.45–2.23 1.36 1.16–1.59Parental history of hip fracture 1.29 0.63–2.64 1.05 0.68–1.62Current smoking 1.67 1.19–2.35 1.47 1.21–1.79Systemic corticosteroids 2.17 1.55–3.04 1.20 0.82–1.76Rheumatoid arthritis 2.24 1.34–3.77 NA NAAlcohol (> 2 units daily) 1.49 0.96–2.31 1.04 0.69–1.56BMD femoral neck (per SD) 1.58 1.43–1.76 1.66 1.50–1.84BMD lumbar spine (per SD) 1.63 1.44–1.85
RR, risk ratio; CI, confidence interval; NA, not available; BMI, body mass index; BMD, bone mineraldensity.aData from Australia (the Dubbo Osteoporosis Epidemiology Study), Canada (the CanadianMulticentre Osteoporosis Study), Japan (Hiroshima), the Netherlands (Rotterdam), Sweden(Gothenburg), the United Kingdom (Sheffield), and the United States (Rochester). bData from Japan (Hiroshima), the Netherlands (Rotterdam), and the European VertebralOsteoporosis Study.
The available data suggest that the risk factors for morphometric fracturesare, if anything, weaker than for other fractures. These data accord withpreviously published results that have examined risk factors formorphometric fractures (216 –219), and suggest that the meta-analyses donot suffer from their omission.
130

With respect to vertebral fracture as a risk factor, a prior morphometricfracture was documented in three cohorts (EVOS, Japan and Rotterdam).The risk of a subsequent osteoporotic fracture (RR = 2.27), hip fracture (RR= 2.68) or clinical vertebral fracture (RR = 3.66) was somewhat greater thanthe risk associated with a prior fracture of any type to predict osteoporoticfracture (RR = 1.86) or hip fracture (RR = 1.86). The DOES also reportedthat a prevalent vertebral deformity was a very strong risk factor for a clinicalvertebral fracture (RR = 7.4) (64), a much higher risk than the findingsabove and elsewhere (220).
These variable risk ratios may arise because of a dependence on age. Forexample, in the cohorts examined in this report, the risk of hip fracture wasmarkedly increased in individuals with a morphometric fracture at the age of60 years (RR = 9.6; 95% CI = 3.1–3.0) and fell progressively with age so thatat the age of 80 years the hip fracture RR was 3.3 (95% CI = 2.3–4.8).
In the present analysis, a prior clinical spine fracture (data available only forwomen from CaMoS, DOES, Rochester, Gothenburg and Sheffield) wasassociated with a very high risk of hip fracture (RR = 3.06; 95% CI =2.11–4.42) and vertebral fracture (RR = 5.40; 95% CI = 3.18–9.18),suggesting that a previous clinical spine fracture provided a stronger riskindicator than a prior morphometric vertebral fracture and a prior fractureof any other type. A similarly high risk has been shown in the EPOS cohort(221), where a self-reported spine fracture was associated with a RR = 7.52for a subsequent morphometric vertebral fracture. These findings need to beexamined in men and, if confirmed, incorporated into tools to assess fracturerisk.
All these findings indicate that a prior morphometric fracture is a strong riskfactor. For this reason, the term prior fragility fracture in assessmentalgorithms should take account not only of clinical vertebral fractures butalso of morphometric vertebral fractures. Indeed, clinicians should be awarethat fracture risk is likely to be underestimated by the algorithms in the caseof a prior vertebral fracture, irrespective of its clinical expression.
References1. Johnell O et al. Risk factors for hip fracture in European women: the MEDOS
study. Journal of Bone and Mineral Research, 1995, 10:1802–1815.
2. Kanis JA et al. Risk factors for hip fracture in men from Southern Europe: theMEDOS study. Osteoporosis International, 1999, 9:45–54.
3. Kanis JA et al. A meta-analysis of milk intake and fracture risk: low utility for casefinding. Osteoporosis International, 2005, 16:799–804.
4. Melton LJ et al. Fracture risk in patients with Alzheimer’s disease. Journal of theAmerican Geriatric Society, 1994, 42:614–619.
5. McClung MR et al. Hip intervention program study group. Effect of risedronate onthe risk of hip fracture in elderly women. New England Journal of Medicine, 2001,344:333–340.
131

6. Khan KS et al. Systematic reviews to support evidence-based medicine. How toreview and apply findings of healthcare research. London, Royal Society ofMedicine Press, 2003.
7. Guideline development methods. Information for national collaboratingcCentreand guideline development. London, National Institute for Clinical Excellence, 2004(available from: www.nice.org).
8. Guidelines for preclinical and clinical evaluation of agents used in the prevention ortreatment of postmenopausal osteoporosis. Rockville, MD, Division of Metabolismand Endocrine Drug Products, Food and Drug Administration, 1994.
9. Note for guidance on postmenopausal osteoporosis in women. London, Committee forProprietary Medicinal Products (CPMP), European Agency for the Evaluation ofMedicinal Products, 2001 (CPMP/EWP/552/95 rev 1).
10. Saag KG et al. Alendronate for the prevention and treatment of glucocorticoid-induced osteoporosis. Glucocorticoid-induced Osteoporosis Intervention StudyGroup. New England Journal of Medicine, 1998, 339:292–299.
11. Adachi JD et al. Two year effects of alendronate on bone mineral density andvertebral fracture in patients receiving glucocorticoids: a randomised, double-blind, placebo-controlled extension trial. Arthritis and Rheumatism, 2001,44:202–211.
12. Reginster JY et al. Randomized trial of the effects of risedronate on vertebralfractures in women with established postmenopausal osteoporosis. Vertebralefficacy with risedronate therapy (VERT) study group. Osteoporosis International,2000, 11:83–91.
13. Kanis JA, Barton I, Johnell O. Risedronate decreases fracture risk in patientsselected solely on the basis of prior vertebral fracture. Osteoporosis International,2005, 16:475–482.
14. McCloskey EV et al. Clodronate reduces vertebral fracture risk in women withpost-menopausal or secondary osteoporosis: results of a double blind placebo-controlled 3 year study. Journal of Bone and Mineral Research, 2004, 19:728–736.
15. Roux C et al. Vertebral fracture risk reduction with strontium ranelate in womenwith post-menopausal osteoporosis is independent of baseline risk factors.Journal of Bone and Mineral Research, 2006, 21:536–542.
16. Marcus R et al. The skeletal response to teriparatide is largely independent ofage, initial bone mineral density and prevalent vertebral fractures inpostmenopausal women with osteoporosis. Journal of Bone and Mineral Research,2003, 18:18–23.
17. Johnell O et al. Association between baseline risk factors and vertebral fracturerisk in the Multiple Outcomes of Raloxifene Evaluation (MORE) study. Journal ofBone and Mineral Research, 2004, 19:764–772.
18. Law MR, Hackshaw AK. A meta-analysis of cigarette smoking, bone mineraldensity and risk of hip fracture; recognition of a major effect. British MedicalJournal, 1997, 315:841–846.
19. Marshall D, Johnell O, Wedel H. Meta-analysis of how well measures of bonemineral density predict occurrence of osteoporotic fractures. British MedicalJournal, 1996, 312:1254–1259.
132

20. Van Staa TP, Leufkens HGM, Cooper C. The epidemiology of corticosteroid-induced osteoporosis: a meta-analysis. Osteoporosis International, 2002,13:777–787.
21. Klotzbuecher CM et al. Patients with prior fractures have an increased risk offuture fractures: a summary of the literature and statistical synthesis. Journal ofBone and Mineral Research, 2000, 15:721–739.
22. Hofman A et al. Determinants of disease and disability in the elderly: theRotterdam Elderly Study. European Journal of Epidemiology, 1991, 7:403–422.
23. De Laet CEDH et al. Hip fracture prediction in elderly men and women: validationof the Rotterdam study. Journal of Bone and Mineral Research, 1998,13:1587–1593.
24. O’Neill TW et al. The prevalence of vertebral deformity in European men andwomen: the European Vertebral Osteoporosis Study. Journal of Bone and MineralResearch, 1996, 11:1010 – 1017.
25. Felsenberg D et al. Incidence of vertebral fracture in Europe: results from theEuropean Prospective Osteoporosis Study EPOS. Journal of Bone and MineralResearch, 2002, 17:716–724.
26. Ismail AA et al. Incidence of limb fracture across Europe: results from theEuropean prospective osteoporosis study EPOS. Osteoporosis International, 2002,13:565–571.
27. Kreiger N et al. The Canadian Multicentre Osteoporosis Study CaMos:background, rationale, methods. Canadian Journal of Ageing, 1999, 18:376–387.
28. Melton LJ III et al. Bone density and fracture risk in men. Journal of Bone andMineral Research, 1998, 13:1915–1923.
29. Melton LJ III et al. Relative contributions of bone density, bone turnover andclinical risk factors to long-term fracture prediction. Journal of Bone and MineralResearch, 2003, 18:312–318.
30. Johansson H et al. Optimisation of BMD measurements to identify high riskgroups for treatment: a test analysis. Journal of Bone and Mineral Research, 2004,19:906–913.
31. Jones G et al. Symptomatic fracture incidence in elderly men and women: theDubbo Osteoporosis Epidemiology Study DOES. Osteoporosis International, 1994,4:277–282.
32. Dargent-Molina P et al. Fall-related factors and risk of hip fracture: the EPIDOSprospective study. Lancet, 1996, 348:145–149.
33. Chapurlat R et al. Serum estradiol and sex hormone-binding globulin and the riskof hip fracture in elderly women: the EPIDOS study. Journal of Bone and MineralResearch, 2000, 15:1835–1841.
34. Garnero P et al. Biochemical markers of bone turnover, endogenous hormonesand the risk of fractures in postmenopausal women: the OFELY study. Journal ofBone and Mineral Research, 2000,15:1526–1536.
35. Honkanen R et al. Relationships between risk factors and fractures differ by typeof fracture: a population-based study of 12,192 perimenopausal women.Osteoporosis International, 1998, 8:25–31.
133

36. Svanborg A. 70 year old people in Gothenburg: a population study in anindustrialised Swedish city ii. Journal presentation of social and medicalconditions. Acta Medica Scandinavica, 1977, 611(Suppl.):5.
37. Johansson C et al. Bone mineral density is a predictor of survival. Calcified TissueInternational, 1998, 63:190–196.
38. Fujiwara S et al. Risk factors for hip fracture in Japanese cohort. Journal of Boneand Mineral Research, 1997, 12:998–1004.
39. Kanis JA et al. A family history of fracture and fracture risk. Bone, 2004,35:1029–1037.
40. Kanis JA et al. A meta-analysis of previous fracture and subsequent fracture risk.Bone, 2004, 35:375–382.
41. Kanis JA et al. The burden of osteoporotic fractures: a method for settingintervention thresholds. Osteoporosis International, 2002, 12:417–424.
42. Higgins JPT et al. Measuring inconsistency in meta-analyses. British MedicalJournal, 2003, 327:557–560.
43. Kanis JA et al. Ten year probabilities of osteoporotic fractures according to BMDand diagnostic thresholds. Osteoporosis International, 2001, 12:989–995.
44. Hui SL, Slemenda CW, Johnston CC. Age and bone mass as predictors offracture in a prospective study. Journal of Clinical Investigation, 1998,81:1804–1809.
45. Cummings SR, Bates D, Black DM. Clinical use of bone densitometry: scientificreview. Journal of the American Medical Association, 2002, 288:1889–1897.
46. Schott AM et al. How hip and whole-body bone mineral density predict hipfracture in elderly women: the EPIDOS Prospective Study. OsteoporosisInternational, 1998, 8:247–254.
47. Siris E et al. Identification and fracture outcomes of undiagnosed low bonemineral density in postmenopausal women: results from the NationalOsteoporosis Risk Assessment. Journal of the American Medical Association, 2001,286:2815–2822.
48. Broe KE et al. Predicting fractures using bone mineral density: a prospectivestudy of long-term care residents. Osteoporosis International, 2000, 11:765–771.
49. Ross PD et al. Serum bone alkaline phosphatase and calcaneus bone densitypredicts fractures: a prospective study. Osteoporosis International, 2000,11:76–82.
50. Shaw CK et al. Prediction of bone fracture by bone mineral density in Taiwanese.Journal of Formosan Medical Association, 2001, 100: 805–810.
51. Gnudi S, Ripamonti C, Malavolta N. Quantitative ultrasound and bonedensitometry to evaluate the risk of nonspine fractures: a prospective study.Osteoporosis International, 2000, 11:518–523.
52. Tromp AM et al. Predictors of fractures in elderly women. OsteoporosisInternational, 2000, 11:134–140.
53. Chandler J et al. Low bone mineral density and risk of fracture in white femalenursing home residents. Journal of the American Medical Association, 2000,284:972–977.
54. Johnell O et al. Predictive value of bone mineral density for hip and otherfractures. Journal of Bone and Mineral Research, 2005, 20:1185–1194.
134

55. Melton LJ, Orwoll ES, Wasnich RD. Does bone density predict fracturescomparably in men and women? Osteoporosis International, 2001, 12:707–709.
56. Faulkner KG, Orwoll E. Implications in the use of T-scores for the diagnosis ofosteoporosis in men. Journal of Clinical Densitometry, 2002, 5:87–93.
57. Kanis JA et al. Diagnosis of osteoporosis and fracture threshold in men. CalcifiedTissue International, 2001, 69:218–221.
58. O´Neill TW et al. The relationship between bone density and incident vertebralfracture in men and women. Journal of Bone and Mineral Research, 2002,17:2214–2221.
59. Schott AM et al. Should age influence the choice of quantitative boneassessment technique in elderly women? The EPIDOS study. OsteoporosisInternational, 2004, 15:196–203.
60. Nevitt MC et al. Bone mineral density predicts non spine fractures in very elderlywomen. Osteoporosis International, 1994, 4:325–331.
61. Kanis JA et al. Prediction of fracture from low bone mineral density overestimatesrisk. Bone, 2000, 26:387–391.
62. Huang C, Ross PD, Wasnich RD. Short-term and long-term fracture prediction bybone mass measurement: a prospective study. Journal of Bone and MineralResearch, 1998, 13:107–113.
63. Düppe H et al. A single bone density measurement can predict fractures over 25years. Calcified Tissue International, 1997, 60:171–174.
64. Nguyen TV et al. Risk factors for osteoporotic fractures in elderly men. AmericanJournal of Epidemiology, 1996, 144:255–263.
65. Nguyen T et al. Prediction of osteoporotic fractures by postural instability andbone density. British Medical Journal, 1993, 307:1111–1115.
66. Beck TJ et al. Structural adaptation to changing skeletal load in the progressiontowards hip fragility: the Study of Osteoporotic Fractures. Journal of Bone andMineral Research, 2001, 16:1108–1119.
67. Cummings SR et al. Risk factors for hip fracture in white women. New EnglandJournal of Medicine, 1995, 332:767–773.
68. Eddy DM et al. Osteoporosis: review of the evidence for prevention, diagnosisand treatment and cost-effectiveness analysis. Osteoporosis International, 1998,8(Suppl. 4).
69. Honkanen RJ et al. Risk factors for perimenopausal distal forearm fractures.Osteoporosis International, 2000, 11:265–270.
70. Galvard H et al. Differences in body composition between female geriatric hipfracture patients and healthy controls: body fat is more important as explanatoryfactors for the fracture than body weight and lean body mass. Aging (Milano),1996, 8:282–286.
71. Joakimsen RM et al. The Tromso study: body height, body mass index andfractures. Osteoporosis International, 1998, 8:436–442.
72. Turner LW, Faile PA, Tomlinson R. Osteoporosis diagnosis and fracture.Orthopedic Nurse, 1999, 18:21–27.
73. Van der Voort DJ, Geusens P, Dinant GJ. Risk factors for osteoporosis related totheir outcome fractures. Osteoporosis International, 2001, 12:630–638.
135

74. Young Y, Myers AH, Provenzano G. Factors associated with time to first hipfracture. Journal of Aging and Health, 2001, 13:511–526.
75. Roy DK et al. Determinants of incident vertebral fracture in men and women:results from the European Prospective Osteoporosis Study (EPOS). OsteoporosisInternational, 2003, 14:19–26.
76. Willig R, Luukinen H, Jalovaara P. Factors related to occurrence of hip fracturesduring a fall on the hip. Public Health, 2003, 117:25–30.
77. Obesity: preventing and managing the global epidemic. Geneva, World HealthOrganization, 1998.
78. Mokdad AH et al. The continuing epidemics of obesity and diabetes in the UnitedStates. Journal of the American Medical Association, 2001, 286:1195–1200.
79. Darnton-Hill I, Nishida C, James WPT. A life course approach to diet, nutrition andthe prevention of chronic diseases. Public Health Nutrition, 2004, 7:101–121.
80. Peeters A et al. Obesity in adulthood and its consequences for life expectancy: alife-table analysis. Annals of Internal Medicine, 2003, 138:24–32.
81. Kanis JA et al. Guidelines for diagnosis and management of osteoporosis.Osteoporosis International, 1997, 7:390–406.
82. Osteoporosis: clinical guidelines for prevention and treatment. London, Royal Collegeof Physicians, 1999.
83. Osteoporosis: clinical guidelines for prevention and treatment. Update onpharmacological interventions and an algorithm for management. London, RoyalCollege of Physicians, 2000.
84. Pols HA, Wittenberg J. CBO guideline: osteoporosis. Nederlands Tijdschrift voorGeneeskunde, 2002, 146:1359–1363.
85. Johnell, O et al. Risk-factors for hip fracture in European women: the MedosStudy. Journal of Bone and Mineral Research, 1995, 10:1802–1815.
86. De Laet C et al. Body mass index as a prediction of fracture risk: a meta-analysis.Osteoporosis International, 2005, 16:1330–1338.
87. Sirola J et al. Risk factors associated with peri- and postmenopausal bone loss:does HRT prevent weight loss-related bone loss? Osteoporosis International, 2003,14:27–33.
88. Kiel DP et al. Hip fracture and the use of estrogens in postmenopausal women:the Framingham Study. New England Journal of Medicine, 1987, 317:1169–1174.
89. Malmivaara A et al. Risk factors for injurious falls leading to hospitalization ordeath in a cohort of 19,500 adults. American Journal of Epidemiology, 1993,138:384–394.
90. Bischoff HA et al. Effects of vitamin D and calcium supplementation on falls: arandomised controlled trial. Journal of Bone and Mineral Research, 2003,18:343–351.
91. Wootton R et al. Fractured neck of femur in the elderly: an attempt to identifypatients at risk. Clinical Science, 1979, 57:93–101.
92. Nilsson BE. Spinal osteoporosis and femoral neck fracture. Clinical Orthopaedicsand Related Research, 1970, 68:93–95.
93. Cummings SR, Melton LJ. Epidemiology and outcomes of osteoporotic fractures.Lancet, 2002, 359:1761–1767.
136

94. Robinson CM et al. Refractures in patients at least forty-five years old: aprospective analysis of twenty-two thousand and sixty patients. Journal of Boneand Joint Surgery of America, 2002, 84:1528–1533.
95. Nevitt MC et al. Association of prevalent vertebral fractures, bone density andalendronate treatment with incident vertebral fractures: effect of number andspinal location of fractures. Bone, 1999, 25:613–619.
96. Lindsay Re et al. Risk of new vertebral fracture in the year following a fracture.Journal of the American Medical Association, 2001, 285:320–323.
97. Johnell O et al. Acute and long-term increase in fracture risk after hospitalisationfor vertebral fracture. Osteoporosis International, 2001, 12:207–214.
98. Johnell O, Kanis JA, Oden A. Fracture risk following an osteoporotic fracture.Osteoporosis International, 2004, 15:175–179.
99. Gunnes M, Mellstrom D, Johnell O. How well can a previous fracture indicate anew fracture? A questionnaire study of 29,802 postmenopausal women. ActaOrthopaedica Scandinavica, 1998, 69:508–512.
100. Van Staa TP, Leufkens HGM, Cooper C. Does a fracture at one site predict laterfractures at other sites? A British cohort study. Osteoporosis International, 2002,13:624–629.
101. Gay JD. Radial fracture as an indicator of osteoporosis: a 10-year follow-upstudy. Canadian Medical Association Journal, 1974, 111:156–157.
102. Mallmin H et al. Fracture of the distal forearm as a forecaster of subsequent hipfracture: a population based cohort study with 24 years of follow-up. CalcifiedTissue International, 1993, 52:269–272.
103. Lauritzen JB et al. Radial and humeral fractures as predictors of subsequent hip,radial or humeral fractures in women, and their seasonal variation. OsteoporosisInternational, 1993, 3:133–137.
104. Cuddihy MT et al. Forearm fractures as predictors of subsequent osteoporoticfractures. Osteoporosis International, 1999, 9:469–475.
105. Finsen V, Benum P. Colles fracture as an indicator of increased risk of hip fracture:an epidemiological study. Annals of Chirurgical Gynaecology, 1987, 76:114–118.
106. Ross PD et al. Pre-existing fractures and bone mass predict vertebral fractureincidence in women. Annals of Internal Medicine, 1991, 114:919–923.
107. Kotowicz MA et al. Risk of hip fracture in women with vertebral fracture. Journalof Bone and Mineral Research, 1994, 9: 599–605.
108. Lauritzen JB, Lund B. Risk of hip fracture after osteoporosis fractures: 451women with fracture of the lumbar spine, olecranon, knee or ankle. ActaOrthopaedica Scandinavica, 1993, 64: 297–300.
109. Melton LJ et al. Vertebral fractures predict subsequent fractures. OsteoporosisInternational, 1999, 10:214–221.
110. Tuppurainen M et al. Risks of perimenopausal fractures – a prospectivepopulation-based study. Acta Obstetrica Gynaecologica Scandinavica, 1995,74:624–628.
111. Black DM et al. Prevalent vertebral deformities predict hip fractures and newvertebral deformities but not wrist fractures. Journal of Bone and Mineral Research,1999, 14:821–828.
137

112. Honkanen R et al. Associations of early premenopausal fractures withsubsequent fractures vary by sites and mechanisms of fractures. Calcified TissueInternational, 1997, 60:327–331.
113. Burger H et al. Vertebral deformities as predictors of non-vertebral fractures.British Medical Journal, 1994, 309:991–992.
114. Karlsson MK, Hasserius R, Obrant KJ. Individuals who sustain non-osteoporoticfractures continue to also sustain fragility fractures. Calcified Tissue International,1993, 53:229–231.
115. Ross PD et al. Predicting vertebral fracture incidence from prevalent fracturesand bone density among non-black, osteoporotic women. OsteoporosisInternational, 1993, 3:120–126.
116. Davis JW et al. Spatial relationships between prevalent and incident spinefractures. Bone, 1999, 24:261–264.
117. Wasnich RD, Davis JW, Ross PD. Spine fracture risk is predicted by non-spinefractures. Osteoporosis International, 1994, 4:1–5.
118. Black DM et al. Randomised trial of effect of alendronate on risk of fracture inwomen with existing vertebral fractures. Fracture intervention trial researchgroup. Lancet, 1996, 348:1535–1541.
119. Cummings S et al. Effect of alendronate on risk of fracture in women with lowbone density but without vertebral fractures. Journal of the American MedicalAssociation, 1998, 280:2077–2082.
120. Burger H et al. Risk factors of increased bone loss in an elderly population. TheRotterdam Study. American Journal of Epidemiology, 1998, 147:871–879.
121. Ensrud KE et al. Correlates of impaired function in older women. Journal of theAmerican Geriatrics Society, 1994, 42:481–489.
122. Torgerson DJ et al. Prediction of perimenopausal fractures by bone mineraldensity and other risk factors. Journal of Bone and Mineral Research, 1996,11:293–297.
123. Physicians guide to prevention and treatment of osteoporosis. Washington, DC,National Osteoporosis Foundation, 1998:1–38.
124. Nelson HD et al. Smoking, alcohol and neuromuscular and physical function ofolder women. Journal of the American Medical Association, 1994, 272:1825–1831.
125. Kanis JA. Textbook of osteoporosis. Oxford, Blackwell Science, 1996.
126. Mayhew P et al. Discrimination between cases of hip fracture and controls isimproved by hip structural analysis. An ex vivo study of the femoral neck. Bone,2004, 34:352–361.
127. Crabtree N et al. Intracapsular hip fracture and the region-specific loss of corticalbone: analysis by quantitative computed tomography (pQCT). Journal of Bone andMineral Research, 2001, 16:1318–1328.
128. Hooyman JR et al. Fractures after rheumatoid arthritis – a population basedstudy. Arthritis and Rheumatism, 1984, 27:1353–1361.
129. Cooper C, Coupland C, Mitchell M. Rheumatoid arthritis, corticosteroid therapyand the risk of hip fracture. Annals of Rheumatic Diseases, 1995, 54:49–52.
130. Van Staa TP et al. Fracture and oral corticosteroids: relationship to daily andcumulative dose. Rheumatology, 2000, 39:1383–1389.
138

131. American College of Rheumatology, Ad Hoc Committee on glucocorticosteroid-induced osteoporosis. Recommendations for the prevention and treatment ofglucocorticoid-induced osteoporosis. Arthritis and Rheumatism, 2001,44:1496–1503.
132. Eastell R et al. A UK consensus group on management of glucocorticoid inducedosteoporosis: an update. Journal of Internal Medicine, 1998, 244:271–292.
133. Guidelines Writing Group. Glucocorticoid-induced osteoporosis: guidelines forprevention and treatment. London, Bone and Tooth Society of Great Britain,National Osteoporosis Society and Royal College of Physicians, 2002.
134. Brown J, Josse RG, for the Scientific Advisory Council of the OsteoporosisSociety of Canada. Clinical practice guidelines for the diagnosis andmanagement of osteoporosis in Canada. Canadian Medical Association Journal,2002, 167(Suppl. 10):S1–S34.
135. Kanis JA, Johansson H, Oden A. A meta-analysis of prior corticosteroid use andfracture risk. Journal of Bone and Mineral Research, 2004, 19:893–899.
136. Aaron JE et al. Contrasting microanatomy of idiopathic and corticosteroid-induced osteoporosis. Clinical Orthopaedics, 1989, 243:294–305.
137. Chappard D et al. Altered trabecular architecture induced by corticosteroids: abone histomorphometric study. Journal of Bone and Mineral Research, 1996,11:676–685.
138. Manolagas SC. Corticosteroids and fracture: a close encounter of the third kind.Journal of Bone and Mineral Research, 2000, 15:1001–1005.
139. Nelson HD et al. Osteoporosis in postmenopausal women: diagnosis andmonitoring. Evidence Report / Technology Assessment No. 28 (Prepared by theOregon Health and Science University Evidence-based Practice Center undercontract no 290-97-0018). Rockville, MD, Agency for Healthcare Research andQuality, 2002 (AHRQ Publication, No. 01-EO32).
140. Sowers MR, Burns TL, Wallace RB. Familial resemblence of bone mass in adultwomen. Genetic Epidemiology, 1986, 3:85–93.
141. Evans RA et al. Bone mass is low in relatives of osteoporotic patients. Annals ofInternal Medicine, 1998, 109:870–873.
142. Seeman E et al. Reduced bone mass in daughters of women with osteoporosis.New England Journal of Medicine, 1989, 32:554–558.
143. Hansen MA et al. Is heritability a risk factor for postmenopausal osteoporosis?Journal of Bone and Mineral Research, 1992, 7:1037–1043.
144. Smith DM et al. Genetic factors determining bone mass. Journal of ClinicalInvestigation, 1973, 52:2800–2808.
145. Dequeker J et al. Genetic determinants of bone mineral content at the spine andradius: a twin study. Bone, 1987, 8:207–209.
146. Pocock NA et al. Genetic determinants of bone mass in adults: a twin study.Journal of Clinical Investigation, 1987, 80:706–710.
147. Slemenda CW et al. Genetic determinants of bone mass in adult women: a re-evaluation of the twin model and the potential importance of gene interaction onheritability estimates. Journal of Bone and Mineral Research, 1991, 6:561–567.
139

148. Moller M et al. Metacarpal morphometry in monozygotic and dizygotic elderlytwins. Calcified Tissue International, 1978, 25:197–201.
149. Christiansen C, Riis BJ, Rodbro P. Prediction of rapid bone loss inpostmenopausal women. Lancet, 1987, i:1105–1108.
150. Flicker L et al. Bone density determinants in elderly women: a twin study. Journalof Bone and Mineral Research, 1995, 10:1607–1613.
151. Bauer DC et al. Factors associated with appendicular bone mass in older women:the study of Osteoporotic Fractures Research Group. Annals of Internal Medicine,1993, 118:657–665.
152. Orwoll ES et al. Axial bone mass in older women. Annals of Internal Medicine,1996, 124:187–196.
153. Brot C, Jensen LB, Sorensen OH. Bone mass and risk factors for bone loss inperimenopausal Danish women. Journal of Internal Medicine, 1997, 242:505–511.
154. Fox KM et al. Family history and risk of osteoporotic fracture: Study ofOsteoporotic Fractures Research Group. Osteoporosis International, 1998,8:557–562.
155. Kwaliteitsinstituut voor de Gezondheidszorg CBO. Osteoporose Tweede HerzieneRichtlijn [Osteoporosis, second revision]. Utrecht, 2002(www.cbo.nl/product/richtlijnen/ , accessed 14 November 2006).
156. Keen RW et al. Family history of appendicular fracture and risk of osteoporosis:a population-based study. Osteoporosis International, 1999, 10:161–166.
157. Danielson ME et al. Familial resemblance of bone mineral density (BMD) andcalcaneal ultrasound attenuation: the BMD in Mothers and Daughters Study.Journal of Bone and Mineral Research, 1999, 14:102–110.
158. Grainge MJ et al. Association between a family history of fractures and bonemineral density in early postmenopausal women. Bone, 1999, 24:507–512.
159. Seeman E et al. Reduced femoral neck bone density in the daughters of womenwith hip fracture: the role of low peak bone density in the pathogenesis ofosteoporosis. Journal of Bone and Mineral Research, 1994, 9:739–743.
160. Soroko SB et al. Family history of osteoporosis and bone mineral density at theaxial skeleton: the Rancho Bernardo Study. Journal of Bone and Mineral Research,1994, 9:761–769.
161. Cummings SR, Nevitt MC. Epidemiology of hip fractures and falls. In: KleerekoperM, Krane SM, eds. Clinical disorders of bone and mineral metabolism. New York,Mary Ann Liebert, 1989:231–236.
162. Huopio J et al. Risk factors for perimenopausal fractures: a prospective study.Osteoporosis International, 2000, 11:219–227.
163. Bohannon AD et al. Association of race and other potential risk factors with non-vertebral fractures in community-dwelling elderly women. American Journal ofEpidemiology, 1999, 149:1002–1009.
164. Mallmin H et al. Risk factors for fractures of the distal forearm: a population-based case-control study. Osteoporosis International, 1994, 4:298–304.
165. Kelsey JL et al. Risk factors for fracture of the distal forearm and proximalhumerus. American Journal of Epidemiology, 1992, 135:477–489.
140

166. Melton LJ et al. Secondary osteoporosis and the risk of distal forearm fracturesin men and women. Bone, 2002, 31:119–125.
167. Kanis JA et al. Smoking and fracture risk: a meta-analysis. OsteoporosisInternational, 2005, 16:155–162.
168. Sowers MR et al. Radial bone mineral density in pre and perimenopausal women:a prospective study of rates and risk factors for loss. Journal of Bone and MineralResearch, 1992, 7:647–657.
169. Hannan MT et al. Risk factors for longitudinal bone loss in elderly men andwomen: the Framingham Osteoporosis Study. Journal of Bone and MineralResearch, 2000, 15:710–720.
170. Hermann AP et al. Premenopausal smoking and bone density in 2015perimenopausal women. Journal of Bone and Mineral Research, 2000, 15:780–787.
171. McKinlay SM, Bifano NL, McKinley JB. Smoking and age at menopause inwomen. Annals of Internal Medicine, 1985, 103:350–356.
172. Seeman E. The effects of tobacco and alcohol use on bone. In: Marcus R,Feldman D, Kelsey J, eds. Osteoporosis, San Diego, Academic Press,1996:577–597.
173. Kiel DP et al. Smoking eliminates the potential effects of oral estrogens on the riskfor hip fractures among women. Annals of Internal Medicine, 1992, 116:716–721.
174. Hoidrup S et al. Alcohol intake, beverage preference and risk of hip fracture inmen and women. American Journal Epidemiology, 1999, 149:933–1001.
175. Hoidrup S et al. Hormone replacement therapy and hip fracture risk: effects ofmodifications by tobacco smoking, alcohol intake, physical activity and bodymass index. American Journal of Epidemiology, 1999, 150:1085–1093.
176. Svendsen OL et al. Impact of soft tissue on in vivo accuracy of bone mineralmeasurements in the spine, hip and forearm: a human cadaveric study. Journal ofBone and Mineral Research, 1995, 10:868–873.
177. Cornuz J et al. Smoking, smoking cessation and risk of hip fracture in women.American Journal of Medicine, 1999, 106:311–314.
178. Seeman E et al. Risk factors for spinal osteoporosis in men. American Journal ofMedicine, 1983, 75:977–983.
179. Holbrook TL, Barrett-Connor E. A prospective study of alcohol consumption andbone mineral density. British Medical Journal, 1993, 306:1506–1509.
180. Johnell O, Kristenson H, Redlund-Johnell I. Lower limb fractures and theregistration for alcoholism. Scandinavian Journal of the Society of Medicine, 1985,13:95–97.
181. Felson DT et al. Alcohol consumption and hip fractures: the Framingham Study.American Journal of Epidemiology, 1988, 128:1102–1110.
182. Felson DT et al. Alcohol intake and bone mineral density in elderly men andwomen: the Framingham Study. American Journal of Epidemiology, 1995,142:485–492.
183. Orwoll ES, Bevan L, Phipps KR. Determinants of bone mineral density in oldermen. Osteoporosis International, 2000, 11:815–821.
184. Kanis JA, Johansson H, Johnell O. Alcohol intake as a risk factor for fracture.Osteoporosis International, 2005, 16:737–742.
141

185. La Vecchia C et al. Cigarette smoking, body mass and other risk factors forfractures of the hip in women. International Journal of Epidemiology, 1991,20:671–677.
186. Grisso JA et al. Risk factors for hip fracture in men. American Journal ofEpidemiology, 1997, 145:786–793.
187. Grisso JA et al. Risk factors for falls as a cause of hip fracture in women. NewEngland Journal of Medicine, 1991, 324:1326–1331.
188. Cumming RG, Klineberg RJ. Case-control study of risk factors for hip fractures inthe elderly. American Journal of Epidemiology, 1994, 139:493–503.
189. Paganini-Hill A et al. Exercise and other factors in the prevention of hip fracture:the Leisure World Study. Epidemiology, 1991, 2:16–25.
190. Huang Z, Himes JH, McGovern PG. Nutrition and subsequent hip fracture riskamong a national cohort of white women. American Journal of Epidemiology, 1996,144:124–134.
191. Hemenway D et al. Risk factors for hip fracture in US men aged 40 through 75years. American Journal of Public Health, 1994, 84:1843–1845.
192. Holbrook TL, Barrett-Connor E, Wingard DL. Dietary calcium and risk of hipfracture: 14-year prospective population study. Lancet, 1988, 2:1046–1049.
193. Laitinen K, Valimaki M. Alcohol and bone. Calcified Tissue International, 1991,49(Suppl.):S70–S73.
194. Dymling JF et al. Whiskey: a new provocative test for calcitonin secretion. ActaEndocrinologica, 1976, 82:500–509.
195. Rico H. Alcohol and bone disease. Alcohol, 1990, 25:345–352.
196. Poor G et al. Predictors of hip fractures in elderly men. Journal of Bone andMineral Research, 1995,10:1900–1907.
197. Spector TD et al. Risk of vertebral fracture in women with rheumatoid arthritis.British Medical Journal, 1993, 306:558.
198. Melton LJ III et al. Secondary osteoporosis and the risk of vertebral deformitiesin women. Bone, 1999, 24:49–55.
199. Orstavik RZ et al. Vertebral deformities in rheumatoid arthritis: a comparison withpopulation-based controls. Archives of Internal Medicine, 2004, 164:420–425.
200. Mikuls TR. Co-morbidity in rheumatoid arthritis. Best Practical Research in ClinicalRheumatology, 2003, 17:729–752.
201. Davison KS et al. Impact of height loss due to vertebral fractures on body massindex. Journal of Bone and Mineral Research, 2003, (Suppl. 1):S243.
202. Midanik LT. Validity of self-reported alcohol use: a literature review andassessment. British Journal of Addiction, 1988, 83:1019–1030.
203. Standing Medical Advisory Committee to the Secretaries of State for Health andfor Wales Drinking problems: a challenge for every doctor. London, Her Majesty’sStationery Office, 1989.
204. Van Staa TP et al. Bone density threshold and other predictors of vertebralfracture in patients receiving oral glucocorticoid therapy. Arthritis and Rheumatism,2003, 48:3224–3229.
142

205. Delmas PD et al. Severity of prevalent vertebral fractures and the risk ofsubsequent vertebral and nonvertebral fractures: results from the MORE trial.Bone, 2003, 33:522–532.
206. Johnell O et al. A comparison of total hip and femoral neck BMD as a predictorof fracture risk: a meta-analysis. Journal of Bone and Mineral Research, 2005,20(Suppl. 1):S4.
207. Cummings SR et al. Bone density at various sites for prediction of hip fracture:the Study of Osteoporotic Fractures Research Group. Lancet, 1993, 34:72–75.
208. Hans D et al. Ultrasonic heel measurements to predict hip fracture in elderlywomen: the EPIDOS prospective study. Lancet, 1996, 348:511–514.
209. Bauer DC et al. Quantitative ultrasound predicts hip and non-spine fracture inmen: the Mr OS study. Journal of Bone and Mineral Research, 2004, 19(Suppl.1):S7.
210. Looker AC et al. Clinical use of biochemical markers of bone remodeling: currentstatus and future directions. Osteoporosis International, 2000, 11:467–480.
211. Delmas PD, ed. The use of biochemical markers of bone turnover in themanagement of post-menopausal osteoporosis. Osteoporosis International, 2000,11(Suppl. 6):S1–S76.
212. Garnero P. Markers of bone turnover for the prediction of fracture risk. In: DelmasPD, ed. The use of biochemical markers of bone turnover in the management ofpostmenopausal osteoporosis. Osteoporosis International, 2000, 11(Suppl.6):S55–S65.
213. Garnero P et al. Markers of bone resorption predict hip fracture in elderly women:the EPIDOS prospective study. Journal of Bone and Mineral Research, 1996,11:1531–1538.
214. Vergnaud P et al. Undecarboxylated osteocalcin measured with a specificimmunoassay predicts hip fracture in elderly women: the EPIDOS study. Journalof Clinical Endocrinology and Metabolism, 1997, 82:719–724.
215. Riggs BL, Melton LJ. Bone turnover matters: the raloxifene paradox of dramaticdecreases in vertebral fractures without commensurate increases in bonedensity. Journal of Bone and Mineral Research, 2002, 17:11–14.
216. Van der Klift M et al. Risk factors for incident vertebral deformity in men andwomen: the Rotterdam study. Journal of Bone and Mineral Research, 2004,19:1172–1180.
217. Lunt M et al. Bone density variation and its effects on risk of vertebral deformityin men and women studied in 13 European centres: the EVOS study. Journal ofBone and Mineral Research, 1997, 12:1883–1894.
218. Silman A et al. Influence of physical activity on vertebral deformity in men andwomen: results from the European Vertebral Osteoporosis Study. Journal of Boneand Mineral Research, 1997, 12:813–819.
219. Nevitt MC et al. Risk factors for a first incident radiographic vertebral fracture inwomen > 65 years of age: the Study of Osteoporotic Fractures. Journal of Boneand Mineral Research, 2005, 20:131–140.
220. Papaioannou A et al. Risk factors associated with incident clinical vertebral andnonvertebral fractures in postmenopausal women: the Canadian MulticentreOsteoporosis Study (CaMos). Osteoporosis International, 2005, 16:568–578.
143

221. Kaptoge S et al. When should the doctor order a spine X-ray? Identifyingvertebral fracture for osteoporosis care: results from the European ProspectiveOsteoporosis study (EPOS). Journal of Bone and Mineral Research, 2004,19:1982–1993.
6. Combining risk factors for risk assessmentSeveral factors should be considered when integrating risk factors forfracture risk assessment. One of these is that risk is variably expressed. Fordichotomous variables like the clinical risk factors, epidemiological studiescommonly report the risk ratio (RR) (or relative risk) of fracture inindividuals compared to those without the exposure variable. However, therisk of fracture can also be compared with an average risk, for example, therisk of hip fracture at a given BMD compared to an individual with anaverage fracture risk (which differs from the risk compared with averageBMD). Whereas risk ratios or relative risks are commonly used fordichotomous variables, in the case of BMD, the performance characteristicsare commonly expressed as a gradient of fracture risk, e.g. the change infracture risk per standard deviation change in BMD. Other examples aregiven in Fig. 6.1 (1). All these approaches give differing risk ratios. Theheterogeneity of these risk indicators necessitates an awareness of thedifferent methods and, if they are to be combined, they need to be reducedto a uniform metric. The most attractive candidates for use in the assessmentof patients are:
• population relative risk, i.e. the risk of an individual compared with the population of the same age and sex;
• gradient of risk, i.e. the increased likelihood of fracture risk per standard deviation change in risk score;
• absolute fracture probability, i.e. the risk that an individual will sustain a fracture within a given time interval.
144

Fig. 6.1 Different methods of expressing risk ratio (e.g. for hip fracture) in individuals or populations:a
A, risk ratio of an individual at the threshold value for osteoporosis compared with that ofthe general population; B, risk ratio of all women with osteoporosis compared with that ofthe general population; C, risk ratio of a woman at the threshold value for osteoporosiscompared with a woman with an average BMD for that age; D, risk ratio of osteoporoticwomen compared with those without osteoporosis
Source: reference 1 (Fig. 1).BMD, bone mineral density.a The diagram shows the normal distribution of hip BMD in women aged approximately 65 years.The average BMD is 1 SD below the mean value for young healthy women and approximately 16%have osteoporosis (T score < –2.5 SD).
Each of these approaches is discussed in the sections that follow.
6.1 Population relative risksThe meta-analyses reviewed in section 5 provide risk ratios for dichotomousvariables and gradients of risk for continuous variables. For dichotomousvariables, the risk ratios given are the risk of individuals with the risk factorcompared with the risk of individuals without the risk factor but who areotherwise similar. In order to convert these risk ratios to the risk of anindividual compared to that of the general population, i.e. the populationrelative risk (PRR), it is necessary to take account of the prevalence of therisk factors. An example is the risk associated with the use of glucocorticoidswhere ever use was associated with a relative risk of hip fracture of 3.71 atthe age of 60 years (see section 5, Table 5.11) compared with individuals ofthe same age without the exposure. Ever-use of glucocorticoids was found in4.9% of the population at that age. Since the general population comprisesthose with and without the risk factor, the adjusted PRR is given by
RR/(p·RR+(1-p)), [1]where p is the prevalence of the risk factor and RR the relative risk of everuse versus never use. In the example above the PRR is
3.71/(0.049 x 3.71 + (1 – 0.049)) = 3.28.The higher the prevalence of the risk factor, the greater the downwardadjustment. Further examples of this formula are given in Table 6.1.
145

Table 6.1 Estimates of population relative risks derived from relative risks in epidemiological studies(RR cases versus controls) according to the prevalence of risk factors in the population
Prevalence RRof riskfactor (%) 1.5 2.0 2.5 3.0
5 1.46 1.90 2.33 2.7310 1.43 1.82 2.17 2.5020 1.37 1.67 1.92 2.1430 1.30 1.54 1.72 1.8850 1.20 1.33 1.43 1.50
Where two dichotomous risk factors are to be combined, the risk ratios mustfirst be adjusted to take account of the contribution of one to the other. Anexample is provided from the EPIDOS study (2,3). In this study of 80 yearold women, low BMD, high urinary excretion of a bone resorption markerand a history of prior fractures were all significant risk factors for hipfracture (Table 6.2). The combination of these risk factors improved theassessment of risk in that any two of these risk factors predicted fracturemore strongly than any one factor alone.
Table 6.2 The effect of risk factors alone or in combination on the relative risk of hip fracture in womenat the age of 80 years
Risk Threshold Prevalence Oddsfactor values (%) ratio RRa
Average - 100 - 1.0Low BMD T-score <-2.5 56 2.8 1.40Prior fracture yes 39 3.5 1.77High CTXb above premenopausal values 23 2.4 1.82Low BMD + prior fracture as above 23 4.1 2.39Low BMD + high CTX as above 16 4.1 2.74Prior fracture + high CTX as above 12 5.3 3.50All of the above as above 7 5.8 4.43
Source: reference 3 (Table 1).RR, risk ratio; BMD, bone mineral density; CTX, urinary type I C-telopeptide of collagen.aAdjusted to the population.bC-telopeptide of type I collagen.
In the example above, BMD was dichotomized by categorizing individualswith and without osteoporosis. It is, however, also possible to determinepopulation relative risk from gradient of risk (GR). The population relativerisk is equal to the incidence of fracture at a given BMD (Ix) divided by theaverage incidence of fractures in the population (Ia). Thus, the incidence Ix= PRR/Ia. Ia is given by
Ia = exp(-ln(GR)(x - µ)/σ - (ln(GR))2/2), [2]
where m is the mean BMD, s is the SD, and I is the yearly incidence offracture in the age group (4). Note that the part (x - µ)/σ in formula [2] is theZ-score.
146

If the mean (µ) of BMD at a certain age and sex, and the standard deviation(σ) are known, the risk ratios versus the normal population (i.e. the PRR) canbe derived for: those below a threshold g of BMD or those with a specifiedZ-score for BMD; and those at a value x of BMD.
Consider the calculation of population relative risk (PRR) from therelationship between BMD at the femoral neck and hip fracture. For thepurposes of illustration, the hip fracture risk is assumed to increase by 2.6 perstandard deviation decrease in BMD, as described in the meta-analysis ofMarshall, Johnell and Wedel (5), rather than to vary by age as described insection 5. Using this assumption, the PRR of hip fracture in an individualwith a Z-score of BMD of exactly –1 (1 SD below the mean for that age)would be
exp((-ln(2.6)⋅-1)-(1n(2.6))2/2) = 2.6 exp(-1n(2.6)2/2) = 1.65,
given a normal distribution of BMD (6). Thus, the risk of hip fracture in anindividual with a Z-score of –1 SD is 1.65-fold higher than the average riskof the general population. It is important to note, however, that this is not therisk of an individual compared with an individual with a Z-score of 0 (whichwould be 2.6). The reason is that hip fracture rates increase exponentiallywith decreasing BMD, but BMD is normally distributed. Thus, individualswith an average BMD have a risk of hip fracture that is lower than theaverage fracture risk in the population (Jensen’s inequality).
The risk of fracture in the short perspective (i.e. not accounting for deaths)of those with BMD below a threshold for BMD (x) at a certain age is:
I · Φ((x - µ)/σ + ln(GR))/ Φ((x - µ)/σ), [3]
where I is the yearly incidence for the same age and sex, m is the mean and sis the SD of BMD at the current age, ln(GR) is the e-log of the risk ratio foreach SD decrease in BMD (as in formula [2]) and Φ is the standard normaldistribution function with a mean = 0 and SD = 1 (6).
Examples of the different risk estimates for hip fracture are provided for menand women with osteoporosis in Table 6.3 based on femoral neckmeasurements of BMD using the NHANES reference ranges (1). For anindividual at the threshold of osteoporosis, relative risk (although notabsolute risk) decreases with age. It is notable that the risk ratio decreasesbelow unity in women at the age of 75 years. The reason for this is that theaverage BMD is below a T-score of –2.5 SD at this age, so that a bone densityof exactly –2.5 SD carries a risk lower than that of the general femalepopulation of the same age.
147

Table 6.3 Proportion of the male and female population of Sweden, at the ages shown, identified ashaving osteoporosis and the risk of hip fracture
Men WomenAge(years) % population PRRa PRRb RRc % population PRRa PRRb RRc
50 2.4 4.2 6.4 6.6 5.4 2.9 4.8 4.655 2.8 3.9 6.1 6.2 8.1 2.4 4.1 3.860 4.8 3.1 5.0 4.9 12.3 1.9 3.4 3.065 7.3 2.5 4.2 4.0 17.7 1.5 2.9 2.470 7.6 2.5 4.2 3.9 24.5 1.2 2.5 1.975 8.0 2.4 4.1 3.8 33.8 0.95 2.1 1.580 14.0 1.8 3.2 2.8 43.3 0.74 1.8 1.284 19.4 1.4 2.8 2.3 51.0 0.62 1.6 0.98
Source: reference 1 (Table 5).PRR, population relative risk; RR, risk ratio.aFor an individual at the threshold value for osteoporosis (T-score = –2.5 SD) compared with thewhole population of the same age and sex.bFor all individuals with a T-score value exceeding the threshold for osteoporosis (T-score = < –2.5SD).cRisk ratio of individuals at the threshold of osteoporosis compared with an individual with a meanvalue for bone mineral density for that age and sex.
Table 6.3 also shows the need to choose appropriate relative risks. Forexample, the risk of an individual at the threshold of osteoporosis comparedto an individual with a mean value for BMD in women at the age of 60 yearsis 3.0, but the risk of that individual compared to the population of the sameage and sex is only 1.9, for the reasons given above.
Few individuals have, however, a BMD value that lies exactly at the thresholdfor osteoporosis. It is, therefore, sometimes appropriate to express risk as therisk of individuals that lie within the diagnostic criterion relative to the riskof fracture of the whole population. Risk ratios for populations withosteoporosis (i.e. below the T-score threshold for BMD) are also given inTable 6.3. For example, a randomly drawn population of women aged 50years with a BMD value of less than -2.5 SD would have a risk ratio of 4.8,and women of the same age at exactly the threshold of osteoporosis a riskratio of 2.9. It should be noted that the estimates of risk provided aremodelled for hip fractures from measurements made at the hip with BMDusing dual energy X-ray absorptiometry (DXA). The risks computed woulddiffer for other fracture outcomes, and from those derived frommeasurements made with other densitometry techniques or the use of DXAat other sites.
Where population relative risks from clinical risk factors are combined withBMD, they must be first adjusted for BMD, because many risk factors exerttheir effects partly through reduced BMD. In the example mentioned at thebeginning of this section, the use of glucocorticoids was associated with arelative risk of hip fracture of 3.71 in men and women aged 60 years
148

compared with individuals not exposed to these agents. The populationrelative risk was 3.28. In this example, the relative risk did not change withadjustment for BMD, indicating that the adverse influence of glucocorticoiduse on fracture risk was largely independent of BMD. In women at the age of60 years at the threshold for osteoporosis, the population relative risk is 1.90.In women exposed to glucocorticoids the relative risk at the threshold forosteoporosis is, therefore, the product of the two estimates, because of theirindependence:
3.28 x1.90 = 6.23.
The relative risk of hip fracture with glucocorticoid exposure decreases withage (although absolute risk increases). The same is true for BMD. Thedecrease in risk ratios with age poses some problems with the use of age-specific risks. In the case of BMD, the risk ratio at the diagnostic thresholdfor osteoporosis decreases with age (Fig. 6.2 and Table 6.3), although theabsolute risk (probability) of hip fracture increases (1). This apparentparadox is confusing for clinicians. This is one of the reasons to prefer the useof absolute (e.g. 10 year) fracture risks in patient care (see section 6.3, below).
Fig. 6.2 Population relative risks for hip fracture over 10 years in Swedish women with osteoporosisaccording to agea
Source: reference 1 (Fig. 2).aRisk is shown for women at the threshold value for osteoporosis (T = –2.5 SD) or those below thethreshold (T < –2.5 SD). Hip fracture risk is assumed to increase 2.6-fold per 1 SD change in BMD± the 95% confidence estimate of the gradient.
6.2 Gradients of riskThe dichotomous categorization of continuous variables such as BMD orBMI is inefficient for individual patient assessment, and is the principalargument for preserving the actual measurement when integrating risks. Inpopulation studies, BMD is normally distributed, as are many othercontinuous variables. When fracture risk is additionally assessed with adichotomous variable (e.g. past fragility fracture) or with another continuous
149

variable (e.g. BMI), the combined distribution is continuous but, when therisk indicators are totally or partially independent, there is a higher gradientof risk (7). The relationship between a measured variable and a combinationof variables with gradients of risk of 1.5, 2.0, 2.6 and 4.0 per standarddeviation in risk score is shown in Fig. 6.3. The steeper the gradient of risk,the greater the potential for identifying individuals at higher risk. Forexample, when the dotted line in Fig. 6.3 is taken as a treatment threshold,fewer individuals with a risk score of +3 SD would be identified above thethreshold with a test whose gradient of risk was 1.5 compared with tests thathad higher gradients of risk.
Fig. 6.3 Relative risk (RR) of fracture in the population at a given age for different assumptions forthe gradient of risk (RR/SD)a
Source: J. A. Kanis (unpublished data).aThe risk at the average risk score of 1 is the referent.
If it is assumed that the combination of risk factors is also distributednormally, the risk of individuals compared to the average risk in thepopulation (stratified by age and sex) can be determined.
The proportion of individuals (p) above a given risk threshold can becalculated from the combination of distributions (7). This proportion isdependent on the chosen risk threshold (x) and the gradient of risk (GR), i.e.the relative risk per SD increase in risk score. It can be shown that thisproportion is given by: [4]
where F is the standard normal distribution function as before.
The average risk (AR) in the group above the chosen risk threshold can alsobe calculated. This is given by: [5]
where a = -(ln(GR)2/2), b= -ln(GR) and z=(ln(x)-a)/b.
150

The important assumption that combinations of several variables of bothcontinuous and dichotomous risk factors lead to a normal distribution of therisk score in the population is based on the central limit theorem. Theadequacy of this assumption has been validated empirically using baselinedata on BMD and risk indicators from the Rotterdam Study (7).
The proportion of individuals above a given risk threshold is shown in Table6.4, with a range of assumptions. When, for example, the assumed gradientof risk is 2.0 per SD change in risk score, the proportion of individuals ataverage, double or triple risk is 36%, 9% and 3% respectively. When a muchsteeper gradient of risk is assumed, such as 4 per SD, 24%, 12% and 7% ofindividuals were identified above these risk thresholds, respectively. Thus,with increasing gradients of risk, the proportion of the population identifieddecreased when the risk threshold was near the average risk in thepopulation. By contrast, at higher risk thresholds, the population identifiedincreased with increasing gradients of risk. For example, when the riskthreshold was set at 2 (twice the average risk in the whole population), theproportion of the population detected to be at risk increased from 9% with agradient of risk of 2/SD up to 12% with a gradient of risk of 4/SD (see Table6.4).
Table 6.4 Proportion (%) of individuals detected above a given risk threshold according to gradient ofrisk
Gradient Risk threshold (individual risk versus population risk)of risk(score/SD) 1 1.5 2.0 2.5 3.0 3.5 4.0
2.0 36.4 17.6 8.9 4.8 2.7 1.6 0.92.5 32.3 18.4 11.2 7.2 4.9 3.4 2.43.0 29.1 17.9 11.9 8.3 6.1 4.6 3.54.0 24.4 16.2 11.6 8.8 6.9 5.5 4.55.0 21.1 14.5 10.8 8.5 6.8 5.7 4.8
Source: reference 7 (Table 1).
The performance of a test is much better when the risk ratio per SD is greater(Table 6.5). When the average population risk is used as a threshold, theaverage risk in the test-positive category is 1.7 times the average populationrisk when the gradient of risk is 2/SD. At a risk gradient of 4/SD, the averagerisk becomes 3.1 times the average population risk at the same threshold.When the threshold was a risk twice the population risk, the average relativerisks in those identified increased to 2.9 and 5.0 with gradients of risk of 2.0or 4.0/SD, respectively. Thus, tests with a progressively higher gradient of riskidentify progressively higher-risk patients, and lead, therefore, to a greatereffectiveness of subsequent intervention.
151

Table 6.5 Average risk in individuals above a given risk threshold for different gradients of risk
Gradient Risk threshold (individual risk versus population risk)of risk(score/SD) 1 1.5 2.0 2.5 3.0 3.5 4.0
2.0 1.74 2.31 2.88 3.46 4.03 4.61 5.182.5 2.09 2.75 3.41 4.06 4.71 5.35 5.983.0 2.43 3.19 3.93 4.66 5.38 6.09 6.794.0 3.10 4.04 4.95 5.84 6.70 7.55 8.395.0 3.75 4.88 5.96 7.00 8.01 9.00 9.98
Source: reference 7 (Table 2).
The gradients of risk are a useful description of the performancecharacteristics of assessment tools. When logistic regression models are used,performance is commonly expressed as an area under the receiver operatorcharacteristic (ROC) curve. There is a mathematical relationship betweengradient of risk and area under the ROC curve; examples are given in Table6.6.
Table 6.6 The relationship between gradient of risk (relative risk per SD change in risk score) and areaunder the receiver operator characteristic (ROC) curve
Gradient of Area underrisk/SD ROC curve
1.0 0.501.1 0.531.5 0.612.0 0.692.5 0.743.0 0.784.0 0.845.0 0.876.0 0.90
To achieve high performance characteristics, a combination of risk factorsthat give totally or partially independent contributions to the risk is required.The risk factors identified in section 5 that are partly independent of both ageand BMD include previous fragility fractures, a family history of hipfracture, exposure to oral glucocorticoids, rheumatoid arthritis, smoking,high intakes of alcohol and biochemical estimates of bone resorption. Thesevarious risk factors, used in combination with BMI or BMD, have thepotential to enhance the gradient of risk and thus the efficiency of case-finding. The extent to which this is achieved is reviewed in section 7.
6.3 Absolute probability of fracture
Although multiple clinical risk factors can be used to assess risk, the use ofZ-scores, T-scores, gradients of risk and areas under the ROC curve raisepractical problems for patient assessment, particularly at the primary health
152

care level, since they are not readily understood or used by physicians andother health-care professionals. As mentioned, the use of risk ratios is alsoproblematic since, for example, the relative risk of fracture for a given BMDdecreases with age (1), whereas the absolute incidence of fracture rises.
These considerations have led to the view that risk assessment should bebased on absolute risk, i.e. the probability of fracture (4,8,9). Thisprobability should ideally take account not only of age and sex, but also ofvalidated independent risk assessment tools, including but not limited tobone mass measurements. The use of absolute fracture risk has the potentialto be applicable to both sexes, all ages, all races and all countries even thoughthe incidence of osteoporotic fractures varies widely by age, sex, ethnicity andgeography. Similar approaches are now used in the management ofcardiovascular disease (10–16). In cardiovascular disease, the simultaneousconsideration of smoking, blood pressure, diabetes and serum cholesterolpermits the identification of patients at high risk, whereas the use of serumcholesterol alone has a low gradient of risk, significantly poorer than theassessment of BMD alone to predict hip fracture (5,17,18).
6.3.1 Estimating fracture probabilityThe term “risk” is used to describe several well-defined notions ofmathematical statistics, one of which is the probability of an event and theother is the hazard function. In contrast, a risk ratio is a characterization ofrisk but not an expression of absolute risk. Gradient of risk per 1 SD is ameasure of the goodness of a single variable or a risk score (combination ofvariables) to serve as a predictor.
If a type of event is considered where the follow-up period is not important,e.g. the presence of a certain malformation among newborn children, theactual probability is the only figure of interest. In most instances, however,clinical events evolve over time. Where individuals are followed to determinewhether and when certain events occur (e.g. fracture, stroke, death), thehazard function is of interest. The hazard function is a function of at leastone type of time parameter (e.g. time since start of follow-up, age, calendartime) and there may also be several other components of the function, suchas sex, BMI and BMD, as described in section 5. The hazard functiondescribes the risk at a certain moment and is defined as the limit value of thequotient between the expected number of events in a small interval of timedivided by the length of that interval when the interval becomes infinitelysmall and shrinks to zero. A survival function, which can be calculated fromthe hazard function, gives the probability that an event has not occurredbefore any given time. The survival function is the natural number e to thepower of minus the area under the hazard function curve from 0 to t over agiven time interval.
There is no single method to determine and present hazard functions; and itis appropriate to compare Cox regression, logistic modelling and Poissonregression models.
153

From Cox regression analysis, the ratios between hazard functions (i.e.hazard ratios) can be determined. Sometimes survival functions determinedby Cox regression analyses are also presented, but not hazard functions.
A logistic model means that the probability of an event is 1/(1+ exp(-S)),where S = β0 + β1⋅x1 + … + βk⋅xk and x1, … , xk are the values of k variables.
From a logistic regression analysis, odds ratios are calculated. If p1 is the
probability of an event, p1/(1-p1) is the odds of the event. It can be shown that
the odds ratio of an event (e.g. a malformation), depending on whether theage of the mother is x+1 or x years, is exp(β) where β is the coefficient of age.When p1 is a small number, the probability and the odds are almost the same
and thus an odds ratio, (p1/(1-p1))/( p2/(1-p2)), will be close to the quotient
between two probabilities, p1/ p2 . Thus, odds ratios may be good surrogates
for risk ratios, which are quotients between probabilities (risks).
The most common information on risks (probabilities or hazard functions)given in the literature is presented as odds ratios (close to risk ratios) orhazard ratios. The probabilities or the hazard functions themselves areseldom presented. There are situations when it is crucial to determine hazardfunctions (not only hazard ratios) in order to generate new knowledge. Astudy on excess mortality attributable to hip fracture events is an example(19). The hazard functions are also important in order to determine 10-yearprobability of fracture taking competing risks such as death into account (seeAnnex 5).
It is important to note that when the risk of fracture is studied by Coxregression analysis (or by Poisson regression), death is usually censored. Butthe simple application of the results to determine a survival function givingthe probability of being free from fracture neglects the possibility of dyingbefore fracture.
The Poisson regression model used in the present analyses allows theinteraction between a variable x and the time parameter to be introduced.Thus the linear combination can contain expressions like β1⋅x1 + β2⋅x1⋅t =
(β1 + β2⋅t) ⋅ x1. We can consider (β1 + β2⋅t) as a time-dependent beta coefficient
of x1 . Hence, the beta coefficient can be decreasing (or increasing) with time.
If the predictive power of a variable is decreasing with time, such models areneeded in order to reflect the decrease. An example is provided in the case ofBMD, where the gradient of risk for hip fracture prediction decreasessignificantly with age (see section 5, Table 5.7). Note that a time-dependentbeta coefficient is not the same as a time-dependent covariate x. The lattermeans that the variable x is allowed to change its value with time, and thatcan also be handled by Cox regression. By introducing interactions, i.e.products between variables, the model can be made more realistic (with abetter fit to the data). Another way of improving a model is to exchange asimple expression of the form β1⋅x with b1⋅min(x, g) + β2 ⋅max(x-g, 0), where
154

min(x, g) is the minimum of the numbers x and g and max(x-g, 0) is themaximum of the numbers x-g and 0. The number g (for example, a specificvalue for BMI) is a limit chosen somewhere in the range of the risk variableX. Below g the change of risk is characterized by β1 and above g by β2. The
new function is also a continuous function of x. An example is theinterrelationship between BMI and fracture risk, where a change in BMI hasa different significance at different levels of BMI (section 5).
When several variables are considered simultaneously, the beta coefficientswill differ from the coefficients obtained when each variable is studied alone.However, the change in a beta coefficient may be small if the correspondingrisk variable is of great importance. In order to estimate the beta coefficientsfor a model that includes several variables, we generally need sufficient datafor all the variables.
In the types of models mentioned (logistic regression model, Cox andPoisson regression models), the importance of different variables is reflectedby beta coefficients. The linear combination β1⋅x1 + … + βk⋅xk of the variables
gives a risk score, which can be considered as a new variable. When thegoodness of the combination as a predictor is studied, the same type ofdescription (gradient of risk per standard deviation, area under the ROCcurve, etc.) can be applied as for a single variable xi.
6.3.2 Fracture probabilityIn individuals who have not yet sustained a fracture, estimates of long-termrisk of fracture require documentation of the incidence of the first fractureat a particular site. Second or subsequent fractures are common, particularlyat the spine, but also at other sites. The overestimate of the first fracture ratesfrom unadjusted data on incidence varies from 0% to 58% in studies for themajor osteoporotic fractures, depending on site and age (20) (Table 6.7).
Table 6.7 Overestimation (%) of first fracture at the sites shown from incidence estimates in Sweden
Age Spine Forearm Shoulder Hip(years) Men Women Men Women Men Women Men Women
50-59 29 31 7 10 3 2 0 960-69 58 38 16 13 16 55 29 970-79 50 40 33 26 0 4 8 1480-89 38 40 25 29 0 2 19 22
Source: reference 20 (Tables 1 and 2).
Probability also depends upon the risk of death. Where the risk of death ishigh, the probability of fracture will decrease for the same fracture hazard. Acommonly used method for estimating lifetime risk of fracture assumes thatall deaths occur at a given age (21–24). Lifetime risks of hip fracture areunderestimated using this method (25). In Sweden, for example, the averagelifetime risk of hip fracture from the age of 50 years onwards was estimatedat 4.6% and 13.9% in men and women, respectively, assuming that all
155

individuals die at the time of average life expectancy (25). However, theseestimates increased to 8.1% and 19.5%, respectively, using the death hazardfunctions based on current mortality. On the reasonable assumption that lifeexpectancy will continue to improve, as it has done over the past severalcenturies (26), the future burden of fractures will be underestimated evenmore. When the expected future mortality rates were taken into account, thelifetime risk for hip fracture at the age of 50 years in Sweden rose to 11.1%and 22.7% in men and women, respectively (25).
In addition to secular trends in mortality, there is evidence that a seculartrend in hip fracture rates is occurring in many Member States (17). In mostcountries, the age-specific and sex-specific fracture incidence is increasing,though it appears to have levelled off in Sweden, the United Kingdom andthe United States (27–29). Incorporating assumptions concerning thesecular trend in fracture rates has a marked impact on lifetime risks and,hence, on the future burden of fractures in the community. For example, theestimated number of hip fractures in 2050 is expected to be 4.6 millionworldwide assuming no change in the age-specific and sex-specific incidence,but could range between 7.3 and 21.3 million with modest assumptionsconcerning the secular trend (30).
6.3.3 Lifetime risksThe variability in lifetime risks of hip fracture in different Member States isreviewed in section 2. The pattern of risk also varies according to age and thetype of fracture. In general, remaining lifetime risks decrease progressivelywith age, since the death hazard exceeds the fracture hazard (see Table 6.8and Fig. 6.4) (20).
Table 6.8 Remaining lifetime probability of fracture (%) in men and women at the ages shown
Type of fracture At 50 years At 80 years
Men Women Risk ratio Men Women Risk ratio
Forearm 4.6 20.8 4.5 1.6 8.9 5.6Hip 10.7 22.9 2.1 9.1 19.3 2.1Spinea 8.3 15.1 1.8 4.7 8.7 1.9Proximal humerus 4.1 12.9 3.1 2.5 7.7 3.1Any of these 22.4 46.4 2.1 15.3 31.7 2.1
Source: reference 20 (Table 3).aClinical spine fracture.
156

Fig. 6.4 Probability of a first hip fracture in men and women by age
Source: reference 1 (Fig.1).
For hip fracture, for example, lifetime risk remains relatively constant withage up to the age of 80 years. Thereafter, lifetime risk decreases, since the riskof death reaches a much higher level compared to the risk of hip fractureabove this age.
It is important to recognize, however, that the lifetime probability of fractureat a given age may differ in other communities where there are differences incurrent mortality, mortality trends, or the slope of hip fracture incidence withage. Mortality varies widely between countries, as does the slope of the riskof hip fracture with age (31,32).
As would be expected, lifetime probabilities increase with increasing relativerisk of fracture (Tables 6.9) (6).
157

Table 6.9 Lifetime probability of hip fracture in men and women from Sweden according to relative risk(RR) at the ages shown
Age (years)
RR 50 55 60 65 70 75 80 85
Women
1.0 22.7 22.3 21.9 21.5 21.2 20.9 20.0 18.91.5 30.9 30.3 29.9 29.4 29.1 28.7 27.6 26.32.0 37.6 37.0 36.5 36.0 35.6 35.3 34.0 32.62.5 43.2 42.5 42.0 41.5 41.1 40.8 39.5 38.13.0 47.9 47.2 46.6 46.1 45.8 45.5 44.2 42.83.5 51.8 51.1 50.6 50.1 49.8 49.6 48.3 47.04.0 55.2 54.5 54.0 53.5 53.3 53.1 51.9 50.65.0 60.7 60.0 59.6 59.1 59.0 58.9 57.7 56.76.0 64.9 64.3 63.9 63.5 63.5 63.5 62.4 61.5
Men
1.0 11.1 10.6 10.1 9.8 9.6 9.6 10.1 10.71.5 15.7 14.9 14.4 13.9 13.6 13.7 14.4 15.32.0 19.8 18.9 18.2 17.7 17.3 17.4 18.2 19.42.5 23.4 22.4 21.6 21.0 20.6 20.7 21.8 23.13.0 26.7 25.6 24.7 24.1 23.6 23.8 25.0 26.53.5 29.7 28.5 27.6 26.9 26.4 26.6 27.9 29.64.0 32.4 31.1 30.2 29.5 29.0 29.2 30.6 32.55.0 37.2 35.8 34.8 34.0 33.5 33.8 35.4 37.66.0 41.3 39.8 38.7 38.0 37.4 37.8 39.6 42.0
Source: reference 6 (adapted from Tables 1 and 2).Lifetime risk at any age is determined from the competing probabilities of death or hip fracture.
6.3.4 Ten-year fracture probabilityEstimates of lifetime probability of fracture are of value in considering theburden of disease in the community and the likely effects of interventionstrategies on the population. They are less relevant for assessing risk inindividuals in whom treatment might be envisaged. This is becausetreatments today are not given for a lifetime, because of side-effects, lowadherence and cost. In addition, the feasibility of lifelong interventions hasnever been tested using either high-risk or global public health strategies(33,34). Moreover, as noted above, the remaining lifetime risk for manyfractures decreases progressively with age (see Fig. 6.4) but the absolute riskduring the period of treatment (i.e. the short-term risk) increases with age.
Thus, timeframes in excess of 10 years may be misleading for patientsconsidering treatment when the period of greatest fracture risk will occur farin the future after treatment has ceased. Long timeframes also pose problemswhen incorporating risk factors, the predictive value of which may changeover time. For example, theoretical calculations indicate that the long-termpredictive value of BMD for fractures wanes with time because of variationsin rates of bone loss, and this is substantiated by some but not all empiricalobservation (35,36), but the effect is not marked over a 10-year interval (seesection 5). The same may be true for other risk factors for fracture, forexample, the ratio of carboxylated to total serum osteocalcin, the predictivevalue of which decreases progressively with time (37).
158

For these reasons, a shorter timeframe is appropriate for clinical riskassessment. The optimal duration of specific treatments is not well evaluated,but interventions of 3–5 years or so correspond to information available fromrandomized clinical trials and models of the cost–effectiveness of treatment.For a number of treatments, positive effects on BMD appear to persist whentreatment is stopped, and there is some evidence that this may be true also forfracture risk (38–40). A 10-year timeframe accommodates, for example, atreatment for 5 years with an offset of effect over the subsequent 5 years. Itshould be recognized, however, that the risk of a second fracture is muchhigher immediately after the first event, particularly during the first year aftera first fracture (41,42). The risks thereafter decrease though they do notreach that of the general population. Ten-year probabilities willunderestimate, therefore, immediate fracture risk after a first fracture, sincethe risk is integrated over the entire 10-year interval. Against thisbackground, 10-year fracture probabilities have been considered appropriatefor clinical use by the NOF and IOF (4,43).
As in the case of lifetime probabilities, 10-year fracture probabilities demandknowledge of the incidence of a first fracture as well as mortality risks. Thesehave been well characterized for Sweden. In contrast with lifetimeprobability, 10-year probability commonly increases with age in both menand women up to the age of approximately 80 years (Table 6.10) (see Fig.6.4). Thereafter, probabilities decline and approach the lifetime risk at thatage, since in the elderly, the 10-year or 15-year risk is more or less equivalentto the remaining lifetime risk.
Table 6.10 Ten-year risk (%) of an osteoporotic fracture at the sites shown or of the first fracture ofthese sites in the population of Malmo at the ages shown
Forearm Hip Spine Proximal Any of thesehumerus
Age(years) Men Women Men Women Men Women Men Women Men Women
45 1.2 2.5 0.5 0.4 0.8 0.6 0.5 0.8 2.6 3.850 1.2 3.9 0.8 0.6 1.1 1.2 0.5 1.2 3.3 6.055 1.3 4.7 0.8 1.2 1.4 1.7 0.4 1.4 3.9 7.860 1.7 5.6 1.2 2.3 1.7 2.7 0.7 2.3 4.9 10.665 1.5 6.5 2.1 3.9 2.1 4.3 1.3 3.4 5.9 14.370 0.9 7.2 3.4 7.3 3.1 5.9 1.5 4.4 7.6 18.975 1.2 7.6 5.9 11.7 3.8 6.5 1.5 5.0 10.4 22.980 1.4 7.3 7.6 15.5 4.4 6.9 1.9 5.6 13.1 26.585 1.1 6.0 7.1 16.1 4.0 6.8 2.3 6.3 13.1 27.090 0.8 4.3 6.2 12.4 1.4 5.0 2.1 5.8 10.3 21.495 1.3 2.8 5.2 8.0 0.1 2.6 1.3 3.9 8.3 13.9
Source: reference 20 (Table 4).
159

The heterogeneity in lifetime probabilities between countries is also reflectedin 10-year probabilities. Fig. 6.5 shows 10-year probabilities of hip fractureaveraged for men and women in different areas of the world (44).Probabilities are highest in the Nordic countries and vary by more than 10-fold worldwide. This is also true of lifetime probabilities.
Fig. 6.5 Ten-year probability of hip fracture averaged for age (ages 60 and 70 years)
Source: reference 44 (Fig. 1 with updated data).
6.3.5 Integration of 10-year probability with BMDThe 10-year probability of different fractures by age, sex and T-score isshown in Figs 6.6 and 6.7 (45). The hazard function of fracture at the hipand proximal humerus is assumed to increase 2.6-fold for each 1 SD decreasein BMD at the hip. The gradient of risk for forearm fracture is set at 1.4, forvertebral fracture at 1.8, and for any fracture at 1.6. These estimates accordwith the meta-analysis of Marshall et al. (5) rather than the age-specificgradients of risk given in section 5.
160

Fig. 6.6 Ten-year probability (%) of fracture at the sitesa shown in women by T -score and age
Source: reference 45 (Fig. 2).a “Forearm” describes the distal forearm and “shoulder” the proximal humerus.
Fig. 6.7 Ten-year probability (%) of fracture at the sitesa shown in men by T -score and age
Source: reference 45 (Fig. 1).a“Forearm” describes the distal forearm and “shoulder” the proximal humerus.
161

Fracture probabilities increase with decreasing T-score and increasing age,with the exception of forearm fractures in men. Thus, as reviewed in section5, age provides an important independent element of risk not captured byBMD. The effect is particularly marked for hip fracture, because of the steepgradient of risk for hip fractures with decreasing BMD, but a similarphenomenon is observed in both sexes for all fracture types (Table 6.11) (45).
Table 6.11 Ten-year probability of sustaining any osteoporotic fracture (i.e. a hip, forearm, shoulder orclinical vertebral fracture) in men and women, by age and T-score
Age T-score(years) +1 +0.5 0 –0.5 –1.0 –1.5 –2.0 –2.5 –3.0 –4.0
Men45 1.5 1.9 2.3 2.8 3.4 4.2 5.1 6.3 7.7 11.450 1.8 2.2 2.7 3.4 4.2 5.1 6.3 7.7 9.4 14.055 1.9 2.4 3.0 3.7 4.6 5.7 7.0 8.6 10.6 16.060 2.5 3.0 3.6 4.4 5.4 6.5 7.9 9.5 11.5 16.765 3.0 3.6 4.3 5.1 6.2 7.4 8.8 10.4 12.4 17.470 3.4 4.2 5.1 6.1 7.4 9.0 10.9 13.1 15.7 22.475 4.1 5.1 6.3 7.8 9.6 11.8 14.4 17.5 21.2 30.480 5.3 6.4 7.7 9.2 11.1 13.3 15.8 18.7 22.2 30.385 5.3 6.3 7.5 8.8 10.4 12.2 14.3 16.7 19.5 26.1
Women45 1.8 2.3 2.8 3.5 4.3 5.4 6.6 8.1 10.0 15.050 2.4 3.0 3.8 4.7 5.9 7.4 9.2 11.3 14.1 21.355 2.6 3.3 4.1 5.3 6.7 8.5 10.7 13.4 16.8 26.060 3.2 4.1 5.1 6.5 8.2 10.4 13.0 16.2 20.2 30.665 4.0 5.0 6.3 8.0 10.0 12.6 15.6 19.3 23.9 35.570 4.3 5.5 7.1 9.0 11.5 14.6 18.3 22.8 28.4 42.375 4.2 5.4 7.0 9.1 11.8 15.2 19.4 24.5 30.8 46.280 4.6 6.0 7.7 9.9 12.7 16.2 20.5 25.6 31.8 46.485 4.5 5.8 7.4 9.4 12.0 15.3 19.1 23.8 29.4 42.7Source: reference 45 (Table 2).
At each threshold of BMD, probabilities are higher in women than in menfor forearm fracture and humeral fractures, but the female to male ratio islower than the sex ratio using average probabilities (see Table 6.10). Thiseffect of reducing the female to male ratio is more marked in the case of hipand spine fracture. For hip fracture, for example, the female to male ratio atthe age of 70 years is 2.1 using average probabilities, but is close to unity(1.02) in 70-year-old men and women at the threshold of osteoporosis (T-score = -2.5) and 0.73 at the threshold of osteopenia (see Figs 6.6 and 6.7).For all fractures, the effect is intermediate, with a sex ratio of 1.7 (womenaged 70 years; T -score = -2.5; see Table 6.11) compared with 2.5 usingaverage probabilities. The lower sex ratios when BMD-specific criteria areused are expected, since the incidence of fracture, particularly hip fracture, atany given BMD is similar in men and women. There are, however, alsochanges in the female to male ratio of probabilities as a function of agebecause of the higher mortality hazard in men.
162

Fracture probabilities in populations below threshold values for osteoporosisand low bone mass are shown in Table 6.12 (45). Probabilities exceeded thoseobserved in men and women at the threshold values for osteoporosis or lowbone mass, since the sample includes individuals not only at, but also belowthe threshold for low bone mass or osteoporosis.
Table 6.12 Ten-year probability of fracture at the sites shown (%) in men and women, by age anddiagnostic category, according to the T-scorea
Any fracturesForearm fracture Hip fracture Spine fracture Shoulder fracture of these
Age(years) Men Women Men Women Men Women Men Women Men Women
<–1 <–2.5 <–1 <–2.5 <–1 <–2.5 <–1 <–2.5 <–1 <–2.5Men45 1.9 2.7 1.2 3.3 1.6 3.0 0.8 1.1 4.7 7.650 1.8 2.5 2.0 5.2 2.2 4.0 0.7 1.0 5.7 9.255 1.9 2.8 1.9 5.2 2.6 4.9 0.6 0.9 6.4 10.460 2.3 3.2 2.6 6.2 3.0 5.1 1.0 1.3 7.6 11.665 2.0 2.7 4.1 8.8 3.5 5.7 1.7 2.3 8.8 13.070 1.2 1.7 6.2 13.7 4.8 8.0 2.0 2.7 10.8 16.275 1.5 2.1 9.5 21.4 5.6 9.7 1.9 2.6 14.1 21.580 1.7 2.3 11.0 21.2 6.0 9.7 2.4 3.1 16.6 23.285 1.3 1.6 9.6 16.9 5.2 7.7 2.8 3.5 16.0 21.4
Women45 3.6 5.2 0.8 2.2 1.1 2.1 1.2 1.7 6.1 9.950 5.1 7.3 1.1 2.9 1.9 3.5 1.6 2.3 8.6 13.955 5.8 8.4 2.0 5.1 2.5 4.6 1.7 2.5 10.3 16.860 6.7 9.3 3.3 7.8 3.6 6.4 2.8 4.0 13.2 20.565 7.5 10.2 5.0 10.9 5.3 9.0 4.0 5.4 16.8 24.970 7.9 10.6 8.3 16.7 6.7 10.9 4.8 6.5 20.7 29.875 8.0 10.4 11.8 21.5 6.9 10.7 5.3 7.0 23.6 32.680 7.6 9.5 14.6 23.8 7.1 10.2 5.7 7.2 26.6 34.485 6.1 7.4 14.7 21.9 6.9 9.4 6.4 7.8 26.7 33.1
Source: reference 45 (Table 3).aProbabilities are shown for each age for all individuals below the thresholds for osteopenia andosteoporosis.
6.3.6 Ten-year probabilities and relative riskWith progressive increases in relative risk in individuals because of thepresence of risk factors, the absolute fracture risk increases at any given age.For most fractures, however, the probability decreases in the very elderly as aresult of the dominating effect of mortality over the fracture risk. With thecaveat that data are computed for Sweden, 10-year probabilities can becomputed for hip, clinical spine, forearm or shoulder fractures (Figs 6.8 and6.9) or for any one of those fractures (Table 6.13) (46).
163

Table 6.13 Ten-year probability (%) of osteoporotic fracture (clinical spine, forearm, hip or proximalhumerus) in men and women from Sweden according to relative risk (RR) at the ages shown
Age (years)
RR 50 55 60 65 70 75 80 85
Men1 3.3 3.6 4.7 5.5 7.0 9.9 12.6 11.42 6.5 7.2 9.1 10.7 13.5 18.7 23.1 21.13 9.6 10.5 13.3 15.5 19.4 26.4 31.9 29.44 12.6 13.8 17.3 20.1 24.9 33.2 39.3 36.55 15.5 16.9 21.1 24.4 30.0 39.2 45.5 42.66 18.3 19.9 24.8 28.5 34.6 44.5 50.8 47.8
Women1 5.8 7.2 9.6 12.4 16.1 18.7 21.5 20.72 11.3 13.8 18.2 23.3 29.4 33.5 37.4 36.13 16.5 20.0 26.0 32.6 40.4 45.2 49.2 47.64 21.4 25.7 33.1 40.8 49.5 54.6 58.1 56.45 26.0 31.0 39.4 47.9 57.2 62.1 64.8 63.16 30.3 35.9 45.2 54.2 63.5 68.1 70.0 68.3
Source: reference 46 (Table 1).
Fig. 6.8 Ten-year probability (%) of a first fracture at the sites shown in men according to populationrisk ratio (RR), by age
Source: reference 46 (Fig. 1).
164

Fig. 6.9 Ten-year probability (%) of a first fracture at the sites shown in women according topopulation risk ratio (RR), by age
Source: reference 46 (Fig. 1).
From the distribution of 10-year hip fracture probabilities, index countriescan be chosen to examine the effects of variations in relative risk in thatsetting (Table 6.14). The large variation in hip fracture incidence in differentpopulations means that 10-year probability of hip fracture in the generalfemale population of Sweden (RR = 1.0) is substantially higher than that forwomen from Venezuela, who have a relative risk of 4.0.
Table 6.14 Ten-year probability of hip fracture in women according to age and relative risk (RR), in fourindex countries with different absolute risks
Age (years) Age (years)
RR 50 60 70 80 50 60 70 80
Very high risk (Malmo, Sweden) High risk (Edinburgh, Scotland)
1.0 0.6 2.7 10.2 24.6 0.4 1.1 4.9 13.02.0 1.3 5.2 19.3 41.8 0.9 2.2 9.5 23.83.0 1.9 7.8 27.4 53.9 1.3 3.3 13.8 32.64.0 2.6 10.2 34.5 62.5 1.8 4.4 4.4 39.9
Moderate risk (Spain) Low risk (Venezuela)1.0 0.2 0.9 3.1 7.0 0.1 0.4 1.4 3.22.0 0.4 1.9 5.9 12.5 0.2 0.9 2.7 5.83.0 0.7 2.7 8.5 16.7 0.3 1.3 3.9 7.74.0 0.9 3.6 10.8 20.1 0.4 1.7 5.0 9.3
Source: unpublished data and reference 44 (Table 3).
165

If treatments were given solely on the basis of 10-year probabilities, thenfewer patients would qualify for treatment in countries where the backgroundfracture probability was lower. In practice, there are many factors to considerin determining intervention thresholds, and these are reviewed in section 8.
References
1. Kanis JA et al. Risk of hip fracture according to the World Health Organisationcriteria for osteopenia and osteoporosis. Bone, 2000, 27:585–590.
2. Garnero P et al. Do markers of bone resorption add to bone mineral density andultrasonographic heel measurement for the prediction of hip fracture in elderlywomen? The EPIDOS prospective study. Osteoporosis International, 1998,8:563–569.
3. Johnell O et al. Biochemical indices of bone turnover and the assessment offracture probability. Osteoporosis International, 2002, 13:523–526.
4. Kanis JA et al. A new approach to the development of assessment guidelines forosteoporosis. Osteoporosis International, 2002, 13:527–536.
5. Marshall D, Johnell O, Wedel H. Meta-analysis of how well measures of bonemineral density predict occurence of osteoporotic fractures. British MedicalJournal, 1996, 312:1254–1259.
6. Kanis JA et al. Risk of hip fracture in Sweden according to relative risk: ananalysis applied to the population of Sweden. Osteoporosis International, 2000,11:120–127.
7. De Laet C et al. The impact of the use of multiple risk indicators for fracture oncase-finding strategies: a mathematical approach. Osteoporosis International,2005, 16: 313–318.
8. Kanis JA, Glüer CC for the Committee of Scientific Advisors, InternationalOsteoporosis Foundation. An update on the diagnosis and assessment ofosteoporosis with densitometry. Osteoporosis International, 2000, 11:192–202.
9. Black DM et al. An assessment tool for predicting fracture risk in postmenopausalwomen. Osteoporosis International, 2001, 12:519–528.
10. [Anonymous]. Statin therapy – what now? Drugs and Therapeutic Bulletin, 2001,39:17–21.
11. Wood D et al. Prevention of coronary heart disease in clinical practice:recommendations of the second joint task force of European and other societieson coronary prevention. Atherosclerosis, 1998, 140:199–270.
12. Johannesson M. At what coronary risk level is it cost-effective to initiatecholesterol lowering drug treatment in primary prevention? European HeartJournal, 2001, 22:919–925.
13. Ramsay LE et al. Targeting lipid-lowering drug therapy for primary prevention ofcoronary artery disease: an updated Sheffield table. Lancet, 1996, 348:387–388.
14. Ramsay LE et al. The Sheffield table for primary prevention of coronary heartdisease. Lancet, 1996, 348:1251–1252.
15. Jackson R et al. Management of raised blood pressure in New Zealand: adiscussion document. British Medical Journal, 1993, 307:107–110.
16. Ulrich S et al. What is the optimal age for starting lipid lowering treatment? Amathematical model. British Medical Journal, 2000, 320:1134–1140.
166

17. Assessment of fracture risk and its application to screening for postmenopausalosteoporosis. Geneva, World Health Organization, 1994 (WHO Technical ReportSeries, No. 843).
18. Cooper C, Aihie A. Osteoporosis: recent advances in pathogenesis andtreatment. Quarterly Journal of Medicine, 1994, 87:203–209.
19. Kanis JA et al. The components of excess mortality after hip fracture. Bone, 2003,32:468–473.
20. Kanis JA et al. Long-term risk of osteoporotic fracture in Malmo. OsteoporosisInternational, 2000, 11:669–674.
21. Melton LJ et al. Lifetime fracture risk: an approach to hip fracture risk assessmentbased on bone mineral and age. Journal of Clinical Epidemiology, 1988,41:985–994.
22. Lauritzen JB et al. Changing incidence and residual lifetime risk of commonosteoporosis-related fractures. Osteoporosis International, 1993, 3: 127–132.
23. Jones G et al. Symptomatic fracture incidence in elderly men and women: theDubbo Osteoporosis Epidemiology Study (DOES). Osteoporosis International,1994, 4:277–282.
24. Wasnich RD et al. Osteoporosis: critique and practicum. Honolulu, Hawaii, BanyanPress, 1989.
25. Oden A et al. Lifetime risk of hip fractures is underestimated. OsteoporosisInternational, 1998, 8:599–603.
26. The sex and age distributions of population. The 1994 revision of the United Nationsglobal population estimates and projections. New York, United Nations, 1995.
27. Gullberg B et al. Incidence of hip fractures in Malmo, Sweden (1950-1991). Bone,1993, 14:S23–S29.
28. Spector TD, Cooper C, Lewis AE. Trends in admissions for hip fracture in Englandand Wales, 1968-1985. British Medical Journal, 1990, 300:1173–1174.
29. Melton LJ, O'Fallon WM, Riggs BL. Secular trends in the incidence of hipfractures. Calcified Tissue International, 1987, 41:57–64.
30. Gullberg B, Johnell , Kanis JA. World-wide projections for hip fracture.Osteoporosis International, 1997, 7:407–413.
31. Elffors, L et al. The variable incidence of hip fracture in southern Europe: theMEDOS study. Osteoporosis International, 1994, 4:253–263.
32. Johnell, O et al. The apparent incidence of hip fracture in Europe: a study ofnational register sources. Osteoporosis International, 1992, 2:298–302.
33. Kanis JA et al. Guidelines for diagnosis and management of osteoporosis.Osteoporosis International, 1997, 7:390–406.
34. Osteoporosis: clinical guidelines for prevention and treatment. London, Royal Collegeof Physicians, 1999.
35. Kanis JA et al. Prediction of fracture from low bone mineral densitymeasurements overestimates risk. Bone, 2000, 26:387–391.
36. Olsson JO et al. Does the predictive value for hip fracture of a calcaneal bonemineral measurement change with time [abstract]. Osteoporosis International,2000, 11(Suppl. 2):S103.
37. Luukinen H et al. Strong prediction of fractures amongst older adults by the ratioof carboxylated to total serum osteocalcin. Journal of Bone and Mineral Research,2000, 15:2473–2478.
167

38. Neer RM et al. Effects of parathyroid hormone (1-34) on fractures and bonemineral density in postmenopausal women with osteoporosis. New EnglandJournal of Medicine, 2001, 344:1434–1441.
39. Bagger YZ et al. Two to three years of hormone replacement treatment in healthywomen have long-term preventive effects on bone mass and osteoporoticfractures: the PERF study. Bone, 2004, 34:728–735.
40. Jonsson, B et al. Effect and offset of effect of treatments for hip fracture on healthoutcomes. Osteoporosis International, 1999, 10:193–199.
41. Johnell O et al. Acute and long-term increase in fracture risk after hospitalizationfor vertebral fracture. Osteoporosis International, 2001, 12:207–214.
42. Lindsay R et al. Risk of new vertebral fracture in the year following fracture.Journal of the American Medical Association, 2001, 285:320–323.
43. Kanis JA. Diagnosis of osteoporosis and assessment of fracture risk. Lancet,2002, 359:1929–1936.
44. Kanis JA et al. International variations in hip fracture probabilities: implications forrisk assessment. Journal of Bone and Mineral Research, 2002, 17:1237–1244.
45. Kanis JA et al. Ten year probabilities of osteoporotic fractures according to BMDand diagnostic thresholds. Osteoporosis International, 2001, 12:989–995.
46. Kanis J et al. Ten-year risk of osteoporotic fracture and the effect of risk factorson screening strategies. Bone, 2002, 30:251–258.
7. Assessment tools for case-findingThe aims of clinical risk assessment are to identify patients at particular riskof fracture so that intervention can be considered. Examples include theidentification of women with low BMD and a previous fragility fracture, andthe identification of individuals with certain diseases in whom the risk ofosteoporosis or fracture is high. Conversely, a parallel aim is to avoidunnecessary treatment in individuals at low risk. Since fracture riskprediction will always be imperfect because of the multifactorial causation offracture, the fulfilment of these aims is one of the greatest challenges facingpractitioners.
The approaches most widely considered are population-based screening andopportunistic case-finding. To date, case-finding strategies have focused onthe identification of individuals with low BMD. The integration of riskfactors for fracture permits the development of both screening and case-finding strategies based on the fracture probability of an individual, andthese various options are reviewed in this section.
7.1 Population screeningPopulation screening is the means whereby apparently healthy individuals areselected for intervention according to a “high risk” strategy, i.e. to identifyand treat that part of the population at greatest risk of fracture. It should be
168

distinguished from opportunistic case-finding that is sometimes also termed“screening”. The advantage of population screening is that it is an extensionof the physician–patient relationship in the sense that the intervention isconsidered appropriate by the individuals concerned, and motivation on thepart of patients and physicians is high. Disadvantages, however, include thedifficulties in organization and the expense of screening, as well as the limitedcontribution of treating the high risk subset to disease prevention in thecommunity as a whole. Various criteria for the evaluation of screeningprogrammes have been proposed which differ in their emphasis (1). Onecriterion to justify a screening programme for the population is that thedisease must have been demonstrated to be an important public healthproblem, and this criterion has been met by osteoporosis in Caucasianpopulations (see section 2). The natural history of osteoporosis in the contextof screening should also be delineated. The pattern of change in BMD withage is reasonably understood, and the independent contribution of BMD tofracture risk has also been unequivocally demonstrated. A criticalcomponent is the performance characteristics of the screening test indifferent clinical settings, which is reviewed below.
7.1.1 Screening at the menopauseBecause bone loss in women accelerates at menopause, a readily diagnosableevent, it has been intuitively reasoned that screening should be considered inwomen at the time of menopause. The most obvious candidate is testing byBMD.
There have been several analyses of the potential utility of screening withBMD at the time of the menopause (1–8). These analyses acknowledge thatthe cost of screening itself is not the dominant factor since most treatmentsare relatively more expensive. Opinions vary over the use of BMD as ascreening tool, but most do not recommend widespread or mass screening atthe time of the menopause on the basis of bone density alone (1,2,9–11).The reasons relate to sensitivity and specificity of the measurement whenapplied to the population aged 50 years. The aim of screening is obviously todirect interventions to those most in need, and to avoid treatment of healthyindividuals who will never fracture. Thus, the test should have highspecificity, in the order of 90% or more. It can be calculated that, in order toachieve this kind of specificity, approximately 10% of the postmenopausalpopulation might be selected as a high risk category (12) (Table 7.1). Underthis assumption, however, the sensitivity of the test is low, even with relativelyhigh gradients of risk. Thus, assuming that fracture risk increases 1.5-fold foreach standard deviation decrease in BMD, the sensitivity (or detection rate)is only 18%. In other words, 82% of all fractures would occur in individualsdesignated by the test to be at low risk. Taking a gradient of risk of 2.5 perstandard deviation decrease in BMD (i.e. the prediction of hip fracture fromhip BMD), sensitivity still remains low at approximately 32% (12). Underthe former scenario (gradient of risk = 1.5/SD), 1000 patients would need to
169

be screened to detect 100 for treatment, and the maximal impact on thecommunity after menopause (percentage of fractures saved) would beapproximately 8% (12) (Table 7.2). With a risk gradient of 3.0/SD,approximately 15% of fractures would be averted, assuming 100%compliance and 50% effectiveness over 10 years.
Table 7.1
Estimates of positive predictive value (PPV), sensitivity and specificity of measurements topredict any osteoporotic fracture over 10 years or to death in men and women aged 50 years,according to different population cut-offs to define a high risk category
High risk category (% of population)
0.5 5 10 15 25Gradientof risk PPV Sensitivity Specificity PPV Sensitivity Specificity PPV Sensitivity Specificity PPV Sensitivity Specificity PPV Sensitivity Specificity
(RR/SD) (%) (%) (%) (%) (%) (%) (%) (%) (%) (%) (%) (%) (%) (%) (%)
Men aged 50 years
1.5 10.0 1.5 99.5 7.2 10.9 95.2 6.1 18.2 90.3 5.8 26.3 85.4 5.0 37.8 75.4
2.0 18.7 2.8 99.6 11.1 16.7 95.4 8.7 26.1 90.6 7.9 35.7 85.7 6.4 48.2 75.8
2.5 28.2 4.2 99.6 14.7 22.1 95.6 10.9 32.9 90.8 9.6 43.3 86.0 7.5 55.9 76.1
3.0 37.4 5.6 99.7 17.8 26.7 95.7 12.8 38.3 91.0 10.9 49.1 86.2 8.2 61.3 76.3
4.0 52.3 7.9 99.8 22.5 33.7 96.0 15.3 46.0 91.2 12.6 56.7 86.4 9.0 67.6 76.5
5.0 62.7 9.4 99.8 25.4 38.1 96.1 16.8 50.3 91.4 13.4 60.3 86.6 9.3 69.7 76.5
6.0 69.7 10.5 99.8 27.2 40.8 96.2 17.5 52.4 91.5 13.7 61.6 86.6 9.3 69.6 76.5
Women aged 50 years
1.5 17.3 1.5 99.6 12.7 10.7 95.4 10.7 18.0 90.5 10.3 26.1 85.7 8.9 37.6 75.8
2.0 31.3 2.6 99.6 19.2 16.2 95.7 15.1 25.5 91.0 13.8 35.1 86.3 11.3 47.5 76.4
2.5 45.0 3.8 99.7 24.8 21.0 96.0 18.7 31.6 91.4 16.5 41.9 86.7 12.9 54.5 76.9
3.0 56.7 4.8 99.8 29.4 24.9 96.3 21.5 36.3 91.7 18.5 47.0 87.0 14.0 59.2 77.1
4.0 73.0 6.2 99.9 35.8 30.3 96.6 25.1 42.3 92.0 20.9 52.9 87.4 15.1 63.8 77.4
5.0 82.3 7.0 99.9 39.5 33.4 96.8 26.8 45.3 92.2 21.8 55.2 87.5 15.3 64.7 77.5
6.0 87.8 7.4 99.9 41.5 35.0 96.9 27.5 46.5 92.3 21.9 55.6 87.6 15.1 63.7 77.4
Source: reference 12 (Tables 2 and 3).
RR, relative risk.
170

Table 7.2
Impact of screening women at the age of 65 years according to the target group selectedand the gradient of risk of the test used
Percentage of population targeted
5 10 15 25
Number screened to detect 100 for treatment 2000 1000 667 400
Number of fractures preventeda
RR/SD = 1.5 14 12 12 102.0 20 16 15 133.0 28 22 19 154.0 32 24 21 155.0 34 25 21 156.0 34 25 21 15
Number screened to prevent 1 fracture
RR/SD = 1.5 143 83 56 402.0 100 63 44 313.0 71 45 35 274.0 63 42 32 275.0 59 40 32 276.0 59 40 32 27
Expected number of fractures in
the screened community in 10 yearsb 286 143 95 57
Impact on community (% fractures saved)c
RR/SD = 1.5 4.9 8.4 12.6 17.52.0 7.0 11.2 15.8 22.83.0 9.8 15.4 20.0 26.34.0 11.2 16.8 22.1 26.35.0 11.9 17.5 22.1 26.36.0 11.9 17.5 22.1 26.3
Source: reference 12 (Table 6).
RR, relative risk; PPV, positive predictive value.aAssumes 50% effectiveness of treatment over 10 years (PPV/2).bTen-year fracture probability times the number of women screened.cCalculated from the number of fractures saved and the total expected.
There are also specific problems with the intervention in the context ofscreening at the menopause. Whereas there is good evidence for the efficacyof treatments from randomized controlled studies (13), the continuance withtreatment is low. In the case of hormone replacement treatment, only about10% of women in the United States continue treatment for more than 1 year(14), though it is likely that uptake and continuance can be improved byscreening (15). Thus, the return on investment is correspondingly low.
7.1.2 Screening in later lifeScreening may, however, yield a higher dividend if higher risk individuals canbe selected. There are approaches to this problem that are not mutuallyexclusive. The first is to select individuals much older than the age of 50
171

years, because the risk of fractures rises exponentially with age (16) andolder individuals may be more amenable to treatment. Theoretical analysessuggest that treatments would be given cost-effectively to very elderly peoplewithout a need for screening (17). A potential example is the use of vitaminD in elderly people; it has been estimated that if such a regimen could beshown to prevent 10% of hip fractures, there would be savings to the health-care system in the United Kingdom (18). The second option is to improvethe gradient of risk of the test used for assessment, for example to combinethe information provided by BMD and independent risk factors.
The effect of screening men or women at the age of 65 years is compared withscreening at the age of 50 years in Tables 7.1 and 7.3. The major advantageof screening in later life is to increase the proportion of individuals identifiedwho will sustain fractures and be targeted for treatment. For example, where10% of the female population is designated to be at high risk, the specificityremains high over all ranges of risk assumption (over 90%). The sensitivity,however, varies between 17% and 35%. Sensitivity increases the larger thetargeted population and the higher the gradient of risk assumed. The majoreffect of screening women at the age of 65 years rather than 50 years is in thepositive predictive value (PPV; the proportion of detected individuals whosustain a hip fracture). Assuming a gradient of risk of 1.5/SD and when 10%of the population is to be targeted, the PPV increases from 11% at the age of50 years to 24% at the age of 65 years (12).
172

Table 7.3
Estimates of positive predictive value (PPV), sensitivity and specificity of measurements topredict any osteoporotic fracture over 10 years or to death in men and women aged 65 years,according to different population cut-offs to define a high risk category
High-risk category (% of population)
0.5 5 10 15 25Gradientof risk PPV Sensitivity Specificity PPV Sensitivity Specificity PPV Sensitivity Specificity PPV Sensitivity Specificity PPV Sensitivity Specificity
(RR/SD) (%) (%) (%) (%) (%) (%) (%) (%) (%) (%) (%) (%) (%) (%) (%)
Men aged 65 years
1.5 17.0 1.5 99.6 12.5 10.7 95.4 10.5 18.0 90.5 10.2 26.0 85.7 8.8 37.5 75.8
2.0 30.6 2.6 99.6 18.9 16.1 95.7 14.9 25.4 91.0 13.6 34.9 86.2 11.1 47.4 76.4
2.5 43.8 3.7 99.7 24.4 20.8 96.0 18.4 31.4 91.3 16.3 41.7 86.7 12.7 54.3 76.8
3.0 55.0 4.7 99.8 28.8 24.6 96.2 21.1 36.0 91.6 18.2 46.6 87.0 13.8 58.8 77.1
4.0 70.5 6.0 99.8 35.0 29.9 96.5 24.5 41.9 92.0 20.5 52.4 87.3 14.8 63.3 77.4
5.0 79.4 6.8 99.9 38.5 32.9 96.7 26.2 44.8 92.2 21.3 54.6 87.5 15.0 64.1 77.4
6.0 84.6 7.2 99.9 40.4 34.5 96.8 26.9 45.9 92.2 21.5 55.0 87.5 14.8 63.1 77.4
Women aged 65 years
1.5 37.8 1.3 99.6 28.8 10.2 95.9 24.4 17.3 91.2 23.7 25.3 86.7 20.7 36.7 76.9
2.0 60.2 2.1 99.8 40.8 14.5 96.6 32.9 23.4 92.2 30.7 32.7 87.9 25.3 45.0 78.3
2.5 76.3 2.7 99.9 49.8 17.7 97.1 39.0 27.7 92.9 35.4 37.7 88.7 28.2 50.1 79.1
3.0 86.1 3.1 99.9 56.2 19.9 97.4 43.1 30.6 93.4 38.3 40.8 89.2 29.8 52.9 79.6
4.0 95.3 3.4 100.0 63.5 22.6 97.9 47.5 33.8 93.9 41.2 43.8 89.7 30.9 54.8 79.9
5.0 98.7 3.5 100.0 67.0 23.8 98.1 49.2 34.9 94.1 41.7 44.4 89.8 30.4 54.0 79.8
6.0 100.2 3.6 100.0 68.5 24.3 98.2 49.4 35.1 94.1 41.2 43.8 89.7 29.4 52.1 79.4
Source: reference 12 (Tables 2 and 3).
RR, relative risk.
Population screening in women aged 65 years or more is advocated in NorthAmerica (19–24), but is not recommended in many other parts of the world(3,4,8,9,11,25,26). The conflicting positions arise in part from differingclinical practices and attitudes to prevention (27), the availability of DXAmachines, and willingness to pay for health care (28). In the United States,the gross domestic product (GDP) per capita is US$ 37 000, whereas that ofthe United Kingdom is lower at US$ 25 300. The proportion of GDP spenton health care is 13.9% in the United States and 7.6% in the United Kingdom(29). Willingness to pay is even lower in many other countries (see section 8).Thus, health-care policies need to take account of the local health-carepriorities, which will differ in different regions of the world, not only forreasons of affordability (30), but also because of the large regionaldifferences in fracture risk (see section 2).
As mentioned above, another approach is to select individuals at higher riskthan is possible on the basis of age or BMD alone. The manner in whichBMD can be combined with other risk factors, such as clinical risk factors orbiochemical markers of bone turnover, is reviewed later in this section. Theeffect of using a test with a higher gradient of risk improves PPV and
173

sensitivity without sacrificing specificity (see Tables 7.1 and 7.3). There may,therefore, be a stronger case for screening in later life, depending on the extentto which risk factors add to the value of BMD tests.
7.2 Case-findingBecause of the problems with population screening at the menopause, andbecause screening at later ages has not yet been widely adopted, attention hasturned towards a case-finding strategy (opportunistic screening). In thisscenario, patients who present with clinical risk factors are identified forfurther assessment, most commonly by the measurement of BMD.
A large number of treatment guidelines have been published that follow acase-finding strategy wherein treatment is offered to patients in whom BMDlies below a specific threshold value. This strategy has been widely adopted inmany European countries (11) and other regions of the world. Thoseguidelines that are derived from an evidence base are reviewed below.
7.2.1 Evidence-based guidelines The importance of an evidence-based approach to the management ofdisease has become widely accepted in the past decade (31). Application ofsuch guidelines provides a means by which a high standard of clinical carecan be uniformly practised, and enables the sharing of best practice withinand between countries. Evidence-based guidelines should be rigorous withrespect to their evidence base, objectivity, stakeholder involvement andeditorial independence. Clarity of presentation is also important, withunambiguous, easily identified key recommendations. Implementation tools,such as an executive summary, management algorithms and patientinformation sheet, should be provided. Guidelines should be appropriatelydisseminated to relevant health professionals, and their use audited to defineresulting changes in management. Finally, a mechanism should be in placefor regular updating (32).
In recent years, national evidence-based guidelines for the prevention andtreatment of osteoporosis have been produced by a number of countries,mainly but not exclusively in Europe and North America(4,9,10,19,24,33–50) (Table 7.4). The majority have been produced by expertgroups. Most of these guidelines address the management ofpostmenopausal osteoporosis, although some also include men withosteoporosis; two are devoted to glucocorticoid-induced osteoporosis, andone is restricted to the management of patients with hip fracture. Themajority of guidelines are directed primarily towards pharmacologicalinterventions, for which a substantial evidence base now exists, with lessemphasis on the case-finding strategy itself or the development ofintervention thresholds.
174

Table 7.4
Currently available evidence-based guidelines for the management of osteoporosis
Country Title of guidelines Date
Austria Treatment of postmenopausal osteoporosis (33) 2003
Canada Clinical practice guidelines for the diagnosis and management of osteoporosis in Canada (35) 2002
Denmark Consensus report on osteoporosis (34) 2000
France Indications for the measurement of bone mineral (49) 2000
Germany Prevention, clinical assessment and therapy of 2006 osteoporosis for women after menopause, and for men after age 60 years (36)
Greece Guidelines for diagnosis and management of 2004 osteoporosis (37)
Italy Guidelines for the diagnosis, prevention and treatment of osteoporosis (38) 2006
Lebanon Lebanese guidelines on osteoporosis assessment 2004 and treatment (39)
Netherlands Osteoporosis (24) 2002
Saudi Arabia Guidelines for prevention and management of 2003 osteoporosis in adults
Spain Practice guidelines in postmenopausal osteoporosis (40) 2001
Sweden Diagnosis, prevention and treatment of osteoporosis (4) 2003
Treatment of osteoporosis to prevent fractures (50) 2004
United Kingdom Guidelines on prevention and treatment of osteoporosis (9) 1999/2000
Prevention and treatment of glucocorticoid-induced 2002 osteoporosis (41)
Scotland Prevention and management of hip fracture in 2002 older people (42)
Management of osteoporosis (43) 2003
United States Physician’s guide to prevention and treatment of 2003 osteoporosis (19)
Medical guidelines for the prevention and treatment 2003 of osteoporosis (44)
Screening for osteoporosis in postmenopausal women (46) 2002
Position statements of the International Society for 2004 Clinical Densitometry (47)
Management of postmenopausal osteoporosis (48) 2002/6
Recommendations for the prevention and treatment 2001of glucocorticoid-induced osteoporosis (45)
7.2.2 Approaches to fracture risk assessment Most guidelines advocate a case-finding approach by which individuals areselected for bone densitometry on the basis of risk factors for osteoporosis.An exception to this is the guidelines from North America, whichrecommend bone density measurement in all women aged 65 years and over(19,35). All the guidelines recommend the use of dual energy X-rayabsorptiometry as the method of choice for measurement of BMD for thediagnosis of osteoporosis.
175

Choice of risk factors
There is broad similarity in the risk factors that are identified as indicationsfor further investigation. The risk factors fall into major and additionalcategories. Major risk factors include a personal history of fracture as anadult, history of fragility fracture in a first degree relative, low body weight(e.g. less than 127 lbs, less than 60kg, less than 57kg, or a BMI of less than19 kg/m2), current smoking and the use of oral glucocorticoid therapy formore than 3 months.
The Osteoporosis Society of Canada identifies four key factors – age, lowBMD, prior fragility fracture, and family history of osteoporosis – that standout as predictors of fractures related to osteoporosis (35). They alsorecognize the risk of glucocorticoid therapy. The Canadian group suggestsBMD testing for all women over the age of 65 years, and for women and menover 50 who have at least one major or two minor risk factors. Their listconsists of 11 major factors (including age greater than 65 years), and 10minor ones (see section 4, Table 4.3). Overlap with the National OsteoporosisFoundation list is evident, as are differences. Among major risk factors, forexample, are medical conditions such as hypogonadism, malabsorptionsyndrome, and primary hyperparathyroidism. Listed with the minor risks aresmoking and weight less than 57 kg, factors that are independent predictorsof fracture in a variety of multi-variable models.
The Royal College of Physicians in the United Kingdom recommend a case-finding strategy in which patients are identified because of a fragility fractureor by the presence of strong risk factors (9,10). Included in their risk factorlist are ten items, most, but not all, of which overlap with the NorthAmerican items (Table 7.5). The guidance in the United Kingdom, however,stops short of recommending BMD testing for any group of women on thebasis of age alone. Criteria for bone densitometry in these and otherguidelines are shown in Table 7.6.
176

Table 7.5
Indications provided by the Royal College of Physicians, United Kingdom, for testing bonemineral density
Radiographic evidence of osteopenia or vertebral deformity
Loss of height, thoracic kyphosis (after radiographic conformation of vertebral deformity)
Previous fragility fracture
Prolonged corticosteroid therapy (prednisolone >7.5mg for 6 months or more)a
Premature menopause (age <45 years)
Prolonged secondary amenorrhoea (> 1 year)
Primary hypogonadism
Chronic disorders associated with osteopenia
Maternal history of hip fracture
Low body mass index (< 19kg/m2)
Source: reference 9.a Indication subsequently modified to: any dose of prednisolone by mouth for more than 3 months(40).
Table 7.6
Criteria for bone densitometry in national guidelinesa
Country Reference Criteria for bone densitometry
Austria 33 No specific recommendations
Canada 35 Men and women aged 50 years or more, with 1 major or 2 minor risk factors. Men and women aged over 65 years
Denmark 34 Presence of at least one risk factor
France 49 Presence of risk factors
Germany 36 Women aged 50 years or more (men aged 60 years or more) with a previous vertebral fracture
Women aged 60 years or more (men aged 70 years or more) with risk factors:
- peripheral low trauma fracture
- family history
- BMI<20
- smoking
- falls or immobility
Women aged 70 years or more (men aged 80 years or more) regardless of risk factors
Greece 37 Presence of risk factors
Italy 38 Postmenopausal women above the age of 65 years
Women below 65 years of age or men with risk factors:
- family history of severe osteoporosis
- smoking
- low body weight (BMI<20)
- postmenopausal women with X-ray evidence of osteopenia
- fraglity fracture
- menopause before 47 years of age
- diseases or treatment known to cause osteoporosis
177

Lebanon 39 Postmenopausal women with one or more risk factors
Women aged 65 years or more
Premenopausal women with medical conditions known to be associated with bone loss
Men with one or more strong risk factors
Netherlands 24 Women aged 50 years or more with a previous non-vertebral fracture
Women aged 60 years or more with three risk factors
Women aged 70 years or more with two risk factors
Women with a vertebral fracture, regardless of age
Saudi Arabia Postmenopausal women, particularly those over 60 years of age, or males over 65 years with risk factors or with a fracture index ≥4b (without BMD)
Other disorders associated with osteoporosis
X-ray evidence of osteopenia or vertebral deformity or both, height loss, or thoracic kyphosis
Fragility fracture after age 40 years
Monitoring of treatment
Spain 40 Presence of risk factors
Sweden 4, 50 Presence of risk factors :
Strong risk factors:
- men and women with low-energy trauma
- men and women taking oral glucocorticoids for 3 monthsor more
- five minor risk factors also listed
United Kingdom 9 Men and women aged over 45 years with risk factors
Men and women aged over 45 years with previous fragility fracture
41 Men and women taking oral glucocorticoids for 3 months or more in whom primary prevention has not been initiated
42 No specific recommendations
Scotland 43 Men and women with risk factors
United States 19 Postmenopausal women aged under 65 years if at least one risk factor
Postmenopausal women aged 65 years or more
44 Perimenopausal or postmenopausal women with risk factors
Women aged 40 years or more who have sustained a fracture
Women aged over 65 years
46 Postmenopausal women aged 60 years or more with risk factors
Postmenopausal women aged over 65 years
47 Postmenopausal women aged under 65 years with risk factors
Postmenopausal women aged over 65 years
Men aged 70 years
Adults with a fragility fracture
178

48 Postmenopausal women aged under 65 years with at leastone risk factor (including fracture)
Postmenopausal women aged over 65 years
45 All patients initiating long-term (>6 months) oral glucocorticoid therapy (equivalent 5 mg/d prednisone)
a See Table 7.4 for list of guidelines by country.bThe fracture index is a score based on age, previous fracture, history of maternal hip fracture,weight < 57 kg, current smoker, uses arms to stand from chair and hip BMD T-score (if done).
Criteria for intervention
The majority of guidelines use BMD T-scores determined by DXA as a guideto intervention thresholds (Table 7.7). None of the currently availableguidelines use assessment of fracture probability, although the ScottishIntercollegiate Guidelines Network (SIGN) guidelines on the management ofosteoporosis recommend that 10-year hip fracture probability is documentedon BMD measurement reports, based on age and Z-scores for BMD (42).The guidelines of the National Osteoporosis Foundation use BMDthresholds, but these were based on the assessment of 5-year probabilities inthe resource documentation (51). Some guidelines use selected risk factors inaddition to BMD T-scores, particularly age and previous fragility fracture.Most do not distinguish between BMD-dependent and BMD-independentrisk factors, and few consider potential interactions between risk factors indetermining intervention thresholds. None of the guidelines explicitlyadvocate initiation of therapy after hospitalization for a fragility fracture.
Table 7.7
Criteria for intervention in evidence-based guidelinesa
Country Reference Criteria for intervention
Austria 33 No specific recommendations
Canada 35 Long-term glucocorticoid therapy
Men and women with fragility fracture after age 40 years and T-score <-1.5
Men and women with non-traumatic vertebral compression deformity and T-score <-1.5
Men and women with at least one major or two minor risk factors and T-score <-1.5
Men and women with T-score < -2.5
Denmark 34 T-score ≤-2.5 and at least one risk factor
Fragility fracture (hip or spine).
France 49 No specific recommendations
Germany 36 T-score ≤-2.0 and 10-year fracture probability >30%
Greece 37 Postmenopausal women with multiple vertebral fractures
Postmenopausal women with T-score ≤ -2.5 ± fracture
Elderly men and women with low-energy fracture of the peripheral skeleton
Men with T-score ≤ -2.5 ± fracture
Patients receiving glucocorticoids for more than 3 months
179

Italy 38 Postmenopausal women and men with previous fracture at the hip or spine
Postmenopausal women and men on treatment with prednisone/equivalent > 5 mg daily
Postmenopausal women with T-score < -3.5
Postmenopausal women with T-score < -3 associated with other risk factors:
- early menopause, previous Colles fracture, smoking, rheumatoid arthritis
Lebanon 39 Postmenopausal women with T-score < -2.5
Postmenopausal women with vertebral fractures and low BMD
Postmenopausal women on long-term glucocorticoid therapy + T-score < -1.5
Men with fragility fractures and low BMD
Men aged over 70 years + T-score < -2.5
Men treated with glucocorticoids for 3 months or more with T-score < -1.5
Netherlands 24 Osteoporotic vertebral fracture
T-score < -2.5
Men with vertebral fracture and T-score < -2.5
Patients treated with ≥15 mg/d prednisolone for 3 months or more
Postmenopausal women or men aged over 70 years treated with ≥7.5 mg/d prednisolone (or equivalent) for 3 months or more
Patients treated with <7.5 mg/d prednisolone (or equivalent) for 3 months or more if Z-score < -1 or T-score < -2.5
Saudi Arabia Postmenopausal women with T-score –1 to –2.5 + fracture or > 1 risk factor for fracture or fracture index ≤6
Postmenopausal women with T-score ≤-2.5 + fracture or > 1 strong risk factor for fracture or fracture indexb ≥6
Spain 40 Postmenopausal women with vertebral fracture
Postmenopausal women with T-score < -2.5
Postmenopausal women with non-vertebral fracture and T-score ≤ -2.5
Sweden 4,50 Postmenopausal women with T-score < -2.5
Women with oral glucocorticoid therapy with T-score ≤ -1.0
Postmenopausal women with a previous fracture with T- score ≤ -2.0
United Kingdom 9,41 Postmenopausal women with T-score ≤ -2.5
Postmenopausal women with fragility fracture
Women and men on oral glucocorticoid therapy for 3 months ormore with T-score ≤ -1.5
Men and women aged over 65 years
Men and women with previous fragility facture
42 Not relevant
Scotland 43 Postmenopausal women with more than one vertebral fracture
Postmenopausal women with one vertebral fracture and T-score < -2.5 at femoral neck or < -2 at lumbar spine
180

Postmenopausal women with non-vertebral fracture and T-score <-2.5 at femoral neck or <-2 at lumbar spine
Postmenopausal women with T-score ≤-2.5
Frail elderly women with T-score <-2.5 ± fracture
Men with T-score ≤-2.5 ± fracture
United States 19 Postmenopausal women with vertebral or hip fractures
Postmenopausal women with T-score <–2 or <–1.5 + one or more risk factors
44 Postmenopausal women with low trauma fracture + low BMD
Postmenopausal women with T-score ≤-2.5
Postmenopausal women with T-score ≤-1.5>-2.5 + risk factors
Women in whom non-pharmacological preventive methods are ineffective (bone loss continues or low trauma fractures occur)
46 No specific recommendations
47 No specific recommendations
48 Postmenopausal women with T-score –2 to –2.5 + one risk factor
Postmenopausal women with T-score ≤ -2.5
Women with previous vertebral fracture
45 All individuals starting oral glucocorticoids (equivalent prednisolone 5 mg/d or more) for 3 months or more
All individuals on long-term glucocorticoid therapy (equivalent prednisolone 5 mg/d or more) with T-score <-1
a See Table 7.4 for list of guidelines by country.b The fracture index is a score based on age, previous fracture, history of maternal hip fracture,weight < 57 kg, current smoker, uses arms to stand from chair, and hip BMD T-score (if done).
The BMD threshold at which intervention is recommended varies betweenguidelines. The National Osteoporosis Foundation recommends interventionin postmenopausal women with central DXA T-scores below –2.0 SD in theabsence of risk factors and in women with T-scores below –1.5 SD if one ormore risk factors are present (19). They also suggest consideringpostmenopausal women with prior vertebral or hip fractures as candidatesfor treatment without measurement of BMD. The intervention threshold forBMD recommended by the National Osteoporosis Foundation is lessstringent than that given by other expert groups. For example, the RoyalCollege of Physicians, London (41) recommends treatment whereindividuals have osteoporosis (T-score of less than –2.5 SD).
7.2.3 Economic evaluationThe guidelines of the International Osteoporosis Foundation (then theEuropean Foundation), the National Osteoporosis Foundation, theOsteoporosis Society of Canada and the Royal College of Physicians in theUnited Kingdom all provide economic evaluations (24,41,51,52).
Health economic analyses of the United Kingdom and European guidelinesindicate that treatment can be developed with favourable cost–effectiveness.
181

Typical costs are US$ 2100 per fracture averted for a treatment that costsUS$ 300 per year. Costs compare favourably with the costs of managementof other chronic disorders (41,52). Moreover, the use of BMD assessmentafter pre-selection of patients by the presence of clinical risk factors improvesthe cost benefit, depending on the cost of treatment. For a treatment thatcosts US$ 75 per year and reduces fracture by 50%, skeletal assessment is ofuncertain benefit; whereas BMD assessment saves resources compared withassessment based on risk factors alone, although the amount is small. Thecost–effectiveness becomes more favourable, however, as the cost oftreatment increases. For a treatment that costs US$ 300 per patient per yearand reduces fracture risk by 50% over a 5-year period, the cost per fractureaverted would be US$ 550 by using densitometry as compared to US$ 1800without BMD assessment. Thus, the cost–effectiveness of the case-findingstrategy becomes greater as the costs of the treatment rise (41,52). A majorproblem with the European guidelines is their conservative position. Patientsidentified for treatment require both the presence of a major clinical riskfactor to be eligible for BMD testing, and to be subsequently shown to haveosteoporosis.
The National Osteoporosis Foundation (NOF) has published a detailedhealth economic assessment set within a target of intervening at costs belowUS$ 30 000 per quality of life year saved (51). Unlike the Europeanguidelines (52), the assessment recognized that individuals withcombinations of risk factors might be profitably treated with a less severeBMD threshold than in the absence of clinical risk factors. The NOFsubsequently published a practical guide for physicians based on thepublished resource document (53).
The differences in recommendations between countries (54) indicate theneed to develop cohesive strategies that can be applied worldwide but thattake into account local factors, for example the very different risks that arefound in different countries and the variable ability to pay for assessment andtreatment.
7.2.4 LimitationsSeveral limitations are evident in the approaches used to identify and managepatients with increased fracture risk. The first is the reliance on BMD as thechief arbiter of risk. Current guidelines lean heavily on BMD to guidepharmacological treatment, although thresholds for intervention vary. Theproblem is that BMD thresholds of -2.5 SD or even -2.0 SD fail to identifythe majority of individuals who will experience fractures (54–57).
182

A second limitation in current guidelines lies in the lack of integration of allthe risk factors available to formulate strategy. Each of the guidelinesproposes a list of clinical risk factors that are linked to fractures. Almost 30individual characteristics (e.g. increasing age, body weight, personal or familyhistory of fracture, assorted medical conditions and attendant treatments,and personal behaviours) are identified. The lists overlap to some extent butalso exhibit many differences. The guidelines suggest that various clinical riskfactors carry different weights of importance by designating some major andothers secondary or minor, but they largely fail to specify how these impliedweights can be used to determine fracture risk.
Because risks identified as singly important interact with one another and co-exist in differing combinations, there is a need for methods to determine theircombined effects. A number of investigators have employed multi-variablestatistical techniques to build scoring systems that assess the influence ofeach risk factor while controlling or adjusting for the presence of the others.Factors that are found to contribute independently to risk are weighted byimportance (as determined in the modelling) and allocated points.Individuals are then evaluated and receive a score, based on accumulatedpoints, that predicts their risk. These approaches have been used either for theprediction of osteoporosis or the prediction of fracture.
7.3 Prediction of osteoporosisSeveral studies have integrated the combined effects of risk factors for theprediction of osteoporosis where scores are derived from adjusted odds ratios(53,58–65). The majority combine age and weight, and are summarized inTable 7.8. The most widely tested and the most simple is the osteoporosis self-assessment tool (OST), originally developed for Asians but tested in severaldifferent settings (58,61,66–68). The score is derived from the integer (INT)of age (in years) and the integer of weight (in kg):
OST score = INT ((2 x weight)/10)-INT((2 x age)/10).
A score of –1 or less is indicative of osteoporosis.
Several studies have compared the various osteoporosis risk tools(60,69–78). The tools offer comparable performance characteristics in thatthey have high sensitivity (detection rate) but poor specificity, as shown inTable 7.8. The high sensitivity provides opportunities for cost savings byexcluding patients who do not need a BMD assessment. In one study, it wasestimated that approximately 55% of BMD tests would be saved, comparedwith 100% BMD testing with mass screening (73). The low specificityindicates that BMD tests should be undertaken in people who are categorizeda priori as being at high risk.
183

Table 7.8
Risk assessment tools for the prediction of osteoporosis
Prior Estrogen Sensitivity Specificity AUCAcronym Age Weight fracture status Other (%) (%) (%)
ABONE + + + 83 48 72
DOEScore + + + RA 82 52
HAQ + + Glucorticoids 84 44
NOF + + Family history 96 18 70
ORAI + + + 90 42 64–79
OSIRIS + + + + 78 58 69–82
OST(A) + + 92 39 69–84
POST + + + Family history, 100 29 75–87years sincemenopause
SCORE + + + + RA 91 31 65–79
SOFSURF + + + Smoking 86 36 54–79
AUC, area under the receiver operating characteristics curve; ABONE, age, bone size, no estrogen(62); +, risk factor included; DOEScore, Dubbo osteoporosis epidemiology study score (64); RA,rheumatoid arthritis; HAQ, health assessment questionnaire (specific for patients with rheumatoidarthritis) (63); NOF, National Osteoporosis Foundation (United States) (53); ORAI, osteoporosis riskassessment instrument (60); OSIRIS, osteoporosis risk index (61); OST(A), osteoporosis self-assessment tool (for Asians) (59); POST, postmenopausal osteoporosis screening tool (65);SCORE, simple calculated osteoporosis risk estimation (58); SOFSURF, Study of OsteoporoticFractures simple, useful risk factors system (78).
Few studies are reported in men (61,66,74). The performance characteristicsof OST for the prediction of osteoporosis have been examined in the cohortsused for meta-analyses of risk factors, as described in section 5. Sensitivitywas higher in women, at 83% (95% CI = 81%–84%), than in men, at 58%(53%–64%). Conversely, specificity was higher in men, at 85% (95% CI84%–86%), than in women, at 63% (95% CI = 62%–64%), because of thehigher BMD in men.
There is, however, marked heterogeneity in both sensitivity and specificity.Sensitivity varied in women from 66% to 96%, and in men from 50% to 91%(Table 7.9). Where sensitivity was higher, specificity was lower, reinforcing aview that these instruments require calibration for different geographicsettings (77).
184

Table 7.9
Sensitivity and specificity of osteoporosis self-assessment tool in the prediction ofosteoporosis in population-based cohorts
Sensitivity (%) Specificity (%)
Cohorta Men Women Men Women
EVOS/EPOS 51 66 89 76
CaMos 58 77 91 75
Rotterdam 50 74 85 72
DOES 70 87 81 52
Rochester 55 90 88 78
Hiroshima 91 96 53 27
Sheffield - 96 - 21
aFor cohort descriptions see section 5.
-, no data.
The question arises whether OST might be used for the prediction of fracturerather than the prediction of osteoporosis, and this is discussed below.
7.4 Prediction of fractureOther researchers have targeted fractures as the outcome of importance. Inthese schemes, BMD becomes just one of the predictor variables (55,79).This approach has the dual virtues of using easily obtained clinical riskfactors (e.g. age, sex and weight, and personal fracture history) to estimaterisk before resorting to the added expense of a bone density determination,as well as using all of this information to predict the outcome (fracture) ofclinical importance.
The performance characteristics of OST have been tested in the population-based cohorts reviewed in section 5 that include men as well as women. Ascore for OST <-1 was associated with a significant increase in fracture risk.Risk ratios were higher for hip fracture than for osteoporotic or any fracture,and there were no significant differences between men and women (Table7.10). When OST was considered as a continuous variable, the risk of anyfracture decreased by 3% for each unit increase in OST (95% CI = 2%–4%).For osteoporotic fracture, the decrease was by 4% (95% CI = 3%–6%); for hipfracture, the decrease was by 13% (95% CI = 10%–16%).
185

Table 7.10
Risk ratios for fracture in men and women with a positive or negative test result from theosteoporosis self-assessment tool
Outcome fracture Sex Risk ratio 95% confidence interval
Any fracture Males 1.40 1.15_1.69Females 1.17 1.08_1.28
Combined 1.21 1.12_1.31
Osteoporotic fractures Males 1.41 1.14_1.75Females 1.23 1.11_1.36
Combined 1.26 1.15_1.38
Hip fractures Males 1.54 1.06_2.21Females 1.61 1.27_2.06
Combined 1.59 1.30_1.94
Two large population-based studies, one in Europe and one in NorthAmerica, provide useful illustrations of how variables can be combined toestimate fracture risk. A cohort of over 5000 women and men aged 55 yearsand above from a community in the Netherlands (79) was evaluated from1990 to 1993, and then followed over a four-year period for the occurrence ofhip fracture. Ten factors assessed at entry were associated with subsequenthip fracture. Significant independent contributors to fracture risk includedage, sex, height, use of an aid for walking, and current cigarette smoking. Inaddition, nine categories of BMD were included. A score was devised fromthe estimates of the beta coefficients for these variables. Within the Dutchpopulation on which the scoring system was devised, subjects’ scores rangedfrom 6 to 103, with a median value of 43. Those with a score of less than 50had only a one in 1000 chance of sustaining a hip fracture over a four-yearinterval. This risk increased 100-fold for those with scores of 75 or higher, inwhom the risk of hip fracture was 10%.
In developing their prediction scheme, the investigators also created a set ofscores that excluded bone mineral density. When BMD was excluded, modelvariables remained the same with the addition of weight as an independentcontributor. Performance of the two models (with and without BMD) wassimilar, with an area under the ROC curve of 88%. The model has not beentested prospectively.
Data from the Study of Osteoporotic Fractures, based in the United States,included a subset in which hip DXA measurements were available. Thissubset was used to produce a multi-variable derived prediction model (55).Twenty potential risk factors were included in the modelling, both includingand excluding BMD determinations of the total hip. Like the Dutch models,age, weight and cigarette smoking appeared as independent risk factors, asdid an indicator of physical condition, in this instance “using arms to standfrom a chair” instead of “using a walking aid”. Significant additions to theSOF model were a history of maternal hip fracture after the age of 50 years
186

and a history of a prior fracture in adult life.
Scores derived from the model showed good discrimination for fracture risk.Subjects with scores in the lowest quintile had a five-year risk of hip fractureof 0.6% compared with about a 14-fold increased risk of 8.2% for those withscores in the highest quintile without BMD. The gradient of risk can becomputed at 2.52/SD change in risk score, assuming a normal distribution ofrisk score (Table 7.11). Good separation for those at high and low risk ofvertebral fracture was also demonstrated (Table 7.11). Gradients of risk werelower for non-vertebral fractures, there being about a 3-fold difference in riskbetween the highest and lowest quartile for risk score (gradient of risk = 1.39and 1.51 without or with BMD, respectively). As with the Dutch models,adding BMD values to the models derived from clinical variables aloneimproved performance, although not markedly.
Table 7.11
Five-year fracture risk by quintiles of risk in 9704 women from the United States, accordingto risk score
GradientFracture outcome I II III IV V of riska
Without BMD
Hip 0.6 1.4 2.1 3.2 8.2 2.52
Non-vertebral 10.5 12.5 16.4 18.7 26.1 1.39
Vertebral 1.4 2.9 5.1 7.0 9.9 2.00
With BMD
Hip 0.4 0.9 1.9 3.9 8.7 2.95
Non-vertebral 8.6 13.1 16.5 19.8 27.5 1.51
Vertebral 1.2 2.5 5.3 7.1 11.2 2.21
Source: reference 55 (data taken from Figures 1 and 2).aGradients of fracture risk per SD change in risk score assuming a normal distribution of risk score.
A particular strength of the SOF study is the partial validation of theinstrument in a different population. The scoring system was applied to 6600women aged 75 years and older from five regions in France who wereparticipants in a hip fracture follow-up study (the EPIDOS study). Althoughthis group was on average 10 years older than SOF participants, the models,both with and without BMD, showed good discrimination with 23-fold and6-fold increases in estimated hip fracture risk, respectively, between lowestand highest quintiles, though the absolute risk differed between cohorts (55).
Other studies that have combined risk factors have identified more than 20characteristics that predict increased fracture risk in multivariate models(79–92) (Table 7.12). These include activities of daily living (ADLs),impaired cognition, propensity to fall, poor overall health status, history ofstroke, seizure disorder, and several different medications; BMD has not beenincluded. In four of five of these studies, the risk of fracture has been shownto increase progressively with the number of risk factors. Data from the Duke
187

Established Population for Epidemiologic Studies of the Elderly in theUnited States (88) showed an approximate doubling in relative risk as eachof nine factors was summed, so that the presence of one factor carries a riskof 1.8 and four factors a risk of almost 10. Findings from the GeneralPractice Research Database in the United Kingdom (89) indicated that thepresence of three or more of 11 medical risk factors (diagnoses andmedications) was associated with an 8-fold increase in risk of vertebralfracture and 4.6-fold increase in hip fracture risk when compared to womenwith none of the attributes.
Table 7.12
Studies of risk assessment for the prediction of fractures
Risk factors
Family PriorCohort Site Author Age BMD history fracture Weight Smoking Other
OFELY France Albrand et al. (80) + + +a + Physical exercise, grip strength
SOF USA Black et al. (55) + + +a + + + Ability to stand from chair,
USA Carrol et al. (81) + + + years since menopause
EPESE USA Colon-Emeric, + +b Stroke, cognitive Pieper & Artz (88) impairment
Rosow-Breslau, impairment
EPIDOS France Dargent-Molina et al. (82) + Tandem walk, gait speed,
visual acuity, history of falls
USA Girman et al. (83) + + Height, locomotor status, falls, ADLs, incontinence
OSPRE Finland Honkanen et al. (84) +c +b Dietary calcium, HRT
SOF USA Leslie et al. (85) + + + Health status, hyperparathyroidism,mobility, falls, maximum height, height loss, abilityto stand from chair
MOF UK McGrother et al. (91) + + Kyphosis, poor circulation,corticosteroids, healthstatus, epilepsy
NORA USA Miller et al. (86) + + Health status, mobility
GPRD UK van Staa, Leufkens & Cooper (89) + Disease history, drug history
USA Westfall et al. (87) Glucocorticoids, medical history
Rotterdam Holland Burger et al. (79) + + - - +d + Height, walking aid
GPRDe UK van Staa et al. (90) + - - + +b + Sex, falls, drug and disease history
OFELY, L’os des femmes de Lyon; SOF, Study of Osteoporotic Fractures; EPESE Epidemiologystudy of the elderly; EPIDOS, Epidémiologie de l’osteoporose; OSPRE, Osteoporosis Risk Factorand Prevention Study; MOF, Melton osteoporosis fracture index; NORA, National OsteoporosisRisk Assessment (United States); GPRD, General Practice Research Database (United Kingdom);ADL, activity of daily living; HRT, hormone replacement therapy.
aMaternal history. bBody mass index. cForearm fracture. dWeight excluded with bone mineraldensity in the model. eFor patients on glucocorticoids.
188

A recent study examined the likelihood of fracture in a cohort of more than57 000 women using a regression tree analysis based on peripheraldensitometry, self-rated health status and mobility (86). The test hadmoderate specificity (46%) and sensitivity (77%) but, as expected, the positivepredictive value (the probability that a woman with a positive test woulddevelop a fracture) was low (2.9%) as was the likelihood ratio (1.42), i.e. howmuch more likely was a positive test to be found in a woman with the disease,than in a woman without the disease.
A limitation of many of these studies is that, with the exception of the Studyof Osteoporotic Fractures (55) and one of the general practice researchdatabase studies (90), they have not been tested in other cohorts. Moreover,several are case-control studies, and many of the risk factors used may notidentify a risk amenable to pharmacological intervention. For example, riskfactors for falling may identify a risk that is not responsive to treatment withbone-specific agents (93). This concern is greatest in models that omit BMD(see Table 7.11) because anti-resorptive agents may not be equally effectiveacross the entire range of BMD (94).
7.5 WHO fracture assessment tool (FRAX)The series of meta-analyses reviewed in section 5 identified several clinicalrisk factors that might be used for assessing fracture risk. These includedbody mass index as a continuous variable, as well as dichotomous variablescomprising a parental history of hip fracture, a prior fragility fracture,current smoking, exposure to oral glucocorticoids, rheumatoid arthritis andthe consumption of more than two units of alcohol daily. The risk factors ingeneral had low to moderate heterogeneity between cohorts and fulfilled, inso far as possible, levels of evidence for validity and for identifying “reversiblerisk”, as described in section 5. Each of the risk factors was examined forinteractions with sex, age, BMD and the variable itself. An example of thelatter interaction was the different significance of a unit change in BMI athigh or low values. Before such risk factors can be used for fractureprediction, their independent contribution requires to be assessed. But withthe exception of BMI, all risk factors were associated with fracture riskindependently of BMD.
7.5.1 Approach to model buildingFour models were constructed from the risk factor analysis to computefracture probabilities. These comprised the probability of hip fracture, withand without BMD, and the probability of other osteoporotic fractures, withand without BMD. The two cohorts from Gothenburg were not used in themodels with BMD, since BMD was not measured at the femoral neck inthose studies. For each model, fracture and death as continuous hazardfunctions were computed using a Poisson regression, as described in section6 (95,96). For each risk factor, all significant interactions that were identified
189

by meta-analysis were entered in the model (with age, time, sex and the riskfactor), with and without BMD. Interactions that were significant for hipfracture risk were also entered in the model for other osteoporotic fractures,and also included in the model for death. Where interactions noted in the“mega-analyses” were no longer significant for hip fracture and otherosteoporotic fractures, these were omitted in a stepwise manner by droppingthe interaction with the largest p value. Take, for example, the interaction ofBMD and age for hip fracture risk: hip fracture risk prediction wassignificantly higher with BMD at younger ages and the higher predictivevalues persisted when entered in the model. The respective b functions for theinteraction (BMD ⋅ current age) were retained in both the model for hipfracture and other osteoporotic fracture, though this fell short of significancein the model for other osteoporotic fractures (p=0.074). Conversely, for BMI,a significant interaction was noted with age in the meta-analysis (an increasein risk ratio of BMI for osteoporotic fracture with age), but this was nolonger significant in any model, and the interaction term was dropped fromthe hazard functions for fracture. The other interactions shown in Table 7.13that were retained were: (age ⋅ sex), (BMD ⋅ age); (BMD ⋅ BMD); (priorfracture ⋅ age); (BMI ⋅ BMI); and (age ⋅ age). For the death hazard, allsignificant interactions for fracture risk were included and thereafter omittedif appropriate in a stepwise manner, as described for the fracture hazard.
190

Table 7.13
Significance of interactions with risk factors for hip fracture, any osteoporotic fracture, andosteoporotic fracture excluding hip fracture
BMD Age Variable Sex Time
Hip fractureBMI - - ++ - ++Prior fracture - ++ na - -Age ++ ++ ++ - ++Corticosteroids - - na - -Family history - - na - -Smoking - - na - -Rheumatoid arthritis - - na - -BMD - ++ - - -Alcohol - - na - -
Osteoporotic fractureBMI - ++ - - +Prior fracture - + na - +Age ++ - - ++ -Corticosteroids + + na - -Family history - + na - +Smoking - - na - -Rheumatoid arthritis - - na - -BMD ++ ++ ++ - -Alcohol - - na - +
Osteoporotic fracture without hip fractureBMI - ++ - - -Prior fracture - - na - -Age ++ na - ++ -Corticosteroids - - na - +Family history - ++ na - -Smoking - - na - -Rheumatoid arthritis ++ - na - -BMD ++ ++ ++ - -Alcohol - - na - -
BMD, bone mineral density; BMI, body mass index; -, no effect (p>0.1); +, denotes a trend (p>0.05;p<0.1); ++, a significant interaction (p<0.05); na, not applicable.
Complete information from all cohorts used in the model was available forthe continuous variables (BMI and BMD). Not all cohorts had completeinformation on all the dichotomous risk factors (see section 5). For example,a history of smoking was not available from CaMos and Rochester. Whenone dichotomous variable (e.g. smoking) was deleted from the model, thishad a very minor effect on the b coefficients for the other variables. Sincethese deletions had little or no effect, the original b coefficients were used.
The risk factors used comprise:
• age
• sex
• body mass index
• a prior fragility fracture (including a morphometric vertebral fracture)
191

• parental history of hip fracture
• current tobacco smoking
• ever long-term use of oral glucocorticoids
• daily consumption of alcohol of >2 units
• rheumatoid arthritis.
In addition to rheumatoid arthritis, provision was made for the inclusion ofother secondary causes of osteoporosis. Of the secondary causes ofosteoporosis reviewed in section 4, the following have been consistentlydocumented to be associated with a significant increase in fracture risk:
• untreated hypogonadism in men and women, e.g. bilateral oophorectomy or orchidectomy, anorexia nervosa, chemotherapy for breast cancer, hypopituitarism (97–104);
• inflammatory bowel disease, e.g. Crohn disease and ulcerative colitis (105–107); the risk is in part dependent on the use of glucocorticoids,but an independent risk remains after adjustment for glucocorticoid exposure (108);
• prolonged immobility, e.g. spinal cord injury, Parkinson disease,stroke, muscular dystrophy, ankylosing spondylitis (109–115);
• organ transplantation (41,116–118);
• type I diabetes (119–122);
• thyroid disorders, e.g. untreated hyperthyroidism, over-treated hypothyroidism (123–125).
Whereas there is strong evidence for the association of these disorders withfracture risk, the independence of these risk factors from BMD is uncertain.It was conservatively assumed, therefore, that the fracture risk was mediatedvia low BMD but, in the absence of data on BMD, the risk ratio assumed forthese other secondary causes was similar to that noted in rheumatoidarthritis.
7.5.2 Performance characteristicsThe performance characteristics of the models, given the name of theFRAX™ tool, are shown in Table 7.14 expressed as gradients of risk per SDchange in risk indicator. Note that the category of other osteoporoticfracture excludes hip fracture, whereas hip fracture was included in the meta-analyses in section 5 under the term “any osteoporotic fracture”.
192

Table 7.14
Gradients of risk per SD change in risk score with the use of bone mineral density (BMD),clinical risk factors or BMD and clinical risk factors combined
Gradient of risk
Clinical risk Clinical riskAge BMD only factors alone factors + BMD
Hip fracture
50 3.68 (2.61-5.19) 2.05 (1.58-2.65) 4.23 (3.12-5.73)
60 3.07 (2.42-3.89) 1.95 (1.63-2.33) 3.51 (2.85-4.33)
70 2.78 (2.39-3.23) 1.84 (1.65-2.05) 2.91 (2.56-3.31)
80 2.28 (2.09-2.50) 1.75 (1.62-1.90) 2.42 (2.18-2.69)
90 1.70 (1.50-1.93) 1.66 (1.47-1.87) 2.02 (1.71-2.38)
Other osteoporotic fractures
50 1.19(1.05-1.34) 1.41 (1.28-1.56) 1.44 (1.30-1.59)
60 1.28 (1.18-1.39) 1.48 (1.39-1.58) 1.52 (1.42-1.62)
70 1.39 (1.30-1.48) 1.55 1.48-1.62) 1.61 (1.54-1.68)
80 1.54 (1.44-1.65) 1.63 (1.54-1.72) 1.71 (1.62-1.80)
90 1.56 (1.40-1.75) 1.72 (1.58-1.88) 1.81 (1.67-1.97)
For hip fracture prediction, BMD outperformed the clinical risk factorsalone, but in combination there was an increment in the gradient of risk. Forexample, hip fracture risk increased by 3.68 per SD decrease in femoral neckBMD at the age of 50 years, and by 2.05 with the use of clinical risk factors,but their combined use gave a gradient of risk of 4.23. For the prediction ofother osteoporotic fractures, gradients of risk with BMD were, as expected,lower than for the prediction of hip fracture. Gradients of risk varied from1.26 to 1.52 depending on age and tended to increase with age, in contrast tothe prediction of hip fracture. When clinical risk factors alone were used, thegradient of risk also increased with age and, unlike for hip fractureprediction, the use of clinical risk factors out-performed BMD. As in the caseof hip fracture prediction, however, there was an increment in gradient ofrisk when the clinical risk factors were used in combination with BMD.
The increment in gradient of risk using BMD alone and in conjunction withclinical risk factors is more substantial in the case of hip fracture predictionthan for the prediction of other osteoporotic fractures. It should berecognized, however, that gradients of risk are not multiplicative. Forexample, at the age of 50 years (see Table 7.14) BMD alone gave a gradientof risk of 1.19 for osteoporotic fractures excluding hip fracture. For theclinical risk factors the gradient of risk was 1.41. If these two tests weretotally independent the combined gradient of risk would be √ (1.192 + 1.412)= 1.85. The observed gradient of risk (1.44) falls short of the theoreticalupper limit since there was a significant correlation between the clinical riskfactor score and BMD (r = 0.10). The increment in gradient of risk for hipfracture prediction was larger, but there was also a significant correlationbetween risk factor score using the clinical risk factors and BMD alone (r =0.25).
193

As discussed in section 7.1, increasing gradients of risk improve sensitivityand positive predictive value without markedly affecting specificity. Therelationship between sensitivity and positive predictive value and gradient ofrisk is shown in Fig. 7.1. It is of interest that modest increases in the gradientof risk have a marked impact on both sensitivity and positive predictivevalue, but that the gains are proportionately less above gradients of risk of 3SD or 4/SD. As mentioned in section 6, there is a mathematical relationshipbetween gradient of risk and area under the ROC curve. From Table 7.14, forexample, the gradient of risk of 4.23 is equivalent to an area under the ROCcurve of 84%. At the other extreme, a gradient of risk of 1.44 is equivalent toan area under the ROC curve of 60%. An area equivalent to 50% indicates apredictive value no better than chance.
Fig. 7.1
The effects of different gradients of risk on sensitivity (%) and positive predictive value (%)in women aged 65 years, by the proportion of the population selected
Source: reference 12 (data drawn from Table 3).
7.5.3 CalibrationThe hazard functions of fracture and death are applied to specificpopulations where fracture risks and mortality can be established. Thisassumes that the relative importance of the risk factors and their interactionsare the same as in the original material. Algorithms were developed forregions of the world using epidemiological information for index countries,based on average 10-year hip fracture probability. Regions were categorizedas follows:
(a) very high risk (e.g. Denmark, Iceland, Norway, Sweden, United States);
(b) high risk (e.g. Australia, Canada, China (Province of Taiwan), Finland,Germany, Greece, Hungary, Italy, Kuwait, Netherlands, Portugal,Singapore, Switzerland, United Kingdom);
194

(c) moderate risk (e.g. Argentina, China, France, Hungary, China (Hong Kong Special Administrative Region), Japan, Spain);
(d) low risk (e.g. Cameroon, Chile, Republic of Korea, Turkey,Venezuela).
The italics indicate the index countries used in the calculations. For allcountries, the risk of death was taken from United Nations estimates for1999, except for the United States where the National Vital Statistics reportswere used for 2001 (126). The United Kingdom model used fracture datafrom Singer et al. (127), except for clinical vertebral fracture where incidencewas calculated by assuming that the ratio of clinical vertebral fracture to hipfracture would be similar to that in Sweden (128). For Sweden andCaucasians in the United States, complete information on fracture incidencewas available (129,130).
For Japan, the incidence of forearm and proximal humerus fracture wastaken from Hagino et al. (131). For hip fracture, a nationwide survey for2002 was used (H. Orimo, personal communication, 2005). In the case ofvertebral fractures, the data in the Hiroshima cohort were analysed toprovide the incidence of morphometric vertebral deformities. This gavecomparable estimates with an earlier survey (132). It was assumed that theratio of clinically evident to clinically silent fractures was the same in Japanas in Sweden.
For China, Spain, Turkey and ethnic minorities in the United States, it wasassumed that the ratio of hip fracture to other fracture types was similar tothat observed in Australia, Sweden, the United Kingdom and the UnitedStates. The adequacy of this assumption is discussed in section 2. For Spain,the average incidence of hip fracture from Barcelona (1984), the CanaryIslands (1996), Seville (1989), Madrid (1989) and Zamora (1991) was used asreported by Kanis et al. (133). For China, mean incidence was taken fromtwo surveys in Beijing (1988–1992) and surveys in Sanyang (1994) andTangshan (1994) from the same source (133). For Turkey, the survey inIstanbul was used (1988–1989). For ethnic minorities (black, Asian andHispanic), ratios of hip fracture rates to those of the Caucasian populationwere computed for men and women separately and a mean value used (L.J.Melton, personal communication, 2005). For blacks, the ratios in men andwomen were 0.53 and 0.43, respectively (134–140); for Asians, the respectiverates were 0.64 and 0.50 (135,140,141); and for Hispanics, 0.58 and 0.53(134,135,139,140).
7.5.4 Input and output variablesThe index country is selected from the FRAX tool and individual subjectdetails are input. These comprise age (41 to 87 years), sex, weight (in kg) andheight (in cm). BMI is automatically computed from height and weight
195

(kg/m2). Dichotomized risk variables are then entered:
• a prior fragility fracture including morphometric vertebral fractures (yes/no)
• parental history of hip fracture (yes/no)
• current tobacco smoking (yes/no)
• ever long-term use of oral glucocorticoids (yes/no)
• rheumatoid arthritis (yes/no)
• other causes of secondary osteoporosis (yes/no)
• daily alcohol consumption of >2 units daily (yes/no).
If any of the fields for dichotomous variables is not completed, a negativeresponse is assumed. Fracture probability can then be calculated. The output(without BMD) comprises the 10-year probability of hip, clinical spine,shoulder or wrist fracture and the 10-year probability of hip fracture (Fig.7.2). It should be noted that the probability of all osteoporotic fractures isnot given, but is limited to the major sites of fracture. Inclusion of other sitessuch as the ribs, pelvis and other femoral fractures would increase theprobabilities computed. The omission can be rectified when adequateepidemiological data become available for the index countries.
Fig. 7.2
Screen showing the input and output of the fracture risk assessment model for the UnitedKingdom
196

Femoral neck BMD can additionally be entered either as a Z-score or a T-score. The method of transforming Z-score to T-score is based on theNHANES III reference values as described in section 2. It should be notedthat computation of the T-score (T) from the Z- score (Z) does not assume alinear relationship between the two variables. The relationship derived fromNHANES III is given as
T = c0 + c1 ⋅ Z + c2 ⋅ age + c3 ⋅ Z ⋅ age
The constants ( c0–c3) in women below the age of 55 years are 0.892, 0.984, -0.034 and 0.0007 and in women aged 55 years or more are 1.6617, 1.2658, -0.0480 and -0.0044, respectively.
When entered, calculations give the 10-year probabilities as defined above,with or without the inclusion of BMD.
A special situation pertains to rheumatoid arthritis and other secondarycauses of osteoporosis. As reviewed in section 5, there is good evidence thatrheumatoid arthritis carries a fracture risk over and above that provided byBMD. Whereas this may hold true for other secondary causes ofosteoporosis, the evidence base is weak. From an operational point of view,where the field for rheumatoid arthritis is entered as “yes”, a risk is computedwith and without BMD. If the field for other secondary osteoporosis is alsofilled as “yes”, this does not contribute to the calculation of fractureprobability. Conversely, where the field for rheumatoid arthritis is entered as“no”, and the field for secondary osteoporosis as “yes”, the same b functionsas used for rheumatoid arthritis contribute to the computation of probabilitywhere BMD is not entered. In the presence of BMD, however, no additionalrisk is assumed in the presence of secondary osteoporosis, since itsindependence of BMD is uncertain.
7.5.5 Clinical performance characteristicsClinical risk factors
The effect of a single risk factor is shown by age in Table 7.15, based on theFRAX tool for Sweden. The BMI is held constant at 24 kg/m2. As expected,the 10-year probability of fracture increased with age in the absence of anyclinical risk factors. Between the age of 50 and 80 years, the probability of ahip, spine, shoulder or forearm fracture increased 6-fold. For hip fractureprobability, there was a 33-fold increase between these ages. It should berecognized that the probabilities shown for women without risk factors arelower than the population average, since risk factors are widely prevalent inthe general population. The presence of any single risk factor increasedfracture probabilities. The effect was moderate for smoking and alcohol, andmost marked for glucocorticoid use. Prior fracture was an important riskfactor at younger ages.
197

Table 7.15
Ten-year probability of fracture at the sites shown for a Swedish woman with a body massindex of 24 kg/m2 according to age and the absence or presence of single clinical riskfactorsa
Age Gluco- Prior(years) None Smoking Alcohol RA corticoids FH fracture
Hip, spine, shoulder or forearm
50 4.2 4.5 5.1 5.7 6.9 8.2 9.1
60 7.7 8.4 9.4 10.6 12.7 14.4 15.6
70 14.4 16.4 18.1 20.3 23.5 23.0 26.2
80 25.9 29.1 32.8 36.3 38.2 46.8 39.1
Hip
50 0.4 0.6 0.6 0.7 0.9 0.5 1.6
60 1.3 2.0 2.0 2.3 2.8 1.7 3.8
70 4.7 6.9 7.1 8.2 9.6 9.9 9.8
80 13.1 17.8 19.2 21.8 23.4 37.8 19.6
RA, rheumatoid arthritis; FH, parental family history of hip fracture.aBone mineral density is not included in the model.
The inclusion of more than one risk factor increased fracture probability inan incremental manner. For example, in a woman from Sweden aged 65 yearswith a BMI of 24 kg/m2, the 10-year hip fracture probability in the absenceof clinical risk factors was 2.3%. With one clinical risk factor, the probabilityranged from 3.1% to 5.7%. With two risk factors, the range was 4.6%–12.0%and with 3, 4 and 5 risk factors the ranges were 7.0%–20.1%, 12.0%–29.0%and 23.6%–39.7%, respectively. In the presence of all six clinical risk factors,the 10-year probability of hip fracture was 48.3%. Examples of the use of thenumber of risk factors, rather than using the weight of each risk factor, aregiven later in this section.
Age and BMD
The independent contribution of age is shown in Table 7.16 in men andwomen from Sweden with a fixed BMI of 24 kg/m2 at the threshold forosteoporosis (T-score = -2.5 SD). Fracture probabilities increased withdecreasing T-scores more markedly in women than in men. The effect wasmore marked for hip fracture than for hip, shoulder, spine or forearmfractures combined. Between the ages of 50 to 80 years, 10-year fractureprobability for spine, forearm and humerus increased 2-fold to 3-fold inwomen. The increment was greater for hip fracture.
198

Table 7.16
Ten-year fracture probability (%) in men and women from Sweden with a body mass indexof 24kg/m2, no clinical risk factors and a T-score of -2.5 SD at the femoral neck
Age Men Women(years) Osteoporotica Hip Osteoporotica Hip
50 9.1 4.3 8.2 2.8
55 10.2 4.8 9.8 3.2
60 11.9 5.5 12.5 4.0
65 13.0 6.0 14.9 4.9
70 14.5 7.2 18.2 6.9
75 15.5 8.8 21.3 9.4
80 15.1 8.8 24.1 10.9
85 13.5 7.3 23.6 10.0aHip, shoulder, spine or forearm fracture.
BMI
Increases in BMI were associated with decreasing fracture risks. As expected,low BMI was no longer an important risk factor when BMD was introduced(Table 7.17).
Table 7.17
Effect of variations in body mass index on 10-year fracture probability in women fromSweden aged 65 years
Probability of fracture (%)
BMI Major osteoporotic fracturea Hip fracture
(kg/m2) Without BMD With BMDb Without BMD With BMDb
16 13.4 13.5 6.1 5.4
18 12.4 14.2 4.8 5.5
20 11.5 15.0 3.8 5.7
22 10.9 15.7 3.0 5.8
24 10.3 16.4 2.3 6.0
26 9.8 16.7 2.0 6.0
28 9.3 16.4 1.8 5.8
30 8.8 16.0 1.6 5.6
32 8.3 15.7 1.5 5.5
BMD, bone mineral density.
aClinical spine, hip, forearm or humerus.bProbabilities with BMD are computed at a T-score of –2.7 SD.
There are several interesting comparisons to be made with the use of BMIand BMD for risk assessment. For example, in Swedish women withoutclinical risk factors and a BMI of 20 kg/m2, the 10-year hip fractureprobability ranged from 0.4% at the age of 50 years to 13.3% at the age of 80years (a 33-fold range). The range was nearly as high with a BMI of 40 kg/m2
199

(a 29-fold range). At a T-score of –1 SD, the range was 9-fold (0.4% and 3.6%at the ages of 50 and 80 years, respectively). At lower T-scores the range wasless. With a T-score of –4 SD, the probabilities of hip fracture ranged from19.1% to 31.6% at the ages of 50 and 80 years, respectively. Thus, BMDcaptures age-dependent aspects of risk more completely than BMI. Incontrast, the dynamic range of probabilities is greater with the use of BMDthan with BMI. For example, with no clinical risk factors, hip fractureprobabilities more than doubled for each SD decrease in BMD (Table 7.18).In contrast, for BMI the gradient of risk was much lower (given that the SDof BMI is less than 5 kg/m2; see Table 7.17).
Table 7.18
Ten-year fracture probability (%) in men and women from Sweden with a body mass indexof 24 kg/m2 and no clinical risk factors, by age and T-score at the femoral neck
Age (years)
50 60 70 80T-score
(SD) Males Females Males Females Males Females Males Females
Spine, forearm or shoulder fracture
+1 2.9 3.4 3.7 4.9 4.3 6.2 4.8 7.7
0 3.2 3.8 4.3 5.7 5.3 7.7 6.2 10.2
-1 4.3 4.4 5.7 6.8 7.2 9.9 8.3 13.7
-2 6.6 6.4 9.0 9.8 11.3 14.2 12.3 19.4
-3 13.1 11.2 16.2 16.4 18.7 23.7 18.5 30.5
-4 31.2 25.3 32.1 31.1 31.5 41.1 27.5 47.1
Hip fracture
+1 0.1 <0.1 0.1 0.1 0.4 0.3 1.2 0.8
0 0.2 0.1 0.4 0.2 0.9 0.7 2.1 1.8
-1 0.6 0.4 1.1 0.7 2.1 1.6 3.6 3.7
-2 2.3 1.4 3.2 2.3 4.9 4.2 6.5 7.5
-3 8.0 5.4 9.3 7.1 11.0 11.2 11.7 15.9
-4 26.3 19.1 25.0 21.1 23.5 27.5 20.1 31.7
Sex
Probabilities were comparable in men and women for any given T-scoreexcept at the extremes of age and T-score (see Table 7.18). At low T-scores,probabilities were somewhat higher in men than in women at the youngerages. In elderly people, fracture probabilities were higher in women than inmen (because of the longer survival in elderly women).
Geographic region
The 10-year probabilities of hip, spine, forearm and clinical vertebral fractureare shown for several index countries by age in Fig. 7.3. As expected,probabilities were lowest for China and increased progressively for Spain, theUnited Kingdom and Sweden. For any given T-score, probabilities varied by
200

region in a similar fashion. As expected, regional variations were marked. Forexample, women aged 65 years with a T-score of –4 SD from China had alower probability of osteoporotic fracture than women of the same age fromSweden but with a T-score of –2.5 SD (10.9% versus 12.0%, respectively; Fig.7.4).
Fig. 7.3
Ten-year probability (%) of hip, forearm, humeral or clinical spine fracture in womenaccording to age and index countrya
aData shown for a BMI of 25 kg/m2, in the absence of clinical risk factors or a measurement of BMD.
Fig. 7.4
Ten-year probability (%) of hip, forearm, proximal humeral or clinical spine fracture in womenaged 65 years, according to index country and femoral neck T-scorea
aData shown for women without clinical risk factors and a BMI of 25 kg/m2.
201

Other risk factors
For reasons discussed in section 5, it has not been possible to integrate allpotentially important risk factors into the FRAX algorithms. Candidatesinclude the biochemical markers of bone turnover, genetic phenotypes, and awide range of measurements of bone mineral at various sites and usingdifferent techniques. The performance characteristics of the latter arecommonly given as gradients of fracture risk/SD change in BMD, whereasthe others are usually reported as risk ratios. Using tables given as annexes,gradients of risk (Annex 1) or risk ratios (Annex 2) can be converted tofracture probabilities based on the epidemiology of the United Kingdom. Anexample is provided with BMD at the lumbar spine. Meta-analysis indicatesthat the risk of osteoporotic fracture is increased 1.5-fold for each SDdecrease in BMD (2). Reference to Annex 1, Table A1.1 gives 10-year fractureprobabilities for the United Kingdom according to Z-score and gradient ofrisk. For a man aged 65 years and a Z-score of -2 SD, the 10-year hip fractureprobability is 3.9% (see Table A1.1); for a woman it is 7.4% (see Table A1.2).
7.5.6 Simplification of the modelThe most sophisticated model (the FRAX tool) has the feasibility toincorporate up to six clinical risk factors, any variation in BMI and to includeor exclude BMD at the femoral neck, input either as a T-score or a Z-score.This, however, demands access to computer facilities to carry out thecalculations, available at www.shef.ac.uk/FRAX . But there is scope forsimplified “paper versions” of the model, also available at the web site above.
Use of all risk factors
As shown in Table 7.19, stratification can be approached using all clinical riskfactors by computing the risk for all combinations (26 combinations). In theexample provided, any single risk factor gave a 10-year hip fractureprobability that ranged from 3.1% to 5.7%. For any two risk factors, therange of probabilities was from 4.6% to 12.0%, and the range of probabilitiesincreases progressively with the number of clinical risk factors. A simplifiedtool, therefore, will integrate these probabilities, but it also needs to takeaccount of BMD or (in the absence of BMD) of BMI. Annex tables show therelationship between BMD (Annex 3) or BMI (Annex 4) and the number ofclinical risk factors, for men and women from the United Kingdom.
202

Table 7.19
Ten-year fracture probability according to the number of clinical risk factors (CRFs) presentin women from Sweden aged 65 years with a body mass index of 24 kg/m2 in the absence ofa bone mineral density test
10-year fracture probability (%)
Hip fracture Osteoporotic fracturea
Number ofCRFs Average Range Average Range
0 2.3 - 10.3 -
1 4.2 3.1_5.7 15.8 11.5_20.1
2 7.3 4.6_12.0 23.4 14.5_34.0
3 12.4 7.0_20.1 33.7 20.7_50.2
4 20.4 12.0_29.0 46.6 33.3_62.7
5 32.2 23.6_39.7 61.5 50.5_71.3
6 48.3 - 76.2 -aHip, forearm, shoulder or clinical spine fracture.
-, no range.
Fig. 7.5 shows the mean probabilities for any osteoporotic fracture togetherwith the range according to the number of clinical risk factors at two levelsof BMI for women aged 65 years from the United Kingdom. The range ofprobabilities is, as expected, higher with lower values of BMI. The dispersionaround the mean is not an error bar in the traditional sense. Rather, it reflectsthe range of probabilities arising because the weight of each of the riskfactors varies. The computed probabilities for hip fracture or any majorosteoporotic fracture for men and for women at different levels of BMI isgiven in section 9 for men and women from the United Kingdom.
Fig. 7.5
Ten-year fracture probability of spine, hip, forearm and proximal humerus (%),by the numberof clinical risk factors present in women from the United Kingdom aged 65 years: mean andrange of probabilities are given at two levels of body mass index (BMI)
203

Selective use of risk factors
More limited numbers of risk factors can readily be used in a paper versionof the prediction algorithm. An example is given in Fig. 7.6 for women fromthe United Kingdom according to age, T-score and selected risk factors. Theclinical scenarios are: no risk factors; a prior fragility fracture; the use of oralglucocorticoids; and the combination of glucocorticoids and fracture. Suchcharts may be of value to rheumatologists. In many regions of the world,orthopaedic surgeons have little access to BMD, and a paper versioncombining BMI, fracture history and glucocorticoid use may be appropriate.An example based on the United Kingdom is shown in Table 7.20.
Table 7.20
Ten-year probability of a major osteoporotic fracture (hip, spine, forearm or humeral fracture)in men and women from the United Kingdom, by age, body mass index (BMI) and clinical riskfactors in the absence of a bone mineral density test
Men WomenBMI BMI
Age(years) 15 20 25 30 35 15 20 25 30 35
No risk factors
50 2.8 2.8 2.7 2.4 2.1 3.9 3.6 3.4 3.0 2.6
60 4.2 4.0 3.9 3.4 2.9 7.4 6.5 6.0 5.2 4.6
70 6.0 5.8 5.6 4.8 4.1 14 12 11 9.5 8.2
80 7.8 7.4 7.2 5.9 4.8 22 19 17 15 12
Prior fracture
50 6.5 6.0 5.8 5.1 4.4 9.1 7.9 7.3 6.4 5.6
60 9.2 8.4 7.9 6.8 5.9 16 14 12 11 9.2
70 12 11 11 9.1 7.7 26 22 20 18 15
80 12 12 12 9.8 8.1 32 30 28 24 20
Prior fracture and glucocorticoid use
50 11 9.8 9.3 8.1 7.1 15 13 12 10 9.1
60 14 13 12 11 9.2 26 22 20 17 15
70 16 16 16 13 11 39 34 31 27 24
80 16 16 16 13 11 42 40 39 34 29
204

Fig. 7.6
Stratification of hip fracture risk by age and T-score in men and women from the UnitedKingdoma
aBMI is set at 24 kg/m2.
When more clinical risk factors are used, paper versions become morecumbersome because of the large number of possible combinations, but upto four clinical risk factors can easily be used when intervention thresholds(i.e. the fracture probability above which intervention should be undertaken)are determined. Intervention thresholds are discussed in section 8.
7.6 External validationThe performance characteristics of the assessment tool were evaluated ineleven independent cohorts that did not participate in the model synthesis.These comprised the Epidémiologie de l’osteoporose (EPIDOS) study inFrance (142), the Study of Osteoporotic Fractures (SOF) in the UnitedStates (143), two cohorts from the Geelong study in Australia (144,145), theOsteoporosis Ultrasound Study (OPUS) study drawn from five Europeancountries (146), the Prospective Epidemiological Risk Factors Study(PERF) from Denmark (147), the York cohort in the United Kingdom(148), the Health Improvement Network (THIN) research database from theUnited Kingdom (149), the Swiss Evaluation of Measurement ofOsteoporotic Fracture Risk (SEMOF) study in Switzerland (150), theWomen’s Health Initiative (WHI) from the United States (151,152) and theMiyama cohort from Japan (153). The characteristics of the cohorts aredescribed in Table 7.21.
205

Table 7.21
Characteristics of the cohorts used for validation of the risk assessment model
Other risk factors assessedSample Follow-up Percentage Mean age Hip osteoporotic Prior Parental
Cohort Source size (p years) female (years) fractures fractures fracture Glucocorticoids history Smoking Alcohol RA
THIN United 135 695 606 822 100 60 1 336 4 802 + + - +a + +Kingdom
SOF USA 5 251 57 388 100 71 523 1 313 + + + + + +
York United 3 409 5 927 100 77 35 195 + + +b + - -Kingdom
Geelong I Australia 1 173 7 315 100 62 32 143 + + + + + +
Geelong II Australia 1 865 -c 100 63 73 443 + + + + + +
OPUS Europe 2 155 4 161 100 67 6 100 + + + + + +
PERF Denmark 5 415 39 096 100 64 58 511 + - - - - -
EPIDOS France 7 435 19 820 100 81 228 642 + + + + + -
Miyama Japan 353 3 173 53 59 7 44 + + - + + +
SEMOF Switzerland 6 721 18 712 100 75 73 581 + + + + + -
WHId USA 61014 439 296 100 66 915 6 250 + + + + + +
TOTALS 230 486 1 201 683 100 63 3 286 15 024
+, data available; -, no data available; RA, rheumatoid arthritis; THIN, The Health ImprovementNetwork (United Kingdom); SOF, Study of Osteoporotic Fractures; OPUS, OsteoporosisUltrasound Study; PERF, Prospective Epidemiological Risk Factors Study; EPIDOS, Epidémiologiede l’osteoporose; SEMOF, Swiss Evaluation of Measurement of Osteoporotic Fracture Risk; WHI,Women’s Health Initiative. aEver smoking.bMaternal family history.cCase control study.dExcludes women on bone-active treatment.
In all, 230 486 individuals were followed for 1.2 million person–years. As seenin Table 7.21, some of the cohorts had incomplete information on the riskfactors assessed in the mega-analysis. Where one or more risk factor wasunavailable, the gradient of risk was still computed from the original modelbut with a b value of zero.
The performance characteristics of the validation cohorts are shown in Table7.22. Since gradients of risk were age-dependent, these were standardized tothe age of 70 years.
206

Table 7.22
Gradient of risk of original and validation cohorts standardized to the age of 70 years (areasunder the receiver operating characteristics curve are shown in parentheses)
Hip fractures Other osteoporotic fractures
Cohort Without BMD With BMD Without BMD With BMD
Geelong I 1.88 (0.67) 1.71 (0.65) 1.34 (0.58) 1.57 (0.63)
Geelong II 1.50 (0.61) 3.40 (0.81) 1.30 (0.57) 1.54 (0.62)
OPUS 2.48 (0.74) 2.09 (0.70) 1.32 (0.58) 1.38 (0.59)
York 2.05 (0.69) - (-) 1.74 (0.65) - (-)
PERF 1.28 (0.57) 2.72 (0.76) 1.14 (0.54) 1.19 (0.55)
SOF 1.58 (0.63) 2.21 (0.71) 1.24 (0.56) 1.31 (0.58)
THIN 1.54 (0.62) - (-) 1.29 (0.57) - (-)
EPIDOS 1.70 (0.65) 2.89 (0.77) 1.41 (0.60) 1.47 (0.61)
Miyama 2.87 (0.77) 3.07 (0.79) 3.50 (0.81) 2.80 (0.77)
SEMOF 1.76 (0.65) 2.18 (0.71) 1.32 (0.58) 1.44 (0.60)
WHI 1.54 (0.62) 1.44 (0.74) 1.26 (0.56) 1.46 (0.60)
Original cohorts 1.84 (0.67) 2.91 (0.78) 1.55 (0.62) 1.61 (0.63)
BMD, bone mineral density; OPUS, Osteoporosis Ultrasound Study; PERF, ProspectiveEpidemiological Risk Factors Study; SOF, Study of Osteoporotic Fractures; THIN, The HealthImprovement Network (United Kingdom); EPIDOS, Epidémiologie de l’osteoporose; SEMOF, SwissEvaluation of Measurement of Osteoporotic Fracture Risk; WHI, Women’s Health Initiative.
In all the validation cohorts, the use of clinical risk factors alone or incombination with BMD gave gradients of fracture risk that differedsignificantly from unity. Thus, the use of clinical risk factors alone providedsome discriminative value in the categorization of fracture risk. With oneexception (the small cohort from Miyama), the addition of BMD improvedthe performance characteristics as judged by the gradient of risk or areaunder the receiver operating characteristics curve.
As found in the source cohorts, the improvement in performancecharacteristics with the addition of BMD to the clinical risk factors was moremarked for hip fracture prediction than for the prediction of otherosteoporotic fractures.
Gradients of risk and area under the ROC curve (AUC) were in generalcomparable to the original cohorts used for model building. For example, forhip fracture prediction without BMD, the mean AUC was 0.66 in thevalidation cohorts compared with 0.67 in the original cohorts. With theaddition of BMD, the mean AUC was 0.74 and 0.78 in the validation andoriginal cohorts, respectively.
In the case of other osteoporotic fractures, the mean AUC was 0.60 in thevalidation cohorts and 0.62 in the original cohorts, excluding BMD. With theaddition of BMD, the average AUC was 0.62 and 0.63, respectively. These
207

data give some credence to the view that the original algorithms may bewidely applicable, though further validation is required in men and in ethnicgroups not covered in these analyses. Despite the general applicability of theassessment tool in different population-based settings, there are severaladditional aspects that would add to its validation (154). These includestudies of the feasibility of implementing an assessment tool, and anevaluation of the risks and benefits, preferably by randomized controlledtrials.
References1. Assessment of fracture risk in screening for osteoporosis. Geneva, World Health
Organization, 1994 (WHO Technical Report Series, No. 843).
2. Marshall DA, Sheldon TA, Jonsson E. Recommendations for the application ofbone density measurement. International Journal of Technology Assessment inHealth Care, 1997, 13:411–419.
3. Pitt FA et al. The costs and benefits of screening for and preventing osteoporosis in TrentRegion: a report of the Trent Regional Osteoporosis Working Party. Sheffield, TrentHealth (United Kingdom), 1990.
4. Swedish Council on Technology Assessment in Health Care (SBU). Bone densitymeasurement: a systematic review. Journal of Internal Medicine, 1997, 241(Suppl.739).
5. Cummings SR, Black D. Should perimenopausal women be screened forosteoporosis? Annals of Internal Medicine, 1986, 104:817–823.
6. Ott S. Should women get screening with bone mass measurements? Annals ofInternal Medicine, 1986, 104:874–876.
7. Melton III LJ, Eddy DM, Johnston Jr CC. Screening for osteoporosis. Annals ofInternal Medicine, 1990, 112:516–528.
8. Kanis JA. Screening for postmenopausal osteoporosis: a review for the Department ofHealth. London, Department of Health, 1992.
9. Osteoporosis: clinical guidelines for prevention and treatment. London, Royal Collegeof Physicians, 1999.
10. Update on pharmacological interventions and an algorithm for management. London,Royal College of Physicians, and Bone and Tooth Society of Great Britain, 2000(www.rcplondon.ac.uk, accessed 14 November 2006).
11. Report on osteoporosis in the European Community. Strasbourg, EuropeanCommunity, 1998.
12. Kanis JA et al. Ten-year risk of osteoporotic fracture and the effects of risk factorson screening strategies. Bone, 2002, 30: 251–258.
13. Prevention and management of osteoporosis. Geneva, World Health Organization,2003 (WHO Technical Report Series, No. 921).
14. Barrett-Connor E et al. Prevention of osteoporotic hip fracture: global versushigh-risk strategies. Osteoporosis International, 1998, 8(Suppl. 1):S2–S7.
15. Torgerson DJ et al. Randomized trial of osteoporosis screening. Archives ofInternal Medicine, 1997, 157:2121–2125.
208

16. Black D. Why elderly women should be screened and treated to preventosteoporosis. American Journal of Medicine, 1995, 98(Suppl. 2A): 67S–75S.
17. Kanis JA et al. Cost-effectiveness of preventing hip fracture in the general femalepopulation. Osteoporosis International, 2001, 12:356–361.
18. Torgerson DJ, Kanis JA. Cost-effectiveness of preventing hip fractures in theelderly population using vitamin D and calcium. Quarterly Journal of Medicine,1995, 88:135–139.
19. National Osteoporosis Foundation (NOF) physician’s guide to prevention andtreatment of osteoporosis. Washington, DC, National Osteoporosis Foundation,2003.
20. US Preventive Services Task Force. Screening for osteoporosis in postmenopausalwomen. Washington, DC, Office of Disease Prevention and Health Promotion,2003.
21. US Preventive Services Task Force. Screening for osteoporosis inpostmenopausal women: recommendations and rationale. Annals of InternalMedicine, 2002, 137:526–528.
22. Lewiecki EM et al. Official position of the International Society for ClinicalDensitometry. Journal of Clinical Endocrinology and Metabolism, 2004,89:3651–3655.
23. Cheung AM et al. Prevention of osteoporosis and osteoporotic fractures inpostmenopausal women: recommendation statement from the Canadian TaskForce on Preventive Health Care. Canadian Medical Association Journal, 2004,170:1–9.
24. Pols HA, Wittenberg J. CBO guideline: osteoporosis. Nederlands Tijdschrift voorGeneeskunde, 2002, 146:1359–1363.
25. Green CJ et al. Bone mineral testing: does the evidence support its selective usein well women. Vancouver, BC, Office of Health Technology Assessment Centrefor Health Services and Policy Research, and University of British Columbia,1997:97.
26. Hailey D et al. INAHTA project on the effectiveness of bone density measurementand associated treatments for prevention of fracture. Alberta, InternationalNetwork of Agencies for Health Technology Assessment, and Alberta HeritageFoundation for Medical Research, Edmonton, 1996.
27. Heath I. Who needs health care – the well or the sick? British Medical Journal,2005, 330:954–956.
28. Kanis JA et al. The perspective of the International Osteoporosis Foundation onthe official positions of the International Society for Clinical Densitometry. Journalof Clinical Densitometry, 2005, 8:145–147.
29. The world health report 2004: changing history. Geneva, World Health Organization,2004.
30. Melton LJ III et al. Osteoporosis and the global competition for health careresources. Journal of Bone and Mineral Research, 2004, 19: 1055–1058.
31. Cluzeau F et al. Development and application of a generic methodology to assessthe quality of clinical guidelines. International Journal for Quality in Healthcare,1999, 11:21–28.
209

32. Appraisal of guidelines for research and evaluation. The AGREE collaboration, 2001(www.agreecollaboration.org, accessed 14 November 2006).
33. Dimai HP et al. Leitfaden zur medikamentösen Therapie der postmenopausalenOsteoporose [Treatment of postmenopausal osteoporosis]. Wiener MedzinischeWochenschrift, 2002, 152:596–612.
34. Brixen K. Consensus report on osteoporosis. Ugeskrift for Laeger, 2002, Suppl.10.
35. Brown JP, Josse RJ and the Scientific Advisory Council of the OsteoporosisSociety of Canada. 2002 Clinical practice guidelines for the diagnosis andmanagement of osteoporosis in Canada. Canadian Medical Association Journal,2002, 167(Suppl.):1–22.
36. Prevention, clinical assessment and therapy of osteoporosis for women after menopause,for men after age 60. Dachverbandes der deutschsprachigen osteologischenFachgesellschaften, 2006 (www.lutherhaus.de/dvo-leitlinien, accessed 4December 2006).
37. Kateufunthries gpammes gia th diagnwsh kai antimetwpisnh ths Osteopowshssthn Ellada 2004 [Guidelines for diagnosis and management of osteoporosis inGreece 2004]. Athens, Hellenic Foundation for osteoporosis, 2004.
38. Collegio dei Reumatologi Ospedalieri (CROI), Società Italiana dell’Osteoporosi edelle Malattie del Metabolismo Minerale e Scheletrico (SIOMMMS), SocietàItaliana di Medicina Fisica e Riabilitativa (SIMFER), Società Italiana di MedicinaInterna (SIMI), Società Italiana di Ortopedia e Traumatologia (SIOT), SocietàItaliana di Radiologia Medica (SIRM), Società Italiana di Reumatologia (SIR). Lineeguida per la diagnosi, prevenzione e terapia dell’osteoporosi [Guidelines for thediagnosis, prevention and treatment of osteoporosis] Pavia, SINOSSI. EDIMES,2006.
39. El-Hajj Fuleihan G et al. Lebanese guidelines on osteoporosis assessment andtreatment. Lebanese Medical Journal, 2002, 50:75–125.
40. Sociedad Española de Investigaciones Óseas Y Metabolismo Mineral (SEIOMM)Guía de Práctica: osteoporosis posmenopáusica [Practice guidelines:postmenopausal osteoporosis]. Revista Clinica Española, 2003, 203: 496–506(www.seiomm.org, accessed 14 November 2006).
41. Glucocorticoid-induced osteoporosis: guidelines on prevention and treatment. London,Bone and Tooth Society of Great Britain, National Osteoporosis Society andRoyal College of Physicians, 2002 (www.rcplondon.ac.uk, accessed 15November 2006).
42. Prevention and management of hip fracture in older people. Edinburgh, ScottishIntercollegiate Guidelines Network, 2002 (SIGN Guidelines No. 56)(www.sign.ac.uk, accessed 14 November 2006).
43. Management of osteoporosis. Edinburgh, Scottish Intercollegiate GuidelinesNetwork, 2003 (www.sign.ac.uk, accessed 14 November 2006).
44. American Association of Clinical Endocrinologists medical guidelines for clinicalpractice for the prevention and treatment of postmenopausal osteoporosis.Endocrine Practice, 2003, 9:545–564.
45. American College of Rheumatology ad hoc Committee on Glucocorticoid-induced Osteoporosis. Recommendations for the prevention and treatment ofglucocorticoid-induced osteoporosis: 2001 update. Arthritis and Rheumatism,2001, 44:1496–1503.
210

46. Nelson HD et al. Screening for postmenopausal osteoporosis: a review of theevidence for the U.S. Preventive Services Task Force. Annals of Internal Medicine,2002, 137:529–541 and 526–528.
47. International Society for Clinical Densitometry (ISCD). Official positions. Journal ofClinical Densitometry, 2004, 7:7–12.
48. North American Menopause Society (NAMS) Management of postmenopausalosteoporosis. Menopause, 2002, 9:84–101.Updated Menopause, 2006,13:340–367.
49. Les indications des measures quantitatives du tissu osseux: actualization [Indicationsfor the measurement of bone mineral]. Paris, National Agency for Accreditation andEvaluation in Health Care (ANAES; Agence National d’Accréditation etd’Evaluation en Santé), 2000 (www.anaes.fr, accessed 14 November 2006).
50. Behandling av osteoporos för att förebygga frakturer [Treatment of osteoporosis toprevent fractures: recommendations], Stockholm, Medical Products Agency,2004.
51. National Osteoporosis Foundation. Osteoporosis: cost effectiveness analysis andreview of the evidence for prevention, diagnosis and treatment. OsteoporosisInternational, 1998, 8(Suppl. 4):S1–S88.
52. Kanis JA et al. Guidelines for diagnosis and management of osteoporosis.Osteoporosis International, 1997, 7:390–406.
53. National Osteoporosis Foundation. Physicians guide to prevention and treatmentof osteoporosis. Excerpta Medica, 1998.
54. Kanis JA, Torgerson D, Cooper C. Comparison of the European and US practiceguidelines for osteoporosis. Trends in Endocrinology and Metabolism, 1999,11:28–32.
55. Black DM et al. An assessment tool for predicting fracture risk in postmenopausalwomen. Osteoporosis International, 2001, 12:519–528.
56. Stone KL et al. BMD at multiple sites and risk of fracture of multiple types: long-term results from the Study of Osteoporotic Fractures. Journal of Bone and MineralResearch, 2003, 18: 1947–1954.
57. Siris E et al. Identification and fracture outcomes of undiagnosed low bonemineral density in postmenopausal women: results from the NationalOsteoporosis Risk Assessment. Journal of the American Medical Association, 2001,286:2815–2822.
58. Lydick E et al. Development and validation of a simple questionnaire to facilitateidentification of women likely to have low bone density. American Journal ofManaged Care, 1998, 4:37–48.
59. Koh LK et al. A simple tool to identify Asian women at increased risk ofosteoporosis. Osteoporosis International, 2001, 12:699–705.
60. Cadarette SM et al. Development and validation of the Osteoporosis RiskAssessment Instrument to facilitate selection of women for bone densitometry.Canadian Medical Association Journal, 2000, 162:1289–1294.
61. Ben Sedrine W et al. Development and assessment of the Osteoporosis Index ofRisk (OSIRIS) to facilitate selection of women for bone densitometry.Gynecological Endocrinology, 2002, 16:245–250.
211

62. Weinstein L, Ullery B. Identification of at-risk women for osteoporosis screening.American Journal of Obstetrics and Gynecology, 2000, 183:547–549.
63. Haugeberg G et al. Clinical decision rules in rheumatoid arthritis: do they identifypatients at high risk for osteoporosis? Testing clinical criteria in a populationbased cohort of patients with rheumatoid arthritis recruited from the OsloRheumatoid Arthritis Register. Annals of the Rheumatic Diseases, 2002,61:1085–1089.
64. Nguyen TV et al. Limited utility of clinical indices for the prediction ofsymptomatic fracture risk in postmenopausal women. Osteoporosis International,2004, 15:49–55.
65. Sirola J et al. Risk factors associated with peri- and postmenopausal bone loss:does HRT prevent weight loss-related bone loss? Osteoporosis International, 2003,14:27–33.
66. Adler RA, Tran MT, Petkov VI. Performance of the Osteoporosis Self-assessmentScreening Tool for osteoporosis in American men. Mayo Clinic Proceedings, 2003,78:723–727.
67. Kung AWC et al. Comparison of a simple clinical risk index and quantitative boneultrasound for identifying women at increased risk of osteoporosis. OsteoporosisInternational, 2003, 14:716–21.
68. Ben Sedrine W et al. Interest of a pre-screening questionnaire to reduce the costof bone densitometry. Osteoporosis International, 2002, 13:434–442.
69. Cadarette SM, Jaglal SB, Murray TM. Validation of the Simple CalculatedOsteoporosis Risk Estimation (SCORE) for patient selection for bonedensitometry. Osteoporosis International, 1999, 10:85–90.
70. Cadarette SM et al. Evaluation of decision rules for referring women for bonedensitometry by dual-energy x-ray absorptiometry. Journal of the AmericanMedical Association, 2001, 286:57–63.
71. Cadarette SM et al. The validity of decision rules for selecting women withprimary osteoporosis for bone mineral density testing. Osteoporosis International,2003, 15:361–366.
72. Fujiwara S et al. Performance of osteoporosis risk indices in a Japanesepopulation. Current Therapeutic Research Clinical and Experimental, 2001,62:586–594.
73. Geusens P et al. Performance of risk indices for identifying low bone density inpostmenopausal women. Mayo Clinical Proceedings, 2002, 77:629–637.
74. Broussard DL, Magnus JH. Risk assessment and screening for low bone mineraldensity in a multi-ethnic population of women and men: does one approach fitall? Osteoporosis International, 2004, 15:349–360.
75. Richy F et al. Validation and comparative evaluation of the osteoporosis self-assessment tool (OST) in a Caucasian population from Belgium. Quarterly Journalof Medicine, 2004, 97:39–46.
76. Mauck K et al. Use of clinical prediction rules in detecting osteoporosis in apopulation-based sample of postmenopausal women. Archives of InternalMedicine, 2005, 165:530–536.
212

77. Von Muhlen D et al. Evaluation of the simple calculated osteoporosis riskestimation (SCORE) in older Caucasian women: the Rancho Bernardo Study.Osteoporosis International, 1999, 10:79–84.
78. Black DM et al. SOFSURF: a simple, useful risk factors system can identify thelarge majority of women with osteoporosis. Bone, 1998, 23(Suppl.):S605.
79. Burger H et al. Added value of bone mineral density in hip fracture risk scores.Bone, 1999, 25:369–374.
80. Albrand G et al. Independent predictors of all osteoporosis-related fractures inhealthy postmenopausal women: the OFELY Study. Bone, 2001, 32:78–85.
81. Carroll J et al. Modelling fracture risk using bone density, age, and years sincemenopause. American Journal of Preventive Medicine, 1997, 13:447–452.
82. Dargent-Molina P et al. Use of clinical risk factors in elderly women with low bonemineral density to identify women at higher risk of hip fracture: the EPIDOSprospective study. Osteoporosis International, 2002, 13:593–599.
83. Girman CJ et al. Prediction of fracture in nursing home residents. Journal of theAmerican Geriatrics Society, 2002, 50:1341–1347.
84. Honkanen RJ et al. Risk factors for perimenopausal distal forearm fracture.Osteoporosis International, 2000, 11:265–270.
85. Leslie WD et al. Bone mineral density testing in healthy postmenopausal women:the role of clinical risk factor assessment in determining fracture risk. Journal ofClinical Densitometry, 2002, 5:117–130.
86. Miller PD et al. An approach to identifying osteopenic women at increased short-term risk of fracture. Archives of Internal Medicine, 2004, 164:1113–1120.
87. Westfall G et al. Methodology for identifying patients at high risk for osteoporoticfracture. Clinical Therapeutics, 2001, 23:1570–1588.
88. Colón-Emeric CS, Pieper CF, Artz MB. Can historical and functional risk factorsbe used to predict fractures in community-dwelling older adults? Developmentand validation of a clinical tool. Osteoporosis International, 2002, 13:955–961.
89. van Staa T-P, Leufkens H-GM, Cooper C. Utility of medical and drug history infracture risk prediction among men and women. Bone, 2002, 31:508–514.
90. van Staa T-P et al. A simple score for estimating the long-term risk of fracture inpatients using oral glucocorticoids. Quarterly Journal of Medicine, 2005,98:191–198.
91. McGrother CW et al. Evaluation of a hip fracture risk score for assessing elderlywomen: the Melton Osteoporotic Fracture (MOF) study. Osteoporosis International,2002, 13:89–96.
92. Walter LC et al. Risk of hip fracture in disabled community-living older adults.Journal of the American Geriatric Society, 2003, 51:50–55.
93. McClung MR et al. Effect of risedronate on the risk of hip fracture in elderlywomen: Hip Intervention Program Study Group. New England Journal of Medicine,2001, 344:333–340.
94. Cummings SR et al. Effect of alendronate on risk of fracture in women with lowbone density but without vertebral fractures: results from the FractureIntervention Trial. Journal of the American Medical Association, 1998,280:2077–2082.
213

95. Breslow NE, Day NE. Statistical methods in cancer research. Vol. 2. The design andanalysis of cohort studies. Lyon, IARC, 1987:131–135 (IARC Scientific PublicationsNo. 82).
96. Oden A et al. Lifetime risk of hip fracture is underestimated. OsteoporosisInternational, 1998, 8:599–603.
97. Tuppurainen M et al. Risks of perimenopausal fractures: a prospectivepopulation-based study. Acta Obstetrica Gynecologica Scandinavica, 1995,74:624–628.
98. Kanis JA et al. A high incidence of vertebral fracture in women with breast cancer.British Journal of Cancer, 1999, 79:1179–1181.
99. Melton LJ III et al. Fracture risk after bilateral oophorectomy in elderly women.Journal of Bone and Mineral Research, 2003, 18:900–905.
100. Melton LJ III et al. Fracture risk following bilateral orchidectomy. Journal ofUrology, 2003, 169:1747–1750.
101. Stanley I II et al. Does hypogonadism contribute to the occurrence of a minimaltrauma hip fracture in elderly men? Journal American Geriatric Society, 1991,39:766–771.
102. Wuster C et al. The influence of growth hormone deficiency, growth hormonereplacement therapy, and other aspects of hypopituitarism on fracture rate andbone mineral density. Journal of Bone and Mineral Research, 2001, 16:398–405.
103. Rigotti NA et al. The clinical course of osteoporosis in anorexia nervosa: alongitudinal study of cortical bone mass. Journal of the American MedicalAssociation, 1991, 265:1133–1138.
104. Gillberg C, Rastam M, Gillberg IC. Anorexia nervosa: physical health andneurodevelopment at 16 and 21 years. Developmental Medicine and ChildNeurology, 1994, 36:567–575.
105. Vestergaard P, Mosekilde L. Fracture risk in patients with celiac disease, Crohn’sdisease, and ulcerative colitis: a nationwide follow-up study of 16,416 patients inDenmark. American Journal of Epidemiology, 2002, 156:1–10.
106. Bernstein CN et al. The incidence of fracture among patients with inflammatorybowel disease: a population-based cohort study. Annals of Internal Medicine,2000, 133:795–799.
107. Loftus EV et al. Long-term fracture risk in patients with Crohn’s disease: apopulation-based study in Olmsted County, Minnesota. Gastroenterology, 2000,123:468–475.
108. Van Staa T-P et al. Inflammatory bowel disease and the risk of fracture.Gastroenterology, 2003, 125:1591–1597.
109. Vestergaard P et al. Fracture rates and risk factors for fractures in patients withspinal cord injury. Spinal Cord, 1998, 36:790–796.
110. Johnell O et al. Fracture risk in patients with Parkinsonism: a population-basedstudy in Olmsted County, Minnesota. Age and Ageing, 1992, 21:32–38.
111. Dennis MS et al. Fractures after stroke: frequency, types and associations. Stroke,2002, 33:728–734.
112. Kanis JA, Oden A, Johnell O. Acute and long-term increase in fracture risk afterhospitalisation for stroke. Stroke, 2001, 32:702–706.
214

113. Vestergaard P et al. Fracture risk in patients with muscular dystrophy and spinalmuscular atrophy. Journal of Rehabilitation Medicine, 2001, 33:150–155.
114. Donnelly S et al. Bone mineral density and vertebral compression fracture ratesin ankylosing spondylitis. Annals of Rheumatic Disease, 1994, 53:117–121.
115. Pluijm SMF et al. Ultrasound measurement for the prediction of osteoporoticfractures in elderly people. Osteoporosis International, 1999, 9:550–556.
116. Vautour LM et al. Long-term fracture risk following renal transplantation: apopulation-based study. Osteoporosis International, 2004, 15:160–167.
117. Shane E et al. Bone loss and fracture after lung transplantation. Transplantation,1999, 68:220–227.
118. Ramsey-Goldman R, Dunn JE, Dunlop DD. Increased risk of fracture in patientsreceiving solid organ transplants. Journal of Bone and Mineral Research, 1999,14:456–463.
119. Bone health and osteoporosis: a report of the Surgeon General. Rockville, MD, UnitedStates Department of Health and Human Services, Office of the Surgeon General,2004.
120. Vestergaard P, Rejnmark L, Mosekilde L. Relative fracture risk in patients withdiabetes mellitus, and the impact of insulin and oral antidiabetic medication onrelative fracture risk. Diabetologia, 2005, 48:1292–1299.
121. Nicodemus KK, Folsom AR. Town Women’s Health Study: type 1 and type 2diabetes and incident hip fractures in postmenopausal women. Diabetes Care,2001, 24:1192–1197.
122. Schwartz AV et al. Older women with diabetes have an increased risk of fracture:a prospective study. Journal of Clinical Endocrinology and Metabolism, 2001,86:32–38.
123. Vestergaard P, Mosekilde L. Hyperthyroidism, bone mineral, and fracture risk: ameta-analysis. Thyroid, 2003, 13:585–593.
124. Vestergaard P et al. Fracture risk in patients treated with hyperthyroidism.Thyroid, 2000, 10:341–348.
125. Melton LJ III et al. Fractures following thyroidectomy in women: a population-based cohort study. Bone, 2000, 27:695–700.
126. Arias E et al. Deaths: final data for 2001. National vital statistics reports, Vol. 52, No.3. National Center for Health Statistics. Health, United States, 2000. Hyattsville,Maryland: Public Health Service. 2003.
127. Singer BR et al. Epidemiology of fracture in 1000 adults: the influence of age andgender. Journal of Bone and Joint Surgery, 1998, 80B:234–238.
128. Kanis JA et al. Intervention thresholds for osteoporosis in the UK. Bone, 2005,36:22–32.
129. Kanis JA et al. Long-term risk of osteoporotic fracture in Malmo. OsteoporosisInternational, 2000, 11:669–674.
130. Melton LJ III, Crowson CS, O’Fallon WM. Fracture incidence in Olmsted County,Minnesota: comparison of urban with rural rates and changes in urban rates overtime. Osteoporosis International, 1999, 9:29–37.
131. Hagino H et al. Changing incidences of hip, distal radius and proximal humerusfractures in Tollori Preficture, Japan. Bone, 1999, 24:265–270.
215

132. Fujiwara S et al. The incidence of thoracic vertebral fractures in a Japanesepopulation, Hiroshima and Nagasaki, 1958–1986. Journal of Clinical Epidemiology,1991, 44:1007–1014.
133. Kanis JA et al. International variations in hip fracture probabilities: implications forrisk assessment. Journal of Bone and Mineral Research, 2002, 17:1237–1244.
134. Bauer RL. Ethnic differences in hip fracture: a reduced incidence in MexicanAmericans. American Journal of Epidemiology, 1988, 127:145–149.
135. Silverman SL, Madison RE. Decreased incidence of hip fracture in Hispanics,Asians, and blacks: California hospital discharge data. American Journal of PublicHealth, 1988, 78:1482–1483.
136. Jacobsen SJ et al. Hip fracture incidence among the old and very old: apopulation-based study of 745,435 cases. American Journal of Public Health,1990, 80:871–873.
137. Griffin MR et al. Black-white differences in fracture rates. American Journal ofEpidemiology, 1992, 136:1378–1385.
138. Baron JA et al. Racial differences in fracture risk. Epidemiology, 1994, 5:42–47.
139. Lauderdale DS et al. Hip fracture incidence among elderly Hispanics. AmericanJournal of Public Health, 1998, 88:1245–1247.
140. Zingmond DS, Melton LJ III, Silverman SL. Increasing hip fracture incidence inCalifornia Hispanics, 1983 to 2000. Osteoporosis International, 2004, 15:603–610.
141. Lauderdale DS et al. Hip fracture incidence among elderly Asian-Americanpopulations. American Journal of Epidemiology, 1997, 146:502–509.
142. Schott AM et al. How hip and whole-body bone mineral density predict hipfracture in elderly women: the EPIDOS Prospective Study. OsteoporosisInternational, 1998, 8:247–254.
143. Cummings SR et al. Risk factors for hip fracture in white women: Study ofOsteoporotic Fractures Research Group. New England Journal of Medicine, 1995,332:767–773.
144. Sanders KM et al. The exclusion of high trauma fractures may underestimate theprevalence of bone fragility fractures in the community: the GeelongOsteoporosis Study. Journal of Bone and Mineral Research, 1998, 13:1337–1342.
145. Sanders KM et al. Age- and gender-specific rate of fracture in Australia: apopulation-based study. Osteoporosis International, 1999, 10:240– 247.
146. Gluer CC et al. Association of five quantitative ultrasound devices and bonedensitometry with osteoporotic fractures in a population-based source: theOPUS study. Journal of Bone and Mineral Research, 2004, 19:782–793.
147. Bagger YZ et al. Risk factors for development of osteoporosis and cardiovasculardisease in postmenopausal Danish women: the PERF study. Journal of Bone andMineral Research, 2001, 16:396.
148. Birks YF et al. Randomised controlled trial of hip protectors among women livingin the Community. Osteoporosis International, 2004, 15:701–706.
149. Walley T, Mantgani A. The UK General Practice Research Database. Lancet,350:1097–1099.
150. Krieg MA et al. Rôle des ultrasons osseux pour la prédiction de fracture de la hanchechez la femme âgées 70 ans on plus: résultants de l’étude SEMOF et comparaison avec
216

les données de la littérature [Role of skeletal ultrasound for the prediction of hipfracture in women aged 70 years or more and a comparison with publishedliterature]. Revue Médicale de la Suisse Romande, 2004, 124:59–62.
151. Hayes J et al. The Women’s Health Initiative recruitment methods and results.Annals of Epidemiology, 2003, 13:S18–S77.
152. Anderson GL et al. Implementation of the Women’s Health Initiative study design.Annals of Epidemiology, 2003, 13:S5–S17.
153. Yoshimura N et al. Characteristics and cause of bone mineral densities amongfast bone losers in a rural Japanese community: the Miyama Study. OsteoporosisInternational, 2004, 15:139–144.
154. Gluud C, Gluud LL. Evidence based diagnostics. British Medical Journal, 2005,330:724–726.
8. Intervention thresholdsThe development of assessment algorithms to categorize fracture probabilityis limited if guidance is not given to delineate the probability at whichintervention becomes acceptable. A component of the logic in deriving anintervention threshold relates to the efficacy and side-effects of intervention.An effective treatment with no side-effects can reasonably be given toindividuals with a low probability of fracture, even if efficacy is moderate.The same treatment, but with significant side-effects affecting a substantialproportion of the population exposed, would demand that patients have amuch higher fracture probability so that fewer who would not fracture wouldbe exposed to such treatment. A second consideration is the costs involved,particularly where health-care budgets are restricted. A very expensivetreatment, even if effective, may not be considered worthwhile if the disordertreated is not life-threatening or occasions only minor morbidity. For thisreason, intervention thresholds are usually also based on health economicassessment.
8.1 Types of evaluationA widely used measure is the “number needed to treat” (NNT) to prevent afracture. For example, if a treatment reduces the incidence of vertebralfracture from 10% to 5% during the conduct of a trial, then 5 fractures aresaved for each 100 patients treated, which gives an NNT of 20. There areseveral limitations in the use of NNT. First, it takes no account of the cost ofintervention. Second, its use is only relevant to one population setting. In theexample above, the effectiveness of the intervention is 50%. If the sameefficacy occurs in other populations at different risk, the NNT changes. Thus,if the background fracture risk is say 5% and treatment reduces this by halfthen the NNT = 40. A further feature of the use of NNT is that it takes noaccount of the offset of effect of therapeutic intervention (1).
217

In the context of treatments, the most straightforward pharmacoeconomicevaluation is cost-minimization analysis. This approach can be used whentwo strategies or interventions have identical effects, for example where bothagents decrease fracture rates by a fixed percentage, and neither have adverseeffects. The advantage of one over the other will then relate only todifferences in cost.
In practice, the benefits and risks of different strategies are rarely equal.Cost-effectiveness analyses take this into account. In this approach,outcomes are converted into a common currency. Examples include the costper life-year saved, and the cost per fracture averted. A limitation of thisapproach is that comparisons across diseases are difficult, and difficulties canalso arise within the same disease area. The cost per fracture averted has, forexample, a different significance where the outcome is a hip fracture ratherthan a forearm fracture.
These considerations have led to the use of cost_utility analysis. In thecontext of evaluating treatment strategies, this approach takes account, notonly of fractures avoided, but also of any change in morbidity from bothbeneficial and unwanted effects. Quality-adjusted life years (QALYs) are theaccepted unit of measurement in health economic assessment ofinterventions using cost_utility analysis. In order to estimate QALYs, eachyear of life is valued according to its utility to the patient. Values range from0, the least desirable health state, to 1, perfect health. The decrement in utilityassociated with fractures is the cumulative loss of utility over time. Acomparable approach favoured by WHO is the use of disability-adjusted lifeyears (DALYs). This has been extensively used to characterize the burden ofdisease worldwide (2) and is reviewed in section 2.
8.2 Selection of intervention thresholdsThe intervention threshold can be defined as the level of costs (includingavoided costs from fracture) and effects that an intervention must achieve tobe acceptable to a given health-care system. Both costs and effects dependcritically upon the payer, which may variously be society as a whole (thesocietal perspective), managed health-care systems, hospitals, pharmacies orindividuals. For this reason, several types of costs are used insocioeconomics. Direct costs describe the consumption of resources, whichmay also be applied from a number of perspectives. For example, the directhospital costs will differ from the direct health-care costs, which in turn willdiffer from direct non-medical costs such as transport of patients to and fromhospitals and the costs to the patient of buying medication. Indirect costs arethose associated with the loss of income generation, for example as a resultof the time off work following a fracture. These costs are not confined,however, to the patient. For some fractures, the impact on carers and thehousehold in general is not negligible. Intangible costs are by definition those
218

that are difficult to quantify in monetary units. In the context of osteoporosisthey cover largely the morbidity associated with osteoporotic fractures.
The majority of health economic analyses have considered direct costs to thehealth service. The threshold of cost–effectiveness that has beenrecommended by the National Institute for Health and Clinical Excellence(NICE) in the United Kingdom is £30 000 per QALY gained (3). Somewhatlower thresholds have also been used (4–6) but are comparable to thresholdsused more recently (7–10). The threshold is relevant for direct costs only.When taking a societal perspective, the additional cost of added years of lifeas a result of treatment should be included (6,11,12). The effect of addingthese costs is to decrease the fracture probability at which treatment becomescost effective at the age of 50 years, because of the earning capacity ofyounger individuals. In elderly people, the reverse pertains – namely that thethreshold probability would be lower when costs of added years are excludedbecause of a lower earning capacity. Thus, the effect of not adding futurecosts biases cost–effectiveness in favour of interventions directed at theelderly people, and conversely discriminates against young people. For thisreason, the threshold value for cost–effectiveness might be adjusted upwardsfor elderly patients where future costs of added years of life are included(12). Their inclusion is not, however, favoured by health-care purchasers,who are more concerned about costs to the health service.
In the context of osteoporosis and fracture risk, the intervention thresholdthat is relevant for clinicians can be defined as the probability of fracture atwhich intervention becomes cost-effective. In view of the multiple outcomes(i.e. different sites of fracture) this has been expressed as the 10-yearprobability of hip fracture at which treatment is cost-effective, i.e. using hipfracture as a common denominator to measure the impact of all fractureoutcomes.
The most serious osteoporotic fracture in terms of cost to the individual andto health-care agencies is hip fracture. However, intervention thresholdsdetermined on hip fracture risk alone neglect the many other fractures thatoccur, particularly in younger age groups. Even in elderly people, hipfractures represent less than 50% of all fractures in men and women (13–15).Thus, recommendations that are based on hip fracture alone underestimateconsiderably the value of treatment to reduce the risk of other fractures(15,16). For this reason, the setting of intervention thresholds inosteoporosis should take account of the multiple outcomes of osteoporosis –namely the different fracture outcomes and their associated morbidity.Several approaches have been used to characterize intervention thresholds offracture risk that can be justified from a cost–effectiveness perspective(4,17–19). The most recent have been derived for Sweden and the UnitedKingdom (19), and that for the United Kingdom is described briefly below,by way of an example.
219

8.3 Intervention thresholds in the United KingdomThe model used for the United Kingdom was based on a Markov model, withdata on fracture risk derived from the population of the United Kingdom.The model has been used in several studies to predict fracture and mortalityrisks and for cost–effectiveness calculations, and is well validated andcalibrated (1,10,16,18–24). In a review of models that assessed thecost–effectiveness of osteoporosis, the model was suggested as a referencestandard for the economic evaluation of osteoporosis (25).
For the purposes of illustration, fractures of the spine, rib, pelvis, humerus,forearm, hip and other femoral fractures, tibia and shoulder girdle areconsidered to be osteoporotic. As described in section 2, fractures at thesesites in women are associated with low BMD and increase in incidence withage (15,26). The incidence of hip and forearm fracture in the UnitedKingdom was taken from Singer et al. (27). Because data on vertebralfracture risk in the United Kingdom are scarce, the incidence of clinicalvertebral fracture was calculated by assuming that the ratio of clinicalvertebral fracture to hip fracture would be similar to that in Sweden (7). Asimilar approach was used to assess the risk of other osteoporotic fractures.Clinical vertebral fracture was used rather than all morphometric vertebralfractures. There are, however, relatively small differences in cost-utilitybetween using these two fracture types (22).
8.3.1 Effect of interventionThe wide range of intervention costs and efficacy of agents available for themanagement of osteoporosis poses problems in setting interventionthresholds, since changes in the assumptions for both have marked effects oncost–effectiveness (4). The most conservative scenario would lead to themost expensive intervention and the lowest efficacy. Conversely, the mostexuberant would be to choose the level of risk at which the cheapestintervention had the greatest effectiveness. From a societal perspective, abasket of treatments would be used, with a range of efficacy and costs.Consideration might also be given to major extraskeletal effects ofinterventions. For example, hormone replacement therapy and raloxifenehave extraskeletal risks and benefits which will affect cost–effectiveness, evenassuming equal efficacy and price (22).
Although all agents should be evaluated for cost–effectiveness, it becomesimpractical to guide treatment on this basis alone. This was an approach usedby the National Osteoporosis Foundation (4), which assessed thecost–effectiveness of screening and treating with each agent available in theUnited States. The National Osteoporosis Foundation came to theconclusion that it was worthwhile to undertake a BMD test to assess risk ata given age when one treatment was envisaged, but at a different age withanother treatment. This may be scientifically sound, but is counter-intuitive
220

to clinical practice, which normally demands assessment of patients first,thereafter a decision whether to treat, and finally the choice of which agentto use. Thus, the choice of intervention comes later in the decision-makingprocess, which can then be tempered by information on cost–effectiveness.There is, however, a need to provide some general guidance on whom to treat,particularly since there are many clinical risk factors that can be used forcase-finding.
For the purposes of this illustration, an average treatment effectiveness of35% on all osteoporotic fractures was chosen, based on a meta-analysis ofthe effects of bisphosphonates on all fracture types (19). The meta-analysisestimated the efficacy (relative risk reduction) on vertebral, hip and othernon-vertebral fractures of 43%, 39% and 19%, respectively, inpostmenopausal osteoporosis. When all osteoporotic fractures wereconsidered, a relative risk reduction of 35% was computed from the expecteddistribution of osteoporotic fractures at each age, the associated utility losses(28) and the efficacy estimates given above. The cost of intervention was setat that of the second generation bisphosphonates. The relative risk reductionof 35% for all osteoporotic fractures also approximates the effect of hormonereplacement treatment on all fractures (29) but is greater than that observedfor vitamin D with calcium on hip fracture risk (20%–25%) in elderlyinstitutionalized women (30). The calcitonins and teriparatide are moreexpensive, but the latter has greater efficacy. Hormone replacement treatment(oral), calcium and vitamin D are less expensive in the United Kingdom (9).
An intervention of 5 years was assumed, targeted to the female population ata given 10-year hip fracture probability at any given age. The 5-year treatmentwas chosen to approximate the time period where there are direct or indirectclinical data on intervention effects. After stopping intervention, the riskreduction was assumed to reverse in a linear manner over a subsequent 5-yearperiod (1,17).
A key assumption concerns the duration of persisting effect after stoppingtreatment, termed the offset time (1). There is a great deal of uncertaintyover the offset time of many treatments. Relatively rapid offset times of a fewyears have been observed with calcium, calcitonins and vitamin Dmetabolites. Longer offset times are described with the bisphosphonates,estrogens, tamoxifen, and more recently with parathyroid hormone (1,31,32).The assumption of a 5-year offset time is therefore conservative, and longeroffset times would markedly improve cost–effectiveness (1). A furtherconsideration is that a fixed treatment time of 5 years was modelled, butaltering the duration of intervention has relatively modest effects on costsand effectiveness (17).
221

8.3.2 Cost utilityA threshold value of £30 000 per QALY gained compared to no treatmentwas taken as an indication of cost–effectiveness using direct costs, in line withthe recommendations of the United Kingdom National Institute for Healthand Clinical Excellence (3).
The cost-effectiveness of the base case treatment (£350) and efficacy (35%effectiveness) is shown in Fig. 8.1 at different ages and different hip fractureprobabilities (19). As expected, cost–effectiveness improved at any age withincreasing fracture probability, because of the higher risk of fracture andthus the greater number of fractures avoided. For any given hip fractureprobability, cost–effectiveness improved with decreasing age, since more non-hip fractures were avoided at the younger ages.
Fig. 8.1
Cost–effectiveness of an intervention costing £350 per annum with an efficacy of 35%, byage and hip fracture probabilitya
Source: reference 19 (Fig. 1).
QALY, quality-adjusted life year.a Logarithmic scale.
The threshold of hip fracture probability at which treatment becomes cost-effective is lower with decreasing age (Table 8.1). Indeed, for intervention atthe age of 50 years, a 10-year probability that exceeds 1.1% is cost-effective inwomen. By contrast at the age of 80 years, treatment became cost effectivewith a hip fracture probability of 8.5%. This appears to be paradoxical, butarises because it is assumed that intervention decreases the risk of allosteoporotic fractures. In younger women, proportionately more fractures
222

occur at sites other than the hip. Thus, for a given hip fracture probability,more fractures at sites other than the hip are also averted. The effect of ageto increase the hip fracture probability at which treatments become cost-effective should not be misconstrued to infer that the younger the age, themore cost-effective treatments become. Indeed, the converse is true.
Table 8.1
Relative risk (RR) and 10-year hip fracture probability (%) at which treatment becomes costeffective in a United Kingdom setting
10-year hip fracture probability (%)
Age General Selected
(years) RR Threshold populationa populationb
50 3.77 1.10 0.30 2.50
55 2.63 1.81 0.70 4.2
60 1.89 2.64 1.42 5.9
65 1.42 3.70 2.64 8.8
70 1.11 5.24 4.73 12.3
75 0.91 6.87 7.59 14.8
80 0.77 8.52 10.83 18.2
85 0.65 8.99 13.0 19.2
Source: reference 19 (Table 1).aGeneral population (RR = 1.0).bSelected according to clinical risk factors and the selective use of bone mineral. density (seesection 9 for details).
As also shown in Table 8.1, the hip fracture probability in the selectedpopulation exceeds the threshold risk. Thus, in a population of 50 year oldwomen, treatment of the selected population would be even more cost-effective.
The effect of averting hip fracture alone, or hip plus spine plus forearmfracture, or all osteoporotic fractures is shown in Table 8.2 for women aged70 years. When therapy was assumed to decrease hip fracture only, it was notcost-effective to intervene unless the 10-year hip fracture probability exceededabout 10%. Where treatment had effects on hip, spine and forearm fractures,the threshold probability was approximately 7%. Where all osteoporoticfractures were assumed to decrease with intervention (i.e. the base case), itwas cost-effective to intervene with a 10-year hip fracture probability ofapproximately 6%.
223

Table 8.2
Cost–effectiveness of intervention (£000) in women aged 70 years, by the type of fractureaverted, assuming a relative risk reduction of 35%
Cost/QALY gained (£000)10-yearhip fracture Hip, spine All osteoporoticprobability (%) Hip and forearm fractures
5.0 78 32 32
10.0 33 15 10
15.0 18 8 2
20.0 10 5 -2
25.0 5 3 -6
Source: reference 19 (Table 2).
QALY, quality-adjusted life year.
For women aged 75 years or more, it is, using the base case, cost-effective totreat women at the average population risk. For example, it is cost-effective totreat women at the age of 75 years with a 10-year hip fracture probability of6.9% whereas the population probability at this age is 7.6% (see Table 8.1). Itis, however, not entirely certain whether intervention thresholds for elderlypeople should be set below the average hip fracture probability for age andsex. The reason is that most trials of intervention have targeted men andwomen with low bone density (with a T-score for BMD commonly <-2.0 or<-2.5 SD), so that the experience of treating individuals with higher valuesfor BMD is less. Recent studies suggest that efficacy of interventions onvertebral fracture risk is not markedly affected by baseline BMD (8,33–38).For non-vertebral fractures, the information base is less but would suggestthat anti-fracture efficacy with bisphosphonates might be less marked inindividuals with the higher values for BMD (39,40). On the other hand,hormone replacement treatment has also been shown to decrease fracturerisk when targeted to the general population (29). Until these uncertaintiesare resolved, it may be unwise to recommend intervention in individualswhose risk is not increased above that of the general population of the sameage and sex.
The cost-effectiveness and 10-year hip fracture probabilities of differentclinical scenarios are shown in Figs 8.2 and 8.3. In women with a priorfragility fracture, and without knowledge of BMD, it was cost-effective tointervene from the age of 65 years. In women at the threshold of osteoporosis(i.e. a T-score at the femoral neck equal to –2.5 SD and no prior fracture), itwas cost-effective to intervene from the age of 60 years. In women at thethreshold of osteoporosis with a T-score of –2.5 SD, it was cost-effective tointervene if there was a history of a prior fracture, irrespective of age. Inwomen with a T-score of less than –2.5 SD it was, therefore, also cost-effective to intervene, irrespective of the presence or absence of a priorfragility fracture and irrespective of age.
224

Fig. 8.2
Cost–effectiveness (£000/QALY gained) of treatment in women aged 50–70 years, by thepresence or absence of a prior fracture and osteoporosis
Source: reference 19 (Fig. 3).
QALY, quality-adjusted life year.
Fig. 8.3
Ten-year hip fracture probabilities (%), by age and the presence or absence of a prior fragilityfracture and osteoporosisa
Source: reference 19 (Fig. 4).
QALY, quality-adjusted life year.a Logarithmic scale.
225

In the present analysis, a prior fracture was assumed to increase subsequentfracture risk by 1.85 (1.74 after adjustment for BMD). With a prior vertebralfracture, subsequent fracture risk is markedly increased (41,42) and thiswould improve cost-effectiveness still further. These findings, modelled on thegeneral population, illustrate the importance of combining independent riskindicators. Strategies based on the individual patient approach are reviewedin section 9.
An approach similar to that described above has been used to determineintervention thresholds for women from Sweden (18). Interventionthresholds, expressed as 10-year hip fracture probabilities for Swedishwomen, were 1.2, 1.8, 2.7, 4.0 and 5.1 at the ages of 50, 55, 60, 65 and 70years, respectively. The current estimates for the United Kingdom (see Table8.1) are rather similar, despite the different costs and fracture risks in Swedencompared with the United Kingdom.
In men, intervention thresholds are likely to be broadly similar to those foundin women, at least from the age of 60 years or more. In one study,intervention thresholds were higher in Swedish men than in women below theage of 60 years (18). This was partly explained by the exclusion of tibialfractures, since there is little evidence that these can be considered to beosteoporotic in men (15).
In this analysis, only the effects of osteoporotic fractures have been modelled.The effect of interventions that have generalized extraskeletal benefits andrisks would markedly alter cost-effective intervention thresholds(9,10,22,24). The obvious examples are hormone replacement treatment andraloxifene. Both appear to affect breast cancer, though probably in differentdirections (43,44), and both decrease markers of cardiovascular morbidity(43–45), though no favourable effects of hormone replacement oncardiovascular events have been shown in prospective studies (29,46).
8.4 Other socioeconomic settingsIntervention thresholds developed for Sweden or the United Kingdom maynot be applicable to many WHO Member States. The 10-year probability offracture varies markedly in different countries. For countries with low hipfracture rates, as found in developing countries, the relative risk at whichintervention is cost-effective will be higher, though the absolute risk at whichintervention is cost-effective would not change assuming comparable costs.Thus, in countries with fracture rates lower than those in the UnitedKingdom, a lower proportion of the population would be identified fortreatment. Intervention thresholds would, however, change with differencesin costs, particularly fracture costs, which vary markedly between MemberStates.
226

Some countries may, however, be less able to afford interventions, particularlysince the costs of pharmaceuticals for osteoporosis are more or less the sameworldwide (with the exception of higher prices in the United States). Thisraises the issue of affordability or willingness to pay for a strategy. The grossdomestic product (GDP) per capita provides an index of affordability. TheGDP varies markedly in different regions of the world. In the UnitedKingdom, the GDP per capita is estimated at US$ 25 300 in 2002, ascompared with US$ 7000 in Turkey. Thus, for the same fracture risk and thesame costs, treatment will be less affordable (at least to health services) inTurkey than in the United Kingdom. Nevertheless, individuals in Turkey,rather than society as a whole, may be willing to pay “United Kingdomprices” for health care. There is also a marked heterogeneity in the proportionof GDP devoted to health care, and in the proportion of the population atrisk from osteoporotic fracture (i.e. elderly people) (Table 8.3) (47–51).
227

Table 8.3
Ten-year hip fracture probability (ratio to Sweden), life expectancy and indices of wealth andhealth-care expenditure
Life expectancy Government% of at 60 years spending on
10-year hip population Health health care Per capitaCountry fracture aged Males Females expenditure (% total expenditure GDP/capita
probabilitya 60+ years % GDP health on health expenditure) US$
Norway 1.24 19.6 16.2 18.9 8.0 85.5 2 981 37 263Iceland 1.02 15.3 17.5 18.7 9.2 82.9 2 441 26 533Sweden 1.00 22.9 17.1 19.6 8.7 85.2 2 150 24 713Denmark 0.85 20.4 15.2 17.2 8.4 82.4 2 545 30 274USA 0.78 16.2 15.3 17.9 13.9 44.4 4 887 35 158China (Provinceof Taiwan) 0.72 - - - - - - -
Germany 0.72 24.0 15.9 19.0 10.8 74.9 2 412 22 333Switzerland 0.71 22.1 17.1 20.4 11.0 57.1 3 779 34 354Finland 0.68 20.3 15.7 18.9 7.0 75.6 1 631 23 300Greece 0.66 23.8 16.0 18.1 9.4 56.0 1 001 10 649Canada 0.65 17.1 16.1 19.3 9.5 70.8 2 163 22 768Netherlands 0.64 18.5 15.5 18.4 8.9 63.3 2 138 24 022Hungary 0.63 20.0 12.1 16.0 6.8 75.0 345 5 073Singapore 0.62 11.1 14.5 16.3 3.9 35.5 816 20 923Italy 0.61 24.5 16.4 19.4 8.4 75.3 1 584 18 857United Kingdom 0.60 20.8 15.7 18.1 7.6 82.2 1 835 24 145Kuwait 0.59 2.7 13.8 14.2 3.9 78.8 537 13 769Australia 0.57 16.7 16.9 19.5 9.2 67.9 1 741 18 924Portugal 0.57 21.1 14.9 17.7 9.2 69.0 982 10 674China (HongKong SAR) 0.49 - - - - - - -
France 0.41 20.5 16.6 20.4 9.6 76.0 2 109 21 969Japan 0.39 24.4 17.5 21.7 8.0 77.9 2 627 32 837Mexicob 0.38 7.2 14.4 16.2 6.1 44.3 370 6 066Spain 0.36 21.6 16.4 19.9 7.5 71.4 1 088 14 507China 0.29 10.0 13.1 14.7 5.5 37.2 49 891Turkey 0.18 8.2 12.8 14.2 5.0 71.0 109 2 180Republic of Korea 0.18 11.8 13.2 17.1 6.0 44.4 532 8 867Venezuela 0.17 6.9 13.9 15.7 6.0 62.1 307 5 117Moroccoc 0.12 5.1 11.4 12.7 5.9 39.3 23 4 628Chile 0.08 10.7 13.9 16.8 7.0 44.0 303 4 329Iran (IslamicRepublic of) 0.03 6.4 10.4 11.9 6.3 43.5 350 5 556Cameroond 0.02 5.6 9.7 10.4 3.3 37.1 20 606
Source: references 47, 48.aAveraged for men and women. bHip fracture probabilities from Clark et al. (49). cComputed from ElMaghraoui et al. (50). dComputed from Zebaze and Seeman (51).
GDP, gross domestic product; -, no data from same source.
228

For all these reasons, it is important to define intervention thresholds on acountry by country basis that takes into account the setting for serviceprovision and willingness to pay, as well as considerations of absolute costs.
As mentioned, there is a great deal of heterogeneity in fracture risk aroundthe world (47,52–54), as well as in mortality, costs of fracture and costs ofintervention. Table 8.3 shows relative 10-year probabilities of hip fracture indifferent countries compared to Sweden (RR=1).
The large variation means that, if individuals are identified for treatment onthe basis of fracture probability alone (e.g. a 10-year hip fracture probabilityof, say, 7%), many more individuals would be selected from high riskcountries than from countries with lower risk. Indeed, a 10-year hip fractureprobability of 7% approximates the risk in the general Swedish population.In Turkey, a very small minority of 70 year olds with the same hip fractureprobability would be selected, but with a very high risk relative to the generalpopulation.
It is likely that absolute fracture risk will be increasingly used as theintervention threshold. This will demand greater information on hip fractureprobabilities than is available to date. Indeed, hip fracture probabilities areavailable from only approximately 30 countries. Mortality hazards are,however, available worldwide, so data on incidence of fractures from othercountries are required to enlarge this database. Where probabilities arerequired for countries without data on hip fracture, a surrogate region wouldneed to be chosen that best represented the local mortality and hip fracturerisks.
There is at present little or no information as to when treatment can beconsidered to be cost-effective in the majority of Member States. Suggestedvalues for each QALY gained have been €66 000 in Sweden (55), €6000–€30000 in Spain (56) and, as mentioned, £30 000 in the United Kingdom.
The WHO Commission on Macroeconomics and Health (57) suggested thatinterventions with a cost–effectiveness ratio lower than 3-times the GDP percapita for each averted disability-adjusted life year (DALY) should beconsidered cost effective (57). Assuming that the values for a DALY and aQALY are reasonably comparable, then a cost-effective threshold for theUnited Kingdom would be US$ 75 900. It is not specified in the report of theWHO Commission what costs are included, but if all costs are included, suchas cost of added years, then the threshold value should be set at a lower levelwhen a health-care perspective is taken. Using the same ratio (0.6) foradjustment as suggested by Kanis and Jönsson (12), the threshold valueswould be about US$ 45 000 in the United Kingdom, close to therecommendation of the National Institute for Health and ClinicalExcellence, and about US$ 12 500 in Turkey.
229

In developed countries, an approach to cost–effectiveness might beapproximated by a multiple of GDP per capita. For example, the GDP percapita in the United Kingdom is US$ 24 145, which is approximately £15 000.Interventions are considered to be cost-effective at a threshold of £30000/QALY gained, suggesting a multiple of two. From knowledge of costs,mortality and fracture risk, possible intervention thresholds can beapproximated (Table 8.4) indexed to Sweden (58). For example, in theNetherlands, GDP per capita is lower than that of Sweden, but so too arecosts of fracture and risk of fracture, so that the intervention threshold interms of 10-year hip fracture risk is comparable to that of Sweden. Thelowest intervention thresholds are found for Switzerland where, comparedwith Sweden, the GDP per capita is somewhat higher but the costs offractures are markedly increased and greater savings are incurred byintervention. Broadly similar intervention thresholds are found for Denmark,Finland, France, Japan, the Netherlands, Norway, Sweden, the UnitedKingdom and the United States.
Table 8.4 Determinants of intervention thresholds in different countries, indexed to Sweden
GDP/capita Cost Hip fracture Mortality ProbabilityCountry US$ (000) indexa indexb indexc RRd indexe
Australia 18.9 0.47 0.75 1.29 1.2 1.3
Canada 22.8 0.49 0.74 1.13 1.1 1.3
Denmark 30.3 1.01 0.88 1.19 0.7 0.9
Finland 23.3 0.76 0.64 1.09 1.1 1.1
France 22.0 0.74 0.46 1.29 1.6 1.2
Germany 22.3 1.80 0.76 0.89 2.2 1.8
Italy 18.9 0.57 0.77 0.95 1.1 1.3
Japan 32.8 1.46 0.50 0.99 1.0 0.8
Netherlands 24.0 0.96 0.70 1.16 0.9 1.0
Norway 37.3 1.11 1.12 1.25 0.4 0.8
Portugal 10.7 0.81 0.49 1.18 1.8 1.4
Singapore 20.9 0.76 0.40 1.31 2.0 1.3
Spain 14.5 0.62 0.51 1.04 1.8 1.5
Switzerland 34.3 2.76 0.81 0.99 0.4 0.5
Sweden 30.3 1.00 1.00 1.00 0.6 1.0
UK 24.1 0.99 0.71 1.13 0.9 1.0
USA 35.2 0.56 0.79 1.46 0.9 1.0
Source: reference 58.aCost index computed from mean bed-days for musculoskeletal diseases and differences inhealth-care prices as a ratio to those of Sweden.bIndex related to 10-year probabilities in Sweden at the age of 70 years.cIndex related to the population of Sweden.dRisk relative to population risk at which intervention becomes cost effective.eHip fracture probability at threshold of cost–effectiveness index related to Sweden.
230

This approach is probably not robust in the developing countries wheredifferent health-care priorities pertain (59). Also, the approach isparticularly sensitive to differences in fracture costs, an estimate that is poorlyinvestigated. It is also important to recognize that fracture risks vary withincountries, being higher in urban compared to rural communities. In urbancommunities, the fracture risks may not differ substantially from those in themore developed economies, and individuals living in urban areas may havehigher socioeconomic prosperity than the average for the country as a whole.Finally, treatment decisions in this context are not always governed by policy-makers, but are also taken by individuals, particularly in that segment ofsociety with the highest socioeconomic prosperity (i.e. “privatization ofrisk”).
8.5 Individual patient-based scenariosThe stratification of risk can be illustrated by the consideration of priorfractures and use of glucocorticoids, both of which are strong risk factors forfracture. The example in Fig. 8.4 considers a female aged 65 years. At theextreme of BMI, there is a 1.8-fold difference in the 10-year probability of hipfracture. In the presence of a prior fracture, the range of probabilitiesincreases and, in the case of low BMI and prior fracture, the UnitedKingdom intervention threshold is exceeded. With chronic use ofglucocorticoids, a prior fracture and low BMI, there is a 9-fold range inprobabilities. In the presence of any two risk factors (low BMI, prior fracture,glucocorticoids), the intervention threshold is exceeded.
Fig. 8.4Stratification of fracture risk based on body mass index (BMI), prior fracture and exposureto glucocorticoids in a woman aged 65 years from the United Kingdom
231

It is important to recognize that these thresholds are based on the exampleprovided for the United Kingdom and will not necessarily apply elsewhere. Inaddition, clinical judgement should also influence decision-making, since, forexample, a prior vertebral fracture confers a somewhat higher risk than themodel provides and no account is taken of the dose of glucocorticoids.
With BMD taken into account, BMI has a very modest independent impacton fracture probability. Table 8.5 shows the relationship between clinical riskfactors according to BMD T-score at an average BMI (24 kg/m2). In womenwithout risk factors, probabilities of hip fracture exceed the United Kingdomintervention threshold with a T-score of –3.0 SD or less and, in the case of50 year old women, a T-score of –2.5 SD. In the presence of a prior fragilityfracture or exposure to glucocorticoids, the intervention threshold isexceeded between a T-score of –2.0 SD and –3.0 SD, depending on age. Inwomen with both risk factors, treatment is cost-effective between a T-score of–1.5 and –2.0 SD. In the clinical scenario above, intervention becomes cost-effective in the absence of risk factors at T-scores of –2.3, –2.6, –2.9 and –2.9SD at the ages of 50, 60, 70 and 80 years, respectively. In the presence of aprior fragility fracture and exposure to glucocorticoids, the respective T-scores are –1.2, -1.5, -1.9 and –1.9 SD.
Table 8.5
Ten-year probability of hip fracture (%) in women from the United Kingdom (BMI = 24.1kg/m2), by age, femoral neck BMD T-score and clinical risk factors: probabilities that exceedthe intervention threshold are shown in bold typeface
No clinical risk factors Prior fragility fractureT-score T-score
Age(years) 0 -1.0 -1.5 -2.0 -2.5 -3.0 -4.0 0 -1.0 -1.5 -2.0 -2.5 -3.0 -4.0
50 0.1 0.2 0.4 0.8 1.6 3.1 12 0.1 0.5 0.9 1.7 3.4 6.5 23
60 0.1 0.4 0.8 1.4 2.4 4.3 13 0.3 0.8 1.4 2.5 4.4 7.7 23
70 0.4 0.9 1.4 2.3 3.8 6.1 16 0.5 1.4 2.2 3.5 5.8 9.3 23
80 1.0 2.1 3.0 4.2 6.2 9.1 19 1.3 2.7 3.9 5.6 8.1 11.8 24
Ever-use of glucocorticoids Glucocorticoids and prior fractureT-score T-score
Age(years) 0 -1.0 -1.5 -2.0 -2.5 -3.0 -4.0 0 -1.0 -1.5 -2.0 -2.5 -3.0 -4.0
50 0.1 0.4 0.8 1.5 3.0 5.8 21 0.1 0.9 1.7 3.2 6.3 12 39
60 0.3 0.8 1.4 2.5 4.5 7.9 23 0.5 1.5 2.6 4.5 7.8 14 38
70 0.6 1.6 2.5 4.1 6.7 11 26 1.0 2.5 3.9 6.3 10 16 37
80 1.7 3.5 5.0 7.1 10.0 15 29 2.3 4.6 6.5 9.2 13 19 35
BMI, body mass index; BMD, bone mineral density.
232

8.6 Implications for case-findingThe effect of adopting intervention thresholds depends upon the accuracywith which individuals at or above a threshold level of risk can be identified.The relationship between gradient of risk and risk threshold has beenreviewed in section 6. Assuming that the gradient of risk of fractureassessment lies between 2.0 and 3.0/SD change in risk score, less than 4% ofwomen from the United Kingdom would be identified to be at high risk at theage of 50 years, a proportion that increases with age, but decreases withhigher gradients of risk (19) (Table 8.6). The higher the gradient of risk, thehigher the risk of the population selected (Table 8.7). For example, at the ageof 65 years, 20% of the population would be selected to be above anintervention threshold. The relative risk of fracture compared with thepopulation risk would be 2.2 with a test with a gradient of risk of 2.0, butwould rise to 3.1 where the gradient of risk was 3.0 (19).
Table 8.6
The proportion (%) of women at the ages shown that would be identified to have a risk thatexceeds the intervention threshold, by gradient of fracture risk/SD of an assessmentalgorithm
Proportion of population identified (%) when the gradient of risk is:
Age(years) 2.0 2.5 3.0
50 1.2 2.8 3.9
55 4.1 6.5 7.7
60 10.3 12.5 13.0
65 19.7 20.0 19.3
70 30.8 28.2 25.9
75 42.0 36.3 32.3
80 51.4 43.3 37.9
85 61.2 50.7 44.0
90 71.3 59.0 50.9
Source: reference 19 (Table 5).
233

Table 8.7
Risk ratio of those above the threshold versus average risk of the general population, bygradient of risk
Risk ratio of those above the thresholda versus average riskof the general population when the gradient of risk is:
Age(years) 2.0 2.5 3.0
50 4.9 5.7 6.5
55 3.6 4.2 4.8
60 2.8 3.3 3.8
65 2.2 2.7 3.1
70 1.9 2.2 2.6
75 1.6 2.0 2.3
80 1.5 1.8 2.1
85 1.4 1.6 1.9
90 1.3 1.5 1.7
Source: reference 19 (Table 6).aThe risk ratios of those at the threshold risk are shown in Table 8.1.
The application of threshold risks to case-finding is discussed in section 9.
References1. Jönsson B et al. Effect and offset of effect of treatments for hip fracture on health
outcomes. Osteoporosis International, 1999, 10:193–199.
2. Murray CJL, Lopez AD, eds. The global burden of disease and injury series. Vol. II.Global health statistics: a compendium of incidence, prevalence and mortality estimatesfor over 200 conditions. Cambridge, MA, Harvard School of Public Health on behalfof the World Health Organization and the World Bank, Harvard University Press,1996.
3. Raftery J. NICE: faster access to modern treatments? Analysis of guidance onhealth technologies. British Medical Journal, 2001, 323:1300–1303.
4. National Osteoporosis Foundation. Osteoporosis: review of the evidence forprevention, diagnosis and treatment and cost-effective analysis. OsteoporosisInternational, 1998, 8(Suppl. 4):1–88.
5. Kanis JA et al. Cost-effectiveness of preventing hip fracture in the general femalepopulation. Osteoporosis International, 2001, 12:356–361.
6. Johannesson M, Meltzer D, O'Connor R. Incorporating future costs in medicalcost-effectiveness analysis. Medical Decision Making, 1997, 7:382–389.
7. Kanis JA et al. Cost-effectiveness of risedronate for the treatment of osteoporosisand prevention of fractures in postmenopausal women. Osteoporosis International,2004, 15:862–871.
234

8. Kanis JA et al. Effect of raloxifene on the risk of new vertebral fracture inpostmenopausal women with osteopenia or osteoporosis: a reanalysis of theMultiple Outcomes of Raloxifene Evaluation trial. Bone, 2004, 33:293–300.
9. Kanis J et al. Treatment of established osteoporosis: a systematic review andcost-utility analysis. Health Technology Assessment, 2002, 6:1–146.
10. Borgstrom F et al. Cost-effectiveness of raloxifene: an economic evaluationbased on Swedish data. Pharmacoeconomics, 2004, 22:1153–1165.
11. Meltzer D. Accounting for future costs in medical cost-effectiveness analysis.Journal Health Economics, 1997, 16:33–64.
12. Kanis JA, Jonsson B. Economic evaluation of interventions for osteoporosis.Osteoporosis International, 2002, 13:765–767.
13. Jones G et al. Symptomatic fracture incidence in elderly men and women: theDubbo Osteoporosis Epidemiology Study (DOES). Osteoporosis International,1994, 4:277–282.
14. Melton LJ III et al. Cost equivalence of different osteoporotic fractures.Osteoporosis International, 2003, 14:383–388.
15. Kanis JA et al. The burden of osteoporotic fractures: a method for settingintervention thresholds. Osteoporosis International, 2001, 12:417–427.
16. Jönsson B et al. Cost-effectiveness of fracture prevention in establishedosteoporosis. Osteoporosis International, 1995, 5:136–142.
17. Kanis JA et al. Intervention thresholds for osteoporosis. Bone, 2002, 31:26–31.
18. Kanis JA et al. Intervention thresholds for osteoporosis in men and women: astudy based on data from Sweden. Osteoporosis International, 2005, 16:6–14.
19. Kanis JA et al. Intervention thresholds for osteoporosis in the UK. Bone, 2005,36:22–32.
20. Jönsson B et al. Cost-effectiveness of fracture prevention in establishedosteoporosis. Scandinavian Journal of Rheumatology, 1996, 103(Suppl.):30–40.
21. Johnell O et al. Cost effectiveness of alendronate (fosamax) for the treatment ofosteoporosis and prevention of fractures. Pharmacoeconomics, 2003, 21:305–314.
22. Kanis JA et al. Cost-effectiveness of raloxifene in the UK: an economic evaluationbased on the MORE study. Osteoporosis International, 2005, 16:15–25.
23. Zethraeus N, Johannesson M, Jonsson B. A computer model to analyze the cost-effectiveness of hormone replacement therapy. International Journal of TechnologyAssessment and Health Care, 1999, 15:352–365.
24. Zethraeus N, Johannesson M, Jonsson B. A computer model to analyse the cost-effectiveness of hormone replacement therapy. Stockholm, Stockholm School ofEconomics, 1998 (EFI Research Paper No. 6578).
25. Zethraeus N et al. Models for assessing the cost-effectiveness of the treatmentand prevention of osteoporosis. Osteoporosis International, 2002, 13:841–857.
26. Seeley DG et al. Which fractures are associated with low appendicular bone massin elderly women. Annals of Internal Medicine, 1991, 115:837–842.
27. Singer BR et al. Epidemiology of fractures in 15,000 adults: the influence of ageand gender. Journal of Bone and Joint Surgery, 1998, 80B:243–248.
28. Kanis JA et al. The risk and burden of vertebral fracture in Sweden. OsteoporosisInternational, 2004, 15:20–26.
235

29. Writing Group for the Women’s Health Initiative. Risks and benefits of estrogenplus progestin in healthy postmenopausal women: principal results from theWomen’s Health Initiative Randomized Controlled Trial. Journal of the AmericanMedical Association, 2002, 288:321–333.
30. Chapuy MC et al. Effect of cholecalciferol treatment for 3 years on hip fracturesin elderly women. British Medical Journal, 1994, 308:1081–1082.
31. Neer RM et al. Effects of parathyroid hormone (1-34) on fractures and bonemineral density in postmenopausal women with osteoporosis. New EnglandJournal of Medicine, 2001, 344:1434–1441.
32. Bagger YZ et al. Two to three years of hormone replacement treatment in healthywomen have long-term preventive effects on bone mass and osteoporoticfractures: the PERF study. Bone, 2004, 34:728–735.
33. Johnell O et al. Associations between baseline risk factors and vertebral fracturerisk in the Multiple Outcomes of Raloxifene Evaluation (MORE) Study. Journal ofBone and Mineral Research, 2004, 19:764–772.
34. Kanis JA, Barton IP, Johnell O. Risedronate decreases fracture risk in patientsselected solely on the basis of prior vertebral fracture. Osteoporosis International,2005, 16:475–482.
35. Kanis JA et al. Effect of raloxifene on the risk of new vertebral fracture inpostmenopausal women with osteopenia or osteoporosis: a re-analysis of theMultiple Outcomes of Raloxifene Evaluation trial. Bone, 2003, 33:293–300.
36. Quandt SA et al. Effect of alendronate on vertebral fracture risk in women withbone mineral density T-scores of -1.6 to -2.5 at the femoral neck: the FractureIntervention Trial. Mayo Clinic Proceedings, 2005, 80:343–349.
37. Marens R et al. The skeletal response to teriparatide is largely independent ofage, initial bone mineral density and prevalent vertebral fractures inpostmenopausal women with osteoporosis. Journal of Bone and Mineral Research,2003, 18:18–23.
38. McCloskey E et al. The efficacy of clodronate (Bonefos®) to reduce the incidenceof osteoporotic fractures in elderly women is independent of the underlying BMD.Journal of Bone and Mineral Research, 2003, 18(Suppl. 2):S65.
39. Cummings SR et al. Effect of alendronate on risk for fractures in women with lowBMD but without vertebral fractures. Journal of the American Medical Association,1998, 280:2077–2082.
40. McClung MR et al. Effect of risedronate on the risk of hip fracture in elderlywomen: Hip Intervention Program study group. New England Journal of Medicine,2001, 344:333–340.
41. Klotzbuecher CM et al. Patients with prior fractures have an increased risk offuture fractures: a summary of the literature and statistical synthesis. Journal ofBone and Mineral Research, 2000, 15:721–739.
42. Johnell O et al. Acute and long-term increase in fracture risk after hospitalisationfor vertebral fracture. Osteoporosis International, 2001, 12:207–214.
43. Cummings SR et al. The effect of raloxifene on risk of breast cancer inpostmenopausal women: results from the MORE randomized trial. Journal of theAmerican Medical Association, 1999, 281:2189–2197.
44. Assessment of fracture risk and its application to screening for postmenopausalosteoporosis. Geneva, World Health Organization, 1994 (WHO Technical ReportSeries, No. 843).
236

45. Hillner BE, Hollenberg JP, Pauker SG. Postmenopausal estrogens in preventionof osteoporosis: benefit virtually without risk if cardiovascular effects areconsidered. American Journal of Medicine, 1986, 80:1115–1127.
46. Million Women Study Collaborators. Breast cancer and hormone-replacementtherapy in the Million Women Study. Lancet, 2003, 362:419–427.
47. Kanis JA et al. International variations in hip fracture probabilities: implications forrisk assessment. Journal of Bone and Mineral Research, 2002, 17:1237–1244.
48. The world health report: changing history. Geneva, World Health Organization, 2004.
49. Clark P et al. Incidence rates and lifetime risk of hip fracture in Mexicans over 50years of age: a population based study. Osteoporosis International, 2005,16:2025–2030.
50. El Maghraoui A et al. Epidemiology of hip fractures in 2002 in Rabat, Morocco.Osteoporosis International, 2005, 16:597–602.
51. Zebaze RM, Seeman E. Epidemiology of hip and wrist fractures in Cameroon,Africa. Osteoporosis International, 2003, 14:301–305.
52. Bacon WE et al. International comparison of hip fracture rates in 1988 to 1989.Osteoporosis International, 1996, 6:69–75.
53. Elffors I et al. The variable incidence of hip fracture in Southern Europe: theMEDOS Study. Osteoporosis International, 1994, 4:253–263.
54. Johnell O et al. The apparent incidence of hip fracture in Europe: a study ofnational register sources. Osteoporosis International, 1992, 2:298–302.
55. Ekman M et al. Cost effectiveness of bisoprolol in chronic heart failure.Lakartidningen, 2002, 99:646–650.
56. Sacristan JA et al. What is an efficient health technology in Spain? Gac Sanit,2002, 16:334–343.
57. Macroeconomics and health: investing in health for economic development: report of theCommission on Macroeconomics and Health. Geneva, World Health Organization,2001.
58. Borgstrom F et al. Hip fracture probability and ability to pay for treatment: aworld-wide perspective. Osteoporosis International, 2006, in press.
59. Melton LJ III et al. Osteoporosis and the global competition for health-careresources. Journal of Bone and Mineral Research, 2004, 19:1055–1058.
9. Assessment and the formulation of a therapeuticstrategyIt is appropriate to consider the development of assessment tools in thecontext of therapeutic strategies for osteoporosis. Strategies will vary indifferent Member States and the requirements for assessment will also differ.
Two distinct, but not mutually exclusive, preventive strategies can beenvisaged (1). The first is to identify patients at particular risk and to offeran intervention termed the “high risk” strategy. Examples includeidentification of women with low bone density, those most likely to fall, or
237

individuals with certain diseases. A second approach, the “public health”strategy, is population-based and the aim is to modify a risk factor within theentire community. For example, if BMD were to be increased by 10% in theentire female population, this would be expected to decrease the risk offragility fracture by around 50% (2). Such approaches might be directed atany stage or at all stages of life.
9.1 Population-based preventionBone mass and rates of bone loss are continuously distributed throughoutthe population, so it is not possible to distinguish precisely an individual withdisease from the normal population (3). Nonetheless, a number of riskfactors have been identified which, if causally related and correctable, mighthave a significant impact on the burden attributable to osteoporosis (4). Themore obvious remedial factors that have been proposed include a higher levelof exercise, stopping smoking, the prevention of falls and the optimization ofnutrition, particularly the ingestion of a diet high in calcium and vitamin D(5–8). There are, however, several problems with these approaches. The firstis that not all these risk factors are necessarily causally related toosteoporosis; in particular, uncertainties exist with respect to smoking andmoderate alcohol consumption. A second problem relates to the ability tochange a lifestyle habit, as illustrated by the limited success of risk factorintervention in coronary heart disease (9). This raises a third problem,namely that the value and feasibility of population programmes inosteoporosis prevention have not been coherently evaluated. Thisconsideration even applies to falls, where intuition indicates that attempts toprevent falls in elderly people might be of benefit in reducing fractures. Thereis, however, currently no controlled trial evidence showing that strategieswhich prevent falls serve to decrease the risk of fracture in individuals (10).
A further problem relates to the effect of remedial factors on the frequencyof fractures within a community. Despite the high prevalence of many ofthese factors, the increase in risk associated with each is relatively small, as isthe attributable risk. Where the attributable risk is small, the same overallreduction in hip fracture incidence might be achieved by targeting thatsegment of the population with the risk factor itself rather than the wholepopulation. If all the risk factors identified for hip fracture were causal andcould be reversed, the impact on fracture incidence might be as high as 50%(11). In practice, it is not feasible to modify the majority of these risk factors,so the potential effect of risk factor modification at the population level issubstantially smaller.
9.1.1 Behavioural risksFive factors that are related to behaviour or lifestyle have been evaluated fortheir relationship to fragility fractures: nutrition, cigarette smoking, alcoholconsumption, physical activity and falls.
238

Nutrition
The role of nutrition, particularly with respect to dietary calcium, has beeninvestigated extensively. A 1997 meta-analysis reviewed 23 observationalstudies that related dietary calcium intake to fracture outcomes (18 studieswere of hip fracture and five of other fracture sites) (12). The fivepopulation-based cohort studies of hip fracture, as well as the overall pooledrisk estimate, showed declining fracture risk with increasing dietary calcium.The pooled odds ratio indicated a 4% reduction in hip fracture risk for each300 mg increase in daily dietary calcium intake, equivalent to one glass ofmilk per day. The likely benefit from calcium is reinforced by results ofseveral small clinical trials with calcium supplements, which show reducedfractures among those receiving supplements (12). However, the effect ofchanging calcium nutrition alone is likely to be small. For example, in a largesurvey of European women, calcium was shown to be a significant protectivefactor against the risk of hip fracture (11), but the risk was confined to the10% with the lowest intake. Even if the relationship between calcium intakeand risk were causal, increasing the calcium intake above about 500 mg dailywould prevent just 4% of hip fractures (13).
Vitamin D deficiency occurs in many regions of the world and gives rise torickets in childhood and to osteomalacia in adults. There has been anincreasing recognition that vitamin D insufficiency is common in elderlypeople, particularly those who are not fully independent and therefore lessexposed to sunlight. Case-control studies of hip fracture risk indicate thatlack of sunlight exposure is significantly associated with an increase infracture risk (11). In addition, ecological studies suggest that hip fracturerisk increases progressively with latitude, an effect that is independent ofsocioeconomic prosperity (which is also associated with high fracture risk).For each 10 degrees increase in latitude, the prosperity-adjusted 10-year hipfracture probability increases by 0.6% in Sweden (14).
Intervention studies with vitamin D alone, or in combination with calcium,have shown inconsistent effects on fracture rates. In one large study fromHolland (15), no difference in fracture incidence was observed in 2578 menand women over the age of 70 years randomized to calciferol 400 IU daily orto placebo. Likewise, two large studies in the United Kingdom have recentlyreported no effect of vitamin D on fracture rates (16,17). In contrast, a studyin Finland (18) showed that 150 000–300 000 IU of vitamin D annuallyreduced symptomatic fracture rates by 25% in a cohort of 800 elderlysubjects. In the United Kingdom, the use of 100 000 IU vitamin D given 4-monthly decreased non-vertebral fracture rates by 22% in elderly people (19).These discrepant results may relate to the underlying adequacy of calciumand vitamin D nutrition in the various populations studied.
Two further studies have examined the effects of calciferol with a calciumsupplement on fracture outcomes. One study in France examined non-
239

vertebral and hip fracture rates in a cohort of 3000 elderly women insheltered accommodation given 800 IU vitamin D and 1200 mg calcium daily(20). Over a 3-year interval, fracture rates decreased by approximately 25%.In a study based in the United States, non-vertebral fracture rates weredecreased by more than half in 400 elderly men and women randomized tocalcium 500 mg plus 700 IU vitamin D daily, or to placebo (21).
More consistent effects of vitamin D have been observed on the risk offalling. Vitamin D deficiency is associated with muscle weakness and anincreased risk of falls. Several randomized controlled trials have shown thatvitamin D supplements decrease the risk of falls, even though benefits interms of fracture outcomes are less consistent (22).
These considerations indicate that a diet adequate in calcium and vitamin Dmay be of benefit for fracture outcomes in later life. The provision of a dailyintake of 400–800 IU vitamin D is a straightforward, safe and inexpensivemeans of prevention. The dietary intake of calcium that is considered to beadequate varies markedly around the world and reflects some of the scientificuncertainties (23). Of the principal food sources of calcium, dietaryproducts have a higher fractional absorption of calcium than vegetables, andcheese may be marginally superior to milk (24). The effects of calcium andvitamin D intake in childhood or in young adult life on later fracture risk areless well studied. Nevertheless, dietary habits acquired in early life correlatewith dietary habits in later life, so that there is an argument to be forwardedfor adequate nutrition in calcium and vitamin D for the entire population,irrespective of age.
Cigarette smoking
A meta-analysis in 1997 reviewed 29 cross-sectional studies that relatedsmoking to bone density and 19 cohort and case-control studies that reportedrisks of hip fracture in smokers and non-smokers (25). Lower BMD wasfound in postmenopausal women who smoked, and the relative risk of hipfracture rose progressively with age. In the current meta-analysis described insection 5, the risk of all fractures was increased in smokers, though more soin the case of hip fracture (RR = 1.84). Unlike the earlier meta-analysis, risksdid not increase with age. An increased fracture risk was also found in men.In general, risk ratios were higher in men than in women, though notsignificantly so, perhaps because of higher exposure to tobacco. Althoughcigarette smoking is less prevalent at older ages, it is estimated to beresponsible for 13% (or 1 in 8) of fractures in women. The mechanism bywhich smoking influences risk are uncertain, but findings of the meta-analyses persist when possible confounding factors known to be related tosmoking (e.g. lower weight, high intakes of alcohol, anti-estrogen effects andphysical activity) are considered.
240

Alcohol use
The heavy use of alcohol has been associated with increased fracture risk(26,27). As alcohol intake is closely associated with smoking, poor diet, andpropensity to fall, it has been difficult to identify its independent influence onfracture. Inconsistent findings from several studies have shown no effect, aslightly increased fracture risk, and a protective effect from low and moderatealcohol consumption (section 5) (27,28). Evidence of higher risk amongheavy drinkers is more consistent but difficult to evaluate because of thecomplex interrelationship between the factors mentioned above, particularlythe increased propensity to fall. The meta-analysis given in section 5 suggestsa threshold effect where the risk is increased when intake exceeds 2 unitsdaily, but the causal association of alcohol with fracture risk cannot beproven, nor can the effects of decreasing alcohol consumption be predictedwith certainty.
Exercise
Very many studies have shown the dependence of BMD on the level ofphysical activity. In particular, immobilization induces marked loss ofskeletal tissue, for example in an immobilized limb or during prolonged bed-rest (29). The relationship between everyday variations in physical activityand fracture outcomes is less secure. A number of case-control studies haveshown a relationship between customary exercise levels and fracture risk(11,30–33). The data are, however, inconsistent for different osteoporoticfractures and by sex (31,33), and these observational studies may bemisleading to the extent that individuals may have chosen a particularactivity because of their physical attributes, rather than the activity levelsthemselves determining their physical attributes. Moreover, it is likely thatbenefits are lost if individuals cease an exercise programme, and long-termcompliance is likely to be low (34,35). The value of exercise for five yearsaround the age of 40 years is therefore questionable later, at the age of 75years, especially where age is accompanied by other disorders (e.g. stroke). Inthe case of exercise, the optimal type and duration are also not known.
These considerations suggest that there is as yet no compelling evidence forthe efficacy of exercise programmes in fracture prevention. Notwithstanding,there is good evidence that the avoidance of immobilization whereverpossible is a valuable adjunct to a global programme for osteoporosis. Inaddition, regular physical activity is associated with improved health andreduced mortality generally (36). Thus, exercise can be encouraged butcannot be depended upon to reduce the fracture burden in the community.
Falls
Some stress upon a fragile bone is generally required to precipitate a fracture.Although fragility fractures may be defined as resulting from minimaltrauma, this is merely a convention to make the distinction from severe
241

trauma (e.g. road traffic accidents) capable of breaking any bone, includingan osteoporotic bone. In many cases, particularly with hip and wristfractures, a fall from a standing height is involved and the forces involved maybe substantial (37). Such falls become more common as people age. By oneestimate as many as 50% of women aged 85 years and older experience a fallin any year (38). The likelihood of falling (and fractures) increases asindividuals age, experience declining health and impaired vision, and losemuscle strength and balance. Side-effects from medications, such asorthostatic hypotension, sedation or disequilibrium, also contribute to falls(39). There may be an interrelationship between physical activity andliability to falls (40). A meta-analysis of seven trials which included anexercise intervention in elderly people indicated a 10% reduction in fallfrequency (41). No study to date, however, has shown a significant reductionin fracture rates (42). A component of the beneficial effects of vitamin Dmay be mediated by a decrease in falls and, in a recent meta-analysis, the useof vitamin D decreased the risk of falls by 22% (95% CI = 8%–36%)compared with patients taking placebo or calcium alone (43). Theminimization of skeletal trauma following falls has been inconsistentlyachieved by the use of hip protectors (44,45), though adequate compliancewith these devices has been a problem (46).
Recommendations
Although evidence that modifying lifestyle-related factors reduces fracturerisk is not considered compelling by some expert groups, there is generalagreement that data are of sufficient quality to suggest courses of action.Global programmes should include adequate attention to nutritional factors,particularly related to calcium and vitamin D. Cigarette smoking should beavoided, not solely because of its possible effects on skeletal metabolism, butfor the many other adverse effects associated with smoking. The avoidance ofexcessive intakes of alcohol is also recommended. It has been suggested thatintakes of greater than 14 units weekly in women and 21 units weekly in menare associated with adverse effects, and these thresholds are more or less inline with meta-analyses of the effects of alcohol consumption on fracture riskin this report. Note that a unit of alcohol is commonly defined as 10 gramsof alcohol, but this varies slightly by country. Another area of agreement isthat immobilization is an important cause of bone loss and fracture. Thedetrimental effect of immobility on bone mass is far greater than thebeneficial effect of additional exercise in an already ambulatory subject (47).Motor deficits attributable to neurological disorders such as hemiplegia orparaplegia are important risk factors for fracture (29), and support the viewthat the avoidance of immobilization is an important aspect of a globalstrategy.
Most of the world’s ageing population resides in developing countries whereneither bone densitometry nor drugs for osteoporosis are available.Population-based strategies are, therefore, the only practicable preventivemeasure. They can also be advocated as a component of the adequate care ofosteoporosis, even where high risk strategies are applied.
242

9.2 Case-finding without measurement of bone mineraldensityIn those countries where the utility of population screening is found wanting,case-finding strategies are widely accepted as a method of identifyingindividuals suitable for the treatment of osteoporosis (6,23,48–50). Thegeneral principles are that individuals are identified by the presence of riskfactors and subsequently undergo a BMD examination. When BMD is belowa given threshold, intervention for osteoporosis is recommended. As reviewedin section 7, the threshold for BMD that is used varies in different guidelines.Thus, both assessment and treatment focus critically on the estimation ofBMD. A major aim of this report has been to evaluate the utility of clinicalrisk factors for assessment, and the question arises of whether clinical riskfactors alone could be used for patient assessment in those Member Stateswith limited or no access to DXA.
The general characteristics of the combined use of clinical risk factorssuggest that this might be so. The gradient of risk per SD change in risk scoredepends upon age and the fracture outcome predicted (see section 7). Forosteoporotic fractures, excluding hip fractures, the gradient of risk with theuse of clinical risk factors is 1.4, 1.5, 1.6 and 1.6/SD at the ages of 50, 60, 70and 80 years, respectively. This is comparable with the use of central DXA atthe femoral neck for predicting these fracture outcomes (1.4, 1.5, 1.6 and1.7/SD, respectively). In the case of hip fracture prediction, gradients of riskwith clinical risk factors are higher than those to predict other osteoporoticfractures, but less than the gradients of risk provided by femoral neck BMD.For people aged 50 years, the gradient of risk with clinical risk factors is2.1/SD (compared with 3.7/SD for DXA) and decreases with age, so that atthe age of 80 years the gradient of risk is 1.8/SD (2.3/SD with DXA at thefemoral neck). Despite the poorer relative performance of the clinical riskfactors alone for hip fracture prediction, the gradient of risk is as good, if notbetter than that provided by many peripheral devices for the prediction of hipfracture. In a 10-year time frame, a technique with a gradient of risk of2.0/SD would have a sensitivity of 35% and a positive predictive value of13.6% when applied to men aged 65 years where 15% of the population isconsidered to be at high risk. The corresponding figures for women are 33%for sensitivity and 31% for positive predictive value (see section 7, Table 7.3).
A critical question in proposing the use of clinical risk factors alone forpatient assessment relates to the reversibility by pharmacologicalintervention of the risk so identified. The efficacy of inhibitors of boneresorption has been well characterized in individuals with low bone mass.Their efficacy in individuals with normal bone density is less secure and it hasbeen suggested that efficacy is less likely (51). Many recent studies indicate,however, that pharmacological interventions have efficacy in patients withosteopenia or in whom BMD was not assessed (19,52–57), although perhapsnot those selected on the basis of a high risk of falling (58).
243

A particular concern is whether treatment would be offered to individualswith normal BMD in whom the effects of treatment might be less thanadequate. This question is not entirely resolved, but it should be noted thatthere are several precedents provided by interventions with estrogens andbisphosphonates (52,59,60), and more variably with vitamin D with orwithout calcium (19,20), that show anti-fracture efficacy when given topopulations unselected on the basis of BMD. In addition, for patientsselected only on the basis of a prior fragility fracture or glucocorticoid use,there is strong evidence for the reversibility of risk (see section 5).
A further argument for the use of clinical risk factors in the absence of BMDmeasurement is that their use generally selects individuals with low BMD. Agood example is weight (or BMI) which can with age be used to predict lowBMD. Tests, such as the osteoporosis self-assessment tool (see section 7),have high sensitivity for the detection of osteoporosis. The question arises asto what extent patients selected by additional clinical risk factors alone havelow BMD independently of age.
This question has been addressed in one of the cohorts studied in section 5(Sheffield). The cohort was a randomly drawn sample of elderly women(aged 75 years or more) from Sheffield (61). Approximately 2000 womenwere assessed at baseline for risk factors for fracture, had a baseline BMDtest performed at the femoral neck and were followed up 6-monthly to recordfractures and deaths for 6700 patient–years.
In women characterized by significant risk factors without reference toBMD, mean BMD values decreased with increasing 10-year probability offracture (Table 9.1). In women above an arbitrary risk threshold, 10-yearprobability was approximately 1 SD lower than in women below thethreshold.
244

Table 9.1
Distribution of 10-year fracture probabilities in women assessed with and without BMDmeasurements
Fracture probability(% in 10 years) BMD (g/cm2)
With Without T-score AgeBMD BMD Mean 95% CI (SD units) (years)
<10
10–15 15 0.93 0.86–1.00 -0.13 77.8
15–20 302 0.85 0.84–0.86 -0.75 78.5
20–25 621 0.76 0.75–0.77 -1.50 80.3
25–30 312 0.78 0.76–0.80 -1.33 79.5
30–35 509 0.74 0.73–0.75 -1.67 79.6
35–40 245 0.66 0.64–0.68 -2.33 82.1
40–45 55 0.69 0.64–0.74 -2.08 80.6
45–50 45 0.67 0.64–0.70 -2.25 80.6
50–55 9 0.57 0.45–0.69 -3.08 82.1
Source: reference 61 (modified from Table 3).
In the cohorts used for the meta-analyses it was possible to assess the effectof clinical risk factors on BMD. For this example, BMI was dichotomized(<19 kg/m2), thus providing seven clinical risk factors. In the absence of riskfactors (53% of 31 385 men and women) the average Z-score for BMD was+0.08. With 1, 2, 3 or 4 clinical risk factors the average Z-score was -0.08, -0.24, -0.44 and -1.37, respectively. Thus individuals with, say, 3 clinical riskfactors have on average a BMD that is 0.52 SD below those without riskfactors. Similar findings have been reported in clinic-based studies wherepatient referrals follow the guidelines of the Royal College of Physicians,United Kingdom (62).
9.2.1 Performance characteristics of the use of clinical risk factorsFrom knowledge of the gradient of risk, the impact of case-finding on thebasis of the clinical risk factors can be computed where interventionthresholds are established. An example of intervention thresholds can beprovided for the United Kingdom, as discussed in section 8. For 10-year hipfracture probability, these vary from 1.10 at the age of 50 years and rise withage (Table 9.2). The proportion of the population selected with the use ofclinical risk factors alone, varies from 0.3% to 50% depending on age, and theaverage 10-year probability in those so identified to be at high risk, variesfrom 1.6% to 11.7% for hip fracture and from 8.6% to 22.9% for a majorosteoporotic fracture.
245

Table 9.2
Performance characteristics of the use of clinical risk factors alone, bone mineral density(BMD) testing alone or in concert with the use of clinical risk factors to identify high riskwomen in a United Kingdom setting
Age Gradient Threshold % with Proportion of Average 10-year(years) of risk probabilitya BMD population fracture probability
test selected (%) in population selected NNTc
Hip Osteoporoticb
Risk factors alone
50 2.05 1.10 0 3.1 1.6 8.6 33
60 1.95 2.64 0 2.6 3.3 13.6 21
70 1.84 5.24 0 20.5 6.6 18.9 15
80 1.75 8.52 0 46.9 11.7 22.9 13
BMD alone
50 3.7 1.10 100 7.5 2.2 8.4 34
60 3.1 2.64 100 6.8 5.1 14.1 20
70 2.8 5.24 100 18.6 10.8 22.0 13
80 2.3 8.52 100 41.7 17.6 27.3 10
BMD ± clinical risk factors
50 4.2 1.10 6.5 2.3 2.5 11.5 25
60 3.5 2.64 5.3 2.0 5.9 19.2 15
70 2.9 5.24 26.9 10.4 12.3 26.2 11
80 2.4 8.52 77.1 32.0 18.2 29.3 10aTen-year hip fracture probability.bClinical spine, distal forearm, hip or proximal humerus.cNumber needed to treat to prevent one osteoporotic fracture (defined as clinical spine, distalforearm, hip or proximal humerus), assuming an efficacy of 35%.
9.2.2 Application to clinical practiceThe number of risk factors
An example of the use of clinical risk factors alone is given in Table 9.3 basedon women from the United Kingdom with a BMI arbitrarily fixed at 24kg/m2. Hip fracture probabilities are given according to the number ofclinical risk factors present at different ages. The greater the number of riskfactors, the higher the probability. The range reflects the differing importanceof different clinical risk factors. These hip fracture probabilities can becategorized according to any chosen intervention threshold, for example thatderived for the United Kingdom in section 8. Four categories of risk can thusbe identified:
• Probabilities always below a threshold risk. Take, for example, in Table 9.3, an individual aged 50 years with two clinical risk factors. The average 10-year probability of hip fracture is 0.5% (range 0.2% – 1.1%) which lies consistently below the intervention threshold (>1.10% for 50 year olds).
• Probabilities sometimes above an intervention threshold. For example, the same clinical scenario, but in a woman aged 60 years,
246

gives an average 10-year hip fracture probability of 1.5%, which is below the intervention threshold (2.64% at the age of 60 years).However, the range of probabilities (0.9% – 2.7%) crosses the intervention threshold. Thus, her actual probability may exceed the threshold, depending on the nature of the two risk factors.
• Probabilities sometimes below an intervention threshold. An example is provided in women aged 50 years with four risk factors (probability = 1.8%, range 0.7% – 2.9%, compared to the age-specific intervention threshold of 1.10%).
• Probabilities consistently above a treatment threshold. For example,at the age of 80 years, the 10-year probability is 23% (range 13% – 37%) with three clinical risk factors, which exceeds the intervention threshold (8.52% at the age of 80 years), irrespective of the type ofclinical risk factor.
Table 9.3
Ten-year probability (%) of hip fracture and a major osteoporotic fracture (hip, clinical spine,forearm or proximal humerus fracture) in women from the United Kingdom with a BMI of24kg/m2
Agea (years)
50 60 70 80Number of CRFs Mean Range Mean Range Mean Range Mean Range
Hip fracture
0 0.1 - 0.4 - 1.4 - 4.2 -
1 0.3 0.2–0.5 0.8 0.6–1.3 2.6 2.0–3.0 7.8 5.7–14
2 0.5 0.2–1.1 1.5 0.9–2.7 4.7 3.1–6.3 14 8.5–2.4
3 0.9 0.4–1.9 2.6 1.3–4.7 8.4 5.4–12 23 13–37
4 1.8 0.7–2.9 4.6 2.3–7.0 15 11–21 36 21–49
5 3.1 1.4–4.3 7.9 4.8–10 25 21–30 51 33–61
6 5.6 - 13 - 39 - 66 -
Forearm, spine, proximal humerus or hip fracture
0 2.6 - 4.6 - 8.2 - 12 -
1 4.1 2.8–5.6 7.0 4.8–9.2 12 8.8–15 18 13–22
2 6.3 3.3–11 11 5.9–17 17 11–24 25 17–33
3 9.4 4.5–17 16 8.2–27 24 15–35 35 25–46
4 14 7.4–23 23 14–35 34 25–47 47 35–59
5 20 14–27 32 24–41 46 38–55 60 48–68
6 29 - 44 - 60 - 71 -
CRFs, clinical risk factors; -, no range.aIntervention thresholds for 10-year hip fracture probability in the United Kingdom set at:age 50years, 1.10%; age 60 years, 2.64%; age 70 years, 5.24%; age 80 years, 8.52%.
In practice, few individuals in the cohort material had four or more clinicalrisk factors (Table 9.4), which simplifies the tabular presentation
247

Table 9.4
Distribution (%) of clinical risk factors in men and women by age
Number of Age (years)riskfactorsa 50–59 60–69 70–79 80–89 90+
Men
0 39.0 43.8 51.9 61.3 43.11 44.4 42.3 39.0 32.9 54.92 15.0 13.0 8.5 5.6 2.03 1.6 0.9 0.6 0.2 0.0
Women
0 66.4 56.0 56.0 60.3 64.51 29.1 36.6 36.6 34.6 33.22 4.3 6.8 6.7 4.7 2.33 0.2 0.6 0.6 0.3 0a Excludes low BMI.
The categorization of women by age, the number of clinical risk factors andBMI is shown in Figs 9.1 and 9.2. Fig. 9.1 shows the categorization of womenaccording to hip fracture probability, whereas Fig. 9.2 gives thecorresponding probabilities for the major osteoporotic fractures. It isimportant to note that the categorization in each instance is based onthresholds of hip fracture probability.
Fig. 9.1
Ten-year probability of hip fracture in women from the United Kingdom, by age, body massindex (BMI) and the number of clinical risk factors (CRFs)
248

Fig. 9.2
Ten-year probability of a major osteoporotic fracture in women from the United Kingdom, byage, body mass index (BMI) and the number of clinical risk factors
Use of specific risk factors
Two or three clinical risk factors can readily be used in paper versions of theFRAX tool. Table 9.5 shows for women in the United Kingdom the way 10-year hip fracture probability is related to age, BMI and selected risk factorsappropriate for the assessment of glucocorticoid-induced osteoporosis. Apositive sign denotes probabilities that exceed the intervention thresholdsgiven in section 8 for the United Kingdom. In women taking glucocorticoidsbut without other risk factors, probabilities do not exceed the interventionthreshold except at the extremes of age and low BMI. Probabilities increasewith the chronic use of glucocorticoids in the presence of a prior fragilityfracture, so that more women exceed the intervention threshold. In thepresence of glucocorticoid exposure and a prior fracture, the fractureprobability exceeds the intervention threshold in all patients irrespective ofage. Clinical judgement must, however, be exercised in the interpretation ofrisks, since the probabilities computed are for individuals on average doses ofglucocorticoids. Patients taking higher than average doses will have higherfracture probabilities since there is a significant relationship betweenglucocorticoid exposure and fracture risk.
249

Table 9.5
Clinical scenarios where 10-year probabilities of hip fracture are characterized to be above(+) or below (-) an intervention threshold for women from the United Kingdom takingglucocorticoids, by age, BMI and the presence of a prior fragility fracture
BMI (kg/m2)
Age(years) 15 20 25 30 35
Glucocorticoids
50 + - - - -
60 + + - - -
70 + + - - -
80 + + + + -
Glucocorticoids and prior fracture
50 + + + + +
60 + + + + +
70 + + + + +
80 + + + + +
Algorithms can also be developed for other clinical contexts. Examplesinclude rheumatology clinics where the inclusion of rheumatoid arthritiswould be of value (Table 9.6). The use of risk factors such as smoking andexcessive alcohol use may be appropriate in the setting of general practice.Such algorithms can also be used either to direct patients for further tests,particularly for densitometry, or to avoid unnecessary densitometry. Asdescribed for glucocorticoid use above, clinical judgement should tempertreatment decisions.
Table 9.6
Clinical scenarios where 10-year probabilities of hip fracture are characterized to be above(+) or below (-) an intervention threshold for women from the United Kingdom withrheumatoid arthritis, by age, BMI, glucocorticoids and prior fragility fracture
BMI (kg/m2)Age(years) 15 20 25 30 35
Glucocorticoids50 + + - - -60 + + + - -70 + + + + -80 + + + + +
Prior fracture50 + + + - -60 + + + + -70 + + + + -80 + + + + +
Glucocorticoids and prior fracture50 + + + + +60 + + + + +70 + + + + +80 + + + + +
250

9.3 Case-finding with measurement of bone mineral densityIn those Member States where BMD tests are widely used, any of thedesignated risk factors can be integrated with information on BMD. Forsimplified versions suitable for charts, the same general approach can be usedas for case-finding without BMD, where BMD values are substituted forBMI. An example is given in Table 9.7 according to the number of riskfactors in men and women at the age of 60 years. In this example, the BMI isset to 25 kg/m2 but, as shown in section 7, variations in BMI have littleimpact on computed probabilities in the presence of BMD.
Table 9.7
Average 10-year fracture probability (%) in men and in women from the United Kingdom(aged 60 years), by the number of clinical risk factors (range given in parentheses)
Femoral neck BMD (T-score)Number of clinicalrisk factors -4 -3 -2 -1
Osteoporotic fracturea in women
0 23 12 7.7 5.5 1 32 (29–37) 18 (15–21) 11 (8.2–14) 8.1 (5.5–11)2 44 (38–55) 26 (19–34) 16 (10–24) 12 (6.7–18)3 58 (48–68) 35 (25–49) 23 (14–36) 16 (8.7–28)
Hip fracture in women
0 13 4.3 1.4 0.4 1 20 (14–23) 6.7 (4.6–7.9) 2.1 (1.4–2.5) 0.7 (0.5–0.8)2 29 (19–38) 10 (6.4–14) 3.3 (2.0–4.6) 1.0 (0.6–1.5)3 41 (28–55) 15 (9.6–23) 5.0 (3.1–7.7) 1.6 (1.0–2.5)
Osteoporotic fracturea in men0 21 11 6.6 4.4 1 31 (28–35) 16 (14–19) 9.6 (7.3–12) 6.4 (4.4–8.5)2 41 (35–51) 23 (18–29) 14 (9.5–20) 9.2 (5.5–14)3 53 (44–62) 31 (24–42) 19 (13–29) 13 (7.3–22)
Hip fracture in men
0 15 5.4 1.9 0.6 1 22 (16–26) 8.3 (5.7–9.7) 2.9 (2.0–3.4) 1.0 (0.7–1.1)2 31 (22–40) 12 (8.0–17) 4.3 (2.8–5.9) 1.5 (0.9–2.0)3 42 (31–54) 18 (12–25) 6.5 (4.2–9.4) 2.2 (1.4–3.3)
BMD, bone mineral density.aClinical spine, hip, forearm or proximal humerus.
In the United Kingdom, the intervention threshold at the age of 60 years is ahip fracture probability that exceeds 2.64%. This is exceeded in all men andwomen aged 60 years with a femoral neck T-score of –3 SD or less and, asexpected, with a less stringent T-score in men and women with multiple riskfactors. A more detailed estimate of probabilities (Table 9.8) shows that theintervention threshold is (coincidentally) rather close to that of the WHOthresholds for the diagnosis of osteoporosis. It should be noted, however, thatthe threshold is based on cost–utility analysis for the United Kingdom anddifferent thresholds will pertain in different health-care settings.
251

Table 9.8
Ten-year probabilities of hip fracture and osteoporotica fracture in men and women from theUnited Kingdom without clinical risk factors according to the T-score for femoral neck bonemineral density (body mass index is set at 24 kg/m2): an intervention threshold of 2.64% forhip fracture probability is exceeded in women with a T-score of –2.6 SD or less and in menwith a T-score of –2.2 SD or less
Women MenT-score(SD) Osteoporotica Hip Osteoporotica Hip
-2 7.62 1.35 6.53 1.85
-2.2 8.28 1.71 7.18 2.29
-2.4 9.05 2.16 7.94 2.85
-2.6 9.94 2.72 8.83 3.53aFracture of hip, spine, forearm or proximal humerus.
In the presence of risk factors, an average together with an interval is givensince the risk will vary according to the nature of the clinical risk factor, inmuch the same way as discussed for BMI (section 9.2). In many instances, therange is clearly above or clearly below the intervention threshold. Anexception in Table 9.7 is for hip fracture in women with two risk factors anda T-score of –2 SD at the femoral neck (average 3.3%; range 2.0% – 4.6%).Thus, the average probability exceeds the nominal intervention threshold.The opposite pertains in men with a T-score of –1 and three clinical riskfactors (average 2.2%; range 1.4% – 3.3%) in that the average risk lies belowthe threshold but the range exceeds this. As for BMI, this permits thecharacterization of probability estimates as:
• always below the threshold;
• always above the threshold;
• average above the threshold, but sometimes below;
• average below the threshold, but sometimes above.
The characterization of probabilities in this manner according to age and T-score is shown in Table 9.9. An interesting feature is that, althoughprobabilities increase with age, the increase is less than when BMI, ratherthan BMD is used. For example, in the presence of a single clinical risk factorand with a T-score of –1 SD, the 10-year hip fracture probability ranged from0.4% at the age of 50 years to 4.0% at the age of 80 years; a 10-fold difference(see Table 9.9). Women with a single clinical risk factor and a BMI of 24kg/m2 at the age of 50 years had a similar hip fracture probability (0.3%) butthe probability increased more than 25-fold to 7.8% at the age of 80 years (seeTable 9.3). Thus the use of BMD captures age-dependent risk morecompletely than the use of BMI.
252

Table 9.9
Average 10-year probability of hip fracture in women from the United Kingdom, by thenumber of clinical risk factors (body mass index is set at 24 kg/m2)
Number of clinical Femoral neck BMD (T-score)risk factors
-4 -3 -2 -1 0 +1Age 50
0 12a 3.1a 0.8 0.2 0.1 0.01 18a 5.0a 1.3a,b 0.4 0.1 0.02 27a 8.0a 2.1a 0.6 0.2 0.03 39a 12a 3.4a 0.9c 0.2 0.1
Age 600 13a 4.3a 1.4 0.4 0.1 0.01 20a 6.7a 2.1 0.7 0.2 0.12 29a 10a 3.3a,b 1.0 0.4 0.13 41a 15a 5.0a 1.6 0.5 0.2
Age 700 16a 6.2a 2.3 0.9 0.4 0.11 25a 10a 3.9 1.5 0.6 0.22 38a 16a 6.4a,b 2.5 1.0 0.43 53a 25a 10a 4.2c 1.7 0.7
Age 800 19a 9.2a 4.3 2.1 1.0 0.51 31a 17a 8.1a,b 4.0c 2.0 1.02 45a 27a 14a,b 7.3c 3.6 1.83 59a 40a 23a 13a,b 6.4a 3.2aAverage value above a treatment threshold.bSome values in the range below a treatment threshold.cSome values in the range above a treatment threshold.
Examples of the use of specific risk factors (rather than the number of riskfactors) are given in Table 9.10 in the context of glucocorticoid-inducedosteoporosis. In the United Kingdom setting, probabilities exceed anintervention threshold in women taking glucocorticoids at a T-score below –2SD at the femoral neck (below –1 SD at the age of 50 years). In the presenceof a prior fracture, intervention probabilities are exceeded with a T-score ofsomewhat less than –1 SD.
253

Table 9.10
Clinical scenarios where 10-year hip fracture probabilities are characterized to be above (+)or below (-) an intervention threshold in men and women from the United Kingdom takingglucocorticoids, by age, T-score for bone mineral density, and the presence of a priorfragility fracture
T-score in men T-score in women
Age(years) -4 -3 -2 -1 0 -4 -3 -2 -1 0
No risk factors50 + + + - - + + - - -60 + + - - - + + - - -70 + + - - - + + - - -80 + - - - - + + - - -
Glucocorticoids50 + + + - - + + + - -60 + + + - - + + - - -70 + + - - - + + - - -80 + - - - - + + - - -
Glucocorticoids and prior fracture50 + + + + - + + + - -60 + + + - - + + + - -70 + + + - - + + + - -80 + + - - - + + + - -
A more detailed appraisal derives an intervention threshold for womentaking glucocorticoids and with a prior fracture. Hip fracture probabilitiesexceed an intervention threshold with T-scores of –1.2, –1.6 and –1.9 SD,respectively, at the age of 50, 60, and 70 years and above (data not shown). Inwomen with the same clinical scenarios but who have rheumatoid arthritis,the respective T-score thresholds are –1.0, –1.3 and –1.5 SD.
The use of T-score thresholds is a further approach by which a number ofclinical risk factors can be evaluated. A similar approach has been used fortargeting lipid-lowering drug therapy in coronary artery disease (63). Itsadaptation to hip fracture risk is shown in Table 9.11 for up to four clinicalrisk factors in any combination. The relevant combinations of risk factorsare found at the head of the table. The main body of the table gives T-scoresaccording to age. For example, for a woman with a prior fracture and takinglong-term glucocorticoids, a T-score value is given at –1.2 SD at the age of 50years. If a woman has a T-score at that value or lower, then her fractureprobability exceeds an intervention threshold.
254

Table 9.11
Table for targeting interventiona in women from the United Kingdom, by clinical risk factors(upper panel) and T-score for femoral neck bone mineral density (lower panel)
Number of clinical risk factors
4 3 2 1 0
Prior fracture + - + + + + + + - - - + - - - -
Family history + + - + + + - - + + - - + - - -
Smoking + + + - + - + - + - + - - + - -
Glucocorticoids + + + + - - - + - + + - - - + -
Age (years)
50 -0.8 -1.3 -0.8 -1.2 -1.3 -1.6 -1.3 -1.2 -1.8 -1.8 -1.4 -1.7 -2.2 -1.8 -1.8 -2.3
60 -1.1 -1.6 -1.1 -1.5 -1.6 -2.1 -1.6 -1.6 -2.1 -2.0 -1.6 -2.1 -2.6 -2.2 -2.1 -2.6
70 -0.5 -1.0 -1.3 -1.0 -1.1 -1.7 -1.9 -1.9 -1.6 -1.5 -1.8 -2.4 -2.1 -2.4 -2.3 -2.9
80 +0.7 +0.3 -1.4 +0.1 0 -0.6 -2.0 -1.9 -0.4 -0.3 -1.7 -2.6 -1.0 -2.4 -2.3 -3.0
aA patient whose value falls at or below the T-score given has a probability of fracture that exceedsan intervention threshold.
9.3.1 Performance characteristics of case-finding with measurement ofbone mineral densityThe impact of case-finding on the basis of BMD tests alone is shown in Table9.2 for women in the United Kingdom. The proportion of the populationselected to be above a treatment threshold varies from 7.5% at the age of 50years to 41.7% at the age of 80 years, with a 10-year hip fracture probabilitythat ranges from 2.2% to 17.6%, respectively. When this strategy is comparedwith the use of clinical risk factors alone, BMD testing in all individualsidentifies a higher risk population because of the higher gradient of risk. Atyounger ages, a higher proportion of patients is identified above thetreatment threshold, whereas at older ages fewer are selected than by usingclinical risk factors alone. Overall, the proportion of the population selectedvaries little between strategies, but a higher risk group is selected where BMDtests are used.
9.3.2 Approaches to practice guidelinesThe combination of assessments with and without BMD can be used to forma basis for the development of practice guidelines. An example is provided inFig. 9.3, in the context of patients with rheumatoid arthritis takingglucocorticoids. In women with rheumatoid arthritis and a prior fragilityfracture, hip fracture probabilities are sufficiently high that treatment mightbe recommended from the age of 50 years irrespective of other clinical riskfactors, since probabilities consistently exceed the treatment threshold. Forwomen without fractures, BMD measurement might therefore be reserved forwomen without a prior fracture. As noted above, intervention thresholds,based on cost–utility are then a T-score of –1.0, –1.3 or –1.5, respectively, atthe ages of 50, 60, and 70 years or older. In practice, BMD might bemeasured in all patients in order to form a baseline for monitoring treatment,but the decision to treat is not predicated by the measurement.
255

Fig. 9.3
Assessment algorithms for women with rheumatoid arthritis taking glucocorticoids
BMI, body mass index; BMD, bone mineral density.
It is important to recognize that the example above is based on probabilitiesderived from individual clinical scenarios, rather than on populations. Indeveloping practice guidelines, consideration of populations is relevant;somewhat different conclusions might be derived where decision trees arebased on population-based probabilities or cost–utility. For example, in Fig.9.3, a decision step is taken in women aged 60–69 years without a priorfracture on the basis of BMD at or below a T-score of –1.3 SD. The rationaleis that a woman with a T-score of –1.3 can be cost-effectively treated, whereasat a value of –1.0 SD intervention is cost ineffective. In populations it maywell be cost effective to treat all women with a BMD T-score of less than, say,–1.0 SD.
The manner in which the use of other clinical risk factors can be combinedwith BMD is discussed in the following section.
9.4 Selective use of bone mineral density with clinical riskfactorsThe scenarios given in sections 9.2 and 9.3 consider the use of BMD withclinical risk factors or the use of clinical risk factors alone, i.e. the use ofBMD in all case-finding or in none. It is possible, however, to envisagescenarios between these extremes. Such strategies would be appropriate forthose Member States where access to DXA is limited. A primary objective ofa case-finding strategy in osteoporosis is to identify individuals above or
256

below a threshold fracture risk. When patients are categorized by risk factorsalone, the following categories pertain:
• individuals much above a threshold risk;
• individuals close to a threshold risk in whom BMD might be measured to more accurately categorize risk;
• individuals much below a threshold risk.
It might be assumed that patients in the first or last categories above areunlikely to have their categorization of risk changed by performing a BMDtest. The assumption can be tested by determining the probability that aBMD test would change an individual’s categorization from high to low riskor vice versa.
This requires a consideration of the concordance of risk assessment withclinical risk factors alone and in combination with BMD. The Sheffieldcohort has been used by way of illustration (61), taking BMI andglucocorticoid use as risk factors. An intervention threshold for any fracturewas arbitrarily set at a 10-year probability of 35% (close to an individual atthe threshold for osteoporosis).
The 10-year fracture probabilities were computed in the absence of a BMDmeasurement and with the inclusion of BMD, and the discordance inclassification of individuals (above or below the intervention threshold) wasexamined using the two approaches. With the use of clinical risk factorsalone, the 10-year probability of fracture ranged from 11% to 55% with amean of 28% (± SD 7%). Approximately 17% of women lay above thetreatment threshold of a 35% 10-year fracture probability (Table 9.12) whenbased on the use of clinical risk factors alone. When BMD was undertaken,210 women (10%) changed category from low risk to high risk and 109women (5%) changed category from high risk to low risk. Thus, errors ofclassification were found in a minority (210 + 109 women, or 15%).
Reclassification was most frequent close to the threshold value chosen (seeTable 9.12). Conversely, errors were less frequent the larger the differencebetween the calculated probability using clinical risk factors and theintervention threshold. For example, no women with a probability of fracturebetween 0% and 15% were re-classified and none with a probability of morethan 50% needed to be reclassified with the additional use of BMD. Thisindicates an important principle, namely that not all patients require a BMDtest to assess fracture risk.
257

Table 9.12
Distribution of 10-year fracture probabilities in women assessed with and without bonemineral density (BMD) measurements
Number of women
Fractureprobability Percentage(% in 10 years) Assessed Assessed reclassified
without BMD with BMD Reclassified with BMD
0–5
5–10 9
10–15 15 76
15–20 302 349 1 0.04
20–25 621 502 9 0.42
25–30 312 399 36 1.70
30–35 509 323 164 7.76
Subtotals (0–35) 1 759 1 658 210
35–40 245 218 99 4.68
40–45 55 126 8 0.38
45–50 45 59 2 0.09
50–55 9 35
55–60 10
60–65 6
65–70 1
70–75
Subtotals (35+) 354 455 109
Source: reference 61 (adapted from Table 3).
9.4.1 Threshold probabilities of risk for assessment of bone mineraldensityThreshold probabilities can be used to determine the proportion of thepopulation in whom BMD assessment would be required to optimize a case-finding strategy. If P1 is the probability accepted of reclassifying a high-risk
patient to low risk, then if P1 is exceeded a BMD measurement would be
required. Similarly, if P2 is the probability accepted of reclassifying a low-risk
patient as high risk, then a BMD measurement would be required if P2 is
exceeded.
The proportion of patients that require a BMD test is shown in Table 9.13according to the probability of reclassification. If a very low probability ofreclassification is accepted, say P1 and P2 = 0.0, then 354 patients judged to be
at high risk without BMD would require a BMD measurement, and 1759patients judged clinically to be at low risk would require a BMDmeasurement (i.e. the whole sample). At the other extreme, accepting a higherprobability of reclassification of say 0.5, then 59 individuals (2.8% of total)
258

would require a BMD measurement. A higher probability ofmisclassification might be accepted for high to low risk (e.g. P1 = 0.8),
whereas a low probability might be accepted for low to high risk (e.g. P2 =0.2). Under these assumptions, no individuals considered to be at high riskwould require a BMD measurement since the probability of reclassificationwas consistently less than 0.8. In contrast, 452 women classified initially atlow risk would require a BMD test, representing 21% of the population. Thisstrategy implies that 13% (59 of 455) high-risk women were not detected andthe proportion of reclassified women of the whole population was 8% (59 +109 of 2113). The requirements for BMD testing for other permutations ofP1 and P2 are given in Table 9.13.
Table 9.13
Percentage of 2113 women aged 75 years or more in whom bone mineral density (BMD) testswould be required to classify a fracture risk according to the probabilities ofmisclassification accepteda
P2
P1 0 0.1 0.2 0.3 0.4 >0.5
0 100 47.8 38.1 30.6 22.9 16.8
0.1 96.4 44.2 34.5 27.0 19.2 13.1
0.2 94.9 42.7 33.1 25.6 17.8 11.7
0.3 92.7 40.5 30.9 23.3 15.6 9.5
0.4 89.9 37.7 28.0 20.5 12.7 6.6
0.5 86.0 33.8 24.2 16.7 8.9 2.8
>0.6 83.2 31.0 21.4 13.9 6.1 0
Source: reference 61 (Table 4).
P1 , the probability of reclassifying a patient at high risk to low risk with a BMD test.
P2 , the probability of reclassifying a patient at low risk to high risk with a BMD test.
aThe threshold between high and low risk was set at 35% ten-year fracture probability, which wasfound in 16.8% of the population if a BMD test was not used. Given the assumptions described inthe text (P1> 80% and P2>20%), BMD measurements would be required in 21.4% of the
population.
The clinical characteristics of women allocated to high and low risk using the example above isshown in Table 9.14. As expected, there were highly significant differences in the risk indicators,as well as in the fracture outcomes. The T-score for BMD at the hip was –2.96 SD for the high-riskgroup and –1.79 SD for the low-risk group.
259

Table 9.14
Clinical characteristics of women identified at high or low risk using clinical risk factors andthe selective use of bone mineral density (BMD) tests: base case where P1=0.8 and P2=0.2
Low risk High risk P<
Age (years) 79.6 ± 3.7 81.1 ± 4.3 0.001
Height (cm) 156 ± 6 154 ± 6 0.001
Weight (kg) 67.3 ± 11.6 56.7 ± 8.8 0.001
BMI (kg/m2) 27.6 ± 4.4 23.6 ± 3.3 0.001
Prior fracture (%) 36.6 97.2 0.001
Hip BMD (g/cm2) 0.79 ± 0.12 0.64 ± 0.13 0.001
T-score <–2.5 SD (%) 22 73 0.001
Corticosteroids (%) 4.9 24.0 0.001
Subsequent fracture (%) 10.9 21.0 0.001
Subsequent osteoporotic fracture (%) 8.6 18.8 0.001
Subsequent hip fracture (%) 2.0 5.7 0.001
Source: reference 61 (Table 5).
P1, the probability of reclassifying a patient at high risk to low risk with a BMD test.
P2, the probability of reclassifying a patient at low risk to high risk with a BMD test.
BMI, body mass index.
The same principles could be applied to screening (64–67) and therebyimprove the cost–effectiveness of screening by decreasing the burden ofBMD tests required.
The present example is confined to a randomly selected cohort of womenaged 75 years or more from the United Kingdom. The prevalence of riskfactors and their importance for fracture prediction will, however, differ byage and sex and possibly also in different regions of the world. For thisreason, these data should not be applied to other settings, although thegeneral principles still apply.
A further example is provided in Fig. 9.4, which shows the distribution ofrisk in women aged 65 years drawn from the European cohort material forthe meta-analyses performed in section 5, comprising the Sheffield Cohort,the Rotterdam Study, OFELY, Kuopio and the two cohorts fromGothenburg. A total of 12 027 men and 33 157 women aged 50 years or morewere studied. Approximately 250 000 patient years of follow-up wereavailable, during which time there were approximately 1100 hip fractures. Theclinical risk factors included age, BMI (higher or lower than 25 kg/m2),previous fragility fracture, a maternal history of any fragility fracture,smoking (ever versus never), long-term use of glucocorticoids, and secondarycauses of osteoporosis (68).
260

Fig. 9.4
Distribution of 10-year hip fracture probability in women aged 65 years from the EVOS/EPOS,Sheffield, Rotterdam, OFELY, Kuopio and Gothenburg studies, with an intervention thresholdof 10-year hip fracture probability set at 4%: (a) categorization of individuals from riskassessment giving a category at low risk (67%), a category at high risk (9%), and anintermediate category of risk (14% + 10%) in whom risk stratification is improved by theadditional measurement of BMD; (b) categorization with a more liberal use of BMI tests
EVOS, European Vertebral Osteoporosis Study; EPOS, European Prospective Osteoporosis Study;OFELY, L’os des femmes de Lyon; BMD, bone mineral density; BMI, body mass index.
In this example of women aged 65 years, the intervention threshold was setat a 10-year hip fracture probability of 4% and reclassification probabilitieswere set at P1=0.8 and P2=0.2. Thus BMD tests could be avoided in 67% of
women because of very low risk and in 9% because of very high risk.Furthermore, BMD could aid in the risk stratification in 24% of the women(14% who lay below the threshold based on clinical risk factors alone plus10% who lay above the threshold based on clinical risk factors alone). Inpractice, thresholds can be set at any limit. A further example is given in Fig.9.3.
9.4.2 Application to the United KingdomWhen the intervention thresholds are used for the United Kingdom, thelimits around the threshold can be set according to the probabilities acceptedfor reclassification when information from BMD is added to that derivedfrom clinical risk factors. The upper and lower limits are given in Table 9.15,where the probabilities of reclassification are set at P1=0.8 and P2=0.2, as
discussed above. For example, at the age of 50 years, an individual with a 10-year hip fracture probability of anywhere between 0.92% and 1.91% on thebasis of clinical risk factors alone would have a BMD test to more accurately
261

characterize probability. Where the combination of the clinical risk factorsand BMD give a probability that exceeds the intervention threshold,treatment would be recommended.
Table 9.15
Performance characteristics for the use of clinical risk factors and the selective use of bonemineral density (BMD) tests
Age Intervention Upper and % tested % selected False negativesc
(years) thresholda lower limitsb by BMD for treatment (%)
50 1.10 0.92–1.91 6.5 2.3 5.3
55 1.81 1.48–2.87 3.8 3.1 4.0
60 2.64 2.27–4.68 5.3 4.4 4.9
65 3.70 3.21–8.70 18.9 15.9 9.1
70 5.24 3.03–13.38 26.9 10.4 8.9
75 6.87 5.30–18.72 45.0 17.5 6.7
80 8.52 2.95–25.58 77.1 32.0 1.6
85 8.99 3.48–27.24 90.9 42.5 0.5
aTen-year hip fracture probability.bP1 and P2 set at 0.8 and 0.2, respectively, where P1 is the probability of reclassifying a patient at
high risk to low risk with a BMD test, and P2 is the probability of reclassifying a patient at low risk
to high risk with a BMD test.cIndividuals at high risk unselected by the strategy.
Table 9.15 also shows the effect of such a strategy on the requirements forBMD testing. The proportion of the population screened with BMD variesfrom 4% to 90%, depending on age. The proportion selected for treatmentvaries from 2.3% at the age of 50 years to 42.5% at the age of 85 years. Thefalse negative rate, i.e. those who are categorized at low risk but with a BMDmeasurement would have been designated at high risk, is consistently lessthan 10%.
9.4.3 Performance characteristics of selective use of bone mineraldensityThe performance characteristics of the selective use of BMD measurement inconjunction with clinical risk factors is shown in Table 9.2 and comparedwith use of BMD alone or the clinical risk factors alone. When comparedwith the use of BMD alone, the selective use of BMD with clinical riskfactors identifies a slightly lower proportion of women above an interventionthreshold. This, however, is not at the expense of fracture risk in thepopulation identified. Indeed, fracture probabilities were higher, because ofthe higher gradients of risk. The major difference between the use of BMDalone and its use with clinical risk factors lies in the number of BMDmeasurements required.
262

A further way of assessing performance characteristics is to compare theselective use of BMD using the FRAX algorithm with the guidance currentlygiven in Europe, whereby individuals with a clinical risk factor arerecommended for a BMD test, and recommended for treatment where the T-score for BMD is <–2.5 SD. There are thus three categories of individualidentified: those with clinical risk factors and osteoporosis; those with one ormore clinical risk factors but without osteoporosis; those without clinical riskfactors. Only the first category is treated.
The FRAX algorithm is highly specific (Table 9.16). For example, at the ageof 50 years, 27 individuals are identified for treatment, of whom 25 have a 10-year hip fracture probability that lies above the intervention thresholddescribed for the United Kingdom in section 8. By contrast, the sensitivity islow. At the age of 50 years, 68 high-risk individuals are not detected (61+7;Table 9.16), the majority of whom have a clinical risk factor. Thus, only 27%of high-risk individuals are detected at 50 years of age, a proportion that risesto 47% at the age of 80 years. Therefore, the majority of high-risk patients arenot detected.
Table 9.16
Simulation of Royal College of Physicians guidelines by age, where N is the number ofindividuals in each triage category per 1000 of the population at that age, and n is thenumber of individuals per 1000 with a 10-year hip fracture probability that exceeds anintervention threshold for the United Kingdom
Individuals with CRF Individuals with CRF No CRFand osteoporosis but no osteoporosis
Age(years) N n N n N n
50 27 25 512 61 461 7
60 65 52 487 23 448 6
70 115 100 455 73 430 36
80 189 168 401 94 410 93
CRF, clinical risk factor.
These performance characteristics of the guidelines of the Royal College ofPhysicians (6) can be compared with the use of clinical risk factors and theselective use of BMD tests. An example is shown in Table 9.17. In thisexample, P1 and P2 are set so that the total numbers of BMD tests are similar
to those required to fulfil the Royal College of Physicians guidance. At theage of 50 years, 88% of high-risk individuals are detected compared with 27%with the Royal College of Physicians algorithm. Thus, for the same numberof BMD tests, many more high-risk individuals are detected by takingaccount of that component of risk given by the clinical risk factors.
263

Table 9.17
A comparison of the performance of the guidance of the Royal College of Physicians (RCP)and the use of clinical risk factors (CRFs) with the selective use of bone mineral density(BMD)
RCP guidance CRFs ± BMD
Age BMD High-risk patients Efficiency of BMD High-risk patients Efficiency of(years) testsa detected (%) BMD testsb testsa detected (%) BMD testsb
50 539 27 4.2 538 88 15.2
60 552 64 9.4 507 90 14.3
70 570 48 17.5 552 82 31.1
80 592 47 28.4 562 85 53.5
Source: reference 6 and authors’ estimates.aPer thousand individuals at each age.bPercentage of BMD tests where a high risk individual is selected.
An alternative view is that fewer BMD tests are required to identify the samenumber of high-risk individuals with the use of clinical risk factors than withthe Royal College of Physicians guidance.
Savings in BMD testing have been independently found in the EPIDOS study(69) in women aged 75 years or more followed for an average time of 3.9years. The treatment threshold was set at a twofold increase in hip fracturerisk. When a triage system was used, 10% of women required a BMD test,compared with 50% using the current case-finding strategy recommendationsin Europe (23,49).
It should be acknowledged that physicians may be reluctant to givepharmacological interventions without objective evidence of a diagnosis ofosteoporosis or other BMD threshold. In practice, BMD testing might beconsidered in individuals characterized at high risk, but in whom a test wasnot required for this purpose, in order to establish a baseline for monitoringtreatment. In such cases it might be appropriate to measure BMD at thelumbar spine, rather than the hip, if it could be shown that the spinal site ismore predictive of the effects of pharmacological interventions. In otherwords, a BMD test would be done in order to judge the effects of treatmentrather than to decide whom to treat. This approach may be more logical thanBMD testing at the hip and may still be relatively economic
9.4.4 Alternative strategies for the selective use of bone mineral densityThe examples given above have used a fixed probability of reclassification offracture risk to determine the requirements for BMD testing (e.g. P1 = 0.8; P2
= 0.2). This results in a given proportion of the population receiving a BMDtest at any given age. The proportion varies from 6.5% at the age of 50 yearsto 77% at the age of 80 years (see Table 9.15). These probabilities are,however, arbitrary and could be set at a number of different levels (see Fig.
264
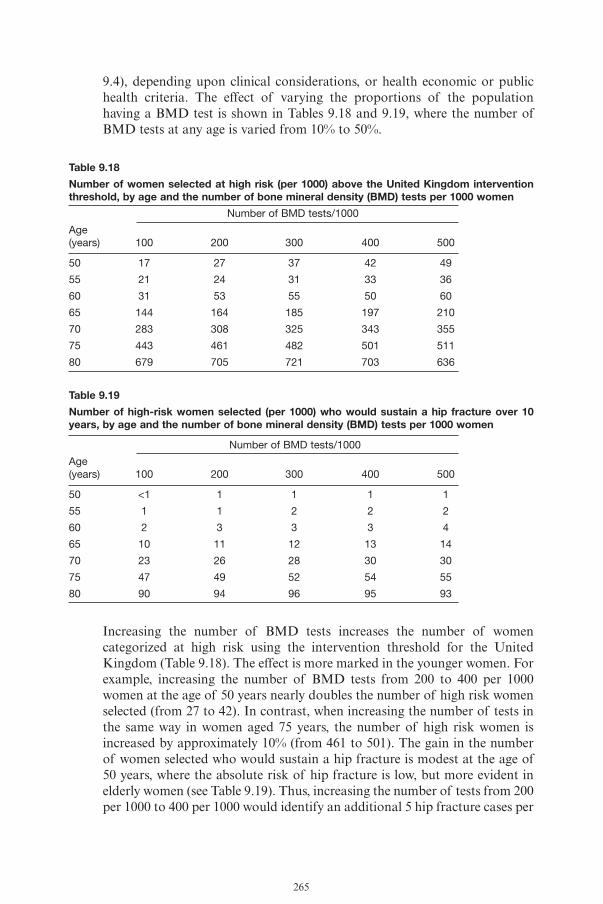
9.4), depending upon clinical considerations, or health economic or publichealth criteria. The effect of varying the proportions of the populationhaving a BMD test is shown in Tables 9.18 and 9.19, where the number ofBMD tests at any age is varied from 10% to 50%.
Table 9.18
Number of women selected at high risk (per 1000) above the United Kingdom interventionthreshold, by age and the number of bone mineral density (BMD) tests per 1000 women
Number of BMD tests/1000
Age(years) 100 200 300 400 500
50 17 27 37 42 49
55 21 24 31 33 36
60 31 53 55 50 60
65 144 164 185 197 210
70 283 308 325 343 355
75 443 461 482 501 511
80 679 705 721 703 636
Table 9.19
Number of high-risk women selected (per 1000) who would sustain a hip fracture over 10years, by age and the number of bone mineral density (BMD) tests per 1000 women
Number of BMD tests/1000
Age(years) 100 200 300 400 500
50 <1 1 1 1 1
55 1 1 2 2 2
60 2 3 3 3 4
65 10 11 12 13 14
70 23 26 28 30 30
75 47 49 52 54 55
80 90 94 96 95 93
Increasing the number of BMD tests increases the number of womencategorized at high risk using the intervention threshold for the UnitedKingdom (Table 9.18). The effect is more marked in the younger women. Forexample, increasing the number of BMD tests from 200 to 400 per 1000women at the age of 50 years nearly doubles the number of high risk womenselected (from 27 to 42). In contrast, when increasing the number of tests inthe same way in women aged 75 years, the number of high risk women isincreased by approximately 10% (from 461 to 501). The gain in the numberof women selected who would sustain a hip fracture is modest at the age of50 years, where the absolute risk of hip fracture is low, but more evident inelderly women (see Table 9.19). Thus, increasing the number of tests from 200per 1000 to 400 per 1000 would identify an additional 5 hip fracture cases per
265

1000 at the age of 75 years, whereas at the age of 50 years the additionalnumber would be less than 1 (0.3 per 1000).
9.5 Resource implications for dual energy X-rayabsorptiometryEstimates have been made of the potential requirements for DXA in Europeusing several possible strategies for osteoporosis management (68). The firststrategy to be considered was screening with the use of BMD, targeted towomen at the age of 65 years, assuming 100% compliance. This age waschosen since screening of women at 65 years of age with BMD tests isadvocated in some Member States (50,66), and health economic analyses inEurope and the United States suggest that a meaningful proportion ofwomen at this age have a fracture risk above a threshold at which interventionbecomes cost effective. In addition to screening women at the age of 65 years,account was taken of the requirements for those aged 66 years or more,amortized over a 10-year interval.
The second strategy to be considered was a screening policy based on theelicitation of clinical risk factors every 10 years in women from the age of 65years. BMD tests would be offered in those close to a threshold risk, asoutlined above (61). It was assumed that all patients identified above the riskthreshold would have a BMD test (femoral neck or lumbar spine), whichwould be repeated in 2 years.
The third scenario was a case-finding strategy that is currently applied inseveral European countries and supported by the European Union(6,23,48,49). This envisages the referral of women with strong risk factorsfor fracture for densitometry. The risk factors examined were low body massindex (<19kg/m2), prior fragility fracture, current or ever long-term use ofglucocorticoids, parental history of hip fracture, secondary causes ofosteoporosis (e.g. rheumatoid arthritis), excessive alcohol use (>2 units daily)and current smoking. It was additionally assumed that individuals over theage of 65 years would be tested over the ensuing 10 years.
9.5.1 Current use of dual energy X-ray absorptiometryA survey was undertaken of the Committee of Scientific Advisors of theInternational Osteoporosis Foundation to determine the service use of DXA(68). Details of service throughput were provided by the 23 centres thatresponded. On average, 3000 patients were screened annually per centre, witha staffing requirement of 2.39 full-time equivalents to service this workload.On average 1256 patients were scanned by each DXA unit per year, usually(91%) at both the lumbar spine and proximal femur. This informationprovided the basis for the assumptions used in the analysis below.
266

9.5.2 Requirements of dual energy X-ray absorptiometry for riskassessmentThe first strategy envisaged screening all women with DXA at the age of 65years. The target population comprises the 4 045 000 women in Europe at theage of 65 years (70). That target population would require 3231 DXA units,or 4.42 DXA machines per million of the total population. That calculationignores the unscreened population aged 66 years or more. If women aged 66years or more are included and assuming that they are screened over a 10-year period, the requirement for DXA units would be 6.79 per million of thetotal population, giving a total requirement of 11.2 units per million (Table9.20).
Table 9.20
Requirements for dual energy X-ray absorptiometry (DXA) units for assessment of womenusing three different scenarios, and the requirements to monitor treatment in women at theage of 65 years and in women above this target age, amortized over 10 years
Age 65 years Age >65 years Total
Strategy Units Units/million Units Units/million Units Units/million
Screening women with BMD 3 321 4.42 4 944 6.79 8 165 11.21
Clinical case-finding with selective use of BMD 767 1.05 2 301 3.16 3 068 4.21
Classic case-finding strategy 1 481 2.03 2 423 3.33 3 904 5.36
Monitoring treatment 966 1.33 3 686 5.06 4 652 6.39
Source: reference 68 (Table 2).
BMD, bone mineral density.
The second strategy envisaged screening women at 10-yearly intervals byclinical risk factors, and referring a proportion of those women for DXA.From the distribution of hip fracture risk determined by the use of clinicalrisk factors at the age of 65 years, and an intervention threshold set at a 10-year hip fracture probability of 4%, screening all women at the age of 65years would require 767 DXA units or 1.05 per million of the totalpopulation. Also testing women over the age of 65 years over 10 years wouldgive an additional requirement of 2301 DXA units or 3.16 per million of thepopulation, with a total requirement of 4.21 units per million (see Table9.20).
The third strategy was to identify women with strong risk factors for fractureand refer these for densitometry. The prevalence of these risk factors (Table9.21) varied from approximately 29% to 46%, depending on age. BMD testsat the age of 65 years would require 1481 units or 2.03 units per million ofthe total population. If BMD tests were also to be undertaken in women agedmore than 65 years with these risk factors at a prevalence of 46%, thenapproximately 30 million women would require testing, or 3 million per yearamortized over a 10-year interval, resulting in a requirement of 2423 scannersin Europe. This is equivalent to 3.33 units per million of the population (seeTable 9.20).
267

Table 9.21
Prevalence (%) of risk factors for fracture in European women and men
Age range Low Current Prior Parental history Rheumatoid Alcohol Any risk(years) BMI smoking fracture Glucocorticoids hip fracture arthritis 3+ units factor
Women
50–59 1.3 16.2 17.8 4.5 5.1 - 16.1 28.7
60–69 1.5 18.4 25.8 4.5 6.4 - 14.1 36.5
70–79 2.1 10.4 31.7 5.8 7.1 2.4 10.0 35.3
80–89 4.0 4.7 31.3 4.6 4.9 2.2 7.2 32.4
90+ 0.8 3.7 22.0 2.2 6.9 7.9 0.0 26.8
Men
50–59 0.5 35.2 37.2 3.2 7.8 - 42.3 43.9
60–69 1.2 28.5 29.7 3.2 9.6 - 38.8 42.0
70–79 1.4 22.4 25.0 3.4 8.0 - 35.0 38.4
80–89 4.6 21.3 15.8 2.2 6.0 - 32.4 31.1
90+ 7.7 42.4 8.6 2.9 33.3 - 50.0 62.9
BMI, body mass index; -, no data.
9.5.3 Requirements of dual energy X-ray absorptiometry to monitortreatmentTwo BMD tests could be envisaged in women committed to treatment. Therequirements for DXA differ between the scenarios, since some patientswould have had a BMD test for assessment and not require a further BMDtest at the start of treatment.
For the selective use of BMD (the second strategy in Table 9.20), the steadystate requirements would be 3068 scanners or 4.21 units per million of thepopulation. The annual requirement for monitoring is for 4652 scanningunits and a requirement of 6.39 units per million of the general population(see Table 9.20). Thus, the total for assessment plus monitoring of treatmentis 10.6 scanning units per million of the total population.
The estimated requirements for DXA are relatively sound, in the sense thatthey are largely based on population demography. The major uncertaintyrelates more to the impact of the strategies modelled. For the threeassessment strategies, an uptake of 100% is assumed, which is highlyimprobable in any country. Rather, the numbers estimated should be taken asthe maximum requirements for each scenario. Uptake will vary according tothe health-care setting (particularly reimbursement for DXA), and health-care priorities, since the capital costs of DXA are similar throughout Europe.
Not surprisingly, the requirement for DXA is greatest for the scenario ofwidespread population screening, where in excess of 8000 densitometers or11.2 units per million of the general population would be required. Thiscontrasts with the classic case-finding strategy that is currently practised in
268

many European countries and has a DXA requirement of 5.36 units permillion of the population. In Sheffield, where opportunistic case-finding hasbeen practised for more than 10 years, referrals for DXA are appropriate inthe sense that they follow the guidelines of the Royal College of Physicians(62). The service provision for the catchment area amounts to approximately4.0 DXA units per million of the population (E.V. McCloskey, personalcommunication, 2004). Assuming that half these tests are for the monitoringof treatment rather than for the initial assessment, this might suggest anuptake rate of somewhat less than 40%.
The least requirement for DXA included the use of clinical risk factors andthe subsequent selective use of BMD, since not all individuals with riskfactors require an estimate of BMD.
The assumptions concerning the requirements for DXA to monitortreatment are based on the assessment strategy of using clinical risk factorsand selective use of BMD. There is, however, great uncertainty concerningthe way in which treatments should be monitored, and the role – if any – ofBMD measurements (71). The problem arises because of the relatively smalltreatment-induced changes in BMD compared to the precision errors of themeasurement, so that treatment-induced changes in BMD do not accuratelypredict associated reductions in fracture risk. For this reason it wasconservatively assumed that the baseline BMD and only one further test twoyears later would be needed. Notwithstanding, the long-term requirement forthe monitoring of treatment amounted to 6.39 DXA units per million of thepopulation compared with a requirement of 4.21 scanners per million forcase-finding. Thus, the monitoring consequences of treatment are greaterthan those for case-finding. It thus becomes important to developinternationally agreed guidance on the use of DXA for the monitoring oftreatment.
The combined estimates for assessment and monitoring, based on theassessment strategy of using clinical risk factors and selective use of BMD,amount to 10.6 DXA units per million of the general population, which issimilar to a previous estimate (72). This requirement can be compared withthe current availability of DXA in different European countries (Fig. 9.5). Ofthe 20 countries in Europe for which information is shown, nine have morethan 10 DXA units per million of the population. It is important to note thatFig. 9.5 does not distinguish machines dedicated in part or in full to clinicalresearch, nor machines that lie idle or are underused because of lack offunding. It is likely, therefore, that the majority of countries are under-resourced. A further consideration is the inequity of geographical location,which is known to be problematic in Italy, Spain, Switzerland and the UnitedKingdom. The most extreme example is found in India, where there areapproximately 100 DXA units, but these are located in six cities. This inequity
269

results in long waiting times or long distances to travel or, in many cases, nopractical access at all. Outside of Europe, only eight countries have morethan 10 units per million of the general population (see Fig. 9.5).
Fig. 9.5
Density (number per million of the population) of central DXA (spine/hip) units in Europeanand non-European countries in 2003a
Source: reference 68 (Figs 1 and 2).
DXA, dual energy X-ray absorptiometry.aData not shown for the following countries with DXA units <2.0 per million: China, Columbia,Ecuador, Guatemala, India, Indonesia, Malaysia, Mexico, Philippines, South Africa, Thailand,Tunisia.
The guidance formulated is summarized in Fig. 9.6. The process begins withthe assessment of fracture probability and the categorization of fracture risk.In those Member States with no access to bone mineral testing, treatment canbe allocated on this basis alone, i.e. the intermediate risk group envisaged inFig. 9.6 is zero (0% of the population). In those Member States where bonedensity testing is recommended in segments of the population, BMD testingcan be done alongside the assessment by clinical risk factors. In this case, thelow risk group is set to 0%. In those Member States with limited access toBMD testing, the intermediate risk group may be set anywhere between theextremes of 0% and 100%, depending upon clinical practice, availability,affordability or health economic criteria.
270

Fig 9.6
Algorithm for case-finding or screening for fracture risk
CRFs, clinical risk factors; BMD, bone mineral density.
9.6 Implementation of assessment guidanceThe introduction of low BMD T-scores of the hip as the basis for the clinicaldiagnosis of osteoporosis changed the concept of the disease and requiredthe development of clinical guidelines for the use of densitometry. In manysettings, clinical practice guidelines are not well accepted by physicians and,consequently, are not broadly used. In the United States, a guideline by theNational Osteoporosis Foundation outlining whom to test for low BMD andhow to use the test results to determine whom to treat has had reasonablywide acceptance (50). Many guidelines in Europe have been modelled onthose first proposed by the European Foundation for Osteoporosis (now theInternational Osteoporosis Foundation) and adopted by the EuropeanCommunity. National guidelines modelled on these principles have beensuccessfully adopted by the Department of Health in the United Kingdomand have been well accepted. Despite these successes, osteoporosis still suffersfrom under-awareness, under-diagnosis and under-treatment in many regionsof the world (72–79). There are lessons to be learnt from very successfulinitiatives in other areas, such as the public and professional awareness ofserum cholesterol as an indicator of cardiovascular risk.
A recent report by the United States Surgeon General (8) identifies 10lessons that can be learned from the National Cholesterol EducationProgramme and that could be applied to national campaigns to improve bonehealth:
• Establish a solid scientific base that can bring credibility and persuasion to effort.
• Create a multidisciplinary and far-reaching partnership that includes interested organizations with State and local chapters.
271

• Make sure that partners and target audiences have input at the concept stage, not just the dissemination stage.
• Pursue collaboration with outside interests, such as industry, as appropriate opportunities arise.
• Develop a comprehensive programme plan that includes roles for all partners.
• Research a consensus on consistent key messages that can be repeated and reaffirmed by many partners through many channels and outlets.
• To reach desired goals and objectives, make sure that the effort has the type of long-term commitment in terms of leadership and funding from sponsoring organizations that is necessary to make it sustainable over the long term.
• Both population and clinical approaches will be needed in order to change behaviour at the personal, family and community level, and choices between these two types of interventions should not be made.
• Establish or acquire baseline data pertinent to establishing goals and objectives so that progress, or lack thereof, can be measured and programme direction can be altered as needed.
• Build in a reassessment and renewal process to keep the effort vital and current.
Against this background, it is worth examining the process forimplementation that allowed some general acceptability of currentosteoporosis guidelines, since the use of absolute fracture risk will nowrequire changes in the guidance provided to physicians. Lessons can belearned from the successful introduction of osteoporosis guidelines thatmight help to bypass barriers to modification of existing guidelines in orderto accommodate this new approach to patient assessment.
9.6.1 Guideline developmentThe process initiated by the National Osteoporosis Foundation in the UnitedStates was to undertake a formal cost–effectiveness analysis upon which tobase the development of a guide to clinical practice. The cost–effectivenessanalysis was rigorous and published in full (80). The philosophy behinddeveloping a guide from this document required the determination of theefficacy and cost of each medicine then available for the prevention ortreatment of osteoporosis in postmenopausal women. There was a generalfeeling that the best of the medicines available at the time (estrogen andbisphosphonates) were roughly similar in efficacy. Cost then became thedriving force. The National Osteoporosis Foundation selected the least costlymedicine (estrogen) to drive the guide, arguing that if this treatment could bejustified based on efficacy and cost, it would be unethical to deny other, morecostly medicines to those who were appropriate candidates for therapy, butcould not or would not use estrogen.
272

In the United Kingdom, guideline development was undertaken through theRoyal College of Physicians (6). It also used an evidence-based approach todetermine efficacy of interventions, but did not undertake cost–effectivenessanalysis of the intervention, since approved treatments were availablethrough the National Health Service. Rather, cost–effectiveness wasdetermined for the assessment strategy, namely whether the additional use ofBMD to direct intervention over and above case-finding by clinical riskfactors was worthwhile.
9.6.2 Guideline approvalGuidelines both in the United Kingdom and the United States underwent anapproval process. Before announcing their guidance, the NationalOsteoporosis Foundation went through an approval process, involving itsInterspecialty Medical Council, which comprises representatives of majormedical societies whose members might have clinical interests in osteoporosis(i.e. internists, endocrinologists, rheumatologists, radiologists, orthopaedists,etc.). In addition, the guide was presented to the Council of the AmericanSociety of Bone and Mineral Research to validate the scientific rigour.Ratification of the final document was obtained from all groups, albeit notwithout considerable discussion. The time required for ratification ofguidance should not be underestimated. The procedure provided theNational Osteoporosis Foundation with a mechanism for disseminating theguide through the national and regional meetings of these major medicalsocieties. In addition, the Foundation worked with the American MedicalAssociation to develop a continuing medical education course for physiciansbased around the principles enunciated in the guide.
In the United Kingdom, consultation on the draft guidance took place witha wide spectrum of professional bodies concerned with osteoporosis frommany medical disciplines and also included nursing organizations, generalpractitioners and patient organizations. The guidance was then externallyaudited by an independent body before approval by the Department ofHealth.
9.6.3 Guideline implementationIn the United Kingdom, guidelines were distributed through the Departmentof Health and the resource document was published independently by theRoyal College of Physicians (London).
The implementation process was more complex in the United States since thehealth-care system is more complicated and there is a need to involve specificgeneral audiences, including government agencies (both elected officials andhealth agency staff), those who pay for health care (such as insurance andmanaged care plans), those who dispense health care (physicians, etc.), and
273

consumers (patients and their families). In addition, pharmaceutical anddevice manufacturers are interested parties; they were not considered to befundamental to acceptance of the guide but, nonetheless, could be expectedto facilitate or hinder its introduction, depending on how their products faredin the recommendations. Guideline development is viewed differently by eachof these primary audiences, and each might be expected to react differentlyto a move that changes current approaches to disease diagnosis andmanagement. For this reason, several strategies were developed to facilitatethe acceptance of the guide, involving each audience of relevance, as follows.
Elected government officials
At the time of guideline development, the United States Congress hadrecently passed a law requiring Medicare to pay for prostate cancer screeningfor ageing men. Medicare traditionally does not pay for screening tests inasymptomatic individuals, and prostate specific antigen (PSA) became one ofrelatively few tests reimbursed. Active in Congress was a group known as theCongressional Women’s Caucus, representing all female elected members ofthe United States House and Senate. The National Osteoporosis Foundationpetitioned this group to support a law requiring Medicare to pay for BMDtesting, using the National Osteoporosis Foundation guide as the basis, andarguing that, for women, this was as important as PSA was for men (i.e.social justice). Subsequent passage of the resulting bill mandatingdensitometry coverage by Medicare was pivotal in the general utility of theguide. First, Medicare is a Federal programme covering all individuals overthe age of 65 years, a key group for BMD evaluation and obviously the onewith the highest prevalence of osteoporosis. Second, Medicare rules are oftenfollowed by private payers, allowing availability of the test to youngerwomen. Third, this afforded significant publicity to the test itself, as theNational Osteoporosis Foundation was able to publicize the Congressionaleffort. Finally, the trickle-down effect regionally resulted in individual statesdirecting more attention (and therefore resources) to osteoporosis.
Staff of government agencies
The staff of governmental agencies has responsibility for ensuring thatactions mandated by elected officials are fiscally prudent, and populationrelevant. Medicare staff initiated a re-evaluation of BMD (65), and theconclusions eventually published in a report by the United States PreventiveHealth Services Task Force supported the National Osteoporosis Foundationcontention, as reflected in its guide, that BMD testing was “cost-effective” inall women by the age of 65 years and in selected “higher risk” women at ayounger age (67). At that time, Medicare did not pay for medications, andthe National Osteoporosis Foundation recommendations for treatmentthresholds were not addressed.
274

Payers
In some situations, private organizations (insurance companies, healthmaintenance organizations, managed care plans, etc.) have a major interest inthe introduction of guidelines for disease management. These organizationsoften have conflicting goals, namely to provide the highest standard of healthcare but, at the same time, to control costs of health-care delivery. Newguidelines for disease management often represent an actuarial problem, sothese organizations pay close attention to “cost–effectiveness”. In this area,basing the guide on a cost–effectiveness analysis was a major benefit. Thecombination of Government endorsement with evidence ofcost–effectiveness went a long way towards acceptance (sometimesreluctantly) by individual payers that BMD was a required service. OnceBMD testing was provided, it was a relatively simple step to reimbursementof the indicated medications. It should be noted, however, that the NationalOsteoporosis Foundation played no role in the assessment of individualmedications for reimbursement. That was an issue purely decided betweenthe insurance and pharmaceutical industries.
Health-care providers
Physicians and other health-care providers wish to provide the higheststandard of care for their patients but are under considerable constraints,particularly time and money. In fact, this arm of implementation was crucialin the acceptance by providers first of the BMD test and second of themedications. The National Osteoporosis Foundation organized extensiveeducational programmes for physicians. More importantly, perhaps, once thepublic had accepted BMD (see below), physicians reacted by ordering thetest. It was then an easy step to recommend treatment based on the criteriasuggested in the National Osteoporosis Foundation document. Not allphysicians, of course, adhered strictly to the National OsteoporosisFoundation guidance. There was a perception that prevention was critical,driven by the pharmaceutical industry, and many individuals at low risk offracture were placed on bone-specific agents, including many premenopausalwomen with low T-scores who did not have osteoporosis.
Patients
Patients have the greatest vested interest in disease prevention, but they oftenhave ambivalent views about the use of medications. Indeed, it has been acommon experience for patients with a recent fracture to decline treatmentfor osteoporosis (81). Direct-to-consumer advertising of medications in theUnited States has raised awareness of the preventability of fracture.Moreover, public relations efforts by the National Osteoporosis Foundation,organized in part around Osteoporosis Prevention Month but occurringthroughout the year, promoted awareness of an easy test (BMD) that couldpredict fracture risk, driving many women to ask their physicians for referralfor the test. The use of such testing has increased accordingly (82).
275

9.6.4 ConclusionsWhile developing guidelines for clinical disease management requires arigorous evaluation of the evidence, most guides are not particularly welladopted in practice situations. The key is implementation, which requires amulti-pronged approach addressing each level of health-care delivery, fromgovernment to primary care. Consideration must also be given to the patientswho, by their demands, often drive changes in clinical practice. Audit is alsoan essential element in order to document the uptake of guidance and totrack corresponding changes in fracture outcomes.
The guidance given in this report requires a change in the approach to theassessment and management of osteoporosis. The original WHO definitionof osteoporosis began to move the disorder from a disease of fracture to adisease of fracture risk (3). Just as high serum lipids and high blood pressureare indicators of the risk of heart disease, so BMD testing became a criticalcomponent as a predictor of fracture risk. The guidance given in this reportis faithful to the concept of the disease as one of fracture risk, but enlargesthe arsenal available with which to assess this risk. A concentratededucational programme at all levels of health care will be needed to ensurethat fracture risk, rather than BMD alone, becomes the critical component ofrisk assessment in osteoporosis.
References
1. Cooper C, Melton LJ. Epidemiology of osteoporosis. Trends in Endocrinology andMetabolism, 1992, 3:224–229.
2. Riggs BL, Melton LJ III. The prevention and treatment of osteoporosis. NewEngland Journal of Medicine, 1992, 327:620–627.
3. Assessment of fracture risk in screening for osteoporosis. Geneva, World HealthOrganization, 1994 (WHO Technical Report Series, No. 843).
4. Walker-Bone K, Dennison E, Cooper C. Osteoporosis. In: Silman AJ, HochbergMC, eds. Epidemiology of the rheumatic diseases, 2nd ed. Oxford, Oxford UniversityPress, 2001:259–292.
5. Barrett-Connor E et al. Prevention of osteoporotic hip fracture: global versushigh-risk strategies. Osteoporosis International, 1998, 8(Suppl. 1):S2–S7.
6. Osteoporosis: clinical guidelines for prevention and treatment. London, RoyalCollege of Physicians, 1999.
7. Khaw KT. Some implications of population change. In: Rose G, ed. The strategyof preventive medicine. Oxford, Oxford University Press, 1992:88.
8. Bone health and osteoporosis: a report of the Surgeon General. Rockville, MD, UnitedStates Department of Health and Human Services, Office of the Surgeon General,2004.
9. Ebrahim S, Smith GD. Systematic review of randomised controlled trials ofmultiple risk factor interventions for preventing coronary heart disease. BritishMedical Journal, 1997, 314:1666–1674.
276

10. Chang JT et al. Interventions for the prevention of falls in older adults: systematicreview and meta-analysis of randomised clinical trials. British Medical Journal,2004, 328:680–683.
11. Johnell O et al. Risk factors for hip fracture in European women: the MEDOSstudy. Journal of Bone and Mineral Research, 1995, 10:1802–1815.
12. Cumming RG, Nevitt MC. Calcium for prevention of osteoporotic fractures inpostmenopausal women. Journal of Bone and Mineral Research, 1997,12:1321–1329.
13. Kanis JA. The use of calcium in the management of osteoporosis. Bone, 1999,24:279–290.
14. Johnell O et al. National variation in hip fracture rates in Sweden depends onlatitude and season – a cohort study of 26 million observation years. OsteoporosisInternational, 2002, 13(Suppl. 1):S13.
15. Lips P et al. Vitamin D supplementation and fracture incidence in elderly persons– a randomized, placebo-controlled clinical trial. Annals of Internal Medicine, 1996,124:400–406.
16. Porthouse J et al. Randomised controlled trial of calcium and vitamin Dsupplementation for fracture prevention in primary care. OsteoporosisInternational, 2004, 15(Suppl. 2):S13.
17. Grant AM et al. Oral vitamin D3 and calcium for secondary prevention of low-trauma fractures in elderly people (Randomised Evaluation of Calcium Or vitaminD, RECORD): a randomised placebo-controlled trial. Lancet, 2005,365:1621–1628.
18. Heikinheimo RJ et al. Annual injection of vitamin D and fractures of aged bones.Calcified Tissue International, 1992, 51:105–110.
19. Trivedi DP, Doll R, Khaw KT. Effect of four monthly oral vitamin D3 (cholecalciferol)supplementation on fractures and mortality in men and women living in thecommunity: randomised double blind controlled trial. British Medical Journal,2003, 326:469–472.
20. Chapuy MC et al. Effect of calcium and cholecalciferol treatment for three yearson hip fractures in elderly women. British Medical Journal, 1994, 308:1081–1082.
21. Dawson-Hughes B et al. Effect of calcium and vitamin D supplementation onbone, density in men and women 65 years of age or older. New England Journal ofMedicine, 1997, 337:670–676.
22. Venning G. Recent developments in vitamin D deficiency and muscle weaknessamong elderly people. British Medical Journal, 2005, 330:524–526.
23. Report on osteoporosis in the European Community: action on prevention.Luxembourg, European Commission, Office for Official Publications of theEuropean Communities, 1998:112.
24. Karkkainen MUM, Wiersma JW, Lambergallardt CJE. Postprandial parathyroidhormone response to four calcium-rich foodstuffs. American Journal of ClinicalNutrition, 1997, 65:1726–1730.
25. Law MR, Hackshaw AK. A meta-analysis of cigarette smoking, bone mineraldensity and risk of hip fracture: recognition of a major effect. British MedicalJournal, 1997, 315:841–846.
277

26. Bikle DD et al. Bone disease in alcohol abuse. Annals of Internal Medicine, 1985,103:42–48.
27. Naves-Diaz M et al. The influence of alcohol consumption on the risk of vertebraldeformity. Osteoporosis International, 1997, 7:65–71.
28. Seeman E. The effects of tobacco and alcohol use on bone. In: Marcus R,Feldman D, Kelsey J, eds. Osteoporosis. San Diego, CA, Academic Press,1996:577–597.
29. Kiratli BJ. Immobilisation osteopenia. In: Marcus R, Feldman D, Kelsey J, eds.Osteoporosis, 2nd ed. Vol. 2. San Diego, CA, Academic Press, 2001:207–227.
30. Silman AJ et al. Influence of physical activity on vertebral deformity in men andwomen: results from the European Vertebral Osteoporosis Study. Journal of Boneand Mineral Research, 1997, 12:813–819.
31. Gregg EW et al. Physical activity and osteoporotic fracture risk in older women.Annals of Internal Medicine, 1998, 129:81–88.
32. Kanis JA et al. Risk factors for hip fracture in European men: the MEDOS Study.Osteoporosis International, 1999, 9:45–54.
33. Joakimsen RM et al. The Tromso study: physical activity and the incidence offractures in a middle-aged population. Journal of Bone and Mineral Research, 1998,13:1149–1157.
34. Dalsky GP et al. Weight-bearing exercise training and lumbar bone mineralcontent in postmenopausal women. Annals of Internal Medicine, 1988,108:824–828.
35. Joakimsen RM, Magnus JH, Fonnebo V. Physical activity and predisposition forhip fractures: a review. Osteoporosis International, 1997, 7:503–513.
36. Lee IM, Hsieh CC, Paffenbarger RS. Exercise intensity and longevity in men: theHarvard Alumni Health Study. Journal of the American Medical Association, 1995,273:1179–1184.
37. Bouxsein ML. Biomechanics of age-related fractures. In: Marcus R, Feldman D,Kelsey J, eds. Osteoporosis, 2nd ed. Vol. 1. San Diego, CA, Academic Press,2001:509–531.
38. Gillespie LD et al. Interventions for preventing falls in elderly people (CochraneReview). In: The Cochrane Library, Issue 1. Chichester, John Wiley & Sons, 2004.
39. Tinetti ME. Clinical practice: preventing falls in elderly persons. New EnglandJournal of Medicine, 2003, 348:42–49.
40. Campbell AJ et al. Randomised controlled trial of a general practice programmeof home based exercise to prevent falls in elderly women. British Medical Journal,1997, 315:1065–1069.
41. Province MA et al. The effects of exercise on falls in elderly patients: a pre-planned meta-analysis of the FICSIT trials. Journal of the American MedicalAssociation, 1995, 273:1341–1347.
42. Weatherall M. Prevention of falls and fall related fractures in community-dwellingolder adults: a meta-analysis of estimates of effectiveness based on recentguidelines. Internal Medical Journal, 2004, 34:102–108.
43. Bischoff-Ferrari HA et al. Effect of vitamin D on falls: a meta-analysis. Journal ofthe American Medical Association, 2004, 291:1999–2006.
278

44. Lauritzen JB, Petersen MM, Lund B. Effect of external hip protectors on hipfractures. Lancet, 1993, 341:11–13.
45. Van Schoor NM et al. Cost-effectiveness of hip protectors in frail institutionalisedelderly. Osteoporosis International, 2004, 15:964–969.
46. Parker MJ, Gillespie LD, Gillespie WJ. Hip protectors for preventing hip fracturesin the elderly. Cochrane Database of Systematic Reviews, 2003, (3):CD001255.
47. Marcus R. Mechanisms of exercise effects on bone. In: Bilezikian JP, Raisz LG,Rodan GA, eds. Principles of bone biology. San Diego, CA, Academic Press,1996:1135–1146.
48. Osteoporosis: clinical guidelines for prevention and treatment. Update onpharmacological interventions and an algorithm for management. London, RoyalCollege of Physicians, 2000.
49. Kanis JA et al. Guidelines for diagnosis and management of osteoporosis.Osteoporosis International, 1997, 7:390–406.
50. Physicians guide to prevention and treatment of osteoporosis. Washington, DC,National Osteoporosis Foundation, 2003.
51. Cummings SR et al. Effect of alendronate on risk of fracture in women with lowbone density but without vertebral fractures: results from the FractureIntervention Trial. Journal of the American Medical Association, 1998,280:2077–2082.
52. Writing Group for the Women’s Health Initiative Investigators. Risks and benefitsof estrogen plus progestin in healthy postmenopausal women. Journal of theAmerican Medical Association, 2002, 288:321–333.
53. Kanis JA et al. Effect of raloxifene on the risk of new vertebral fracture inpostmenopausal women with osteopenia or osteoporosis: a reanalysis of theMultiple Outcomes of Raloxifene Evaluation trial. Bone, 2003, 33:293–300.
54. Cummings S et al. Effect of alendronate on risk of fracture in women with lowbone mineral density but without vertebral fractures: results from the FractureIntervention Trial. Journal of the American Medical Association, 1988,280:2077–2082. 17(Suppl.):S474.
55. Marcus R et al. The skeletal response to teriparatide is largely independent ofage, initial bone mineral density, and prevalent vertebral fractures inpostmenopausal women with osteoporosis. Journal of Bone and Mineral Research,2003, 18:18–23.
56. Miller PD. Greater risk, greater benefits – true or false [editorial]. Journal of ClinicalEndocrinology and Metabolism, 2003, 88:538–541.
57. Watts NB et al. Risedronate prevents new vertebral fractures in postmenopausalwomen at high risk. Journal of Clinical Endocrinology and Metabolism, 2003,88:542–549.
58. McClung MR et al. Effect of risedronate on the risk of hip fracture in elderlywomen. Hip Intervention Program Study Group. New England Journal of Medicine,2001, 344:333–340.
59. Bagger Y et al. Two to three years of hormone replacement treatment in healthywomen have long-term preventive effects on bone mass and osteoporoticfractures: the PERF study. Bone, 2004, 34:728–735.
279

60. McCloskey EV et al. The efficacy of clodronate (Bonefos®) to reduce theincidence of osteoporotic fractures in elderly women is independent of theunderlying BMD. Journal of Bone and Mineral Research, 2003, 18(Suppl. 2):S65.
61. Johansson H et al. Optimisation of BMD measurements to identify high riskgroups for treatment: a test analysis. Journal of Bone and Mineral Research, 2004,19:906–913.
62. Kayan K et al. Performance of clinical referral criteria for bone densitometry inpatients under 65 years of age assessed by spine bone mineral density.Postgraduate Medical Journal, 2003, 79:581–584.
63. Ramsay LE et al. The Sheffield table for primary prevention of coronary heartdisease: corrected. Lancet, 1996, 348:1251.
64. Nelson Screening for postmenopausal osteoporosis: a review of the evidence forthe US Preventive Services Task Force. Annals of Internal Medicine, 2002,137:529–541.
65. Nelson HD et al. Osteoporosis in postmenopausal women: diagnosis and monitoring.Evidence report/ Technology Assessment, number 28. Rockville, MD, Agency forHealthcare Research and Quality, 2002 (AHRQ publication No. 01-EO32).
66. US Preventive Services Task Force. Screening for osteoporosis inpostmenopausal women: recommendations and rationale. Annals of InternalMedicine, 2002, 137:526–528.
67. US Preventive Services Task Force. Screening for osteoporosis in postmenopausalwomen. Washington, DC, Office of Disease Prevention and Health Promotion,2003.
68. Kanis JA, Johnell O. Requirements for DXA for the management of osteoporosisin Europe. Osteoporosis International, 2005, 16:229–238.
69. Dargent-Molina P, Piault S, Breart G. A triage strategy based on clinical riskfactors for selecting elderly women for treatment or bone densitometry: theEPIDOS prospective study. Osteoporosis International, 2005, 16:898–906.
70. World population prospects: the 2002 revision and world urban prospects. New York,United Nations Population Division, Department of Economic and Social Affairs,2003.
71. Cummings SR et al. Monitoring osteoporosis therapy with bone densitometry:misleading changes and regression to the mean. Journal of the American MedicalAssociation, 2000, 283:1318–1321.
72. Compston J. Action plan for the prevention of osteoporotic fractures in theEuropean Community. Osteoporosis International, 2004, 15:259–262.
73. Torgerson DJ, Dolan P. Prescribing by general practitioners after an osteoporoticfracture. Annals of Rheumatic Diseases, 1998, 57:378–379.
74. Simonnelli C, Chen YT, Van Kuijk C. Evaluation and management of osteoporosisfollowing hospitalisation for low impact fracture. Journal of General InternalMedicine, 2003, 18:17–22.
75. Andrade SE et al. Low frequency of treatment of osteoporosis among post-menopausal women following a fracture. Archives of Internal Medicine, 2003,163:2052–2057.
76. Wong PKK et al. Secondary screening for osteoporosis in patients admitted withminimal trauma fracture to a major teaching hospital. Internal Medical Journal,2003, 33:505–510.
280

77. Liel Y, Castel H, Bonneh DY. Impact of subsidising effective anti-osteoporosisdrugs in compliance with management guidelines in patients following lowimpact fractures. Osteoporosis International, 2003, 14:490–495.
78. Panneman MJ et al. Under-treatment with anti-osteoporotic drugs afterhospitalisation for fracture. Osteoporosis International, 2004, 15:120–124.
79. Hajcsar EE, Hawker G, Bogoch ER. Investigation and treatment of osteoporosisin patients with fragility fractures. Canadian Medical Association Journal, 2000,163:819–822.
80. National Osteoporosis Foundation. Osteoporosis: review of the evidence forprevention, diagnosis and treatment and cost-effectiveness analysis. OsteoporosisInternational, 1998, 8(Suppl. 4):1–88.
81. Elliot-Gibson V et al. Practice patterns in the diagnosis and treatment ofosteoporosis after a fragility fracture: a systematic review. OsteoporosisInternational, 2004, 15:767–778.
82. Stafford RS, Drieling RL, Hersh AL. National trends in osteoporosis visits andosteoporosis treatment, 1988–2003. Archives of Internal Medicine, 2004,164:1525–1530.
10. Summary, conclusions and recommendations forresearchThe following conclusions and recommendations for research represent theunanimous views of the Scientific Group.
With the development of treatments that favourably alter the natural historyof osteoporosis, there is an increasing need to develop strategies for fracturerisk assessment so that treatments can be targeted more effectively to those inneed and, conversely, that unnecessary treatment can be avoided in those atlow risk of fracture.
10.1 Consequences of osteoporosisAge-related bone loss is asymptomatic, and the morbidity of osteoporosis issecondary to the fractures that occur. Common sites of fracture include thespine, hip, forearm and proximal humerus.
Fractures at the hip incur the greatest morbidity and mortality, and give riseto the highest direct costs for health services. Their incidence increasesexponentially with age.
Osteoporotic fractures at other sites are generally of less economicsignificance, but they also give rise to significant morbidity and, in someinstances, to increased mortality. They occur more commonly than hipfractures at younger ages, and their neglect in evaluating assessmentstrategies disadvantages the younger segment of the osteoporotic population.
281

The remaining lifetime probability of osteoporotic fractures in women at theage of 50 years exceeds 40% in developed countries. For hip fracture alone,the remaining lifetime probability at the age of 50 years exceeds 20% inwomen in these countries. In many regions of the world, the risks in men areabout half those of women.
The number of osteoporotic fractures is certain to increase in both men andwomen (by more than 3-fold over the next 50 years) as a result of the ageingpopulation. The major increases will occur outside of Europe and the UnitedStates, particularly in Asia and Latin America.
Over and above changes in population demography, the age- and sex-specificincidence of osteoporotic fractures appears to be increasing in developingcountries. This may more than double the expected burden of osteoporoticfractures over the next 50 years.
The age- and sex-specific incidence of hip fracture varies markedly aroundthe world, as does the incidence of other osteoporotic fractures. For hipfracture, age- and sex-specific incidence varies by more than 10-fold. Moremodest variations are observed for vertebral fracture risk.
Reasons for the secular changes and geographic variations in fracture risk areunknown, but cannot be explained completely on the basis of differences inbone mineral density.
In high-income countries, osteoporotic fractures account for more hospitalbed days than those for myocardial infarction, breast cancer or prostatecancer. The burden of hip fracture alone accounts for 1.4% of disability-adjusted life years in the established market economies.
10.2 Bone mineral measurements and diagnosis ofosteoporosisMany techniques are available to assess bone mineral at multiple sitesincluding those where osteoporotic fractures predominate. The most widelyvalidated technique is dual energy X-ray absorptiometry (DXA) applied tosites of biological relevance, including the hip, spine and forearm.
The pivotal requirement for the use of bone mineral testing in diagnosis andassessment of osteoporosis is its performance characteristics for fractureprediction.
There are significant differences in the performance of different techniques topredict fractures at different skeletal sites. For the prediction of any fracture,DXA at sites of biological relevance gives measurements of bone mineraldensity (BMD) that predict fracture with an increase in fracture risk ofapproximately 1.5/SD decrease in bone mineral density (termed the gradient
282

of risk). The highest gradient of risk is provided by DXA at the femoral neckfor hip fracture prediction, where the gradient of risk is approximately2.6/SD.The validation of BMD measurements and the increase in epidemiologicalinformation permit diagnostic criteria for osteoporosis to be more preciselydefined than previously. The international reference standard for thedescription of osteoporosis in postmenopausal women and in men aged 50years or more is a femoral neck BMD of 2.5 SD or more below the youngfemale adult mean, using normative data from the NHANES III referencedatabase on Caucasian women aged 20–29 years.
Although the reference standard for the description of osteoporosis is BMDat the femoral neck, other central sites (e.g. lumbar spine, total hip) can beused for diagnosis in clinical practice.
T-scores should be reserved for diagnostic use in postmenopausal women andmen aged 50 years or more. With other technologies, and other populations,measurement values should be expressed as Z-scores, units of measurementor preferably in units of fracture risk.
Provision is still made for the description of osteopenia as a T-score at thefemoral neck of between –1.0 SD and –2.5 SD below the young female adultmean.
10.3 Clinical risk factors for fractureA plethora of clinical risk factors have been identified that are associatedwith an increase in fracture risk. In many instances their suitability forinclusion in assessment algorithms for the prediction of fracture has not beenwell validated. In this report, evidence-based criteria are developed for theassessment of risk factors including for BMD. These include hierarchicallevels of evidence for the ability of risk factors to identify a fracture risk thatis modifiable by pharmacological interventions.
Risk factors validated by their use as inclusion criteria in randomizedcontrolled trials include low BMD (DXA at spine or hip), prior vertebralfracture, long-term glucocorticoid treatment, and age. Risk factors that donot adversely affect the efficacy of intervention in randomized controlledtrials include family history of fracture, prior non-vertebral fracture,biochemical markers of bone turnover, peripheral measurements of bonemineral including quantitative ultrasound at the heel, smoking, body weightor body mass index, and alcohol intake.
In this report, the international validity of candidate risk factors wasexamined by meta-analyses of population-based cohorts from Asia,Australia, Europe and North America. Risk factors were assessed by age, sex,duration of follow-up, and their dependence on BMD. Those validated
283

comprised BMD at the femoral neck, low body mass index, a prior fragilityfracture, glucocorticoid exposure, a parental history of (hip) fracture,smoking, excessive intake of alcohol, and rheumatoid arthritis.
The interdependent relationship among these risk factors was used toconstruct models of fracture probability.
Other risk factors of potential utility, but less extensively validated, includedBMD measured at the spine or total hip, quantitative ultrasound applied tothe heel, peripheral estimates of BMD, and biochemical indices of boneturnover.
10.4 Assessment tools for case-findingScreening with BMD is recommended in some Member States, most notablyin North America, but is not widely practised elsewhere. Reasons include thelack of availability of machines, variable access, expense, and poor sensitivity(detection rate for future fractures) when specificity is high.
Current evidence-based guidelines focus on the use of BMD as a criterion forintervention.
Several algorithms are available for the prediction of osteoporosis with theuse of clinical risk factors alone. The most widely tested predictor ofosteoporosis is the osteoporosis self-assessment tool. These tools havecomparable performance characteristics with high sensitivity (detection rate)but poor specificity. The high sensitivity provides opportunities for costsavings by excluding patients who do not need a BMD assessment. Such toolsrequire calibration in each Member State because of heterogeneity insensitivity and specificity. They have not been well validated in men.
Sensitivity is improved by the use of multiple independent risk factors andcan be used to optimize the prediction of fracture. Four FRAX™ assessmentmodels have been constructed from the meta-analyses of risk factors for thecalculation of fracture probabilities. These comprise the 10-year probabilityof hip fracture, with and without BMD at the femoral neck, and the 10-yearprobability of major osteoporotic fractures, with and without BMD at thefemoral neck. Major osteoporotic fractures comprise forearm, clinical spineand proximal humerus fractures. The probability of any osteoporotic fractureis, therefore, underestimated. The FRAX™ algorithms are suitable for use inmen (from the age of 40 years) and women from the age of menopause.
For hip fracture prediction, the use of BMD at each age out-performed theuse of clinical risk factors alone in predictive value, but clinical risk factors incombination with BMD improved the gradient of risk still further, so that thetest had improved sensitivity without loss of specificity. For the prediction ofother osteoporotic fractures, gradients of risk with clinical risk factors weremarginally improved with the addition of BMD, but the performancecharacteristics were as good as, or better than, the assessment of risk with
284

BMD using peripheral measurements. The performance characteristics havebeen validated in several independent cohorts from different regions of theworld.
The FRAX models were calibrated to different Member States to reflect thehigh heterogeneity in fracture risk worldwide. These included countries atvery high risk (Sweden, United States), at high risk (United Kingdom), atmoderate risk (China, Japan and Spain), and at low risk (Turkey). Themodels are available at www.shef.ac.uk/FRAX.
The FRAX models can be simplified with the omission of some of theclinical risk factors, making them amenable to paper versions.
Fracture probabilities assume clinical utility once an intervention threshold isestablished, namely the risk above which intervention is worthwhile.Intervention thresholds should be fixed by Member States and will dependupon the priorities that osteoporosis has in a region or country, the absoluterisk of fracture, and the ability to pay. An example, based on cost–utilityanalysis, is provided for the United Kingdom.
10.5 Assessment and the formulation of therapeutic strategy
Population-based (i.e. public health) prevention programmes are appropriatefor all Member States. Global programmes should include attention tonutritional factors, particularly related to adequate intakes of calcium andvitamin D. Cigarette smoking should be avoided, not solely because of itspossible effects on skeletal metabolism, but for the many other adverse effectsassociated with smoking. Preventing excessive alcohol consumption and theavoidance of immobility are also recommended as public health measures.
In Member States without access to densitometry, case-finding strategies canbe pursued with use of clinical risk factors alone. The performancecharacteristics of the FRAX model are at least as good as those provided byperipheral assessment of BMD.
In Member States where BMD is universally recommended (e.g. at the age of65 years or more in North America), the stratification of risk can beimproved by consideration of clinical risk factors in conjunction with BMD.This is particularly valuable in the context of younger individuals for hipfracture prediction.
In Member States with limited access to DXA, clinical risk factors can beused to stratify target populations to those at very high risk in whom a BMDtest would not alter their risk category, those with very low risk in whom aBMD would not alter the risk category, and those at intermediate risk wherea BMD test would be helpful for the characterization of fracture probability.
285

The guidance in this report is flexible and will require that Member Statesmake suitable accommodation to cater for regional variations in medicalcare. Even so, the implementation of this guidance poses many challenges forthe future. There will need to be agreement on the principles of fracture riskreporting among stakeholders, including regulatory agencies, ministries ofhealth, payers as well as the manufacturers of bone mineral measurementtechnologies. Ultimately, it will also become necessary to validate theresponsiveness of patients so identified to the large number of interventionsnow available.
10.6 Recommendations for researchHealth service data are required in many Member States on length ofhospital stay, morbidity, mortality and institutionalization associated withosteoporotic fractures, together with the associated costs, so thatosteoporosis can be placed in an adequate health-care perspective.
Hip fracture risks have been estimated for less than 40 Member States, andrisks for other osteoporotic fractures in far fewer. More information isneeded on the epidemiology of fracture so that FRAX algorithms can becalibrated for more communities.
The present approaches to the identification of patients at risk for fracturefocus on a few clinical risk factors and on femoral neck BMD. Moreinformation is required on other risk factors and their validity to permitfurther refinements to the models available. Topics for study thus include:
• clinical risk factors for falls
• the use of DXA at other skeletal sites, such as the total hip and lumbar spine
• indices of bone turnover
• the use of other technologies, such as quantitative ultrasound
• secondary causes of osteoporosis other than rheumatoid arthritis.
Assessment algorithms need further validation in men and non-Caucasianpopulations.
Case-finding strategies require validation in clinical trials to test whetherpharmacological agents reduce fracture risk in individuals identified by theuse of clinical risk factors with and without the selective use of BMD.
AcknowledgementsThe meeting was organized by the WHO Collaborating Centre for MetabolicBone Disease, Sheffield, United Kingdom, and the World HealthOrganization.
The Scientific Group gratefully acknowledges the assistance of observers
286

who also contributed to several aspects of this report. They include ProfessorBess Dawson-Hughes (President, National Osteoporosis Foundation, UnitedStates), Professor Pierre Delmas (President, International OsteoporosisFoundation), Professor Paul D Miller (International Society for ClinicalDensitometry), Professor Juliet Compston (Committee of ScientificAdvisors, International Osteoporosis Foundation), Professor Robert Lindsay(National Osteoporosis Foundation, United States), Professor Michael R.McClung (International Society for Clinical Densitometry), Professor StuartSilverman (American Society for Bone and Mineral Research), ProfessorMichael Lewiecki (International Society for Clinical Densitometry),Professor Paul Lips (International Osteoporosis Foundation), ProfessorSocrates Papapoulos (International Osteoporosis Foundation), ProfessorClaus Glüer (International Osteoporosis Foundation) and Mr Ger Teilen(Task Force Audern Arbeid, Netherlands).
The invaluable assistance of the principal investigators of the population-based cohorts is acknowledged, without whom the meta-analyses could nothave been undertaken. These include Professor Pierre Delmas, ProfessorJohn A Eisman, Professor Heikki Kroger, Professor Saeko Fujiwara,Professor Patrick Garnero, Professor Eugene McCloskey, Professor DanMellstrom, Professor L. Joseph Melton, Professor Pierre Meunier, ProfessorHuibert Pols, Professor Jonathan Reeve, Professor Alan Silman andProfessor Alan Tenenhouse. Thanks are also extended to the principalinvestigators of the cohorts used for validation, namely Professor StevenCummings, Professor Kerrie Sanders, Professor Claus Glüer, ProfessorDavid Torgerson, Professor Claus Christiansen, Professor Didier Hans,Professor Anne Marie Schott, Professor Tjerd Van Staa, Professor CyrusCooper, Professor Marc-Antoine Krieg, Professor Noriko Yoshimura,Professor Nelson B Watts, Professor Andrea LaCroix and the investigators ofthe Women’s Health Initiative. We are grateful to Angela Haden and WendyPontefract for editorial and secretarial services.
The Scientific Group gratefully acknowledges the contribution made to themeeting by the International Osteoporosis Foundation, the NationalOsteoporosis Foundation (United States), the International Society forClinical Densitometry and the American Society for Bone and MineralResearch.
Annex 1 Ten-year probabilities of hip fracture (%) in the UK according to age, sex and gradient of risk Available at www.shef.ac.uk/FRAX
Annex 2 Ten-year probabilities of hip fracture (%) in the UK population according to age, sex and risk ratio Available at www.shef.ac.uk/FRAX
Annex 3 Ten-year probability of osteoporotic fracture (%) according to BMD, the number of clinical risk factors (CRF) and age.Available at www.shef.ac.uk/FRAX
Annex 4 Ten-year probability of fracture (%) according to BMI, the number of clinical risk factors and age.Available at www.shef.ac.uk/FRAX
287

Annex 1
Ten-year probabilities of hip fracture in the United Kingdom population, byage, sex and gradient of risk
The following tables convert Z-scores of risk factor scores into 10-year hip fractureprobabilities. They can be used to approximate hip fracture probabilities from riskfactors for fracture that are not incorporated in the assessment algorithms.Examples include peripheral DXA and ultrasound techniques.
The gradients of risk vary from 1.0 (i.e. the average population risk) to 3.0/SD.
The probabilities shown are derived for the United Kingdom using hip fracturehazards from Singer et al. (1) and the mortality hazard from the United Nations(2).
Table A1.1 gives 10-year probabilities of hip fracture in men and Table A1.2 gives10-year probabilities of hip fracture in women.
In men at the age of 80 years, the average 10-year hip fracture probability is 5.0%,from Table A1.1(a). Consider, for example, peripheral DXA measurements. Manyof these techniques have a gradient of hip fracture risk of approximately 1.5/SDdecrease in BMD, so Table A1.1(c) applies. With a BMD Z-score of –1 SD, the hipfracture probability in that individual would be 6.8%, and with a Z-score of –2 itwould be 9.9%.
For women, the same example (i.e. aged 80 years; gradient of risk 1.5/SD) wouldgive probabilities of 16% and 22% with Z-scores of –1 and –2, respectively, fromTable A1.2(c).
References1. Singer BR et al. Epidemiology of fracture in 1000 adults: the influence of age and
gender. Journal of Bone and Joint Surgery, 1998, 80B:234–238.
2. World population prospects: the 2002 revision and world urban prospects. New York,United Nations Population Division, Department of Economic and Social Affairs,2003.
288

Table A1.1
Ten-year probability (%) of hip fracture according to age and Z-score for men
(a) Gradient of risk = 1.00/SD
Age Z-score (SD units)(years) -2.0 -1.5 -1.0 -0.5 0 +0.5 +1.0 +1.5 +2.0
50 0.4 0.4 0.4 0.4 0.4 0.4 0.4 0.4 0.4
55 0.6 0.6 0.6 0.6 0.6 0.6 0.6 0.6 0.6
60 1.1 1.1 1.1 1.1 1.1 1.1 1.1 1.1 1.1
65 1.9 1.9 1.9 1.9 1.9 1.9 1.9 1.9 1.9
70 2.6 2.6 2.6 2.6 2.6 2.6 2.6 2.6 2.6
75 3.8 3.8 3.8 3.8 3.8 3.8 3.8 3.8 3.8
80 5.0 5.0 5.0 5.0 5.0 5.0 5.0 5.0 5.0
85 5.1 5.1 5.1 5.1 5.1 5.1 5.1 5.1 5.1
(b) Gradient of risk = 1.25/SD
Age Z-score (SD units)(years) -2.0 -1.5 -1.0 -0.5 0 +0.5 +1.0 +1.5 +2.0
50 0.6 0.6 0.5 0.5 0.4 0.4 0.3 0.3 0.3
55 0.9 0.8 0.7 0.6 0.6 0.5 0.5 0.4 0.4
60 1.7 1.5 1.3 1.2 1.1 1.0 0.9 0.8 0.7
65 2.9 2.6 2.3 2.1 1.8 1.7 1.5 1.3 1.2
70 3.9 3.5 3.2 2.8 2.5 2.3 2.0 1.8 1.6
75 5.7 5.1 4.6 4.1 3.7 3.3 3.0 2.7 2.4
80 7.5 6.7 6.1 5.4 4.9 4.4 3.9 3.5 3.2
85 7.6 6.9 6.2 5.6 5.0 4.5 4.0 3.6 3.3
(c) Gradient of risk = 1.50/SD
Age Z-score (SD units)(years) -2.0 -1.5 -1.0 -0.5 0 +0.5 +1.0 +1.5 +2.0
50 0.9 0.7 0.6 0.5 0.4 0.3 0.3 0.2 0.2
55 1.2 1.0 0.8 0.7 0.5 0.4 0.4 0.3 0.2
60 2.3 1.9 1.5 1.2 1.0 0.8 0.7 0.6 0.5
65 3.9 3.2 2.6 2.1 1.7 1.4 1.2 1.0 0.8
70 5.3 4.4 3.6 2.9 2.4 2.0 1.6 1.3 1.1
75 7.6 6.3 5.2 4.3 3.5 2.9 2.3 1.9 1.6
80 9.9 8.2 6.8 5.6 4.6 3.8 3.1 2.6 2.1
85 10 8.4 6.9 5.7 4.7 3.9 3.2 2.6 2.2
289

(d) Gradient of risk = 1.75/SD
Age Z-score (SD units)(years) -2.0 -1.5 -1.0 -0.5 0 +0.5 +1.0 +1.5 +2.0
50 1.1 0.8 0.6 0.5 0.4 0.3 0.2 0.2 0.1
55 1.5 1.2 0.9 0.7 0.5 0.4 0.3 0.2 0.2
60 2.9 2.2 1.6 1.2 0.9 0.7 0.5 0.4 0.3
65 4.9 3.7 2.8 2.1 1.6 1.2 0.9 0.7 0.5
70 6.6 5.1 3.9 2.9 2.2 1.7 1.3 1.0 0.7
75 9.5 7.3 5.6 4.3 3.2 2.5 1.9 1.4 1.1
80 12 9.5 7.3 5.6 4.3 3.3 2.5 1.9 1.4
85 13 9.7 7.5 5.8 4.4 3.4 2.6 1.9 1.5
(e) Gradient of risk = 2.00/SD
Age Z-score (SD units)(years) -2.0 -1.5 -1.0 -0.5 0 +0.5 +1.0 +1.5 +2.0
50 1.3 0.9 0.7 0.5 0.3 0.2 0.2 0.1 0.1
55 1.9 1.3 0.9 0.7 0.5 0.3 0.2 0.2 0.1
60 3.4 2.4 1.7 1.2 0.9 0.6 0.4 0.3 0.2
65 5.8 4.1 3.0 2.1 1.5 1.1 0.7 0.5 0.4
70 7.9 5.7 4.1 2.9 2.1 1.5 1.0 0.7 0.5
75 11.2 8.1 5.9 4.2 3.0 2.1 1.5 1.1 0.8
80 14 11 7.7 5.5 4.0 2.8 2.0 1.4 1.0
85 15 11 7.8 5.7 4.1 2.9 2.1 1.5 1.0
(f) Gradient of risk = 2.25/SD
Age Z-score (SD units)(years) -2.0 -1.5 -1.0 -0.5 0 +0.5 +1.0 +1.5 +2.0
50 1.5 1.0 0.7 0.4 0.3 0.2 0.1 0.1 0.1
55 2.1 1.4 1.0 0.6 0.4 0.3 0.2 0.1 0.1
60 4.0 2.7 1.8 1.2 0.8 0.5 0.4 0.2 0.2
65 6.7 4.5 3.0 2.0 1.4 0.9 0.6 0.4 0.3
70 9.1 6.2 4.2 2.8 1.9 1.3 0.8 0.6 0.4
75 13 8.8 6.0 4.1 2.7 1.8 1.2 0.8 0.6
80 16 12 7.9 5.4 3.7 2.5 1.7 1.1 0.7
85 17 12 8.1 5.5 3.7 2.5 1.7 1.1 0.8
290

(g) Gradient of risk = 2.50/SD
Age Z-score (SD units)(years) -2.0 -1.5 -1.0 -0.5 0 +0.5 +1.0 +1.5 +2.0
50 1.7 1.1 0.7 0.4 0.3 0.2 0.1 0.1 0.0
55 2.4 1.5 1.0 0.6 0.4 0.2 0.2 0.1 0.1
60 4.4 2.8 1.8 1.1 0.7 0.5 0.3 0.2 0.1
65 7.5 4.8 3.1 2.0 1.2 0.8 0.5 0.3 0.2
70 10 6.6 4.2 2.7 1.7 1.1 0.7 0.4 0.3
75 14 9.4 6.1 3.9 2.5 1.6 1.0 0.6 0.4
80 18 12 8.0 5.2 3.3 2.1 1.4 0.9 0.5
85 18 12 8.2 5.3 3.4 2.2 1.4 0.9 0.6
(h) Gradient of risk = 2.75/SD
Age Z-score (SD units)(years) -2.0 -1.5 -1.0 -0.5 0 +0.5 +1.0 +1.5 +2.0
50 1.9 1.1 0.7 0.4 0.2 0.2 0.1 0.1 0.0
55 2.7 1.6 1.0 0.6 0.4 0.2 0.1 0.1 0.0
60 4.9 3.0 1.8 1.1 0.7 0.4 0.2 0.1 0.1
65 8.2 5.1 3.1 1.9 1.1 0.7 0.4 0.3 0.2
70 11 6.9 4.3 2.6 1.6 1.0 0.6 0.3 0.2
75 16 9.9 6.1 3.8 2.3 1.4 0.8 0.5 0.3
80 20 13 8.0 5.0 3.1 1.9 1.1 0.7 0.4
85 20 13 8.2 5.1 3.1 1.9 1.2 0.7 0.4
(i) Gradient of risk = 3.00/SD
Age Z-score (SD units)(years) -2.0 -1.5 -1.0 -0.5 0 +0.5 +1.0 +1.5 +2.0
50 2.0 1.2 0.7 0.4 0.2 0.1 0.1 0.0 0.0
55 2.9 1.7 1.0 0.6 0.3 0.2 0.1 0.1 0.0
60 5.3 3.1 1.8 1.0 0.6 0.3 0.2 0.1 0.1
65 8.9 5.3 3.1 1.8 1.0 0.6 0.3 0.2 0.1
70 12 7.2 4.2 2.5 1.4 0.8 0.5 0.3 0.2
75 17 10 6.1 3.6 2.1 1.2 0.7 0.4 0.2
80 21 13 8.0 4.8 2.8 1.6 0.9 0.5 0.3
85 21 13 8.2 4.9 2.9 1.7 1.0 0.6 0.3
291

Table A1.2
Ten-year probability (%) of hip fracture according to age and Z-score for women
(a) Gradient of risk = 1.00/SD
Age Z-score (SD units)(years) -2.0 -1.5 -1.0 -0.5 0 +0.5 +1.0 +1.5 +2.0
50 0.5 0.5 0.5 0.5 0.5 0.5 0.5 0.5 0.5
55 0.8 0.8 0.8 0.8 0.8 0.8 0.8 0.8 0.8
60 1.8 1.8 1.8 1.8 1.8 1.8 1.8 1.8 1.8
65 3.7 3.7 3.7 3.7 3.7 3.7 3.7 3.7 3.7
70 6.0 6.0 6.0 6.0 6.0 6.0 6.0 6.0 6.0
75 9.3 9.3 9.3 9.3 9.3 9.3 9.3 9.3 9.3
80 12 12 12 12 12 12 12 12 12
85 11 11 11 11 11 11 11 11 11
(b) Gradient of risk = 1.25/SD
Age Z-score (SD units)(years) -2.0 -1.5 -1.0 -0.5 0 +0.5 +1.0 +1.5 +2.0
50 0.8 0.7 0.6 0.6 0.5 0.5 0.4 0.4 0.3
55 1.3 1.1 1.0 0.9 0.8 0.7 0.6 0.6 0.5
60 2.7 2.5 2.2 2.0 1.8 1.6 1.4 1.3 1.1
65 5.5 5.0 4.5 4.0 3.6 3.2 2.9 2.6 2.3
70 9.0 8.1 7.3 6.6 5.9 5.3 4.8 4.3 3.8
75 14 12 11 10 9.1 8.2 7.4 6.6 5.9
80 17 16 14 13 12 10 9.4 8.5 7.6
85 16 15 13 12 11 9.7 8.8 7.9 7.1
(c) Gradient of risk = 1.50/SD
Age Z-score (SD units)(years) -2.0 -1.5 -1.0 -0.5 0 +0.5 +1.0 +1.5 +2.0
50 1.1 0.9 0.7 0.6 0.5 0.4 0.3 0.3 0.2
55 1.7 1.4 1.1 0.9 0.8 0.6 0.5 0.4 0.3
60 3.7 3.0 2.5 2.0 1.7 1.4 1.1 0.9 0.7
65 7.4 6.1 5.0 4.1 3.4 2.8 2.3 1.9 1.5
70 12 10 8.2 6.8 5.6 4.6 3.8 3.1 2.5
75 18 15 13 10 8.6 7.1 5.9 4.8 4.0
80 22 19 16 13 11 9.1 7.5 6.2 5.1
85 21 17 15 12 10 8.5 7.0 5.8 4.8
292

(d) Gradient of risk = 1.75
Age Z-score (SD units)(years) -2.0 -1.5 -1.0 -0.5 0 +0.5 +1.0 +1.5 +2.0
50 1.4 1.0 0.8 0.6 0.4 0.3 0.3 0.2 0.1
55 2.2 1.6 1.2 0.9 0.7 0.5 0.4 0.3 0.2
60 4.7 3.5 2.7 2.0 1.5 1.2 0.9 0.7 0.5
65 9.3 7.1 5.4 4.1 3.1 2.4 1.8 1.4 1.0
70 15 12 8.9 6.8 5.2 4.0 3.0 2.3 1.7
75 22 17 14 10 8.0 6.1 4.7 3.6 2.7
80 27 21 17 13 10 7.9 6.0 4.6 3.5
85 25 20 16 12 9.6 7.4 5.7 4.3 3.3
(e) Gradient of risk = 2.00/SD
Age Z-score (SD units)(years) -2.0 -1.5 -1.0 -0.5 0 +0.5 +1.0 +1.5 +2.0
50 1.6 1.2 0.8 0.6 0.4 0.3 0.2 0.1 0.1
55 2.6 1.8 1.3 0.9 0.7 0.5 0.3 0.2 0.2
60 5.6 4.0 2.8 2.0 1.4 1.0 0.7 0.5 0.4
65 11 8.0 5.7 4.1 2.9 2.1 1.5 1.0 0.7
70 18 13 9.3 6.7 4.8 3.4 2.4 1.7 1.2
75 26 19 14 10 7.4 5.3 3.8 2.7 1.9
80 31 24 18 13 9.5 6.8 4.9 3.5 2.5
85 29 22 17 12 8.8 6.4 4.6 3.3 2.3
(f) Gradient of risk = 2.25/SD
Age Z-score (SD units)(years) -2.0 -1.5 -1.0 -0.5 0 +0.5 +1.0 +1.5 +2.0
50 1.9 1.3 0.8 0.6 0.4 0.3 0.2 0.1 0.1
55 3.0 2.0 1.3 0.9 0.6 0.4 0.3 0.2 0.1
60 6.4 4.3 2.9 1.9 1.3 0.9 0.6 0.4 0.3
65 13 8.7 5.9 4.0 2.7 1.8 1.2 0.8 0.5
70 20 14 9.6 6.5 4.4 3.0 2.0 1.3 0.9
75 29 21 15 10 6.8 4.6 3.1 2.1 1.4
80 34 25 18 13 8.7 5.9 4.0 2.7 1.8
85 32 24 17 12 8.2 5.6 3.8 2.5 1.7
293

(g) Gradient of risk = 2.50/SD
Age Z-score (SD units)(years) -2.0 -1.5 -1.0 -0.5 0 +0.5 +1.0 +1.5 +2.0
50 2.1 1.3 0.9 0.5 0.3 0.2 0.1 0.1 0.1
55 3.4 2.1 1.4 0.9 0.5 0.3 0.2 0.1 0.1
60 7.2 4.6 2.9 1.9 1.2 0.8 0.5 0.3 0.2
65 14 9.2 6.0 3.8 2.4 1.5 1.0 0.6 0.4
70 22 15 9.7 6.3 4.0 2.6 1.6 1.0 0.7
75 32 22 15 9.6 6.2 4.0 2.6 1.6 1.0
80 37 27 18 12 8.0 5.2 3.3 2.1 1.3
85 35 25 17 11 7.5 4.8 3.1 2.0 1.3
(h) Gradient of risk = 2.75/SD
Age Z-score (SD units)(years) -2.0 -1.5 -1.0 -0.5 0 +0.5 +1.0 +1.5 +2.0
50 2.3 1.4 0.9 0.5 0.3 0.2 0.1 0.1 0.0
55 3.7 2.3 1.4 0.8 0.5 0.3 0.2 0.1 0.1
60 7.9 4.9 3.0 1.8 1.1 0.7 0.4 0.2 0.1
65 15 9.7 6.0 3.6 2.2 1.3 0.8 0.5 0.3
70 24 15 9.7 6.0 3.7 2.2 1.4 0.8 0.5
75 34 23 15 9.2 5.7 3.5 2.1 1.3 0.8
80 40 28 18 12 7.3 4.5 2.8 1.7 1.0
85 37 26 17 11 6.9 4.2 2.6 1.6 1.0
(i) Gradient of risk = 3.00/SD
Age Z-score (SD units)(years) -2.0 -1.5 -1.0 -0.5 0 +0.5 +1.0 +1.5 +2.0
50 2.5 1.5 0.9 0.5 0.3 0.2 0.1 0.1 0.0
55 4.0 2.3 1.4 0.8 0.5 0.3 0.2 0.1 0.1
60 8.6 5.0 2.9 1.7 1.0 0.6 0.3 0.2 0.1
65 17 10 5.9 3.5 2.0 1.2 0.7 0.4 0.2
70 26 16 9.7 5.7 3.4 2.0 1.1 0.7 0.4
75 36 24 15 8.8 5.2 3.1 1.8 1.0 0.6
80 42 29 18 11 6.7 4.0 2.3 1.3 0.8
85 39 27 17 10 6.3 3.7 2.2 1.3 0.7
294

Annex 2
Ten-year probabilities of hip fracture in the United Kingdom population, byage, sex and risk ratio
Tables A2.1 and A2.2 convert risk ratios into 10-year hip fracture probabilities inmen and women, respectively. The risk ratio is the risk of fracture in those with arisk factor compared to the population without the risk factor. The 10-yearprobability depends upon the prevalence of the risk factor for any given age and sex(see section 6).
The probabilities shown are derived for the United Kingdom using hip fracturehazards from Singer et al. (1) and the mortality hazard from the United Nations(2).
Take, for example, a high value for CTX, a marker of bone resorption. In theEPIDOS study the risk ratio for hip fracture in women aged 80 years wasapproximately 2.5 in women with CTX values above the normal range ofpremenopausal values compared to women with values below the premenopausalvalues. The prevalence of high CTX in women aged 80 years is approximately 25%.Inspection of Table A2.2(g) shows a 10-year hip fracture probability of 20%.
Tables A2.3 and A2.4 give 10-year probabilities in individuals without thecondition. In the example above, women aged 80 years with normal values for CTXhave a hip fracture probability of 8.8%, according to Table A2.4(g).
References1. Singer BR et al. Epidemiology of fracture in 1000 adults: the influence of age and
gender. Journal of Bone and Joint Surgery, 1998, 80B:234–238.
2. World population prospects: the 2002 revision and world urban prospects. New York,United Nations Population Division, Department of Economic and Social Affairs,2003.
295

Table A2.1
Ten-year probability (%) of hip fracture in men, by age and the proportion of the populationwith the risk factor
(a) Risk ratio= 1.00
Age(years) Proportion of population having the condition
0.05 0.10 0.15 0.20 0.25 0.30 0.35 0.40 0.45 0.50
50 0.4 0.4 0.4 0.4 0.4 0.4 0.4 0.4 0.4 0.4
55 0.6 0.6 0.6 0.6 0.6 0.6 0.6 0.6 0.6 0.6
60 1.1 1.1 1.1 1.1 1.1 1.1 1.1 1.1 1.1 1.1
65 1.9 1.9 1.9 1.9 1.9 1.9 1.9 1.9 1.9 1.9
70 2.6 2.6 2.6 2.6 2.6 2.6 2.6 2.6 2.6 2.6
75 3.8 3.8 3.8 3.8 3.8 3.8 3.8 3.8 3.8 3.8
80 5.0 5.0 5.0 5.0 5.0 5.0 5.0 5.0 5.0 5.0
85 5.1 5.1 5.1 5.1 5.1 5.1 5.1 5.1 5.1 5.1
(b) Risk ratio = 1.25
Age(years) Proportion of population having the condition
0.05 0.10 0.15 0.20 0.25 0.30 0.35 0.40 0.45 0.50
50 0.5 0.5 0.5 0.5 0.5 0.5 0.5 0.5 0.5 0.5
55 0.7 0.7 0.7 0.7 0.7 0.7 0.7 0.7 0.7 0.7
60 1.4 1.3 1.3 1.3 1.3 1.3 1.3 1.3 1.2 1.2
65 2.3 2.3 2.3 2.2 2.2 2.2 2.2 2.1 2.1 2.1
70 3.2 3.2 3.1 3.1 3.1 3.0 3.0 3.0 2.9 2.9
75 4.6 4.6 4.5 4.5 4.4 4.4 4.3 4.3 4.2 4.2
80 6.1 6.1 6.0 5.9 5.9 5.8 5.7 5.7 5.6 5.5
85 6.2 6.2 6.1 6.0 6.0 5.9 5.8 5.8 5.7 5.7
(c) Risk ratio = 1.50
Age(years) Proportion of population having the condition
0.05 0.10 0.15 0.20 0.25 0.30 0.35 0.40 0.45 0.50
50 0.6 0.6 0.6 0.6 0.6 0.5 0.5 0.5 0.5 0.5
55 0.9 0.8 0.8 0.8 0.8 0.8 0.8 0.7 0.7 0.7
60 1.6 1.6 1.5 1.5 1.5 1.4 1.4 1.4 1.3 1.3
65 2.8 2.7 2.6 2.6 2.5 2.5 2.4 2.4 2.3 2.3
70 3.8 3.7 3.6 3.5 3.5 3.4 3.3 3.2 3.2 3.1
75 5.5 5.3 5.2 5.1 5.0 4.9 4.8 4.7 4.6 4.5
80 7.2 7.0 6.9 6.7 6.6 6.5 6.3 6.2 6.1 6.0
85 7.3 7.2 7.0 6.9 6.7 6.6 6.4 6.3 6.2 6.1
296

(d) Risk ratio = 1.75
Age(years) Proportion of population having the condition
0.05 0.10 0.15 0.20 0.25 0.30 0.35 0.40 0.45 0.50
50 0.7 0.7 0.7 0.6 0.6 0.6 0.6 0.6 0.5 0.5
55 1.0 1.0 0.9 0.9 0.9 0.8 0.8 0.8 0.8 0.8
60 1.9 1.8 1.7 1.7 1.6 1.6 1.5 1.5 1.4 1.4
65 3.2 3.1 3.0 2.9 2.8 2.7 2.6 2.5 2.5 2.4
70 4.3 4.2 4.1 3.9 3.8 3.7 3.6 3.5 3.4 3.3
75 6.3 6.1 5.9 5.7 5.5 5.3 5.2 5.0 4.9 4.8
80 8.2 7.9 7.7 7.5 7.2 7.0 6.8 6.6 6.5 6.3
85 8.4 8.1 7.8 7.6 7.4 7.2 7.0 6.8 6.6 6.4
(e) Risk ratio = 2.00
Age(years) Proportion of population having the condition
0.05 0.10 0.15 0.20 0.25 0.30 0.35 0.40 0.45 0.50
50 0.8 0.8 0.7 0.7 0.7 0.6 0.6 0.6 0.6 0.6
55 1.1 1.1 1.0 1.0 0.9 0.9 0.9 0.8 0.8 0.8
60 2.1 2.0 1.9 1.8 1.8 1.7 1.6 1.6 1.5 1.5
65 3.6 3.4 3.3 3.1 3.0 2.9 2.8 2.7 2.6 2.5
70 4.9 4.7 4.5 4.3 4.1 4.0 3.8 3.7 3.6 3.5
75 7.0 6.7 6.4 6.2 6.0 5.7 5.5 5.3 5.2 5.0
80 9.2 8.8 8.4 8.1 7.8 7.5 7.3 7.0 6.8 6.6
85 9.4 9.0 8.6 8.3 8.0 7.7 7.4 7.2 6.9 6.7
(f) Risk ratio = 2.25
Age(years)Proportion of population having the condition
0.05 0.10 0.15 0.20 0.25 0.30 0.35 0.40 0.45 0.50
50 0.9 0.8 0.8 0.7 0.7 0.7 0.6 0.6 0.6 0.6
55 1.2 1.2 1.1 1.1 1.0 1.0 0.9 0.9 0.9 0.8
60 2.3 2.2 2.1 2.0 1.9 1.8 1.7 1.6 1.6 1.5
65 4.0 3.7 3.5 3.4 3.2 3.1 2.9 2.8 2.7 2.6
70 5.4 5.1 4.9 4.6 4.4 4.2 4.0 3.9 3.7 3.6
75 7.8 7.4 7.0 6.7 6.4 6.1 5.8 5.6 5.4 5.2
80 10 9.6 9.1 8.7 8.3 8.0 7.7 7.4 7.1 6.8
85 10 9.8 9.3 8.9 8.5 8.1 7.8 7.5 7.2 7.0
297

(g) Risk ratio = 2.50
Age(years) Proportion of population having the condition
0.05 0.10 0.15 0.20 0.25 0.30 0.35 0.40 0.45 0.50
50 1.0 0.9 0.8 0.8 0.8 0.7 0.7 0.6 0.6 0.6
55 1.4 1.3 1.2 1.1 1.1 1.0 1.0 0.9 0.9 0.8
60 2.5 2.4 2.2 2.1 2.0 1.9 1.8 1.7 1.6 1.6
65 4.3 4.1 3.8 3.6 3.4 3.2 3.1 2.9 2.8 2.7
70 5.9 5.6 5.2 4.9 4.7 4.4 4.2 4.0 3.9 3.7
75 8.5 8.0 7.5 7.1 6.7 6.4 6.1 5.8 5.6 5.3
80 11 10 9.8 9.3 8.8 8.4 8.0 7.6 7.3 7.0
85 11 11 10 9.4 9.0 8.5 8.1 7.8 7.5 7.2
(h) Risk ratio = 2.75
Age(years) Proportion of population having the condition
0.05 0.10 0.15 0.20 0.25 0.30 0.35 0.40 0.45 0.50
50 1.0 1.0 0.9 0.8 0.8 0.7 0.7 0.7 0.6 0.6
55 1.5 1.4 1.3 1.2 1.1 1.1 1.0 1.0 0.9 0.9
60 2.8 2.6 2.4 2.2 2.1 2.0 1.9 1.8 1.7 1.6
65 4.7 4.4 4.1 3.8 3.6 3.4 3.2 3.0 2.9 2.8
70 6.4 6.0 5.6 5.2 4.9 4.6 4.4 4.2 4.0 3.8
75 9.2 8.5 8.0 7.5 7.1 6.7 6.3 6.0 5.7 5.5
80 12 11 10 9.8 9.2 8.7 8.3 7.9 7.5 7.2
85 12 11 11 9.9 9.4 8.9 8.4 8.0 7.7 7.3
(i) Risk ratio = 3.00
Age(years) Proportion of population having the condition
0.05 0.10 0.15 0.20 0.25 0.30 0.35 0.40 0.45 0.50
50 1.1 1.0 1.0 0.9 0.8 0.8 0.7 0.7 0.7 0.6
55 1.6 1.5 1.4 1.3 1.2 1.1 1.0 1.0 0.9 0.9
60 3.0 2.7 2.5 2.3 2.2 2.1 1.9 1.8 1.7 1.6
65 5.1 4.6 4.3 4.0 3.7 3.5 3.3 3.1 3.0 2.8
70 6.9 6.4 5.9 5.5 5.1 4.8 4.5 4.3 4.1 3.9
75 9.8 9.1 8.4 7.9 7.4 6.9 6.5 6.2 5.9 5.6
80 13 12 11 10 9.6 9.1 8.6 8.1 7.7 7.4
85 13 12 11 10 9.8 9.2 8.7 8.3 7.9 7.5
298

Table A2.2
Ten-year probability (%) of hip fracture in women, by age, risk ratio and proportion ofpopulation with the risk factor
(a) Risk ratio = 1.00
Age(years) Proportion of population having the condition
0.05 0.10 0.15 0.20 0.25 0.30 0.35 0.40 0.45 0.50
50 0.5 0.5 0.5 0.5 0.5 0.5 0.5 0.5 0.5 0.5
55 0.8 0.8 0.8 0.8 0.8 0.8 0.8 0.8 0.8 0.8
60 1.8 1.8 1.8 1.8 1.8 1.8 1.8 1.8 1.8 1.8
65 3.7 3.7 3.7 3.7 3.7 3.7 3.7 3.7 3.7 3.7
70 6.0 6.0 6.0 6.0 6.0 6.0 6.0 6.0 6.0 6.0
75 9.3 9.3 9.3 9.3 9.3 9.3 9.3 9.3 9.3 9.3
80 12 12 12 12 12 12 12 12 12 12
85 11 11 11 11 11 11 11 11 11 11
(b) Risk ratio = 1.25
Age(years) Proportion of population having the condition
0.05 0.10 0.15 0.20 0.25 0.30 0.35 0.40 0.45 0.50
50 0.6 0.6 0.6 0.6 0.6 0.6 0.6 0.6 0.6 0.6
55 1.0 1.0 1.0 1.0 1.0 1.0 1.0 0.9 0.9 0.9
60 2.2 2.2 2.2 2.1 2.1 2.1 2.1 2.0 2.0 2.0
65 4.5 4.5 4.4 4.4 4.3 4.3 4.2 4.2 4.1 4.1
70 7.4 7.3 7.2 7.1 7.1 7.0 6.9 6.8 6.8 6.7
75 11 11 11 11 11 11 11 11 10 10
80 14 14 14 14 14 14 13 13 13 13
85 13 13 13 13 13 13 13 12 12 12
(c) Risk ratio = 1.50
Age(years) Proportion of population having the condition
0.05 0.10 0.15 0.20 0.25 0.30 0.35 0.40 0.45 0.50
50 0.8 0.7 0.7 0.7 0.7 0.7 0.7 0.7 0.6 0.6
55 1.2 1.2 1.2 1.1 1.1 1.1 1.1 1.0 1.0 1.0
60 2.6 2.6 2.5 2.5 2.4 2.3 2.3 2.3 2.2 2.2
65 5.3 5.2 5.1 5.0 4.9 4.8 4.7 4.6 4.5 4.4
70 8.7 8.5 8.3 8.1 8.0 7.8 7.6 7.5 7.3 7.2
75 13 13 13 12 12 12 12 11 11 11
80 17 16 16 16 15 15 15 14 14 14
85 16 15 15 15 14 14 14 14 13 13
299

(d) Risk ratio = 1.75
Age(years) Proportion of population having the condition
0.05 0.10 0.15 0.20 0.25 0.30 0.35 0.40 0.45 0.50
50 0.9 0.8 0.8 0.8 0.8 0.7 0.7 0.7 0.7 0.7
55 1.4 1.3 1.3 1.3 1.2 1.2 1.1 1.1 1.1 1.1
60 3.0 2.9 2.8 2.7 2.6 2.6 2.5 2.4 2.4 2.3
65 6.1 5.9 5.7 5.5 5.4 5.2 5.0 4.9 4.8 4.6
70 9.9 9.6 9.3 9.0 8.8 8.5 8.3 8.0 7.8 7.6
75 15 15 14 14 13 13 13 12 12 12
80 19 18 18 17 17 16 16 15 15 15
85 18 17 17 16 16 15 15 14 14 14
(e) Risk ratio = 2.00
Age(years) Proportion of population having the condition
0.05 0.10 0.15 0.20 0.25 0.30 0.35 0.40 0.45 0.50
50 1.0 0.9 0.9 0.9 0.8 0.8 0.8 0.7 0.7 0.7
55 1.6 1.5 1.4 1.4 1.3 1.3 1.2 1.2 1.1 1.1
60 3.4 3.3 3.1 3.0 2.9 2.8 2.7 2.6 2.5 2.4
65 6.9 6.6 6.3 6.0 5.8 5.6 5.4 5.2 5.0 4.9
70 11 11 10 9.8 9.5 9.1 8.8 8.5 8.2 8.0
75 17 16 16 15 14 14 13 13 13 12
80 21 20 19 19 18 17 17 16 16 15
85 19 19 18 17 17 16 16 15 15 14
(f) Risk ratio = 2.25
Age(years) Proportion of population having the condition
0.05 0.10 0.15 0.20 0.25 0.30 0.35 0.40 0.45 0.50
50 1.1 1.0 1.0 0.9 0.9 0.9 0.8 0.8 0.8 0.7
55 1.8 1.7 1.6 1.5 1.4 1.4 1.3 1.2 1.2 1.1
60 3.8 3.6 3.4 3.2 3.1 2.9 2.8 2.7 2.6 2.5
65 7.6 7.2 6.8 6.5 6.2 5.9 5.7 5.4 5.2 5.0
70 12 12 11 11 10 9.7 9.3 8.9 8.6 8.3
75 18 18 17 16 15 15 14 14 13 13
80 23 22 21 20 19 18 18 17 16 16
85 21 20 19 19 18 17 16 16 15 15
300

(g) Risk ratio = 2.50
Age(years) Proportion of population having the condition
0.05 0.10 0.15 0.20 0.25 0.30 0.35 0.40 0.45 0.50
50 1.2 1.1 1.1 1.0 0.9 0.9 0.9 0.8 0.8 0.7
55 1.9 1.8 1.7 1.6 1.5 1.4 1.4 1.3 1.2 1.2
60 4.1 3.9 3.6 3.4 3.3 3.1 2.9 2.8 2.7 2.6
65 8.3 7.8 7.3 6.9 6.6 6.2 5.9 5.7 5.4 5.2
70 13 13 12 11 11 10 9.7 9.3 8.9 8.5
75 20 19 18 17 16 15 15 14 14 13
80 24 23 22 21 20 19 18 18 17 16
85 23 22 21 20 19 18 17 16 16 15
(h) Risk ratio = 2.75
Age(years) Proportion of population having the condition
0.05 0.10 0.15 0.20 0.25 0.30 0.35 0.40 0.45 0.50
50 1.3 1.2 1.1 1.1 1.0 0.9 0.9 0.8 0.8 0.8
55 2.1 1.9 1.8 1.7 1.6 1.5 1.4 1.3 1.3 1.2
60 4.5 4.2 3.9 3.6 3.4 3.2 3.1 2.9 2.8 2.6
65 9.0 8.4 7.8 7.3 6.9 6.5 6.2 5.9 5.6 5.3
70 15 14 13 12 11 11 10 9.6 9.1 8.7
75 21 20 19 18 17 16 15 15 14 13
80 26 25 23 22 21 20 19 18 17 17
85 24 23 22 21 19 19 18 17 16 16
(i) Risk ratio = 3.00
Age(years) Proportion of population having the condition
0.05 0.10 0.15 0.20 0.25 0.30 0.35 0.40 0.45 0.50
50 1.4 1.3 1.2 1.1 1.0 1.0 0.9 0.9 0.8 0.8
55 2.2 2.1 1.9 1.8 1.7 1.6 1.5 1.4 1.3 1.2
60 4.8 4.4 4.1 3.8 3.6 3.4 3.2 3.0 2.8 2.7
65 9.7 8.9 8.2 7.7 7.2 6.8 6.4 6.0 5.7 5.4
70 16 14 13 12 12 11 10 9.8 9.3 8.9
75 23 21 20 19 18 17 16 15 14 14
80 28 26 24 23 22 21 19 19 18 17
85 26 24 23 21 20 19 18 17 17 16
301

Table A2.3
Ten-year probability (%) of hip fractures, by age, prevalence of risk factor and risk ratio inmen without the risk factor
(a) Risk ratio = 1.00
Age(years) Proportion of population without the condition
0.05 0.10 0.15 0.20 0.25 0.30 0.35 0.40 0.45 0.50
50 0.4 0.4 0.4 0.4 0.4 0.4 0.4 0.4 0.4 0.4
55 0.6 0.6 0.6 0.6 0.6 0.6 0.6 0.6 0.6 0.6
60 1.1 1.1 1.1 1.1 1.1 1.1 1.1 1.1 1.1 1.1
65 1.9 1.9 1.9 1.9 1.9 1.9 1.9 1.9 1.9 1.9
70 2.6 2.6 2.6 2.6 2.6 2.6 2.6 2.6 2.6 2.6
75 3.8 3.8 3.8 3.8 3.8 3.8 3.8 3.8 3.8 3.8
80 5.0 5.0 5.0 5.0 5.0 5.0 5.0 5.0 5.0 5.0
85 5.1 5.1 5.1 5.1 5.1 5.1 5.1 5.1 5.1 5.1
(b) Risk ratio = 1.25
Age(years) Proportion of population without the condition
0.05 0.10 0.15 0.20 0.25 0.30 0.35 0.40 0.45 0.50
50 0.4 0.4 0.4 0.4 0.4 0.4 0.4 0.4 0.4 0.4
55 0.6 0.6 0.6 0.6 0.6 0.6 0.5 0.5 0.5 0.5
60 1.1 1.1 1.1 1.1 1.0 1.0 1.0 1.0 1.0 1.0
65 1.9 1.8 1.8 1.8 1.8 1.8 1.7 1.7 1.7 1.7
70 2.6 2.5 2.5 2.5 2.5 2.4 2.4 2.4 2.3 2.3
75 3.7 3.7 3.6 3.6 3.6 3.5 3.5 3.4 3.4 3.4
80 5.0 4.9 4.8 4.8 4.7 4.7 4.6 4.6 4.5 4.5
85 5.1 5.0 4.9 4.9 4.8 4.8 4.7 4.7 4.6 4.6
(c) Risk ratio = 1.50
Age(years) Proportion of population without the condition
0.05 0.10 0.15 0.20 0.25 0.30 0.35 0.40 0.45 0.50
50 0.4 0.4 0.4 0.4 0.4 0.4 0.4 0.3 0.3 0.3
55 0.6 0.6 0.6 0.5 0.5 0.5 0.5 0.5 0.5 0.5
60 1.1 1.1 1.0 1.0 1.0 1.0 0.9 0.9 0.9 0.9
65 1.8 1.8 1.8 1.7 1.7 1.6 1.6 1.6 1.5 1.5
70 2.5 2.5 2.4 2.4 2.3 2.3 2.2 2.2 2.1 2.1
75 3.7 3.6 3.5 3.4 3.4 3.3 3.2 3.2 3.1 3.0
80 4.9 4.8 4.7 4.6 4.5 4.4 4.3 4.2 4.1 4.0
85 5.0 4.9 4.8 4.7 4.6 4.5 4.4 4.3 4.2 4.1
302

(d) Risk ratio = 1.75
Age(years) Proportion of population without the condition
0.05 0.10 0.15 0.20 0.25 0.30 0.35 0.40 0.45 0.50
50 0.4 0.4 0.4 0.4 0.4 0.3 0.3 0.3 0.3 0.3
55 0.6 0.6 0.5 0.5 0.5 0.5 0.5 0.5 0.4 0.4
60 1.1 1.0 1.0 1.0 0.9 0.9 0.9 0.8 0.8 0.8
65 1.8 1.8 1.7 1.6 1.6 1.5 1.5 1.5 1.4 1.4
70 2.5 2.4 2.3 2.3 2.2 2.1 2.1 2.0 2.0 1.9
75 3.6 3.5 3.4 3.3 3.2 3.1 3.0 2.9 2.8 2.8
80 4.8 4.7 4.5 4.4 4.2 4.1 4.0 3.9 3.8 3.7
85 4.9 4.8 4.6 4.5 4.3 4.2 4.1 4.0 3.9 3.8
(e) Risk ratio = 2.00
Age(years) Proportion of population without the condition
0.05 0.10 0.15 0.20 0.25 0.30 0.35 0.40 0.45 0.50
50 0.4 0.4 0.4 0.3 0.3 0.3 0.3 0.3 0.3 0.3
55 0.6 0.5 0.5 0.5 0.5 0.5 0.4 0.4 0.4 0.4
60 1.1 1.0 1.0 0.9 0.9 0.8 0.8 0.8 0.8 0.7
65 1.8 1.7 1.6 1.6 1.5 1.5 1.4 1.4 1.3 1.3
70 2.5 2.4 2.3 2.2 2.1 2.0 1.9 1.9 1.8 1.7
75 3.6 3.4 3.3 3.2 3.0 2.9 2.8 2.7 2.6 2.5
80 4.8 4.6 4.4 4.2 4.0 3.9 3.8 3.6 3.5 3.4
85 4.9 4.7 4.5 4.3 4.1 4.0 3.8 3.7 3.6 3.5
(f) Risk ratio = 2.25
Age(years) Proportion of population without the condition
0.05 0.10 0.15 0.20 0.25 0.30 0.35 0.40 0.45 0.50
50 0.4 0.4 0.4 0.3 0.3 0.3 0.3 0.3 0.3 0.3
55 0.6 0.5 0.5 0.5 0.5 0.4 0.4 0.4 0.4 0.4
60 1.0 1.0 0.9 0.9 0.8 0.8 0.8 0.7 0.7 0.7
65 1.8 1.7 1.6 1.5 1.4 1.4 1.3 1.3 1.2 1.2
70 2.5 2.3 2.2 2.1 2.0 1.9 1.8 1.7 1.7 1.6
75 3.6 3.4 3.2 3.0 2.9 2.8 2.7 2.5 2.4 2.4
80 4.7 4.5 4.2 4.0 3.9 3.7 3.5 3.4 3.3 3.1
85 4.8 4.6 4.3 4.1 3.9 3.8 3.6 3.5 3.3 3.2
303

(g) Risk ratio = 2.50
Age(years) Proportion of population without the condition
0.05 0.10 0.15 0.20 0.25 0.30 0.35 0.40 0.45 0.50
50 0.4 0.4 0.3 0.3 0.3 0.3 0.3 0.3 0.2 0.2
55 0.6 0.5 0.5 0.5 0.4 0.4 0.4 0.4 0.4 0.3
60 1.0 1.0 0.9 0.8 0.8 0.8 0.7 0.7 0.7 0.6
65 1.8 1.6 1.5 1.5 1.4 1.3 1.2 1.2 1.1 1.1
70 2.4 2.3 2.1 2.0 1.9 1.8 1.7 1.6 1.6 1.5
75 3.5 3.3 3.1 2.9 2.8 2.6 2.5 2.4 2.3 2.2
80 4.7 4.4 4.1 3.9 3.7 3.5 3.3 3.2 3.0 2.9
85 4.8 4.5 4.2 4.0 3.8 3.6 3.4 3.3 3.1 3.0
(h) Risk ratio = 2.75
Age(years) Proportion of population without the condition
0.05 0.10 0.15 0.20 0.25 0.30 0.35 0.40 0.45 0.50
50 0.4 0.4 0.3 0.3 0.3 0.3 0.3 0.2 0.2 0.2
55 0.5 0.5 0.5 0.4 0.4 0.4 0.4 0.3 0.3 0.3
60 1.0 0.9 0.9 0.8 0.8 0.7 0.7 0.7 0.6 0.6
65 1.7 1.6 1.5 1.4 1.3 1.2 1.2 1.1 1.1 1.0
70 2.4 2.2 2.1 1.9 1.8 1.7 1.6 1.5 1.5 1.4
75 3.5 3.2 3.0 2.8 2.7 2.5 2.4 2.3 2.1 2.0
80 4.6 4.3 4.0 3.8 3.5 3.3 3.2 3.0 2.9 2.7
85 4.7 4.4 4.1 3.8 3.6 3.4 3.2 3.1 2.9 2.8
(i) Risk ratio = 3.00
Age(years) Proportion of population without the condition
0.05 0.10 0.15 0.20 0.25 0.30 0.35 0.40 0.45 0.50
50 0.4 0.3 0.3 0.3 0.3 0.3 0.2 0.2 0.2 0.2
55 0.5 0.5 0.5 0.4 0.4 0.4 0.3 0.3 0.3 0.3
60 1.0 0.9 0.8 0.8 0.7 0.7 0.7 0.6 0.6 0.6
65 1.7 1.6 1.5 1.4 1.3 1.2 1.1 1.1 1.0 1.0
70 2.4 2.2 2.0 1.9 1.7 1.6 1.5 1.5 1.4 1.3
75 3.4 3.2 2.9 2.7 2.5 2.4 2.3 2.1 2.0 1.9
80 4.6 4.2 3.9 3.6 3.4 3.2 3.0 2.8 2.7 2.6
85 4.7 4.3 4.0 3.7 3.5 3.3 3.1 2.9 2.8 2.6
304

Table A2.4
Ten-year probability (%) of hip fracture, by age, prevalence of risk factor and risk ratio inwomen without the risk factor
(a) Risk ratio = 1.00
Age(years) Proportion of population without the condition
0.05 0.10 0.15 0.20 0.25 0.30 0.35 0.40 0.45 0.50
50 0.5 0.5 0.5 0.5 0.5 0.5 0.5 0.5 0.5 0.5
55 0.8 0.8 0.8 0.8 0.8 0.8 0.8 0.8 0.8 0.8
60 1.8 1.8 1.8 1.8 1.8 1.8 1.8 1.8 1.8 1.8
65 3.7 3.7 3.7 3.7 3.7 3.7 3.7 3.7 3.7 3.7
70 6.0 6.0 6.0 6.0 6.0 6.0 6.0 6.0 6.0 6.0
75 9.3 9.3 9.3 9.3 9.3 9.3 9.3 9.3 9.3 9.3
80 12 12 12 12 12 12 12 12 12 12
85 11 11 11 11 11 11 11 11 11 11
(b) Risk ratio = 1.25
Age(years) Proportion of population without the condition
0.05 0.10 0.15 0.20 0.25 0.30 0.35 0.40 0.45 0.50
50 0.5 0.5 0.5 0.5 0.5 0.5 0.5 0.5 0.5 0.5
55 0.8 0.8 0.8 0.8 0.8 0.8 0.8 0.8 0.7 0.7
60 1.8 1.8 1.7 1.7 1.7 1.7 1.7 1.6 1.6 1.6
65 3.6 3.6 3.5 3.5 3.5 3.4 3.4 3.3 3.3 3.3
70 6.0 5.9 5.8 5.8 5.7 5.6 5.6 5.5 5.5 5.4
75 9.2 9.1 9.0 8.9 8.8 8.7 8.6 8.5 8.4 8.3
80 12 12 11 11 11 11 11 11 11 11
85 11 11 11 11 10 10 10 10 10 9.9
(c) Risk ratio = 1.50
Age(years) Proportion of population without the condition
0.05 0.10 0.15 0.20 0.25 0.30 0.35 0.40 0.45 0.50
50 0.5 0.5 0.5 0.5 0.5 0.5 0.4 0.4 0.4 0.4
55 0.8 0.8 0.8 0.8 0.7 0.7 0.7 0.7 0.7 0.7
60 1.8 1.7 1.7 1.6 1.6 1.6 1.5 1.5 1.5 1.4
65 3.6 3.5 3.4 3.3 3.3 3.2 3.1 3.1 3.0 2.9
70 5.9 5.8 5.6 5.5 5.4 5.3 5.2 5.1 5.0 4.9
75 9.1 8.9 8.7 8.5 8.3 8.2 8.0 7.8 7.7 7.5
80 12 11 11 11 11 10 10 10 9.8 9.6
85 11 11 10 10 9.9 9.7 9.5 9.3 9.2 9.0
305

(d) Risk ratio = 1.75
Age(years) Proportion of population without the condition
0.05 0.10 0.15 0.20 0.25 0.30 0.35 0.40 0.45 0.50
50 0.5 0.5 0.5 0.5 0.4 0.4 0.4 0.4 0.4 0.4
55 0.8 0.8 0.7 0.7 0.7 0.7 0.7 0.6 0.6 0.6
60 1.7 1.7 1.6 1.6 1.5 1.5 1.4 1.4 1.4 1.3
65 3.5 3.4 3.3 3.2 3.1 3.0 2.9 2.8 2.8 2.7
70 5.8 5.6 5.5 5.3 5.1 5.0 4.8 4.7 4.6 4.4
75 9.0 8.7 8.4 8.2 7.9 7.7 7.5 7.3 7.1 6.9
80 11 11 11 10 10 9.8 9.5 9.3 9.0 8.8
85 11 10 10 9.7 9.4 9.2 8.9 8.7 8.4 8.2
(e) Risk ratio = 2.00
Age(years) Proportion of population without the condition
0.05 0.10 0.15 0.20 0.25 0.30 0.35 0.40 0.45 0.50
50 0.5 0.5 0.5 0.4 0.4 0.4 0.4 0.4 0.4 0.3
55 0.8 0.8 0.7 0.7 0.7 0.6 0.6 0.6 0.6 0.6
60 1.7 1.6 1.6 1.5 1.4 1.4 1.3 1.3 1.2 1.2
65 3.5 3.3 3.2 3.1 2.9 2.8 2.7 2.6 2.5 2.5
70 5.8 5.5 5.3 5.1 4.9 4.7 4.5 4.4 4.2 4.1
75 8.9 8.5 8.2 7.8 7.5 7.3 7.0 6.8 6.5 6.3
80 11 11 10 10 9.6 9.3 8.9 8.6 8.4 8.1
85 11 10 9.7 9.3 9.0 8.7 8.4 8.1 7.8 7.6
(f) Risk ratio = 2.25
Age(years) Proportion of population without the condition
0.05 0.10 0.15 0.20 0.25 0.30 0.35 0.40 0.45 0.50
50 0.5 0.5 0.4 0.4 0.4 0.4 0.4 0.3 0.3 0.3
55 0.8 0.7 0.7 0.7 0.6 0.6 0.6 0.6 0.5 0.5
60 1.7 1.6 1.5 1.4 1.4 1.3 1.3 1.2 1.2 1.1
65 3.5 3.3 3.1 2.9 2.8 2.7 2.6 2.5 2.4 2.3
70 5.7 5.4 5.1 4.9 4.6 4.4 4.3 4.1 3.9 3.8
75 8.8 8.3 7.9 7.5 7.2 6.9 6.6 6.3 6.1 5.9
80 11 11 10 9.6 9.2 8.8 8.4 8.1 7.8 7.5
85 10 9.9 9.4 9.0 8.6 8.2 7.9 7.6 7.3 7.0
306

(g) Risk ratio = 2.50
Age(years) Proportion of population without the condition
0.05 0.10 0.15 0.20 0.25 0.30 0.35 0.40 0.45 0.50
50 0.5 0.5 0.4 0.4 0.4 0.4 0.3 0.3 0.3 0.3
55 0.8 0.7 0.7 0.6 0.6 0.6 0.5 0.5 0.5 0.5
60 1.7 1.6 1.5 1.4 1.3 1.2 1.2 1.1 1.1 1.0
65 3.4 3.2 3.0 2.8 2.7 2.5 2.4 2.3 2.2 2.1
70 5.6 5.3 5.0 4.7 4.4 4.2 4.0 3.8 3.7 3.5
75 8.7 8.2 7.7 7.3 6.9 6.5 6.2 6.0 5.7 5.5
80 11 10 9.8 9.3 8.8 8.4 8.0 7.6 7.3 7.0
85 11 9.7 9.2 8.7 8.2 7.8 7.5 7.1 6.8 6.6
(h) Risk ratio = 2.75
Age(years) Proportion of population without the condition
0.05 0.10 0.15 0.20 0.25 0.30 0.35 0.40 0.45 0.50
50 0.5 0.4 0.4 0.4 0.4 0.3 0.3 0.3 0.3 0.3
55 0.8 0.7 0.7 0.6 0.6 0.5 0.5 0.5 0.5 0.4
60 1.7 1.5 1.4 1.3 1.3 1.2 1.1 1.1 1.0 1.0
65 3.4 3.1 2.9 2.7 2.6 2.4 2.3 2.2 2.1 2.0
70 5.6 5.2 4.8 4.5 4.3 4.0 3.8 3.6 3.4 3.3
75 8.6 8.0 7.5 7.0 6.6 6.2 5.9 5.6 5.3 5.1
80 11 10 9.5 8.9 8.4 8.0 7.6 7.2 6.9 6.6
85 10 9.5 8.9 8.4 7.9 7.5 7.1 6.7 6.4 6.1
(i) Risk ratio = 3.00
Age(years) Proportion of population without the condition
0.05 0.10 0.15 0.20 0.25 0.30 0.35 0.40 0.45 0.50
50 0.5 0.4 0.4 0.4 0.3 0.3 0.3 0.3 0.3 0.3
55 0.8 0.7 0.6 0.6 0.6 0.5 0.5 0.5 0.4 0.4
60 1.6 1.5 1.4 1.3 1.2 1.1 1.1 1.0 1.0 0.9
65 3.3 3.1 2.8 2.6 2.5 2.3 2.2 2.1 2.0 1.9
70 5.5 5.1 4.7 4.4 4.1 3.8 3.6 3.4 3.2 3.1
75 8.5 7.8 7.3 6.8 6.3 6.0 5.6 5.3 5.0 4.8
80 11 10.0 9.3 8.6 8.1 7.6 7.2 6.8 6.5 6.2
85 10 9.3 8.7 8.1 7.6 7.1 6.7 6.4 6.1 5.8
307

Annex 3
Ten-year probabilities of fracture in the United Kingdom population, bybone mineral density, the number of clinical risk factors, age and sex
The following tables give the 10–year probability of fracture (%) according toBMD, the number of clinical risk factors (CRF) and age. These estimates are basedon the epidemiology of the United Kingdom (1,2). Each table provides a meanestimate and a range. The range is not a confidence interval but, because the weightof different risk factors varies, it is a true range.
Table A3.1 gives the probabilities for clinical spine, hip, forearm and humerusfracture (osteoporotic fracture) in men.
Table A3.2 gives the probabilities for hip fracture in men.
Table A3.3 gives the probabilities for clinical spine, hip, forearm and humerusfracture (osteoporotic fracture) in women.
Table A3.4 gives the probabilities of hip fracture in women.
References
1. Singer BR et al. Epidemiology of fracture in 1000 adults: the influence of age andgender. Journal of Bone and Joint Surgery, 1998, 80B:234–238.
2. World population prospects: the 2002 revision and world urban prospects. New York,United Nations Population Division, Department of Economic and Social Affairs,2003.
308

Table A3.1
Ten-year probability of osteoporotic fracture (%), by BMD T-score at the femoral neck, the number of clinical risk factors (CRFs) and age in men fromthe United Kingdom
Age = 50 years
Number of CRFs BMD T-score (femoral neck)
-4.0 -3.5 -3.0 -2.5 -2.0 -1.5 -1.0 -0.5 0 0.5 1.0
0 20 13 9.0 6.5 5.0 4.0 3.4 2.9 2.7 2.5 2.4
1 30 (26-38) 20 (18-25) 14 (12-17) 9.8 (7.9-12) 7.5 (5.6-9.4) 6.1 (4.3-7.8) 5.1 (3.5-6.8) 4.4 (2.9-6.0) 4.0 (2.6-5.5) 3.8 (2.4-5.3) 3.6 (2.3-5.1)
2 43 (34-56) 29 (23-40) 20 (16-28) 15 (10-20) 11 (7.3-17) 9.0 (5.4-14) 7.5 (4.3-12) 6.5 (3.5-11) 5.9 (3.1-10) 5.6 (2.9-9.7) 5.4 (2.8-9.4)
3 57 (44-70) 41 (30-51) 29 (21-39) 21 (14-31) 16 (9.7-26) 13 (7.2-22) 11 (5.6-19) 9.3 (4.6-17) 8.4 (4.0-16) 8.0 (3.7-15) 7.7 (3.5-15)
4 71 (56-81) 54 (39-64) 40 (28-48) 30 (20-39) 23 (15-32) 18 (12-28) 15 (9.1-24) 13 (7.4-22) 12 (6.4-20) 11 (6.0-19) 11 (5.7-19)
5 82 (74-88) 68 (57-75) 52 (42-57) 40 (31-46) 31 (24-38) 25 (19-33) 21 (16-28) 18 (14-25) 17 (12-23) 16 (11-22) 15 (10-22)
6 90 80 66 52 41 34 29 25 22 21 20
Age = 55 years
Number of CRFs BMD T-score (femoral neck)
-4.0 -3.5 -3.0 -2.5 -2.0 -1.5 -1.0 -0.5 0 0.5 1.0
0 22 15 10 7.6 5.9 4.7 3.9 3.3 3.1 2.9 2.7
1 32 (29-38) 22 (20-26) 15 (13-19) 11 (9.1-14) 8.7 (6.6-11) 7.0 (5.0-9.0) 5.8 (4.0-7.7) 5.0 (3.3-6.8) 4.5 (3.0-6.3) 4.3 (2.7-6.0) 4.0 (2.6-5.7)
2 44 (36-55) 31 (25-41) 22 (18-30) 16 (12-22) 13 (8.6-19) 10 (6.4-16) 8.5 (5.0-14) 7.2 (4.0-12) 6.6 (3.6-11) 6.2 (3.3-11) 5.9 (3.1-10)
3 57 (46-67) 42 (33-52) 31 (24-41) 23 (16-34) 18 (11-28) 15 (8.4-24) 12 (6.5-21) 10 (5.3-18) 9.4 (4.6-17) 8.8 (4.2-16) 8.4 (3.9-16)
4 70 (57-78) 55 (42-63) 42 (31-51) 32 (23-42) 25 (18-35) 20 (14-30) 17 (10-26) 14 (8.4-23) 13 (7.3-22) 12 (6.7-21) 12 (6.2-20)
5 80 (74-85) 68 (59-73) 54 (46-60) 43 (35-50) 34 (27-42) 28 (22-36) 23 (18-31) 20 (15-27) 18 (13-25) 17 (12-24) 16 (11-23)
6 87 79 67 54 44 36 31 26 24 23 22
309

Age = 60 years
Number of CRFs BMD T-score (femoral neck)
-4.0 -3.5 -3.0 -2.5 -2.0 -1.5 -1.0 -0.5 0 0.5 1.0
0 22 15 11 8.4 6.6 5.3 4.4 3.7 3.4 3.1 2.9
1 31 (28-35) 22 (20-26) 16 (14-19) 12 (9.8-14) 9.6 (7.3-12) 7.7 (5.6-9.9) 6.4 (4.4-8.5) 5.4 (3.6-7.3) 5.0 (3.3-6.9) 4.6 (3.0-6.5) 4.3 (2.8-6.1)
2 41 (35-51) 31 (26-39) 23 (18-29) 18 (13-24) 14 (9.5-20) 11 (7.1-17) 9.2 (5.5-14) 7.8 (4.5-13) 7.1 (4.0-12) 6.6 (3.6-11) 6.2 (3.3-10)
3 53 (44-62) 41 (33-50) 31 (24-41) 24 (17-35) 19 (13-29) 16 (9.4-25) 13 (7.3-22) 11 (5.9-19) 10 (5.1-18) 9.3 (4.6-17) 8.8 (4.3-16)
4 65 (54-71) 52 (42-60) 42 (32-50) 33 (24-43) 26 (19-36) 21 (15-31) 18 (11-27) 15 (9.2-24) 14 (8.0-23) 13 (7.2-21) 12 (6.6-20)
5 74 (69-78) 64 (57-69) 52 (45-59) 43 (36-50) 35 (29-43) 29 (23-37) 24 (19-32) 20 (16-28) 19 (14-26) 17 (12-25) 16 (11-23)
6 82 73 63 53 44 37 31 27 25 23 22
Age = 65 years
Number of CRFs BMD T-score (femoral neck)
-4.0 -3.5 -3.0 -2.5 -2.0 -1.5 -1.0 -0.5 0 0.5 1.0
0 21 16 12 9.4 7.5 6.1 5.1 4.3 4.0 3.6 3.4
1 29 (26–33) 22 (19–25) 17 (14–20) 13 (11–16) 11 (8.1–13) 8.8 (6.3–11) 7.3 (5.1–9.7) 6.3 (4.2–8.5) 5.7 (3.8–7.9) 5.2 (3.4–7.4) 4.9 (3.1–6.9)
2 39 (33–46) 30 (25–36) 24 (19–30) 19 (14–25) 15 (10–21) 12 (8.0–18) 10 (6.3–16) 8.8 (5.2–14) 8.1 (4.6–13) 7.4 (4.1–12) 6.9 (3.7–11)
3 49 (41–57) 39 (33–49) 32 (25–41) 25 (18–36) 21 (14–31) 17 (11–27) 14 (8.3–23) 12 (6.8–21) 11 (6.0–19) 10 (5.3–18) 9.6 (4.8–17)
4 59 (51–65) 49 (41–57) 41 (32–50) 33 (26–43) 27 (21–38) 23 (16–33) 19 (13–29) 17 (10–26) 15 (9.0–24) 14 (8.0–23) 13 (7.3–21)
5 68 (63–73) 59 (53–65) 50 (44–58) 42 (36–50) 35 (30–44) 30 (25–38) 25 (20–34) 22 (17–30) 20 (15–28) 19 (13–26) 17 (12–25)
6 75 67 59 51 44 37 32 28 26 24 23
310

Age = 70 years
Number of CRFs BMD T-score (femoral neck)
-4.0 -3.5 -3.0 -2.5 -2.0 -1.5 -1.0 -0.5 0 0.5 1.0
0 20 16 12 9.7 7.8 6.4 5.3 4.6 4.1 3.7 3.4
1 28 (23–34) 22 (18–26) 17 (14–21) 14 (11–16) 11 (8.2–13) 8.8 (6.5–11) 7.2 (5.2–8.6) 6.2 (4.4–7.4) 5.6 (3.9–6.6) 5.0 (3.5–6.1) 4.6 (3.1–5.6)
2 37 (30–46) 30 (23–38) 24 (18–31) 19 (14–25) 15 (11–20) 12 (8.3–16) 9.9 (6.6–14) 8.5 (5.5–12) 7.5 (4.8–11) 6.8 (4.2–9.5) 6.2 (3.8–8.7)
3 48 (39–57) 39 (31–49) 32 (24–41) 26 (18–34) 20 (14–28) 17 (11–24) 13 (8.7–20) 11 (7.2–17) 10 (6.3–15) 9.1 (5.5–14) 8.2 (4.9–13)
4 58 (49–66) 50 (41–58) 41 (33–50) 34 (26–42) 27 (20–36) 22 (16–30) 18 (13–25) 15 (11–22) 13 (9.2–20) 12 (8.1–18) 11 (7.2–16)
5 68 (61–73) 60 (52–66) 52 (44–59) 43 (36–51) 36 (30–43) 29 (24–36) 24 (19–30) 20 (16–26) 18 (14–23) 16 (13–21) 14 (12–19)
6 75 69 61 53 45 38 31 26 23 20 18
Age = 75 years
Number of CRFs BMD T-score (femoral neck)
-4.0 -3.5 -3.0 -2.5 -2.0 -1.5 -1.0 -0.5 0 0.5 1.0
0 18 14 11 9.1 7.4 6.0 4.9 4.3 3.8 3.4 3.1
1 26 (20–41) 21 (16–34) 17 (12–27) 13 (9.7–21) 11 (7.6–16) 8.6 (6.1–12) 7.0 (4.9–9.7) 6.0 (4.1–7.9) 5.2 (3.6–6.5) 4.6 (3.2–5.4) 4.1 (2.8–4.8)
2 36 (26–51) 30 (21–43) 24 (16–36) 19 (13–29) 16 (10–23) 12 (8.0–18) 9.9 (6.3–14) 8.3 (5.3–12) 7.1 (4.6–9.7) 6.2 (3.9–8.2) 5.4 (3.5–7.1)
3 48 (34–61) 40 (27–53) 34 (22–45) 27 (17–38) 22 (13–31) 18 (11–25) 14 (8.4–20) 12 (7.1–17) 9.9 (6.0–14) 8.4 (5.2–12) 7.3 (4.5–10)
4 59 (42–69) 52 (35–62) 44 (29–54) 37 (23–47) 31 (19–39) 25 (15–32) 20 (12–26) 16 (10–22) 14 (8.5–18) 11 (7.4–16) 9.8 (6.5–13)
5 69 (52–75) 62 (44–69) 55 (37–62) 48 (31–55) 41 (26–47) 34 (21–40) 27 (17–33) 23 (15–28) 19 (13–23) 16 (11–20) 13 (9.8–17)
6 77 72 66 59 52 44 37 31 26 21 18
311

Age = 80 years
Number of CRFs BMD T-score (femoral neck)-4.0 -3.5 -3.0 -2.5 -2.0 -1.5 -1.0 -0.5 0 0.5 1.0
0 16 13 11 8.7 7.2 5.9 4.9 4.3 3.8 3.4 3.0
1 23 (17–37) 19 (14–31) 16 (11–25) 13 (9.0–21) 10 (7.3–17) 8.5 (5.9–13) 7.0 (4.8–11) 6.1 (4.1–8.8) 5.3 (3.6–7.3) 4.6 (3.1–6.2) 4.0 (2.7–5.2)
2 32 (22–47) 27 (18–40) 22 (15–33) 18 (12–28) 15 (9.7–23) 12 (7.9–18) 10 (6.4–15) 8.5 (5.4–12) 7.3 (4.6–10) 6.3 (4.0–8.8) 5.5 (3.5–7.4)
3 42 (29–55) 36 (24–49) 31 (20–42) 26 (16–36) 21 (13–30) 17 (11–24) 14 (8.6–20) 12 (7.3–17) 10 (6.2–14) 8.7 (5.3–12) 7.5 (4.6–10)
4 52 (36–63) 46 (30–57) 40 (26–50) 34 (21–44) 29 (17–37) 24 (14–31) 20 (12–26) 17 (9.9–22) 14 (8.5–19) 12 (7.3–16) 10 (6.3–14)
5 63 (44–69) 57 (38–63) 51 (32–57) 44 (27–51) 38 (23–45) 32 (19–38) 27 (16–32) 23 (14–28) 19 (12–24) 16 (10–21) 14 (9.0–18)
6 71 67 61 55 48 42 36 31 26 22 19
Age = 85 years
Number of CRFs BMD T-score (femoral neck)-4.0 -3.5 -3.0 -2.5 -2.0 -1.5 -1.0 -0.5 0 0.5 1.0
0 14 12 10 8.4 7.0 5.8 5.0 4.4 3.9 3.4 3.1
1 21 (15–34) 17 (13–29) 15 (10–24) 12 (8.6–20) 10 (7.1–17) 8.5 (5.8–14) 7.3 (4.9–12) 6.3 (4.3–9.9) 5.5 (3.7–8.5) 4.8 (3.2–7.2) 4.3 (2.8–6.2)
2 29 (20–43) 25 (17–37) 21 (14–32) 18 (11–27) 15 (9.5–23) 12 (7.8–19) 10 (6.6–16) 9.1 (5.7–14) 7.9 (4.9–12) 6.8 (4.3–9.9) 5.9 (3.7–8.5)
3 38 (25–51) 33 (22–45) 29 (18–40) 25 (15–34) 21 (13–29) 17 (11–25) 15 (8.9–21) 13 (7.6–18) 11 (6.6–16) 9.6 (5.7–13) 8.3 (4.9–12)
4 48 (32–59) 43 (28–53) 38 (24–48) 33 (20–42) 28 (17–37) 24 (14–32) 21 (12–27) 18 (10–24) 16 (8.9–21) 13 (7.7–18) 12 (6.7–15)
5 58 (40–65) 54 (35–60) 48 (30–55) 43 (26–50) 38 (22–44) 33 (19–39) 28 (16–34) 25 (14–30) 21 (12–26) 19 (11–23) 16 (9.3–20)
6 67 63 59 54 48 43 37 33 29 25 22
312

Age = 90 years
Number of CRFs BMD T-score (femoral neck)
-4.0 -3.5 -3.0 -2.5 -2.0 -1.5 -1.0 -0.5 0 0.5 1.0
0 13 11 9.1 7.7 6.5 5.5 4.8 4.2 3.7 3.3 2.9
1 19 (14–31) 16 (12–27) 14 (9.8–23) 12 (8.2–20) 9.8 (6.9–17) 8.3 (5.8–14) 7.2 (5.0–12) 6.3 (4.4–11) 5.5 (3.8–9.1) 4.9 (3.3–7.9) 4.3 (2.9–6.8)
2 26 (18–40) 23 (15–35) 20 (13–31) 17 (11–27) 15 (9.3–23) 12 (7.8–19) 11 (6.8–17) 9.4 (5.9–15) 8.2 (5.2–13) 7.2 (4.5–11) 6.3 (3.9–9.8)
3 36 (23–48) 32 (20–44) 28 (17–39) 24 (15–35) 21 (13–30) 18 (11–26) 16 (9.2–23) 14 (8.1–20) 12 (7.0–18) 11 (6.1–16) 9.2 (5.4–14)
4 45 (30–56) 41 (26–52) 37 (23–47) 33 (20–42) 29 (17–38) 25 (14–33) 22 (12–30) 20 (11–26) 17 (9.6–23) 15 (8.4–21) 13 (7.4–18)
5 55 (37–61) 51 (33–58) 47 (29–54) 43 (26–49) 39 (22–45) 34 (19–40) 31 (17–36) 28 (15–33) 25 (13–29) 22 (12–26) 19 (10–23)
6 63 60 57 53 49 45 41 37 33 30 27
TableA3.2
Ten-year probability of hip fracture (%), by BMD, the number of clinical risk factors (CRFs) and age in men from the United Kingdom
Age = 50 years
Number of CRFs BMD T-score (femoral neck)
-4.0 -3.5 -3.0 -2.5 -2.0 -1.5 -1.0 -0.5 0 0.5 1.0
0 16 8.6 4.6 2.4 1.3 0.7 0.4 0.2 0.1 0.1 0.0
1 24 (17–31) 13 (9.0–18) 7.3 (4.8–9.6) 3.9 (2.6–5.1) 2.1 (1.4–2.7) 1.1 (0.7–1.4) 0.6 (0.4–0.8) 0.3 (0.2–0.4) 0.2 (0.1–0.2) 0.1 (0.1–0.1) 0.0 (0.0–0.1)
2 35 (23–48) 21 (13–30) 11 (6.8–17) 6.2 (3.6–9.3) 3.3 (1.9–5.0) 1.7 (1.0–2.6) 0.9 (0.5–1.4) 0.5 (0.3–0.7) 0.3 (0.2–0.4) 0.1 (0.1–0.2) 0.1 (0.0–0.1)
3 48 (32–66) 30 (19–44) 17 (10–27) 9.6 (5.5–15) 5.1 (2.9–8.3) 2.7 (1.5–4.4) 1.4 (0.8–2.4) 0.8 (0.4–1.2) 0.4 (0.2–0.7) 0.2 (0.1–0.4) 0.1 (0.1–0.2)
4 63 (48–78) 42 (29–58) 26 (17–38) 15 (9.2–22) 7.9 (4.9–12) 4.2 (2.6–6.7) 2.2 (1.4–3.6) 1.2 (0.7–1.9) 0.6 (0.4–1.0) 0.3 (0.2–0.6) 0.2 (0.1–0.3)
5 77 (68–86) 57 (46–70) 37 (28–48) 22 (16–30) 12 (8.8–17) 6.5 (4.7–9.4) 3.5 (2.5–5.0) 1.8 (1.3–2.7) 1.0 (0.7–1.4) 0.5 (0.4–0.8) 0.3 (0.2–0.4)
6 87 71 50 31 18 9.8 5.3 2.8 1.5 0.8 0.4
313

Age = 55 years
Number of CRFs BMD T-score (femoral neck)
-4.0 -3.5 -3.0 -2.5 -2.0 -1.5 -1.0 -0.5 0 0.5 1.0
0 16 9.3 5.2 2.9 1.6 0.9 0.5 0.3 0.1 0.1 0.0
1 24 (17–30) 14 (9.8–18) 8.1 (5.5–10) 4.5 (3.0–5.6) 2.5 (1.7–3.1) 1.4 (0.9–1.7) 0.7 (0.5–0.9) 0.4 (0.3–0.5) 0.2 (0.2–0.3) 0.1 (0.1–0.2) 0.1 (0.1–0.1)
2 35 (23–46) 21 (14–29) 12 (7.7–17) 6.9 (4.3–10) 3.8 (2.3–5.6) 2.1 (1.3–3.1) 1.2 (0.7–1.7) 0.6 (0.4–0.9) 0.4 (0.2–0.5) 0.2 (0.1–0.3) 0.1 (0.1–0.2)
3 47 (33–62) 31 (20–43) 18 (11–27) 11 (6.4–16) 5.9 (3.6–9.1) 3.3 (2.0–5.1) 1.8 (1.1–2.8) 1.0 (0.6–1.5) 0.6 (0.3–0.9) 0.3 (0.2–0.5) 0.2 (0.1–0.3)
4 61 (48–75) 42 (31–56) 27 (18–38) 16 (11–23) 9.0 (5.9–13) 5.0 (3.3–7.6) 2.8 (1.8–4.3) 1.5 (1.0–2.3) 0.9 (0.6–1.3) 0.5 (0.3–0.8) 0.3 (0.2–0.4)
5 74 (67–83) 55 (47–68) 37 (30–48) 23 (18–31) 13 (10–19) 7.5 (5.9–11) 4.2 (3.2–6.0) 2.3 (1.8–3.3) 1.3 (1.0–1.9) 0.7 (0.6–1.1) 0.4 (0.3–0.6)
6 84 69 50 32 19 11 6.3 3.5 2.0 1.1 0.6
Age = 60 years
Number of CRFs BMD T-score (femoral neck)
-4.0 -3.5 -3.0 -2.5 -2.0 -1.5 -1.0 -0.5 0 0.5 1.0
0 15 9.2 5.5 3.2 1.9 1.1 0.6 0.4 0.2 0.1 0.1
1 22 (16–26) 14 (9.6–16) 8.2 (5.7–9.7) 4.9 (3.4–5.7) 2.9 (2.0–3.4) 1.7 (1.1–2.0) 1.0 (0.7–1.1) 0.6 (0.4–0.7) 0.3 (0.2–0.4) 0.2 (0.1–0.2) 0.1 (0.1–0.1)
2 31 (22–40) 20 (13–26) 12 (8.0–16) 7.4 (4.7–10) 4.3 (2.8–6.0) 2.5 (1.6–3.5) 1.5 (0.9–2.0) 0.9 (0.5–1.2) 0.5 (0.3–0.7) 0.3 (0.2–0.4) 0.2 (0.1–0.3)
3 42 (31–53) 28 (20–38) 18 (12–25) 11 (7.1–16) 6.5 (4.2–9.4) 3.8 (2.5–5.6) 2.3 (1.4–3.3) 1.3 (0.8–1.9) 0.8 (0.5–1.2) 0.5 (0.3–0.7) 0.3 (0.2–0.4)
4 54 (44–66) 38 (30–50) 25 (19–35) 16 (11–22) 9.6 (6.8–14) 5.7 (4.0–8.4) 3.4 (2.4–5.0) 2.0 (1.4–3.0) 1.2 (0.8–1.8) 0.7 (0.5–1.1) 0.4 (0.3–0.7)
5 66 (60–75) 50 (44–61) 35 (30–45) 23 (19–30) 14 (12–19) 8.5 (7.0–12) 5.0 (4.1–7.0) 3.0 (2.4–4.2) 1.8 (1.5–2.5) 1.1 (0.9–1.5) 0.6 (0.5–0.9)
6 76 62 46 31 20 12 7.4 4.4 2.7 1.6 1.0
314

Age = 65 years
Number of CRFs BMD T-score (femoral neck)
-4.0 -3.5 -3.0 -2.5 -2.0 -1.5 -1.0 -0.5 0 0.5 1.0
0 14 8.8 5.6 3.5 2.1 1.3 0.8 0.5 0.3 0.2 0.1
1 20 (14–22) 13 (9.3–15) 8.2 (5.8–9.4) 5.1 (3.6–5.9) 3.2 (2.3–3.7) 2.0 (1.4–2.3) 1.2 (0.9–1.4) 0.8 (0.5–0.9) 0.5 (0.3–0.6) 0.3 (0.2–0.4) 0.2 (0.1–0.2)
2 27 (20–34) 18 (13–23) 12 (8.2–15) 7.5 (5.1–9.7) 4.7 (3.2–6.1) 3.0 (2.0–3.8) 1.8 (1.2–2.4) 1.1 (0.8–1.5) 0.7 (0.5–1.0) 0.5 (0.3–0.6) 0.3 (0.2–0.4)
3 36 (28–45) 25 (19–32) 17 (12–22) 11 (7.7–14) 6.9 (4.8–9.3) 4.3 (3.0–5.9) 2.7 (1.9–3.7) 1.7 (1.2–2.3) 1.1 (0.7–1.5) 0.7 (0.5–1.0) 0.4 (0.3–0.6)
4 46 (39–56) 34 (27–43) 23 (18–31) 15 (12–21) 10 (7.6–14) 6.3 (4.7–8.8) 4.0 (3.0–5.6) 2.5 (1.9–3.6) 1.6 (1.2–2.3) 1.0 (0.8–1.5) 0.7 (0.5–0.9)
5 57 (53–65) 44 (40–53) 31 (28–40) 21 (19–28) 14 (12–19) 9.1 (7.8–12) 5.7 (4.9–7.9) 3.6 (3.1–5.0) 2.3 (2.0–3.2) 1.5 (1.3–2.1) 1.0 (0.8–1.3)
6 66 54 41 29 20 13 8.2 5.3 3.4 2.2 1.4
Age = 70 years
Number of CRFs BMD T-score (femoral neck)
-4.0 -3.5 -3.0 -2.5 -2.0 -1.5 -1.0 -0.5 0 0.5 1.0
0 12 8.4 5.6 3.7 2.5 1.6 1.1 0.7 0.5 0.3 0.2
1 19 (17–24) 13 (12–17) 9.0 (7.9–12) 6.0 (5.3–7.8) 4.0 (3.5–5.2) 2.6 (2.3–3.4) 1.7 (1.5–2.3) 1.2 (1.0–1.5) 0.8 (0.7–1.0) 0.5 (0.5–0.7) 0.4 (0.3–0.5)
2 28 (24–35) 20 (17–25) 14 (11–18) 9.5 (7.8–12) 6.4 (5.2–8.5) 4.3 (3.5–5.7) 2.8 (2.3–3.8) 1.9 (1.5–2.5) 1.3 (1.0–1.7) 0.9 (0.7–1.2) 0.6 (0.5–0.8)
3 39 (33–46) 29 (24–35) 21 (17–26) 15 (12–18) 10 (7.8–13) 6.8 (5.2–8.6) 4.5 (3.5–5.8) 3.1 (2.4–3.9) 2.1 (1.6–2.7) 1.4 (1.1–1.8) 1.0 (0.7–1.2)
4 51 (43–57) 40 (33–46) 30 (24–35) 22 (17–26) 15 (12–18) 11 (8.0–13) 7.1 (5.3–8.6) 4.9 (3.6–5.9) 3.3 (2.5–4.0) 2.3 (1.7–2.8) 1.6 (1.1–1.9)
5 62 (54–66) 52 (44–56) 41 (34–45) 31 (25–34) 23 (18–25) 16 (12–18) 11 (8.5–12) 7.7 (5.8–8.6) 5.3 (4.0–6.0) 3.7 (2.8–4.1) 2.5 (1.9–2.8)
6 71 63 53 43 33 24 17 12 8.3 5.8 4.0
315

Age = 75 years
Number of CRFs BMD T-score (femoral neck)
-4.0 -3.5 -3.0 -2.5 -2.0 -1.5 -1.0 -0.5 0 0.5 1.0
0 11 8.1 5.8 4.1 2.9 2.0 1.4 1.0 0.7 0.5 0.4
1 19 (15–37) 14 (11–29) 11 (8.0–22) 7.6 (5.7–16) 5.4 (4.0–12) 3.8 (2.8–8.3) 2.7 (2.0–5.9) 1.9 (1.4–4.3) 1.4 (1.0–3.1) 1.0 (0.7–2.2) 0.7 (0.5–1.6)
2 30 (20–48) 23 (15–39) 18 (11–30) 13 (8.0–23) 9.5 (5.7–17) 6.8 (4.0–13) 4.9 (2.8–9.1) 3.5 (2.0–6.7) 2.6 (1.4–4.9) 1.8 (1.0–3.6) 1.3 (0.7–2.6)
3 42 (27–58) 34 (20–49) 27 (15–40) 21 (11–32) 16 (8.0–25) 11 (5.7–18) 8.3 (4.0–13) 6.1 (2.9–10) 4.5 (2.1–7.3) 3.2 (1.5–5.4) 2.4 (1.1–3.9)
4 55 (35–66) 47 (28–58) 39 (21–49) 31 (16–40) 24 (12–32) 18 (8.5–25) 14 (6.0–18) 10 (4.4–14) 7.5 (3.2–10) 5.5 (2.3–7.5) 4.0 (1.7–5.5)
5 66 (45–72) 59 (37–66) 51 (29–58) 43 (23–49) 35 (17–40) 27 (12–32) 21 (9.0–24) 16 (6.7–19) 12 (4.9–14) 9.0 (3.6–10) 6.6 (2.6–7.7)
6 76 71 64 56 47 39 31 24 19 14 11
Age = 80 years
Number of CRFs BMD T-score (femoral neck)
-4.0 -3.5 -3.0 -2.5 -2.0 -1.5 -1.0 -0.5 0 0.5 1.0
0 10 7.7 5.8 4.3 3.2 2.4 1.8 1.3 1.0 0.8 0.6
1 17 (13–33) 13 (9.9–27) 10 (7.5–21) 7.8 (5.6–17) 5.9 (4.2–13) 4.4 (3.1–9.7) 3.3 (2.3–7.4) 2.5 (1.8–5.7) 1.9 (1.3–4.3) 1.5 (1.0–3.3) 1.1 (0.8–2.5)
2 26 (17–43) 21 (13–36) 17 (9.8–30) 13 (7.5–24) 10 (5.6–18) 7.6 (4.2–14) 5.8 (3.2–11) 4.5 (2.4–8.4) 3.4 (1.9–6.5) 2.6 (1.4–5.0) 2.0 (1.1–3.9)
3 37 (22–52) 31 (17–45) 25 (13–38) 20 (10–31) 16 (7.8–25) 12 (5.9–20) 9.5 (4.4–16) 7.4 (3.4–12) 5.8 (2.6–9.7) 4.5 (2.0–7.5) 3.4 (1.5–5.8)
4 49 (29–61) 42 (23–54) 35 (18–47) 29 (14–39) 24 (11–33) 19 (8.5–26) 15 (6.4–21) 12 (5.0–17) 9.3 (3.9–13) 7.3 (3.0–10) 5.6 (2.3–8.1)
5 60 (38–66) 54 (32–60) 47 (26–53) 40 (20–46) 34 (16–39) 28 (12–32) 22 (9.5–26) 18 (7.5–21) 14 (5.8–17) 11 (4.5–14) 8.9 (3.5–11)
6 70 65 59 52 45 38 32 26 21 17 14
316

Age = 85 years
Number of CRFs BMD T-score (femoral neck)
-4.0 -3.5 -3.0 -2.5 -2.0 -1.5 -1.0 -0.5 0 0.5 1.0
0 8.9 7.1 5.6 4.4 3.5 2.7 2.2 1.7 1.4 1.1 0.9
1 15 (11–30) 12 (9.0–25) 9.9 (7.2–21) 7.9 (5.7–17) 6.3 (4.5–14) 5.0 (3.5–11) 4.0 (2.8–8.8) 3.2 (2.3–7.2) 2.6 (1.8–5.8) 2.1 (1.5–4.7) 1.7 (1.2–3.8)
2 23 (14–39) 19 (12–34) 16 (9.3–28) 13 (7.4–24) 10 (5.8–19) 8.4 (4.6–16) 6.8 (3.7–13) 5.5 (3.0–11) 4.5 (2.4–8.7) 3.7 (1.9–7.1) 3.0 (1.6–5.7)
3 33 (19–48) 28 (16–42) 24 (13–36) 20 (10–31) 16 (8.1–26) 13 (6.4–21) 11 (5.2–18) 9.0 (4.2–15) 7.4 (3.4–12) 6.0 (2.7–10) 4.9 (2.2–8.2)
4 45 (26–56) 39 (21–51) 34 (17–45) 29 (14–39) 24 (11–33) 20 (9.0–28) 17 (7.3–23) 14 (6.0–20) 12 (4.8–17) 9.6 (3.9–14) 7.9 (3.2–11)
5 56 (34–62) 51 (29–57) 45 (24–51) 39 (20–45) 34 (16–39) 29 (13–34) 24 (11–29) 21 (8.8–25) 17 (7.2–21) 15 (5.9–17) 12 (4.8–14)
6 66 62 57 51 45 40 34 30 25 21 18
Age = 90 years
Number of CRFs BMD T-score (femoral neck)
-4.0 -3.5 -3.0 -2.5 -2.0 -1.5 -1.0 -0.5 0 0.5 1.0
0 7.9 6.5 5.3 4.3 3.5 2.9 2.4 2.0 1.7 1.4 1.2
1 14 (10–28) 11 (8.4–24) 9.5 (6.9–20) 7.9 (5.7–17) 6.5 (4.6–14) 5.3 (3.8–12) 4.5 (3.2–9.9) 3.8 (2.6–8.3) 3.2 (2.2–7.0) 2.7 (1.9–5.9) 2.2 (1.5–5.0)
2 21 (13–37) 18 (11–32) 16 (9.1–28) 13 (7.5–24) 11 (6.2–20) 9.1 (5.1–17) 7.7 (4.3–14) 6.5 (3.6–12) 5.5 (3.0–10) 4.7 (2.5–8.8) 3.9 (2.1–7.5)
3 31 (18–46) 27 (15–41) 24 (12–36) 20 (10–32) 17 (8.6–27) 15 (7.1–23) 12 (6.0–20) 11 (5.0–18) 9.1 (4.2–15) 7.8 (3.6–13) 6.6 (3.0–11)
4 42 (24–54) 38 (20–49) 34 (17–44) 29 (15–40) 26 (12–35) 22 (10–30) 19 (8.6–27) 17 (7.3–23) 14 (6.2–20) 12 (5.3–17) 11 (4.4–15)
5 53 (32–59) 49 (28–55) 45 (24–51) 40 (21–46) 36 (18–41) 32 (15–36) 28 (13–32) 25 (11–29) 22 (9.2–25) 19 (7.8–22) 16 (6.6–19)
6 62 59 56 52 47 43 38 35 31 27 24
317

TableA3.3
Ten-year probability of osteoporotic fractures (%), by BMD T-score at the femoral neck, the number of clinical risk factors (CRFs) and age in women from the UnitedKingdom
Age = 50 years
Number of CRFs BMD T-score (femoral neck)
-4.0 -3.5 -3.0 -2.5 -2.0 -1.5 -1.0 -0.5 0 0.5 1.0
0 17 12 8.3 6.3 5.1 4.2 3.6 3.3 3.2 3.1 2.9
1 26 (23–32) 18 (15–22) 13 (10–16) 9.5 (7.2–12) 7.6 (5.4–9.7) 6.4 (4.4–8.4) 5.5 (3.6–7.4) 5.0 (3.3–6.9) 4.8 (3.1–6.6) 4.6 (2.9–6.4) 4.4 (2.8–6.2)
2 37 (30–50) 26 (20–35) 19 (14–25) 14 (9.3–21) 11 (6.8–18) 9.4 (5.4–15) 8.1 (4.4–14) 7.4 (3.9–13) 7.0 (3.7–12) 6.7 (3.5–12) 6.5 (3.3–11)
3 51 (39–64) 37 (27–48) 27 (18–39) 20 (12–32) 16 (9.0–27) 14 (7.0–24) 12 (5.7–21) 11 (5.1–20) 10 (4.7–19) 9.7 (4.5–18) 9.3 (4.3–18)
4 66 (50–77) 50 (35–58) 37 (26–48) 28 (19–40) 23 (15–34) 19 (12–30) 16 (9.3–27) 15 (8.2–25) 14 (7.6–24) 14 (7.2–23) 13 (6.9–22)
5 80 (71–87) 64 (53–69) 50 (40–56) 39 (31–47) 31 (25–40) 26 (20–35) 23 (17–31) 21 (15–29) 20 (14–27) 19 (13–27) 18 (13–26)
6 90 78 63 51 42 35 31 28 27 26 25
Age = 55 years
Number of CRFs BMD T-score (femoral neck)
-4.0 -3.5 -3.0 -2.5 -2.0 -1.5 -1.0 -0.5 0 0.5 1.0
0 20 14 10 7.9 6.3 5.3 4.5 4.2 3.9 3.7 3.5
1 29 (26–34) 20 (18–24) 15 (12–18) 12 (8.9–14) 9.4 (6.8–12) 7.8 (5.4–10) 6.7 (4.5–9.1) 6.2 (4.1–8.5) 5.8 (3.8–8.1) 5.5 (3.6–7.7) 5.2 (3.4–7.3)
2 40 (34–52) 29 (23–39) 22 (16–29) 17 (11–25) 14 (8.6–21) 11 (6.7–18) 9.7 (5.5–16) 9.0 (4.9–15) 8.5 (4.5–14) 8.0 (4.2–14) 7.6 (4.0–13)
3 54 (43–65) 41 (31–53) 31 (21–44) 24 (15–37) 20 (11–32) 16 (8.8–28) 14 (7.1–25) 13 (6.3–23) 12 (5.8–22) 11 (5.4–21) 11 (5.1–20)
4 68 (54–77) 54 (40–63) 42 (30–54) 33 (24–46) 27 (18–40) 23 (14–35) 19 (12–31) 18 (10–29) 17 (9.4–28) 16 (8.7–26) 15 (8.2–25)
5 81 (74–86) 68 (59–73) 55 (46–62) 44 (37–53) 36 (30–46) 31 (25–40) 26 (20–35) 24 (18–33) 23 (16–32) 22 (15–30) 21 (14–29)
6 90 80 68 57 48 41 35 33 31 29 28
318

Age = 60 years
Number of CRFs BMD T-score (femoral neck)
-4.0 -3.5 -3.0 -2.5 -2.0 -1.5 -1.0 -0.5 0 0.5 1.0
0 23 16 12 9.5 7.7 6.3 5.5 5.0 4.6 4.3 4.1
1 32 (29–37) 24 (20–27) 18 (15–21) 14 (11–17) 11 (8.2–14) 9.3 (6.5–12) 8.0 (5.5–11) 7.4 (4.9–10) 6.8 (4.5–9.5) 6.4 (4.2–8.9) 6.0 (3.9–8.4)
2 44 (38–54) 33 (27–42) 25 (19–34) 20 (14–28) 16 (10–24) 13 (8.1–21) 12 (6.7–18) 11 (5.9–17) 9.8 (5.4–16) 9.2 (4.9–15) 8.6 (4.6–14)
3 58 (48–68) 45 (35–58) 35 (25–49) 28 (18–42) 23 (14–36) 19 (11–31) 16 (8.7–28) 15 (7.7–26) 14 (6.9–25) 13 (6.4–23) 12 (5.9–22)
4 71 (59–78) 58 (45–68) 46 (35–59) 38 (28–51) 31 (22–44) 26 (17–39) 22 (14–35) 21 (12–33) 19 (11–31) 18 (10–29) 17 (9.4–28)
5 82 (77–85) 71 (64–76) 59 (52–67) 49 (42–58) 41 (34–51) 34 (28–44) 30 (23–40) 28 (21–38) 26 (19–35) 24 (17–33) 23 (16–32)
6 90 82 72 61 52 45 40 37 34 32 30
Age = 65 years
Number of CRFs BMD T-score (femoral neck)
-4.0 -3.5 -3.0 -2.5 -2.0 -1.5 -1.0 -0.5 0 0.5 1.0
0 27 20 15 12 9.7 8.0 7.1 6.4 5.9 5.4 5.0
1 37 (33–41) 28 (24–31) 22 (18–26) 17 (13–22) 14 (10–18) 12 (8.2–15) 10 (7.1–14) 9.3 (6.3–13) 8.5 (5.7–12) 7.9 (5.2–11) 7.3 (4.8–10)
2 49 (42–58) 38 (31–47) 30 (23–40) 24 (17–34) 20 (13–29) 16 (10–25) 15 (8.6–23) 13 (7.6–21) 12 (6.8–19) 11 (6.1–18) 10 (5.6–17)
3 62 (53–72) 50 (40–64) 41 (30–55) 33 (22–48) 27 (17–42) 23 (13–37) 20 (11–34) 18 (9.8–31) 17 (8.7–29) 16 (7.9–27) 15 (7.2–26)
4 73 (63–81) 62 (52–73) 52 (42–65) 43 (34–57) 36 (26–51) 30 (21–44) 27 (18–41) 25 (15–39) 23 (14–36) 21 (12–34) 20 (11–32)
5 83 (79–87) 74 (69–80) 64 (58–72) 55 (49–65) 47 (40–57) 40 (32–51) 36 (28–47) 33 (25–44) 31 (22–41) 28 (20–39) 27 (19–36)
6 89 83 75 66 58 50 46 42 40 37 35
319

Age = 70 years
Number of CRFs BMD T-score (femoral neck)
-4.0 -3.5 -3.0 -2.5 -2.0 -1.5 -1.0 -0.5 0 0.5 1.0
0 30 23 18 14 11 9.3 8.2 7.3 6.6 5.9 5.4
1 41 (36–47) 32 (27–37) 25 (20–29) 19 (15–23) 15 (12–18) 13 (9.5–15) 11 (8.2–13) 10 (7.2–12) 8.9 (6.3–11) 8.1 (5.7–9.6) 7.3 (5.1–8.8)
2 54 (45–64) 43 (34–53) 34 (26–42) 27 (20–34) 21 (15–27) 18 (12–23) 15 (10–20) 13 (8.6–18) 12 (7.6–16) 11 (6.8–15) 9.9 (6.1–14)
3 67 (56–77) 55 (43–68) 45 (33–58) 36 (25–48) 29 (19–40) 24 (15–34) 20 (13–30) 18 (11–27) 16 (9.8–25) 14 (8.7–23) 13 (7.8–21)
4 78 (70–84) 68 (58–77) 57 (47–67) 47 (37–58) 38 (29–49) 31 (24–42) 27 (20–38) 24 (17–34) 21 (15–31) 19 (14–28) 17 (12–26)
5 86 (81–89) 79 (73–83) 70 (63–76) 59 (52–67) 49 (43–57) 41 (35–49) 35 (30–44) 31 (27–39) 28 (24–36) 25 (21–33) 22 (19–30)
6 89 86 80 71 61 52 45 40 35 32 29
Age = 75 years
Number of CRFs BMD T-score (femoral neck)
-4.0 -3.5 -3.0 -2.5 -2.0 -1.5 -1.0 -0.5 0 0.5 1.0
0 31 24 19 15 12 10 8.6 7.5 6.6 5.9 5.3
1 44 (37–62) 35 (28–49) 27 (22–38) 21 (16–29) 17 (13–22) 14 (10–17) 12 (8.7–14) 10 (7.4–12) 8.8 (6.5–10) 7.8 (5.7–9.3) 6.9 (5.0–8.3)
2 58 (46–75) 48 (36–65) 38 (28–53) 30 (21–42) 23 (16–33) 19 (13–26) 16 (11–21) 14 (9.2–18) 12 (7.9–16) 10 (6.8–14) 9.0 (6.0–13)
3 71 (56–82) 61 (45–75) 51 (35–65) 41 (27–55) 33 (21–44) 27 (17–36) 22 (14–30) 18 (12–25) 16 (10–22) 13 (8.8–19) 12 (7.7–16)
4 80 (68–86) 73 (57–82) 65 (47–75) 54 (38–65) 44 (30–54) 36 (25–45) 30 (21–38) 25 (18–32) 21 (15–27) 18 (13–24) 15 (11–21)
5 86 (77–89) 82 (70–86) 76 (61–81) 67 (51–74) 57 (42–64) 48 (36–55) 40 (31–46) 33 (26–39) 28 (23–33) 23 (20–29) 20 (17–25)
6 89 87 84 78 70 61 52 44 37 31 26
320

Age = 80 years
Number of CRFs BMD T-score (femoral neck)
-4.0 -3.5 -3.0 -2.5 -2.0 -1.5 -1.0 -0.5 0 0.5 1.0
0 33 26 21 16 13 11 9.6 8.3 7.2 6.3 5.5
1 45 (37–62) 37 (29–52) 29 (23–42) 23 (18–33) 19 (14–26) 16 (12–21) 13 (9.7–17) 11 (8.2–13) 9.6 (7.0–11) 8.3 (6.0–9.5) 7.2 (5.2–8.4)
2 57 (45–72) 48 (37–64) 40 (29–55) 32 (23–45) 26 (18–37) 22 (15–30) 18 (12–25) 15 (10–20) 13 (8.7–17) 11 (7.4–14) 9.5 (6.4–13)
3 67 (55–79) 60 (46–73) 51 (37–65) 43 (30–55) 35 (24–46) 30 (19–39) 25 (16–33) 21 (13–28) 17 (11–24) 15 (9.6–20) 12 (8.3–17)
4 76 (64–83) 70 (55–79) 63 (47–72) 55 (38–64) 46 (31–56) 39 (26–48) 33 (22–41) 28 (19–35) 23 (16–30) 19 (14–25) 16 (12–22)
5 82 (72–86) 78 (65–83) 73 (58–78) 66 (50–72) 58 (42–65) 51 (36–57) 43 (31–50) 37 (27–43) 31 (23–37) 26 (20–31) 22 (18–27)
6 86 84 80 75 69 62 55 47 40 34 28
Age = 85 years
Number of CRFs BMD T-score (femoral neck)
-4.0 -3.5 -3.0 -2.5 -2.0 -1.5 -1.0 -0.5 0 0.5 1.0
0 34 28 22 18 15 13 11 9.3 8.0 6.9 6.0
1 44 (36–60) 37 (29–52) 31 (24–44) 25 (19–36) 21 (16–30) 18 (13–25) 15 (11–20) 13 (9.2–17) 11 (7.8–14) 9.3 (6.6–11) 7.9 (5.7–9.4)
2 55 (44–69) 48 (37–62) 41 (30–54) 34 (24–47) 29 (20–40) 24 (17–34) 21 (14–29) 17 (12–24) 15 (9.9–20) 13 (8.3–17) 11 (7.0–14)
3 64 (52–75) 58 (45–70) 51 (38–63) 44 (31–56) 38 (26–49) 33 (22–43) 28 (18–37) 24 (15–32) 20 (13–27) 17 (11–23) 14 (9.2–20)
4 73 (60–80) 67 (54–76) 61 (46–70) 54 (39–64) 48 (34–58) 43 (29–52) 37 (25–46) 32 (21–40) 27 (18–34) 23 (16–29) 19 (13–25)
5 79 (68–83) 75 (62–80) 70 (55–76) 64 (48–71) 59 (43–66) 53 (38–60) 47 (33–54) 41 (29–48) 35 (25–42) 30 (22–36) 26 (19–31)
6 82 81 78 73 69 63 58 51 45 39 34
321

Age = 90 years
Number of CRFs BMD T-score (femoral neck)
-4.0 -3.5 -3.0 -2.5 -2.0 -1.5 -1.0 -0.5 0 0.5 1.0
0 29 24 19 16 13 11 9.4 8.0 6.8 5.7 4.9
1 39 (31–55) 33 (26–48) 27 (21–40) 22 (17–33) 19 (14–28) 16 (12–24) 14 (9.9–20) 11 (8.3–16) 9.6 (7.0–13) 8.1 (5.8–11) 6.8 (4.9–9.0)
2 50 (39–65) 43 (33–58) 37 (27–51) 31 (22–45) 27 (19–39) 23 (16–33) 19 (13–28) 16 (11–24) 14 (9.1–20) 11 (7.6–17) 9.6 (6.3–14)
3 61 (48–72) 54 (41–67) 48 (34–61) 42 (28–55) 36 (24–49) 31 (20–42) 27 (17–37) 23 (14–31) 19 (12–26) 16 (10–22) 14 (8.4–19)
4 69 (56–77) 64 (50–73) 59 (43–69) 53 (36–63) 47 (32–58) 42 (27–52) 37 (23–45) 31 (20–39) 27 (17–34) 23 (14–29) 19 (12–24)
5 75 (64–80) 73 (59–78) 68 (52–74) 64 (46–70) 59 (41–65) 53 (36–60) 48 (32–54) 42 (27–48) 36 (23–42) 31 (20–36) 26 (17–31)
6 78 78 76 73 69 64 59 54 48 42 36
Table A3.4
Ten-year probability of hip fracture (%), by BMD T-score at the femoral neck, the number of clinical risk factors (CRFs) and age in women from the United Kingdom
Age = 50 years
Number of CRFs BMD T-score (femoral neck)
-4.0 -3.5 -3.0 -2.5 -2.0 -1.5 -1.0 -0.5 0 0.5 1.0
0 12 6.1 3.1 1.6 0.8 0.4 0.2 0.1 0.1 0.0 0.0
1 18 (12–23) 9.7 (6.4–13) 5.1 (3.3–6.6) 2.6 (1.7–3.4) 1.3 (0.9–1.8) 0.7 (0.4–0.9) 0.3 (0.2–0.5) 0.2 (0.1–0.2) 0.1 (0.1–0.1) 0.1 (0.0–0.1) 0.0 (0.0–0.0)
2 27 (17–39) 15 (9.0–22) 8.0 (4.7–12) 4.2 (2.4–6.3) 2.1 (1.2–3.3) 1.1 (0.6–1.7) 0.6 (0.3–0.9) 0.3 (0.2–0.5) 0.2 (0.1–0.2) 0.1 (0.1–0.1) 0.0 (0.0–0.1)
3 39 (25–57) 23 (13–35) 12 (7.0–20) 6.5 (3.6–11) 3.4 (1.9–5.6) 1.7 (1.0–2.9) 0.9 (0.5–1.5) 0.5 (0.3–0.8) 0.2 (0.1–0.4) 0.1 (0.1–0.2) 0.1 (0.0–0.1)
4 54 (38–72) 33 (22–48) 19 (12–29) 10 (6.3–16) 5.3 (3.2–8.4) 2.7 (1.7–4.4) 1.4 (0.9–2.3) 0.7 (0.4–1.2) 0.4 (0.2–0.6) 0.2 (0.1–0.3) 0.1 (0.1–0.2)
5 70 (59–83) 47 (37–61) 28 (21–38) 15 (11–22) 8.2 (6.0–12) 4.3 (3.1–6.2) 2.2 (1.6–3.2) 1.1 (0.8–1.7) 0.6 (0.4–0.9) 0.3 (0.2–0.5) 0.2 (0.1–0.3)
6 84 62 40 23 12 6.5 3.4 1.8 0.9 0.5 0.3
322

Age = 55 years
Number of CRFs BMD T-score (femoral neck)
-4.0 -3.5 -3.0 -2.5 -2.0 -1.5 -1.0 -0.5 0 0.5 1.0
0 12 6.8 3.7 2.0 1.1 0.6 0.3 0.2 0.1 0.1 0.0
1 19 (13–23) 11 (7.1–13) 5.8 (3.9–7.1) 3.2 (2.1–3.9) 1.7 (1.1–2.1) 0.9 (0.6–1.1) 0.5 (0.3–0.6) 0.3 (0.2–0.3) 0.2 (0.1–0.2) 0.1 (0.1–0.1) 0.0 (0.0–0.1)
2 28 (18–38) 16 (9.9–23) 9.0 (5.5–13) 4.9 (3.0–7.2) 2.7 (1.6–3.9) 1.4 (0.9–2.1) 0.8 (0.5–1.1) 0.4 (0.3–0.6) 0.2 (0.1–0.4) 0.1 (0.1–0.2) 0.1 (0.0–0.1)
3 39 (26–56) 24 (15–36) 14 (8.2–21) 7.6 (4.5–12) 4.2 (2.4–6.6) 2.3 (1.3–3.6) 1.2 (0.7–2.0) 0.7 (0.4–1.1) 0.4 (0.2–0.6) 0.2 (0.1–0.3) 0.1 (0.1–0.2)
4 54 (40–70) 34 (24–49) 20 (14–30) 12 (7.6–18) 6.4 (4.2–10) 3.5 (2.3–5.5) 1.9 (1.2–3.0) 1.1 (0.7–1.7) 0.6 (0.4–0.9) 0.3 (0.2–0.5) 0.2 (0.1–0.3)
5 69 (61–81) 48 (40–61) 30 (24–40) 17 (14–24) 9.7 (7.7–14) 5.4 (4.2–7.7) 2.9 (2.3–4.2) 1.6 (1.3–2.4) 0.9 (0.7–1.3) 0.5 (0.4–0.7) 0.3 (0.2–0.4)
6 82 63 42 25 15 8.1 4.4 2.5 1.4 0.8 0.4
Age = 60 years
Number of CRFs BMD T-score (femoral neck)
-4.0 -3.5 -3.0 -2.5 -2.0 -1.5 -1.0 -0.5 0 0.5 1.0
0 13 7.7 4.4 2.4 1.4 0.8 0.4 0.3 0.1 0.1 0.1
1 20 (14–23) 12 (8.1–14) 6.7 (4.6–7.9) 3.8 (2.6–4.5) 2.1 (1.4–2.5) 1.2 (0.8–1.4) 0.7 (0.5–0.8) 0.4 (0.3–0.5) 0.2 (0.2–0.3) 0.1 (0.1–0.2) 0.1 (0.1–0.1)
2 29 (19–38) 18 (11–24) 10 (6.4–14) 5.8 (3.6–8.0) 3.3 (2.0–4.6) 1.9 (1.1–2.6) 1.1 (0.7–1.5) 0.6 (0.4–0.9) 0.4 (0.2–0.5) 0.2 (0.1–0.3) 0.1 (0.1–0.2)
3 41 (28–55) 26 (17–36) 15 (9.6–23) 8.9 (5.5–13) 5.1 (3.1–7.7) 2.8 (1.7–4.4) 1.6 (1.0–2.5) 0.9 (0.6–1.5) 0.5 (0.3–0.8) 0.3 (0.2–0.5) 0.2 (0.1–0.3)
4 54 (42–69) 36 (27–49) 22 (16–32) 13 (9.2–20) 7.6 (5.3–11) 4.3 (3.0–6.6) 2.5 (1.7–3.8) 1.4 (1.0–2.2) 0.8 (0.6–1.3) 0.5 (0.3–0.7) 0.3 (0.2–0.4)
5 68 (63–80) 49 (43–62) 32 (27–42) 19 (16–27) 11 (9.4–16) 6.5 (5.3–9.2) 3.7 (3.1–5.3) 2.2 (1.8–3.1) 1.3 (1.0–1.8) 0.7 (0.6–1.1) 0.4 (0.3–0.6)
6 81 63 44 28 17 9.7 5.6 3.3 1.9 1.1 0.6
323

Age = 65 years
Number of CRFs BMD T-score (femoral neck)
-4.0 -3.5 -3.0 -2.5 -2.0 -1.5 -1.0 -0.5 0 0.5 1.0
0 14 8.6 5.1 3.0 1.7 1.0 0.6 0.4 0.2 0.1 0.1
1 21 (15–25) 13 (9.1–15) 7.7 (5.4–9.2) 4.5 (3.1–5.4) 2.7 (1.8–3.2) 1.5 (1.1–1.9) 0.9 (0.6–1.1) 0.6 (0.4–0.7) 0.3 (0.2–0.4) 0.2 (0.1–0.2) 0.1 (0.1–0.2)
2 30 (21–37) 19 (13–24) 11 (7.5–15) 6.8 (4.4–9.0) 4.0 (2.6–5.3) 2.4 (1.5–3.1) 1.4 (0.9–1.9) 0.9 (0.6–1.1) 0.5 (0.3–0.7) 0.3 (0.2–0.4) 0.2 (0.1–0.3)
3 41 (30–53) 27 (19–37) 17 (11–24) 10 (6.7–15) 6.1 (3.9–8.7) 3.6 (2.3–5.2) 2.2 (1.4–3.2) 1.3 (0.8–1.9) 0.8 (0.5–1.2) 0.5 (0.3–0.7) 0.3 (0.2–0.4)
4 54 (44–67) 37 (29–49) 24 (18–33) 15 (11–21) 9.0 (6.5–13) 5.3 (3.8–7.8) 3.2 (2.3–4.8) 2.0 (1.4–2.9) 1.2 (0.8–1.8) 0.7 (0.5–1.1) 0.4 (0.3–0.6)
5 67 (61–77) 49 (43–61) 33 (29–43) 21 (18–29) 13 (11–18) 7.8 (6.4–11) 4.8 (3.9–6.7) 2.9 (2.4–4.1) 1.8 (1.4–2.5) 1.1 (0.9–1.5) 0.6 (0.5–0.9)
6 79 63 45 30 19 11 7.0 4.3 2.6 1.6 1.0
Age = 70 years
Number of CRFs BMD T-score (femoral neck)
-4.0 -3.5 -3.0 -2.5 -2.0 -1.5 -1.0 -0.5 0 0.5 1.0
0 16 10 6.2 3.8 2.3 1.4 0.9 0.6 0.4 0.2 0.1
1 25 (22–31) 16 (14–20) 10 (8.7–13) 6.3 (5.3–7.9) 3.9 (3.3–4.9) 2.4 (2.0–3.0) 1.5 (1.3–1.9) 0.9 (0.8–1.2) 0.6 (0.5–0.8) 0.4 (0.3–0.5) 0.2 (0.2–0.3)
2 37 (31–47) 25 (20–33) 16 (13–22) 10 (8.0–14) 6.4 (4.9–8.6) 4.0 (3.1–5.4) 2.5 (1.9–3.5) 1.6 (1.2–2.2) 1.0 (0.8–1.4) 0.6 (0.5–0.9) 0.4 (0.3–0.5)
3 53 (43–61) 38 (29–46) 25 (19–32) 16 (12–21) 10 (7.5–14) 6.5 (4.7–8.8) 4.2 (3.0–5.6) 2.6 (1.9–3.6) 1.7 (1.2–2.3) 1.1 (0.7–1.4) 0.7 (0.5–0.9)
4 68 (59–74) 53 (43–60) 38 (29–44) 26 (19–31) 17 (12–20) 11 (7.7–13) 6.9 (4.9–8.6) 4.4 (3.1–5.5) 2.8 (2.0–3.5) 1.8 (1.3–2.2) 1.1 (0.8–1.4)
5 80 (74–82) 68 (60–72) 53 (45–58) 38 (31–42) 26 (21–29) 17 (13–19) 11 (8.7–13) 7.1 (5.6–8.3) 4.6 (3.6–5.3) 2.9 (2.3–3.4) 1.8 (1.4–2.1)
6 87 80 68 53 38 26 18 12 7.4 4.8 3.0
324

Age = 75 years
Number of CRFs BMD T-score (femoral neck)
-4.0 -3.5 -3.0 -2.5 -2.0 -1.5 -1.0 -0.5 0 0.5 1.0
0 18 12 7.6 4.9 3.1 2.1 1.4 0.9 0.6 0.4 0.3
1 30 (24–54) 21 (16–41) 14 (11–29) 9.5 (6.9–20) 6.2 (4.4–13) 4.1 (2.9–8.7) 2.7 (1.9–5.9) 1.8 (1.3–3.9) 1.2 (0.8–2.6) 0.8 (0.6–1.7) 0.5 (0.4–1.1)
2 46 (32–69) 35 (22–57) 25 (15–43) 17 (9.7–31) 11 (6.3–21) 7.7 (4.2–15) 5.2 (2.8–10) 3.4 (1.8–6.8) 2.3 (1.2–4.6) 1.5 (0.8–3.0) 1.0 (0.5–2.0)
3 62 (44–79) 50 (31–69) 39 (22–56) 28 (14–43) 19 (9.4–31) 13 (6.3–22) 9.2 (4.2–16) 6.2 (2.8–11) 4.2 (1.8–7.2) 2.8 (1.2–4.8) 1.8 (0.8–3.2)
4 75 (57–84) 66 (44–77) 55 (32–67) 42 (22–55) 31 (15–42) 22 (10–31) 16 (6.7–22) 11 (4.5–16) 7.3 (3.0–11) 4.9 (2.0–7.3) 3.3 (1.3–4.9)
5 84 (70–88) 78 (58–83) 70 (46–76) 59 (34–65) 46 (24–53) 35 (16–41) 26 (11–30) 18 (7.7–21) 12 (5.2–15) 8.5 (3.5–10) 5.7 (2.3–6.9)
6 88 86 81 74 63 51 39 29 20 14 9.6
Age = 80 years
Number of CRFs BMD T-score (femoral neck)
-4.0 -3.5 -3.0 -2.5 -2.0 -1.5 -1.0 -0.5 0 0.5 1.0
0 19 13 9.2 6.2 4.3 3.0 2.1 1.4 1.0 0.7 0.5
1 31 (24–55) 23 (17–44) 17 (12–33) 12 (8.1–24) 8.1 (5.6–17) 5.8 (3.9–12) 4.0 (2.7–8.7) 2.8 (1.9–6.1) 2.0 (1.3–4.3) 1.4 (0.9–3.0) 0.9 (0.6–2.1)
2 45 (32–67) 36 (23–57) 27 (16–46) 20 (11–36) 14 (7.8–27) 10 (5.5–20) 7.3 (3.9–14) 5.2 (2.7–10) 3.6 (1.9–7.3) 2.5 (1.3–5.1) 1.8 (0.9–3.6)
3 59 (42–76) 50 (32–68) 40 (23–58) 31 (17–47) 23 (12–37) 17 (8.3–28) 13 (5.8–21) 9.0 (4.1–15) 6.4 (2.8–11) 4.5 (2.0–7.8) 3.2 (1.4–5.5)
4 71 (54–81) 63 (43–75) 54 (33–67) 45 (24–57) 35 (17–47) 27 (12–38) 20 (8.9–29) 15 (6.3–22) 11 (4.4–16) 7.7 (3.1–12) 5.5 (2.2–8.3)
5 80 (64–84) 75 (55–80) 68 (45–73) 59 (35–66) 49 (26–56) 40 (19–47) 31 (14–38) 24 (10–29) 18 (7.3–22) 13 (5.2–16) 9.1 (3.7–11)
6 85 83 78 72 64 55 45 36 27 20 15
325

Age = 85 years
Number of CRFs BMD T-score (femoral neck)
-4.0 -3.5 -3.0 -2.5 -2.0 -1.5 -1.0 -0.5 0 0.5 1.0
0 20 15 11 7.8 5.7 4.3 3.1 2.3 1.7 1.2 0.9
1 31 (25–54) 24 (19–45) 19 (14–36) 14 (10–28) 11 (7.5–22) 8.0 (5.6–17) 6.0 (4.1–13) 4.4 (3.0–9.6) 3.3 (2.2–7.1) 2.4 (1.6–5.3) 1.8 (1.2–3.9)
2 44 (32–65) 36 (25–56) 29 (19–47) 23 (14–39) 18 (10–32) 14 (7.8–25) 10 (5.8–20) 7.9 (4.3–15) 5.9 (3.1–11) 4.4 (2.3–8.6) 3.2 (1.7–6.4)
3 56 (40–72) 49 (32–66) 41 (25–58) 34 (19–50) 27 (15–42) 22 (11–34) 17 (8.4–28) 13 (6.3–22) 10 (4.7–17) 7.5 (3.5–13) 5.6 (2.6–9.5)
4 68 (50–78) 61 (42–73) 54 (34–66) 46 (27–59) 39 (21–51) 33 (16–43) 26 (12–36) 21 (9.4–29) 16 (7.0–23) 12 (5.2–18) 9.4 (3.9–14)
5 76 (60–81) 72 (52–77) 66 (44–72) 59 (36–65) 52 (29–58) 45 (23–51) 38 (18–44) 31 (14–37) 25 (11–30) 20 (8.2–24) 15 (6.2–18)
6 82 80 76 70 65 58 51 43 36 29 23
Age = 90 years
Number of CRFs BMD T-score (femoral neck)
-4.0 -3.5 -3.0 -2.5 -2.0 -1.5 -1.0 -0.5 0 0.5 1.0
0 16 12 9.4 7.2 5.6 4.3 3.3 2.6 2.0 1.5 1.2
1 27 (21–49) 21 (16–41) 17 (12–33) 13 (9.3–27) 10 (7.3–22) 8.1 (5.7–17) 6.4 (4.4–14) 4.9 (3.4–11) 3.8 (2.6–8.3) 3.0 (2.0–6.4) 2.3 (1.5–5.0)
2 40 (27–60) 33 (22–53) 27 (17–45) 22 (13–38) 18 (10–32) 14 (7.9–26) 11 (6.1–21) 8.8 (4.8–17) 6.9 (3.7–13) 5.4 (2.8–10) 4.2 (2.2–8.2)
3 53 (36–69) 46 (29–63) 39 (23–56) 33 (18–49) 27 (15–42) 23 (12–36) 18 (9.1–30) 15 (7.1–24) 12 (5.5–19) 9.2 (4.3–15) 7.2 (3.3–12)
4 65 (46–75) 59 (39–71) 52 (32–65) 46 (26–58) 40 (21–52) 34 (17–45) 28 (13–38) 23 (11–32) 19 (8.3–27) 15 (6.4–22) 12 (5.0–17)
5 73 (57–78) 70 (50–75) 65 (42–71) 59 (36–65) 53 (30–60) 47 (25–54) 41 (20–47) 35 (16–41) 29 (13–35) 24 (10–29) 19 (8.0–23)
6 78 77 74 70 66 61 55 48 42 35 29
326

Annex 4
Ten-year probabilities of fracture in the United Kingdom population, bybody mass index, the number of clinical risk factors, age and sex
The following tables give the 10-year probability of fracture (%) according to BMI,the number of clinical risk factors (CRFs) and age. Estimates are based on theepidemiology of the United Kingdom. Each table provides a mean estimate and arange. The range is not a confidence interval but, because the weight of differentrisk factors varies, it is a true range.
Table A4.1 gives the probabilities for clinical spine, hip, forearm and humerusfracture (osteoporotic fracture) in men.
Table A4.2 gives the probabilities for hip fracture in men.
Table A4.3 gives the probabilities for clinical spine, hip, forearm and humerusfractures (osteoporotic fracture) in women.
Table A4.4 gives the probabilities of hip fracture in women.
Table A4.1
Ten-year probability of osteoporotic fractures (%), by body mass index (BMI), the number of clinical risk factors (CRFs) and age in men from the United Kingdom
Age = 50 years
Number of BMI (kg/m2)
CRFs 15 20 25 30 35 40 45
0 2.9 2.8 2.8 2.4 2.1 1.8 1.6
1 4.5 (3.0–6.6) 4.3 (2.9–6.1) 4.3 (2.8–5.8) 3.7 (2.5–5.1) 3.3 (2.2–4.4) 2.8 (1.9–3.9) 2.5 (1.7–3.4)
2 7.1 (3.8–12) 6.7 (3.5–11) 6.5 (3.4–11) 5.7 (3.0–9.9) 4.9 (2.6–8.7) 4.3 (2.3–7.7) 3.8 (2.0–6.7)
3 11 (5.4–19) 10 (4.9–18) 9.7 (4.7–18) 8.5 (4.0–15) 7.4 (3.5–14) 6.5 (3.1–12) 5.7 (2.7–11)
4 16 (8.9–25) 15 (8.0–24) 14 (7.5–23) 12 (6.5–20) 11 (5.6–18) 9.5 (4.9–16) 8.3 (4.2–14)
5 24 (15–31) 22 (14–29) 20 (14–27) 18 (12–24) 16 (11–21) 14 (9.5–19) 12 (8.3–17)
6 34 31 29 25 22 19 17
Age = 55 years
Number of BMI (kg/m2)
CRFs 15 20 25 30 35 40 45
0 3.5 3.4 3.3 2.9 2.5 2.2 1.9
1 5.5 (3.8–7.9) 5.2 (3.5–7.2) 5.1 (3.4–6.9) 4.4 (3.0–6.0) 3.9 (2.6–5.2) 3.4 (2.3–4.5) 2.9 (2.0–3.9)
2 8.6 (4.8–14) 8.0 (4.4–13) 7.7 (4.2–13) 6.7 (3.6–11) 5.8 (3.1–10) 5.1 (2.7–8.8) 4.4 (2.4–7.7)
3 13 (7.0–21) 12 (6.2–21) 11 (5.7–20) 10 (4.9–18) 8.7 (4.3–16) 7.6 (3.7–14) 6.6 (3.2–12)
4 19 (11–29) 18 (10–27) 17 (9.2–27) 15 (7.9–23) 13 (6.8–21) 11 (5.9–18) 9.6 (5.1–16)
5 28 (18–36) 25 (17–33) 24 (17–31) 21 (15–28) 18 (13–24) 16 (11–21) 14 (9.7–19)
6 39 35 33 29 25 22 19
327

Age = 60 years
Number of BMI (kg/m2)
CRFs 15 20 25 30 35 40 45
0 4.2 4.0 3.9 3.4 2.9 2.5 2.2
1 6.5 (4.5–9.2) 6.1 (4.2–8.4) 6.0 (4.1–7.9) 5.2 (3.5–6.8) 4.5 (3.0–5.9) 3.9 (2.6–5.1) 3.4 (2.2–4.4)
2 10 (5.9–16) 9.3 (5.3–15) 8.9 (5.0–15) 7.7 (4.3–13) 6.7 (3.7–11) 5.8 (3.2–9.9) 5.0 (2.7–8.6)
3 15 (8.9–23) 14 (7.7–22) 13 (7.0–22) 11 (6.0–20) 9.9 (5.1–17) 8.5 (4.4–15) 7.4 (3.8–13)
4 22 (14–32) 20 (12–30) 19 (11–29) 16 (9.4–26) 14 (8.0–23) 12 (6.8–20) 11 (5.8–17)
5 31 (21–39) 28 (20–36) 27 (19–35) 23 (17–31) 20 (14–27) 18 (12–24) 15 (11–21)
6 42 39 37 32 28 24 21
Age = 65 years
Number of BMI (kg/m2)
CRFs 15 20 25 30 35 40 45
0 5.2 5.0 4.9 4.2 3.6 3.1 2.7
1 7.9 (5.6–11) 7.5 (5.2–10) 7.4 (5.1–9.6) 6.3 (4.3–8.3) 5.5 (3.7–7.1) 4.7 (3.2–6.1) 4.0 (2.7–5.3)
2 12 (7.4–18) 11 (6.7–17) 11 (6.3–18) 9.4 (5.4–15) 8.1 (4.6–13) 6.9 (3.9–12) 6.0 (3.3–10)
3 17 (11–25) 16 (9.9–25) 16 (9.0–25) 14 (7.6–22) 12 (6.4–19) 10 (5.5–17) 8.6 (4.6–15)
4 24 (17–34) 23 (15–33) 22 (14–33) 19 (12–29) 17 (9.8–26) 14 (8.2–22) 12 (7.0–19)
5 33 (24–41) 31 (23–40) 31 (23–39) 27 (20–35) 23 (17–30) 20 (15–27) 17 (12–23)
6 43 41 41 36 31 27 23
Age = 70 years
Number of BMI (kg/m2)
CRFs 15 20 25 30 35 40 45
0 6.0 5.8 5.7 4.8 4.1 3.5 3.0
1 9.0 (6.4–12) 8.5 (6.1–11) 8.2 (5.9–11) 6.9 (4.9–9.1) 5.9 (4.2–7.7) 5.0 (3.5–6.6) 4.2 (3.0–5.6)
2 13 (8.6–20) 12 (8.0–18) 12 (7.5–17) 9.9 (6.3–14) 8.4 (5.2–12) 7.1 (4.4–10) 6.0 (3.7–8.8)
3 20 (12–29) 18 (12–26) 17 (11–25) 14 (9.0–21) 12 (7.5–18) 10 (6.3–15) 8.5 (5.3–13)
4 28 (19–38) 26 (17–36) 24 (16–34) 20 (13–29) 17 (11–25) 14 (9.3–21) 12 (7.7–18)
5 38 (32–47) 35 (29–44) 33 (27–41) 28 (22–36) 24 (18–31) 20 (15–26) 17 (13–22)
6 49 47 44 38 32 27 23
Age = 75 years
Number of BMI (kg/m2)
CRFs 15 20 25 30 35 40 45
0 6.6 6.3 6.1 5.1 4.3 3.6 3.0
1 10 (7.1–16) 9.7 (6.7–13) 9.1 (6.4–11) 7.5 (5.3–9.2) 6.2 (4.4–7.7) 5.1 (3.6–6.5) 4.3 (3.0–5.5)
2 16 (9.8–26) 15 (9.0–22) 13 (8.4–19) 11 (6.9–16) 9.1 (5.7–13) 7.5 (4.6–11) 6.1 (3.8–8.7)
3 24 (14–37) 22 (13–33) 20 (12–28) 16 (9.9–24) 13 (8.1–19) 11 (6.6–16) 8.9 (5.4–13)
4 35 (21–47) 32 (19–43) 29 (18–40) 24 (15–33) 20 (12–28) 16 (9.8–23) 13 (7.9–19)
5 47 (33–56) 43 (31–53) 40 (29–49) 34 (24–42) 28 (20–36) 23 (17–30) 19 (14–25)
6 59 56 52 45 39 33 27
328

Age = 80 years
Number of BMI (kg/m2)
CRFs 15 20 25 30 35 40 45
0 7.8 7.4 7.2 5.9 4.8 4.0 3.3
1 12 (8.3–19) 11 (7.8–17) 11 (7.5–15) 8.7 (6.1–12) 7.1 (4.9–9.4) 5.8 (4.0–7.5) 4.7 (3.2–6.0)
2 19 (12–29) 17 (11–26) 16 (10–22) 13 (8.1–18) 10 (6.5–15) 8.4 (5.3–12) 6.8 (4.3–9.7)
3 27 (16–39) 25 (15–36) 23 (14–32) 19 (11–27) 15 (9.0–22) 12 (7.2–18) 9.9 (5.8–15)
4 38 (23–49) 34 (22–45) 32 (21–42) 26 (17–36) 22 (14–30) 18 (11–25) 14 (8.8–20)
5 49 (34–58) 46 (32–55) 43 (30–52) 36 (25–45) 30 (21–38) 25 (17–32) 20 (14–27)
6 60 57 54 47 41 34 28
Age = 85 years
Number of BMI (kg/m2)
CRFs 15 20 25 30 35 40 45
0 9.3 8.8 8.6 7.0 5.7 4.6 3.7
1 15 (10–24) 14 (9.4–21) 13 (9.0–19) 10 (7.2–15) 8.4 (5.7–12) 6.8 (4.6–9.5) 5.4 (3.7–7.5)
2 22 (14–35) 20 (13–31) 19 (12–28) 15 (9.7–23) 12 (7.7–19) 10 (6.1–15) 8.0 (4.9–12)
3 32 (20–45) 29 (18–42) 27 (16–39) 22 (13–33) 18 (10–27) 15 (8.3–22) 12 (6.6–18)
4 43 (28–55) 40 (25–51) 37 (24–48) 31 (20–41) 26 (16–35) 21 (13–29) 17 (10–24)
5 54 (39–62) 51 (36–60) 48 (34–57) 41 (29–50) 35 (24–44) 29 (19–37) 24 (16–31)
6 63 62 59 53 46 40 33
Age = 90 years
Number of BMI (kg/m2)
CRFs 15 20 25 30 35 40 45
0 12 10 9.3 7.5 6.0 4.8 3.9
1 18 (13–29) 16 (11–25) 14 (10–22) 12 (8.1–17) 9.3 (6.4–14) 7.4 (5.1–11) 5.9 (4.0–8.6)
2 27 (18–42) 24 (16–37) 22 (14–32) 18 (11–27) 14 (8.8–21) 11 (7.0–17) 9.0 (5.5–14)
3 38 (25–52) 35 (22–48) 31 (20–44) 26 (16–37) 21 (12–31) 17 (9.9–25) 14 (7.8–20)
4 49 (33–60) 46 (31–58) 42 (28–54) 36 (23–47) 30 (19–40) 25 (15–34) 20 (12–28)
5 57 (45–64) 57 (42–64) 54 (40–63) 48 (33–56) 41 (28–50) 35 (23–43) 29 (18–36)
6 62 65 64 59 53 46 39
329

Table A4.2
Ten-year probability of hip fracture (%), by body mass index (BMI), the number of clinicalrisk factors (CRFs) and age in men from the United Kingdom
Age = 50 years
Number of BMI (kg/m2)
CRFs 15 20 25 30 35 40 45
0 0.4 0.2 0.1 0.1 0.1 0.1 0.1
1 0.9 (0.6–1.7) 0.5 (0.3–1.0) 0.3 (0.2–0.5) 0.2 (0.1–0.4) 0.2 (0.1–0.3) 0.1 (0.1–0.3) 0.1 (0.1–0.2)
2 1.7 (0.8–3.5) 0.9 (0.5–2.0) 0.5 (0.3–1.1) 0.4 (0.2–0.9) 0.3 (0.2–0.7) 0.2 (0.1–0.5) 0.2 (0.1–0.4)
3 3.1 (1.3–6.1) 1.8 (0.7–3.5) 1.0 (0.4–2.0) 0.8 (0.3–1.5) 0.6 (0.2–1.2) 0.5 (0.2–0.9) 0.4 (0.1–0.7)
4 5.6 (2.2–9.1) 3.2 (1.3–5.3) 1.8 (0.7–3.0) 1.4 (0.5–2.3) 1.1 (0.4–1.8) 0.8 (0.3–1.4) 0.7 (0.3–1.1)
5 9.7 (4.5–13) 5.7 (2.6–7.7) 3.3 (1.5–4.4) 2.5 (1.1–3.4) 2.0 (0.9–2.7) 1.5 (0.7–2.1) 1.2 (0.5–1.6)
6 16 9.9 5.7 4.5 3.5 2.7 2.1
Age = 55 years
Number of BMI (kg/m2)
CRFs 15 20 25 30 35 40 45
0 0.8 0.4 0.2 0.2 0.2 0.1 0.1
1 1.5 (1.0–2.6) 0.8 (0.6–1.5) 0.5 (0.3–0.8) 0.4 (0.3–0.6) 0.3 (0.2–0.5) 0.2 (0.2–0.4) 0.2 (0.1–0.3)
2 2.7 (1.4–5.1) 1.6 (0.8–3.0) 0.9 (0.5–1.7) 0.7 (0.4–1.3) 0.5 (0.3–1.0) 0.4 (0.2–0.8) 0.3 (0.2–0.6)
3 4.8 (2.2–8.8) 2.8 (1.3–5.3) 1.6 (0.7–3.0) 1.2 (0.6–2.4) 1.0 (0.4–1.8) 0.7 (0.3–1.4) 0.6 (0.3–1.1)
4 8.2 (3.8–13) 5.0 (2.3–7.9) 2.9 (1.3–4.6) 2.2 (1.0–3.6) 1.7 (0.8–2.8) 1.3 (0.6–2.2) 1.0 (0.5–1.7)
5 14 (7.3–18) 8.6 (4.5–11) 5.0 (2.6–6.6) 3.9 (2.0–5.2) 3.0 (1.6–4.0) 2.4 (1.2–3.1) 1.8 (0.9–2.4)
6 22 14 8.6 6.7 5.2 4.1 3.1
Age = 60 years
Number of BMI (kg/m2)
CRFs 15 20 25 30 35 40 45
0 1.3 0.8 0.4 0.3 0.3 0.2 0.2
1 2.3 (1.7–3.8) 1.4 (1.0–2.2) 0.8 (0.6–1.3) 0.6 (0.5–1.0) 0.5 (0.4–0.8) 0.4 (0.3–0.6) 0.3 (0.2–0.5)
2 4.1 (2.4–7.0) 2.5 (1.5–4.4) 1.5 (0.9–2.6) 1.1 (0.7–2.0) 0.9 (0.5–1.6) 0.7 (0.4–1.2) 0.5 (0.3–0.9)
3 6.9 (3.6–12) 4.3 (2.2–7.6) 2.6 (1.3–4.6) 2.0 (1.0–3.6) 1.5 (0.8–2.7) 1.2 (0.6–2.1) 0.9 (0.5–1.6)
4 11 (6.2–17) 7.4 (3.9–11) 4.5 (2.3–6.9) 3.5 (1.8–5.4) 2.7 (1.4–4.2) 2.1 (1.1–3.2) 1.6 (0.8–2.5)
5 18 (11–22) 12 (7.3–15) 7.6 (4.5–9.7) 5.9 (3.5–7.6) 4.6 (2.7–5.9) 3.5 (2.1–4.5) 2.7 (1.6–3.5)
6 28 20 13 9.8 7.6 5.9 4.6
330

Age = 65 years
Number of BMI (kg/m2)
CRFs 15 20 25 30 35 40 45
0 2.0 1.3 0.8 0.6 0.5 0.4 0.3
1 3.4 (2.7–5.0) 2.2 (1.7–3.2) 1.3 (1.0–1.9) 1.0 (0.8–1.5) 0.8 (0.6–1.1) 0.6 (0.5–0.9) 0.5 (0.4–0.7)
2 5.7 (3.5–8.7) 3.7 (2.3–5.9) 2.3 (1.4–3.7) 1.8 (1.1–2.9) 1.4 (0.8–2.2) 1.0 (0.7–1.7) 0.8 (0.5–1.3)
3 9.2 (5.3–15) 6.2 (3.5–10) 3.9 (2.2–6.5) 3.0 (1.7–5.0) 2.3 (1.3–3.9) 1.8 (1.0–3.0) 1.4 (0.8–2.3)
4 14 (9.0–21) 10 (6.1–15) 6.5 (3.8–9.7) 5.0 (2.9–7.5) 3.9 (2.3–5.8) 3.0 (1.7–4.5) 2.3 (1.3–3.5)
5 22 (15–26) 16 (11–19) 11 (7.2–13) 8.2 (5.5–10) 6.3 (4.3–7.9) 4.9 (3.3–6.1) 3.8 (2.5–4.7)
6 31 24 17 13 10 7.9 6.1
Age = 70 years
Number of BMI (kg/m2)
CRFs 15 20 25 30 35 40 45
0 3.0 2.0 1.3 1.0 0.8 0.6 0.4
1 5.1 (3.8–6.3) 3.6 (2.7–4.3) 2.3 (1.8–2.8) 1.8 (1.4–2.1) 1.4 (1.0–1.6) 1.0 (0.8–1.2) 0.8 (0.6–1.0)
2 8.6 (5.7–13) 6.2 (4.1–8.9) 4.1 (2.7–5.8) 3.2 (2.1–4.5) 2.4 (1.6–3.4) 1.8 (1.2–2.6) 1.4 (0.9–2.0)
3 14 (8.8–21) 10 (6.7–15) 7.1 (4.7–10) 5.5 (3.6–8.1) 4.2 (2.8–6.2) 3.2 (2.1–4.8) 2.5 (1.6–3.7)
4 22 (15–30) 17 (11–24) 12 (8.3–17) 9.4 (6.4–14) 7.3 (4.9–11) 5.6 (3.7–8.2) 4.3 (2.8–6.3)
5 32 (27–40) 26 (22–33) 20 (16–25) 16 (13–20) 12 (10–16) 9.4 (7.7–12) 7.3 (5.9–9.5)
6 44 38 31 25 20 15 12
Age = 75 years
Number of BMI (kg/m2)
CRFs 15 20 25 30 35 40 45
0 4.3 3.1 2.2 1.6 1.3 1.0 0.7
1 7.7 (5.1–14) 5.9 (3.9–10) 4.1 (2.8–7.3) 3.1 (2.1–5.6) 2.4 (1.6–4.3) 1.8 (1.2–3.3) 1.4 (0.9–2.5)
2 13 (7.6–22) 10 (5.9–18) 7.6 (4.3–13) 5.8 (3.3–9.9) 4.5 (2.5–7.6) 3.4 (1.9–5.9) 2.6 (1.4–4.5)
3 21 (11–34) 17 (9.1–28) 13 (7.0–21) 10 (5.4–17) 8.0 (4.1–13) 6.1 (3.1–10) 4.7 (2.3–7.8)
4 32 (18–44) 27 (15–39) 22 (12–32) 17 (9.2–26) 14 (7.0–21) 11 (5.4–16) 8.1 (4.1–13)
5 44 (29–54) 39 (25–49) 34 (20–43) 27 (16–35) 22 (12–29) 17 (9.4–23) 14 (7.2–18)
6 58 53 48 40 33 27 22
Age = 80 years
Number of BMI (kg/m2)
CRFs 15 20 25 30 35 40 45
0 5.8 4.6 3.4 2.6 1.9 1.5 1.1
1 10 (6.8–18) 8.1 (5.5–14) 6.1 (4.2–11) 4.7 (3.2–8.5) 3.6 (2.4–6.5) 2.7 (1.8–5.0) 2.0 (1.4–3.8)
2 16 (9.9–28) 14 (8.1–23) 11 (6.3–18) 8.2 (4.8–14) 6.3 (3.6–11) 4.8 (2.8–8.6) 3.6 (2.1–6.6)
3 25 (14–37) 21 (12–32) 17 (9.6–27) 14 (7.3–22) 11 (5.6–17) 8.1 (4.2–13) 6.2 (3.2–10)
4 36 (21–47) 31 (17–42) 27 (14–37) 21 (11–30) 17 (8.6–24) 13 (6.5–19) 10 (4.9–15)
5 48 (31–57) 43 (27–52) 38 (23–47) 32 (18–40) 26 (14–33) 21 (11–27) 16 (8.4–21)
6 60 56 51 44 37 30 24
331

Age = 85 years
Number of BMI (kg/m2)
CRFs 15 20 25 30 35 40 45
0 7.6 6.2 4.9 3.7 2.8 2.1 1.6
1 13 (8.8–22) 11 (7.3–19) 8.7 (5.9–16) 6.7 (4.5–12) 5.1 (3.4–9.3) 3.8 (2.5–7.1) 2.9 (1.9–5.4)
2 20 (13–34) 17 (11–29) 14 (8.7–25) 11 (6.6–20) 8.7 (5.0–15) 6.6 (3.8–12) 5.0 (2.8–9.2)
3 30 (18–44) 26 (15–39) 22 (13–34) 18 (9.8–28) 14 (7.5–22) 11 (5.7–18) 8.4 (4.3–14)
4 42 (26–54) 37 (22–49) 33 (19–44) 27 (14–37) 22 (11–30) 17 (8.6–25) 13 (6.5–20)
5 53 (38–62) 49 (33–58) 45 (29–54) 38 (23–47) 32 (18–40) 26 (14–33) 21 (11–27)
6 63 61 57 51 43 37 30
Age = 90 years
Number of BMI (kg/m2)
CRFs 15 20 25 30 35 40 45
0 10 8.0 6.0 4.6 3.5 2.7 2.0
1 17 (12–28) 14 (9.6–24) 11 (7.5–19) 8.3 (5.7–15) 6.3 (4.3–11) 4.8 (3.3–8.8) 3.7 (2.5–6.8)
2 26 (17–41) 22 (14–36) 18 (11–30) 14 (8.5–24) 11 (6.5–19) 8.4 (4.9–15) 6.4 (3.7–11)
3 37 (23–51) 32 (20–46) 28 (16–40) 22 (13–33) 18 (9.8–27) 14 (7.5–22) 11 (5.7–17)
4 48 (32–60) 44 (28–56) 39 (24–51) 33 (19–44) 27 (15–37) 22 (11–30) 17 (8.7–25)
5 57 (44–63) 56 (40–64) 52 (35–61) 45 (29–54) 38 (23–47) 32 (19–40) 26 (14–33)
6 61 64 63 58 51 44 37
Table A4.3
Ten-year probability of osteoporotic fractures (%), by body mass index (BMI), the numberof clinical risk factors (CRFs) and age in women from the United Kingdom
Age = 50 years
Number of BMI (kg/m2)
CRFs 15 20 25 30 35 40 45
0 3.9 3.6 3.5 3.0 2.6 2.3 2.0
1 6.3 (4.3–9.1) 5.7 (3.9–8.0) 5.4 (3.6–7.4) 4.7 (3.2–6.4) 4.1 (2.8–5.6) 3.6 (2.4–4.9) 3.2 (2.1–4.3)
2 9.9 (5.4–16) 8.8 (4.7–15) 8.2 (4.4–14) 7.2 (3.8–12) 6.3 (3.3–11) 5.5 (2.9–9.6) 4.8 (2.5–8.4)
3 15 (7.8–26) 13 (6.6–24) 12 (6.0–22) 11 (5.2–20) 9.5 (4.5–17) 8.3 (4.0–15) 7.3 (3.4–13)
4 23 (14–35) 20 (11–31) 18 (9.9–29) 16 (8.6–26) 14 (7.5–23) 12 (6.5–20) 11 (5.7–18)
5 34 (22–43) 29 (20–37) 26 (18–34) 23 (16–30) 20 (14–27) 18 (12–24) 16 (11–21)
6 49 41 37 33 29 25 22
332

Age = 55 years
Number of BMI (kg/m2)
CRFs 15 20 25 30 35 40 45
0 5.3 4.8 4.6 4.0 3.5 3.1 2.7
1 8.5 (6.0–12) 7.6 (5.3–10) 7.1 (4.9–9.5) 6.2 (4.2–8.3) 5.4 (3.7–7.2) 4.7 (3.2–6.3) 4.1 (2.8–5.5)
2 13 (7.7–21) 12 (6.5–19) 11 (5.9–18) 9.4 (5.1–16) 8.2 (4.5–14) 7.2 (3.9–12) 6.3 (3.4–11)
3 21 (11–33) 18 (9.3–30) 16 (8.1–28) 14 (7.0–25) 12 (6.1–22) 11 (5.3–19) 9.4 (4.6–17)
4 31 (19–44) 26 (16–39) 23 (13–36) 20 (12–32) 18 (10–28) 16 (8.7–25) 14 (7.6–22)
5 44 (30–53) 37 (26–46) 33 (24–42) 29 (21–38) 26 (18–34) 23 (16–30) 20 (14–26)
6 60 51 46 41 36 32 28
Age = 60 years
Number of BMI (kg/m2)
CRFs 15 20 25 30 35 40 45
0 7.4 6.5 6.0 5.2 4.6 4.0 3.5
1 12 (8.4–16) 10 (7.2–13) 9.3 (6.5–12) 8.1 (5.6–11) 7.0 (4.9–9.2) 6.1 (4.2–8.0) 5.3 (3.7–7.0)
2 18 (11–26) 15 (9.0–24) 14 (7.9–22) 12 (6.9–20) 11 (5.9–17) 9.2 (5.1–15) 8.1 (4.4–13)
3 27 (16–40) 23 (13–36) 20 (11–34) 18 (9.5–30) 16 (8.2–27) 14 (7.1–24) 12 (6.1–21)
4 39 (26–53) 33 (22–47) 29 (18–44) 26 (16–39) 23 (14–35) 20 (12–31) 17 (10–27)
5 54 (40–63) 46 (34–56) 41 (31–51) 36 (27–46) 32 (24–41) 28 (21–36) 25 (18–32)
6 69 61 55 49 44 39 34
Age = 65 years
Number of BMI (kg/m2)
CRFs 15 20 25 30 35 40 45
0 11 9.3 8.6 7.4 6.5 5.6 4.9
1 16 (12–21) 14 (10–18) 13 (9.2–16) 11 (7.9–14) 9.8 (6.9–12) 8.5 (5.9–11) 7.4 (5.1–9.5)
2 24 (16–34) 21 (13–31) 19 (11–29) 17 (9.8–26) 14 (8.4–23) 13 (7.3–20) 11 (6.3–18)
3 35 (24–49) 30 (19–45) 27 (16–43) 24 (14–38) 21 (12–34) 18 (10–30) 16 (8.7–27)
4 48 (35–62) 42 (30–57) 38 (26–54) 34 (22–49) 30 (19–44) 26 (16–39) 23 (14–35)
5 62 (51–71) 56 (45–66) 51 (41–62) 46 (36–56) 41 (32–51) 36 (28–46) 32 (24–41)
6 75 70 65 59 54 48 43
Age = 70 years
Number of BMI (kg/m2)
CRFs 15 20 25 30 35 40 45
0 14 12 11 9.5 8.2 7.1 6.2
1 21 (16–26) 18 (14–22) 16 (12–20) 14 (10–18) 12 (8.8–15) 10 (7.6–13) 8.9 (6.5–11)
2 31 (22–41) 26 (18–35) 23 (15–31) 20 (13–27) 17 (11–24) 15 (9.4–21) 13 (8.0–18)
3 44 (32–58) 37 (26–51) 32 (21–46) 28 (18–40) 24 (15–35) 21 (13–31) 18 (11–27)
4 58 (46–71) 51 (39–65) 44 (33–59) 39 (29–53) 34 (24–47) 29 (21–41) 25 (18–36)
5 72 (66–79) 66 (59–74) 59 (51–68) 52 (44–62) 46 (38–55) 40 (33–49) 35 (28–43)
6 81 78 73 67 60 54 47
333

Age = 75 years
Number of BMI (kg/m2)
CRFs 15 20 25 30 35 40 45
0 18 15 13 12 9.8 8.4 7.2
1 27 (20–37) 23 (17–29) 20 (15–23) 17 (13–20) 14 (11–17) 12 (9.0–15) 10 (7.6–13)
2 40 (27–54) 34 (22–46) 28 (19–37) 24 (16–32) 21 (13–27) 17 (11–23) 15 (9.6–19)
3 54 (38–69) 47 (33–62) 40 (27–54) 35 (23–47) 29 (19–41) 25 (16–35) 21 (14–30)
4 67 (51–77) 62 (46–75) 55 (41–69) 48 (35–62) 41 (30–55) 36 (25–48) 30 (21–41)
5 77 (66–83) 74 (63–81) 69 (59–78) 63 (52–72) 56 (46–65) 49 (40–58) 42 (34–51)
6 83 83 81 76 70 63 56
Age = 80 years
Number of BMI (kg/m2)
CRFs 15 20 25 30 35 40 45
0 22 19 17 15 12 11 8.9
1 32 (24–45) 28 (21–38) 25 (19–31) 21 (16–26) 18 (13–21) 15 (11–18) 13 (9.3–15)
2 44 (32–59) 40 (28–52) 35 (24–45) 30 (20–38) 25 (17–32) 21 (14–27) 18 (12–23)
3 56 (41–69) 52 (38–65) 47 (35–59) 41 (29–52) 35 (25–46) 30 (21–39) 25 (17–34)
4 67 (53–77) 64 (51–74) 60 (47–72) 54 (41–66) 47 (35–59) 41 (30–52) 35 (25–46)
5 76 (65–81) 74 (63–80) 72 (61–79) 66 (55–74) 60 (48–68) 53 (42–62) 46 (37–55)
6 81 81 80 76 71 65 59
Age = 85 years
Number of BMI (kg/m2)
CRFs 15 20 25 30 35 40 45
0 25 23 22 18 15 13 11
1 35 (27–49) 33 (25–45) 31 (23–39) 26 (19–33) 22 (16–28) 18 (13–23) 15 (11–19)
2 47 (34–62) 44 (32–58) 42 (30–53) 36 (25–46) 30 (21–40) 26 (17–34) 21 (14–29)
3 58 (43–71) 55 (41–69) 53 (39–66) 47 (33–60) 41 (28–53) 35 (23–46) 30 (19–40)
4 68 (55–77) 66 (53–76) 64 (51–74) 58 (45–69) 52 (39–63) 45 (33–57) 39 (28–50)
5 75 (66–79) 75 (64–80) 73 (63–80) 68 (57–76) 63 (51–71) 57 (45–65) 50 (39–59)
6 77 80 80 77 72 67 61
Age = 90 years
Number of BMI (kg/m2)
CRFs 15 20 25 30 35 40 45
0 26 23 21 18 15 12 10
1 37 (29–52) 34 (26–46) 30 (23–40) 26 (19–34) 21 (16–28) 18 (13–23) 15 (11–19)
2 49 (37–64) 46 (33–60) 42 (30–54) 36 (25–47) 30 (21–40) 25 (17–34) 21 (14–29)
3 60 (46–72) 57 (43–71) 54 (40–67) 48 (34–61) 41 (28–54) 35 (24–47) 30 (19–40)
4 68 (57–77) 67 (55–77) 65 (53–75) 60 (46–70) 53 (40–64) 47 (34–58) 40 (28–52)
5 71 (66–75) 74 (66–78) 74 (64–80) 70 (58–76) 64 (52–72) 58 (46–67) 52 (40–61)
6 69 76 79 77 73 69 63
334

Table A4.4
Ten-year probability of hip fracture (%), by body mass index (BMI), the number of clinicalrisk factors (CRFs) and age in women from the United Kingdom
Age = 50 years
Number of BMI (kg/m2)
CRFs 15 20 25 30 35 40 45
0 0.7 0.4 0.2 0.2 0.1 0.1 0.1
1 1.5 (0.9–2.8) 0.8 (0.5–1.5) 0.4 (0.3–0.8) 0.3 (0.2–0.6) 0.3 (0.2–0.5) 0.2 (0.1–0.4) 0.2 (0.1–0.3)
2 2.8 (1.4–6.0) 1.5 (0.8–3.3) 0.8 (0.4–1.8) 0.6 (0.3–1.4) 0.5 (0.3–1.1) 0.4 (0.2–0.8) 0.3 (0.2–0.7)
3 5.3 (2.2–10) 2.9 (1.2–5.7) 1.6 (0.6–3.1) 1.2 (0.5–2.4) 1.0 (0.4–1.9) 0.7 (0.3–1.5) 0.6 (0.2–1.1)
4 9.6 (3.8–15) 5.3 (2.1–8.6) 2.9 (1.1–4.7) 2.3 (0.9–3.7) 1.8 (0.7–2.9) 1.4 (0.5–2.2) 1.1 (0.4–1.7)
5 17 (7.9–22) 9.5 (4.4–13) 5.2 (2.4–7.1) 4.1 (1.9–5.5) 3.2 (1.4–4.3) 2.5 (1.1–3.4) 1.9 (0.9–2.6)
6 28 16 9.2 7.2 5.6 4.4 3.4
Age = 55 years
Number of BMI (kg/m2)
CRFs 15 20 25 30 35 40 45
0 1.3 0.7 0.4 0.3 0.2 0.2 0.1
1 2.5 (1.7–4.4) 1.4 (0.9–2.4) 0.8 (0.5–1.3) 0.6 (0.4–1.0) 0.5 (0.3–0.8) 0.4 (0.2–0.6) 0.3 (0.2–0.5)
2 4.7 (2.6–9.1) 2.6 (1.4–5.1) 1.4 (0.8–2.8) 1.1 (0.6–2.2) 0.9 (0.5–1.7) 0.7 (0.4–1.3) 0.5 (0.3–1.0)
3 8.5 (3.9–16) 4. (2.1–8.9) 2.6 (1.2–4.9) 2.0 (0.9–3.8) 1.6 (0.7–3.0) 1.2 (0.5–2.3) 1.0 (0.4–1.8)
4 15 (6.8–23) 8.4 (3.8–13) 4.7 (2.1–7.4) 3.6 (1.6–5.8) 2.8 (1.2–4.5) 2.2 (1.0–3.5) 1.7 (0.8–2.7)
5 25 (14–32) 15 (7.8–19) 8.2 (4.3–11) 6.4 (3.4–8.5) 5.0 (2.6–6.7) 3.9 (2.1–5.2) 3.1 (1.6–4.1)
6 39 24 14 11 8.7 6.8 5.3
Age = 60 years
Number of BMI (kg/m2)
CRFs 15 20 25 30 35 40 45
0 2.4 1.3 0.7 0.6 0.4 0.3 0.3
1 4.4 (3.1–6.8) 2.4 (1.7–3.8) 1.3 (0.9–2.1) 1.0 (0.7–1.6) 0.8 (0.6–1.3) 0.6 (0.4–1.0) 0.5 (0.3–0.8)
2 7.8 (4.6–14) 4.4 (2.6–7.9) 2.4 (1.4–4.4) 1.9 (1.1–3.4) 1.5 (0.9–2.7) 1.1 (0.7–2.1) 0.9 (0.5–1.6)
3 13 (6.9–23) 7.7 (3.9–14) 4.3 (2.2–7.7) 3.4 (1.7–6.0) 2.6 (1.3–4.7) 2.0 (1.0–3.6) 1.6 (0.8–2.8)
4 22 (12–33) 13 (6.8–20) 7.5 (3.8–11) 5.9 (2.9–9.0) 4.6 (2.3–7.1) 3.6 (1.8–5.5) 2.8 (1.4–4.3)
5 35 (23–43) 22 (14–28) 13 (7.9–17) 10 (6.1–13) 7.9 (4.8–10) 6.2 (3.7–8.1) 4.8 (2.9–6.3)
6 52 35 21 17 13 10 8.2
335

Age = 65 years
Number of BMI (kg/m2)
CRFs 15 20 25 30 35 40 45
0 4.1 2.3 1.3 1.0 0.8 0.6 0.5
1 7.2 (5.4–10) 4.1 (3.1–5.7) 2.3 (1.7–3.2) 1.8 (1.3–2.5) 1.4 (1.0–1.9) 1.1 (0.8–1.5) 0.8 (0.6–1.2)
2 12 (7.7–19) 7.1 (4.5–12) 4.0 (2.5–6.6) 3.1 (2.0–5.2) 2.4 (1.5–4.0) 1.9 (1.2–3.1) 1.5 (0.9–2.4)
3 20 (12–31) 12 (6.8–19) 6.9 (3.8–11) 5.4 (3.0–9.0) 4.2 (2.3–7.0) 3.3 (1.8–5.5) 2.5 (1.4–4.3)
4 31 (19–43) 19 (12–28) 12 (6.7–17) 9.1 (5.2–13) 7.1 (4.1–10) 5.5 (3.1–8.2) 4.3 (2.4–6.4)
5 45 (34–53) 31 (22–37) 19 (13–24) 15 (11–19) 12 (8.2–15) 9.3 (6.4–12) 7.3 (5.0–9.3)
6 62 46 30 24 19 15 12
Age = 70 years
Number of BMI (kg/m2)
CRFs 15 20 25 30 35 40 45
0 6.9 4.1 2.3 1.8 1.4 1.1 0.8
1 12 (9.6–14) 7.4 (5.9–8.6) 4.3 (3.4–5.0) 3.3 (2.6–3.9) 2.6 (2.1–3.0) 2.0 (1.6–2.3) 1.5 (1.2–1.8)
2 21 (14–27) 13 (8.8–17) 7.7 (5.2–10) 6.0 (4.0–8.0) 4.7 (3.1–6.3) 3.6 (2.4–4.9) 2.8 (1.9–3.8)
3 33 (23–44) 22 (15–31) 14 (9.0–20) 11 (7.0–16) 8.4 (5.4–12) 6.5 (4.2–9.7) 5.1 (3.3–7.6)
4 49 (38–61) 35 (27–47) 23 (17–32) 18 (14–26) 15 (11–21) 12 (8.3–16) 9.0 (6.5–13)
5 65 (59–73) 52 (47–61) 37 (33–44) 30 (26–36) 25 (21–30) 20 (17–24) 16 (13–19)
6 77 70 55 47 39 32 26
Age = 75 years
Number of BMI (kg/m2)
CRFs 15 20 25 30 35 40 45
0 11 7.0 4.2 3.2 2.5 1.9 1.5
1 20 (14–32) 13 (9.6–22) 8.2 (5.9–14) 6.4 (4.6–11) 4.9 (3.6–8.5) 3.8 (2.7–6.6) 3.0 (2.1–5.1)
2 32 (21–49) 23 (14–36) 15 (8.9–25) 12 (6.9–20) 9.3 (5.4–16) 7.3 (4.2–13) 5.7 (3.2–9.8)
3 48 (32–65) 38 (23–54) 26 (15–40) 21 (12–33) 17 (9.3–27) 13 (7.2–21) 10 (5.6–17)
4 63 (46–75) 54 (37–69) 42 (26–58) 35 (20–49) 29 (16–41) 23 (13–34) 18 (9.9–28)
5 75 (61–81) 70 (54–78) 61 (42–70) 53 (35–62) 45 (28–54) 37 (23–46) 30 (18–38)
6 83 81 77 70 63 55 47
Age = 80 years
Number of BMI (kg/m2)
CRFs 15 20 25 30 35 40 45
0 16 11 7.0 5.4 4.2 3.2 2.5
1 26 (19–41) 19 (14–32) 13 (9.5–22) 10 (7.3–17) 7.8 (5.7–14) 6.1 (4.4–11) 4.7 (3.3–8.3)
2 38 (27–56) 31 (20–47) 22 (14–36) 18 (11–29) 14 (8.5–23) 11 (6.6–19) 8.5 (5.1–15)
3 52 (37–67) 45 (29–61) 35 (21–52) 29 (16–44) 23 (13–36) 19 (10–30) 15 (7.7–24)
4 64 (47–75) 59 (41–71) 51 (33–64) 43 (27–57) 36 (21–49) 30 (17–41) 24 (13–34)
5 74 (61–80) 71 (56–78) 66 (48–74) 59 (40–68) 51 (33–61) 44 (27–53) 37 (22–45)
6 81 80 77 72 66 59 51
336

Age = 85 years
Number of BMI (kg/m2)
CRFs 15 20 25 30 35 40 45
0 19 15 11 8.4 6.4 4.9 3.8
1 30 (22–46) 25 (18–40) 19 (14–31) 15 (11–25) 12 (8.3–20) 9.0 (6.3–16) 6.9 (4.8–12)
2 42 (30–60) 37 (26–54) 30 (20–46) 24 (16–39) 19 (12–32) 15 (9.4–26) 12 (7.3–20)
3 55 (40–69) 50 (35–65) 44 (28–59) 37 (23–52) 30 (18–44) 25 (14–37) 20 (11–30)
4 66 (50–76) 62 (45–73) 57 (40–69) 50 (33–63) 43 (27–56) 36 (21–48) 30 (17–41)
5 74 (63–79) 73 (59–79) 69 (54–77) 63 (47–72) 57 (39–66) 50 (33–59) 43 (27–52)
6 77 79 79 74 69 63 56
Age = 90 years
Number of BMI (kg/m2)
CRFs 15 20 25 30 35 40 45
0 21 16 11 8.9 6.9 5.3 4.0
1 33 (25–50) 27 (20–42) 20 (15–33) 16 (11–27) 12 (8.9–21) 9.6 (6.8–17) 7.4 (5.2–13)
2 46 (34–63) 40 (28–57) 32 (21–48) 26 (17–41) 21 (13–34) 16 (10–27) 13 (7.8–22)
3 58 (44–71) 53 (38–68) 46 (30–62) 39 (24–55) 32 (19–47) 26 (15–40) 21 (12–33)
4 67 (54–76) 65 (49–75) 60 (43–72) 53 (36–66) 46 (29–59) 39 (23–51) 32 (18–44)
5 71 (65–75) 73 (62–78) 72 (57–78) 66 (50–74) 60 (43–69) 53 (36–62) 46 (29–55)
6 69 76 78 75 71 66 59
337