assessment of norwegian mobile revenues in a nordic context
TRANSCRIPT
tefficient AB www.tefficient.com 22 December 2020 1
Analysis prepared for Kommunal- og moderniseringsdepartementet
Assessment of Norwegian mobile
revenues in a Nordic context
tefficient AB www.tefficient.com 22 December 2020 2
Contents
1. Executive summary ................................................................................................................................. 3
2. Background .............................................................................................................................................. 5
3. Peer group ................................................................................................................................................ 6
4. Are Norwegian mobile revenues higher? ............................................................................................. 8
5. Is higher purchasing power explaining Norway’s higher ARPU? .................................................... 10
6. Are Norwegian data-rich mobile plans more expensive? ................................................................ 14
7. Are topology and population density affecting the number of sites in mobile networks? ......... 19
7.1. Site numbers vs. population density .......................................................................................... 20
7.2. Site numbers vs. population ........................................................................................................ 25
7.3. Site numbers vs. population in ‘tettsteder’ ................................................................................ 27
8. Are larger networks driving an operator’s total costs? .................................................................... 30
9. Are higher mobile revenues needed to compensate for these network costs? ........................... 33
10. Comparison of mobile data usage and revenue ........................................................................... 37
11. Is high quality fixed broadband behind lower mobile data usage? ........................................... 47
12. Comparison of the mobile network experience ............................................................................ 50
13. Conclusions ........................................................................................................................................ 55
13.1. Summary of findings so far ........................................................................................................... 55
13.2. Market concentration ...................................................................................................................... 56
13.3. Summary and conclusion ............................................................................................................... 61
tefficient AB www.tefficient.com 22 December 2020 3
1. Executive summary
This analysis is commissioned by Kommunal- og moderniseringsdepartementet (KMD). It investigates
whether Norwegian mobile prices should be considered high or moderate given certain specific Norwegian
conditions.
A multitude of metrics are used – always compared between the same four markets: Norway, Denmark,
Sweden and Finland. The analysis shows why these markets form a near-perfect peer group.
Regulator data shows that Norwegian revenue per mobile subscription is higher than in the other three
countries. When adjusting the revenue of the other countries with purchase power parity GDP, we can see
that the Finnish revenue per subscription roughly matches that of Norway – and that Swedish and Danish
revenues come closer. The average data usage is however higher in Denmark, Sweden and, especially,
Finland.
To give a sense of the current pricing of data-rich plans, the analysis compares 70 plans with unlimited data
or a bucket of at least 30 GB per month. Norway generally has higher prices, but when adjusting for
purchase power parity GDP, Swedish pricing comes quite close to Norwegian for the data-rich bucket plans.
Norwegian unlimited plans are still more expensive and more restricted in policy.
Norway’s lower population density doesn’t result in a higher number of sites if compared to Sweden and
Finland – that narrative is true only when comparing to Denmark. Norway has a lower number of mobile
sites compared to Sweden and Finland per MNO, per network and per network if excluding the last entrant.
The analysis shows why network costs and network size – in a Nordic perspective – no longer define the
total costs (OPEX and CAPEX) for an established operator. A network with many mobile sites represents a
revenue opportunity for operators and is regarded an asset by infrastructure companies.
Telenor and Telia Norway have the highest EBITDA margins in the Nordics, so high OPEX isn’t behind the
higher mobile revenue in their case. Ice’s situation is different in part because of high national roaming
OPEX.
Norwegian operators use more CAPEX than what is typical in the Nordics. This is particularly true for Ice
which invests the most in relation to its revenue. Since the EBITDA-CAPEX (~cash flow) margins of Telenor
and Telia Norway are higher than average, the companies can well afford its current level of CAPEX. Ice’s
situation is again different with the highest OPEX and the highest CAPEX in relation to revenue.
Norway is not only having the lowest mobile data usage in the Nordics, it is also growing slower than in
Denmark, Sweden and Finland. This gives Norway the unfavourable (from a consumer point of view)
combination of higher revenue and lower usage per subscription. The revenue per mobile gigabyte (GB) is
much higher in Norway – also after purchasing power adjustment.
Norwegian fixed broadband networks are excellent in availability and speed. But it is not explaining the low
mobile data usage since the other countries have as excellent fixed broadband networks.
The speeds when using mobile data in Norway is higher than in the other three countries, though. As mobile
speed depends on the traffic load, Norway’s low mobile data usage helps on speed. It is also an indication of
that Norwegian operators have invested in capacity not fully utilised. With a wider take on mobile network
tefficient AB www.tefficient.com 22 December 2020 4
quality – not just speed – Norway’s mobile networks are still world-class, but so are the mobile networks of
Denmark, Sweden and Finland.
The analysis shows that the Norwegian mobile market is uniquely concentrated. It is not just explained by
the number of MNOs.
In its conclusion, the analysis ranks the analysed potential root causes based on how likely it is that they
cause Norway’s high revenue per mobile GB. Tefficient concludes that the most likely root cause is the
market concentration but that the stronger Norwegian purchase power also plays a role. Other factors are
unlikely to have any major impact – or unlikely to have any impact at all.
tefficient AB www.tefficient.com 22 December 2020 5
2. Background
This analysis is commissioned by Kommunal- og moderniseringsdepartementet (KMD). KMD has provided
this background to the analysis (translated from Norwegian):
Norwegian mobile networks are well developed and score high in international comparisons of capacity and
quality. The prices for mobile data in Norway may, however, appear to be high compared with other
countries, e.g. in the Nordic region, and the use of mobile data is correspondingly lower. A possible
explanation for this may be weak competition as a result of Norway being one of the few countries in Europe
with only two full-fledged nationwide mobile networks, and one under development; Ice.
Kommunal- og moderniseringsdepartementet (KMD) is working on a white paper to Stortinget covering
electronic communications. One of several topics that will be discussed in the white paper is the competition
in the mobile markets and the prices for mobile services/mobile data. In the work on the white paper, KMD
received input from Norwegian telecom providers. There are different opinions about whether Norwegian
mobile prices can actually be considered high. Several have argued that Norwegian mobile prices are
moderate if special Norwegian conditions are taken into account, including that Norway has scattered
settlements, a challenging topography and a generally high level of income, price and cost compared with
other countries in the Nordic region.
KMD wants assistance from an external investigator to shed light on and assess whether Norwegian mobile
prices are moderate or can be said to be too high as a result of a lack of competition. An important part of
the assignment will be to assess the various arguments that have emerged in this context.
tefficient AB www.tefficient.com 22 December 2020 6
3. Peer group
In the input that KMD received from Norwegian telecom providers, different peer groups have been used to
compare different metrics:
Nordic countries – Norway, Denmark, Sweden, Finland, Iceland
Nordic countries except Iceland – Norway, Denmark, Sweden, Finland
Norway and Sweden
Selected European countries – Norway, the Netherlands, Denmark, Belgium, Finland, Sweden,
France, the UK, Germany
Selected global countries – Norway, Denmark, the Netherlands, Germany, Sweden, Finland, France,
China, the UK, USA, Canada
Selected global countries – Norway, Ireland, Austria, Denmark, Germany, the Netherlands, Sweden,
Italy, Belgium, Australia, Finland, France, Switzerland, the UK, New Zealand, Spain, Taiwan, USA,
Greece, Portugal, South Korea, Canada, Japan
As a telecom analyst, Tefficient well understands how difficult it can be to find comparable market data for
comparable markets. There is however a risk in mixing the comparison peer group between different parts
of an analysis and as Tefficient we favour an approach where the same markets are compared on all
metrics.
For the past eight years, 2013-2020, Tefficient has annually, as a commercial service, benchmarked a
varying group of telecom operators in Norway, Denmark, Sweden and Finland against a common peer group
solely consisting of the participating operators from these four countries. The identities of the participating
operators aren’t public. Designing a common peer group for these four countries was a deliberate decision
as operators in these countries show a high level of comparability in the business environment and in
how telecom operators are operating. We also sense that Nordic operators generally have a stronger urge to
excel and improve than telecom operators in other mature markets. This means that a peer group solely
consisting of Nordic operators will not only be highly comparable, but also more challenging. The Nordics is
very well served with high quality telecommunications in spite of low population. Nordic operators are also
generally quite profitable.
During on our eight years of conducting a very detailed benchmark in the region we have noted that the
differences between operators in one and the same market could be more significant than the differences
between markets as a whole. This can be seen when comparing the reported margins in Section 9.
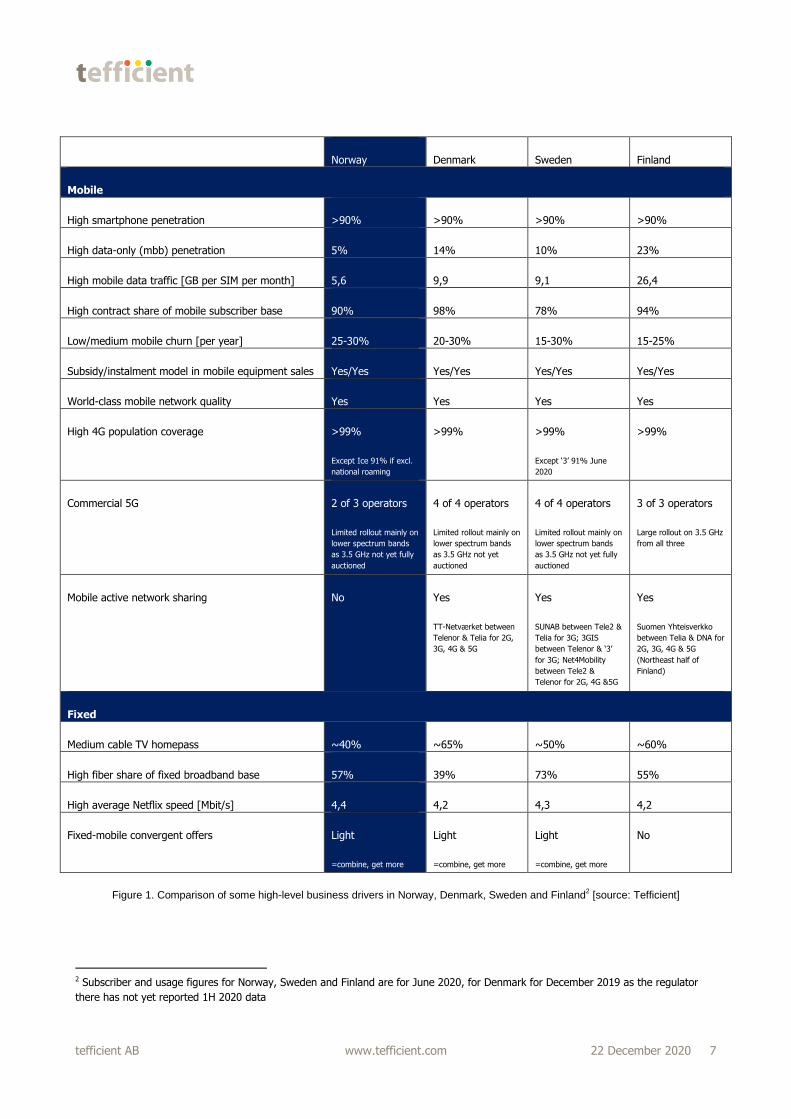
On the next page are some high level indicators of why operators in Norway, Denmark, Sweden and Finland
are comparable.
For the reasons stated above, Tefficient has for this analysis decided to use the four countries Norway,
Denmark, Sweden and Finland as the peer group. All metrics will always1 be compared between these
four countries to allow the reader to understand how one metric may affect another metric.
1 On a few occasions, regulatory data with sufficient break-down isn’t available, leaving out that metric for the country in question
tefficient AB www.tefficient.com 22 December 2020 7
Norway Denmark Sweden Finland
Mobile
High smartphone penetration >90% >90% >90% >90%
High data-only (mbb) penetration 5% 14% 10% 23%
High mobile data traffic [GB per SIM per month] 5,6 9,9 9,1 26,4
High contract share of mobile subscriber base 90% 98% 78% 94%
Low/medium mobile churn [per year] 25-30% 20-30% 15-30% 15-25%
Subsidy/instalment model in mobile equipment sales Yes/Yes Yes/Yes Yes/Yes Yes/Yes
World-class mobile network quality Yes Yes Yes Yes
High 4G population coverage >99%
Except Ice 91% if excl.
national roaming
>99% >99%
Except ‘3’ 91% June
2020
>99%
Commercial 5G 2 of 3 operators
Limited rollout mainly on
lower spectrum bands
as 3.5 GHz not yet fully
auctioned
4 of 4 operators
Limited rollout mainly on
lower spectrum bands
as 3.5 GHz not yet
auctioned
4 of 4 operators
Limited rollout mainly on
lower spectrum bands
as 3.5 GHz not yet fully
auctioned
3 of 3 operators
Large rollout on 3.5 GHz
from all three
Mobile active network sharing No Yes
TT-Netværket between
Telenor & Telia for 2G,
3G, 4G & 5G
Yes
SUNAB between Tele2 &
Telia for 3G; 3GIS
between Telenor & ‘3’
for 3G; Net4Mobility
between Tele2 &
Telenor for 2G, 4G &5G
Yes
Suomen Yhteisverkko
between Telia & DNA for
2G, 3G, 4G & 5G
(Northeast half of
Finland)
Fixed
Medium cable TV homepass ~40% ~65% ~50% ~60%
High fiber share of fixed broadband base 57% 39% 73% 55%
High average Netflix speed [Mbit/s] 4,4
#9 in the world
4,2
#15 in the world
4,3
#11 in the world
4,2
#16 in the world Fixed-mobile convergent offers Light
=combine, get more
Light
=combine, get more
Light
=combine, get more
No
Figure 1. Comparison of some high-level business drivers in Norway, Denmark, Sweden and Finland2 [source: Tefficient]
2 Subscriber and usage figures for Norway, Sweden and Finland are for June 2020, for Denmark for December 2019 as the regulator
there has not yet reported 1H 2020 data
tefficient AB www.tefficient.com 22 December 2020 8
4. Are Norwegian mobile revenues higher?
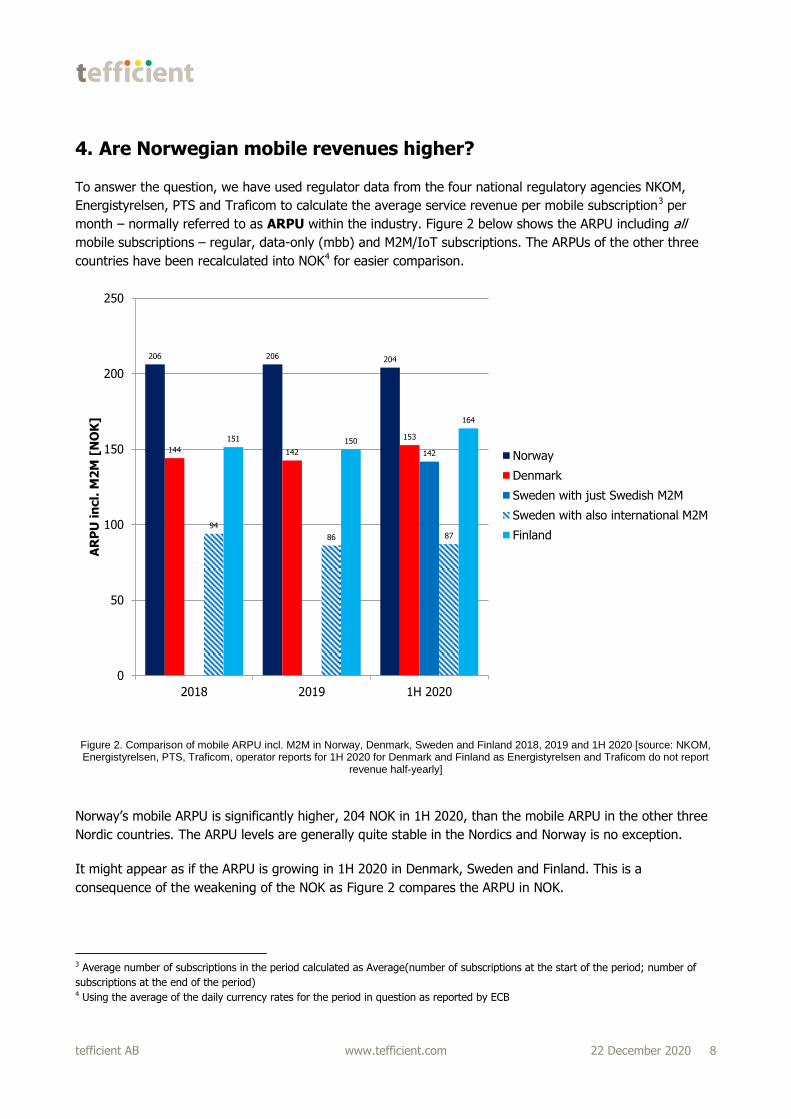
To answer the question, we have used regulator data from the four national regulatory agencies NKOM,
Energistyrelsen, PTS and Traficom to calculate the average service revenue per mobile subscription3 per
month – normally referred to as ARPU within the industry. Figure 2 below shows the ARPU including all
mobile subscriptions – regular, data-only (mbb) and M2M/IoT subscriptions. The ARPUs of the other three
countries have been recalculated into NOK4 for easier comparison.
Figure 2. Comparison of mobile ARPU incl. M2M in Norway, Denmark, Sweden and Finland 2018, 2019 and 1H 2020 [source: NKOM, Energistyrelsen, PTS, Traficom, operator reports for 1H 2020 for Denmark and Finland as Energistyrelsen and Traficom do not report
revenue half-yearly]
Norway’s mobile ARPU is significantly higher, 204 NOK in 1H 2020, than the mobile ARPU in the other three
Nordic countries. The ARPU levels are generally quite stable in the Nordics and Norway is no exception.
It might appear as if the ARPU is growing in 1H 2020 in Denmark, Sweden and Finland. This is a
consequence of the weakening of the NOK as Figure 2 compares the ARPU in NOK.
3 Average number of subscriptions in the period calculated as Average(number of subscriptions at the start of the period; number of
subscriptions at the end of the period) 4 Using the average of the daily currency rates for the period in question as reported by ECB
206 206 204
144 142
153
142
94
86 87
151 150
164
0
50
100
150
200
250
2018 2019 1H 2020
AR
PU
in
cl.
M2
M [
NO
K]
Norway
Denmark
Sweden with just Swedish M2M
Sweden with also international M2M
Finland
tefficient AB www.tefficient.com 22 December 2020 9
Sweden’s ARPU is significantly lower than the other markets when including all M2M SIMs, also the
international. This is explained by a very large number, 15.9 million, of M2M subscriptions being homebased
in Sweden, mainly Telenor Connexion subscriptions. The Swedish regulator has only recently stated to break
out how many of these are actually in Sweden – 3.8 million in June 2020. As that data isn’t available
historically, we can’t calculate the Swedish ARPU for 2018 and 2019, but in 1H 2020 it’s 142 NOK.
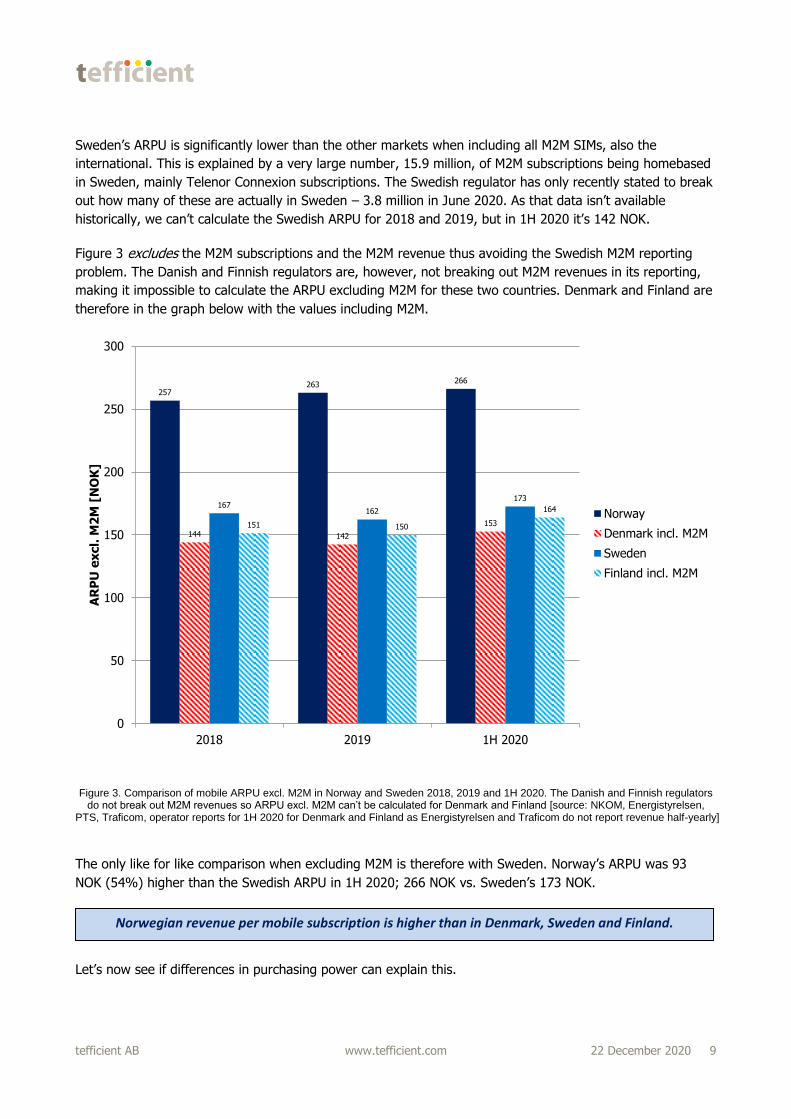
Figure 3 excludes the M2M subscriptions and the M2M revenue thus avoiding the Swedish M2M reporting
problem. The Danish and Finnish regulators are, however, not breaking out M2M revenues in its reporting,
making it impossible to calculate the ARPU excluding M2M for these two countries. Denmark and Finland are
therefore in the graph below with the values including M2M.
Figure 3. Comparison of mobile ARPU excl. M2M in Norway and Sweden 2018, 2019 and 1H 2020. The Danish and Finnish regulators do not break out M2M revenues so ARPU excl. M2M can’t be calculated for Denmark and Finland [source: NKOM, Energistyrelsen,
PTS, Traficom, operator reports for 1H 2020 for Denmark and Finland as Energistyrelsen and Traficom do not report revenue half-yearly]
The only like for like comparison when excluding M2M is therefore with Sweden. Norway’s ARPU was 93
NOK (54%) higher than the Swedish ARPU in 1H 2020; 266 NOK vs. Sweden’s 173 NOK.
Let’s now see if differences in purchasing power can explain this.
257263
266
144 142
153
167162
173
151 150
164
0
50
100
150
200
250
300
2018 2019 1H 2020
AR
PU
ex
cl.
M2
M [
NO
K]
Norway
Denmark incl. M2M
Sweden
Finland incl. M2M
Norwegian revenue per mobile subscription is higher than in Denmark, Sweden and Finland.
tefficient AB www.tefficient.com 22 December 2020 10
5. Is higher purchasing power explaining Norway’s higher ARPU?
Norway has a higher GDP per capita than the other three Nordic countries5. A higher GDP per capita is most
often also an indication of a higher purchasing power, but using the nominal GDP6 per capita differences as
adjustment doesn’t take the differences in price levels into account.
A common way to deal with this is purchasing power parity (PPP) conversion. An introduction to PPP is
given in the box below7.
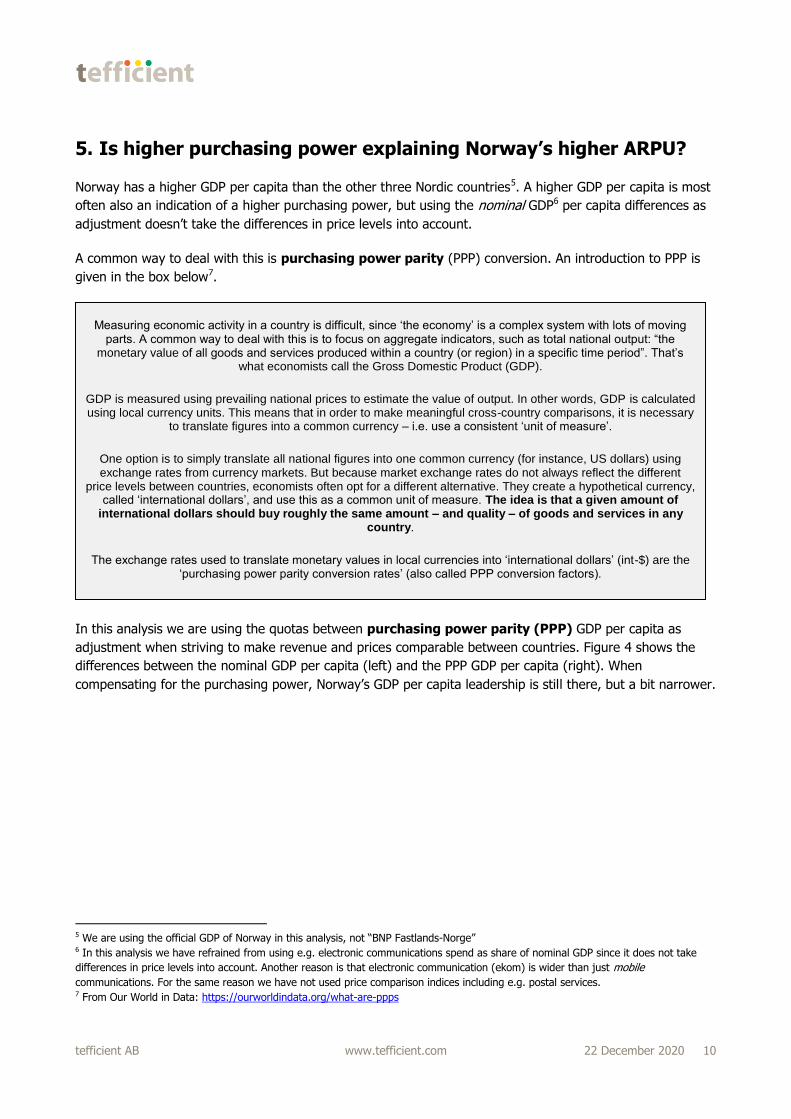
In this analysis we are using the quotas between purchasing power parity (PPP) GDP per capita as
adjustment when striving to make revenue and prices comparable between countries. Figure 4 shows the
differences between the nominal GDP per capita (left) and the PPP GDP per capita (right). When
compensating for the purchasing power, Norway’s GDP per capita leadership is still there, but a bit narrower.
5 We are using the official GDP of Norway in this analysis, not “BNP Fastlands-Norge” 6 In this analysis we have refrained from using e.g. electronic communications spend as share of nominal GDP since it does not take
differences in price levels into account. Another reason is that electronic communication (ekom) is wider than just mobile
communications. For the same reason we have not used price comparison indices including e.g. postal services. 7 From Our World in Data: https://ourworldindata.org/what-are-ppps
Measuring economic activity in a country is difficult, since ‘the economy’ is a complex system with lots of moving parts. A common way to deal with this is to focus on aggregate indicators, such as total national output: “the
monetary value of all goods and services produced within a country (or region) in a specific time period”. That’s what economists call the Gross Domestic Product (GDP).
GDP is measured using prevailing national prices to estimate the value of output. In other words, GDP is calculated using local currency units. This means that in order to make meaningful cross-country comparisons, it is necessary
to translate figures into a common currency – i.e. use a consistent ‘unit of measure’.
One option is to simply translate all national figures into one common currency (for instance, US dollars) using exchange rates from currency markets. But because market exchange rates do not always reflect the different
price levels between countries, economists often opt for a different alternative. They create a hypothetical currency, called ‘international dollars’, and use this as a common unit of measure. The idea is that a given amount of
international dollars should buy roughly the same amount – and quality – of goods and services in any country.
The exchange rates used to translate monetary values in local currencies into ‘international dollars’ (int-$) are the ‘purchasing power parity conversion rates’ (also called PPP conversion factors).
tefficient AB www.tefficient.com 22 December 2020 11
Figure 4. Comparison of GDP per capita (left) and purchase parity adjusted GDP per capita (right) in Norway, Denmark, Sweden and Finland 2019 [source: IMF]
Applying PPP on the mobile revenue and pricing is a modelling attempt to make the levels more comparable
between the countries. Since PPP is calculated on a generic basket of goods and services, it isn’t developed
specifically for mobile revenue and pricing, though. The outcome after PPP adjustments should therefore be
regarded as indicative. You could say that the logic of applying PPP on mobile revenue and pricing is “with
higher general purchasing power, buyers are expected to pay as much more for mobile services as they pay
for goods and services in general”.
With this disclaimer, let’s now apply the differences in PPP on the previously calculated mobile ARPU values.
First including M2M:
66214
59719
55265
50748
0
10000
20000
30000
40000
50000
60000
70000
80000
Norway Denmark Sweden Finland
GD
P p
er
ca
pit
a, 2
01
9 [
cu
rre
nt
US
D]
Current USD
Current international USD, PPP
tefficient AB www.tefficient.com 22 December 2020 12
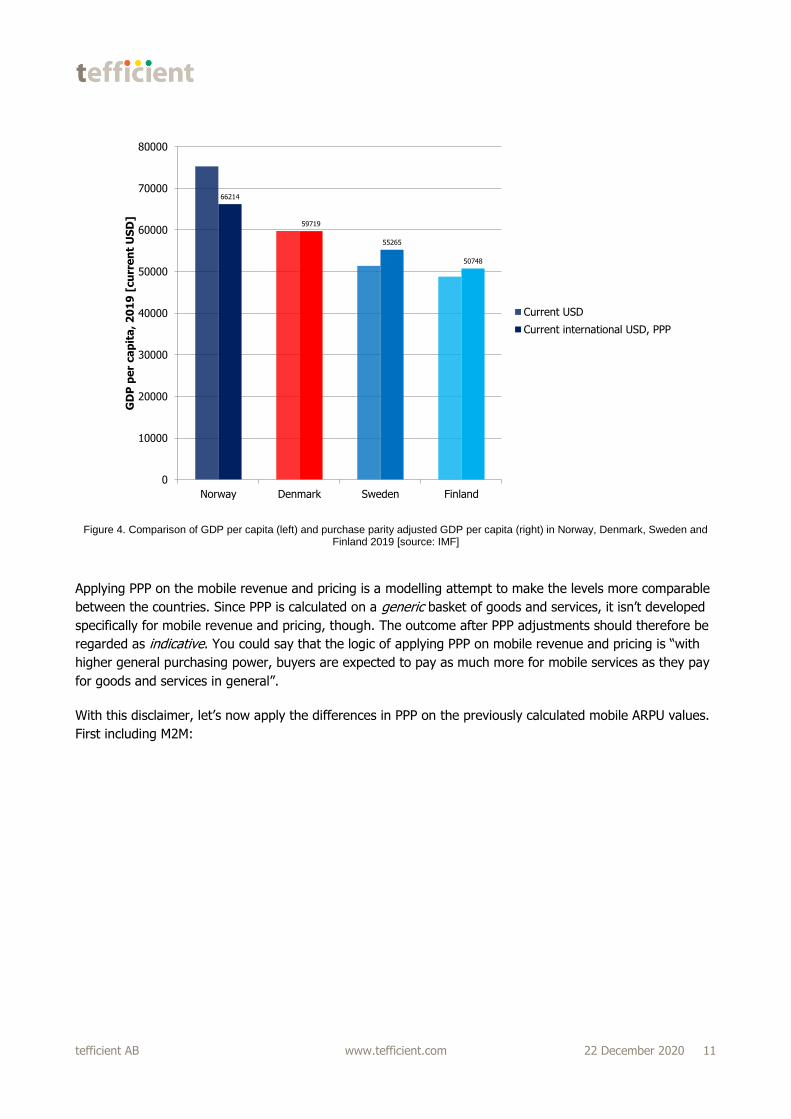
Figure 5. Comparison of PPP mobile ARPU incl. M2M in Norway, Denmark, Sweden and Finland 2018, 2019 and 1H 2020. The PPP values for 2020 are preliminary [source: NKOM, Energistyrelsen, PTS, Traficom, IMF, operator reports for 1H 2020 for Denmark and
Finland as Energistyrelsen and Traficom do not report revenue half-yearly]
Norway’s ARPU levels are the same as in Figure 2 since we adjust the ARPU of the other three markets
upwards to emulate what the ARPU levels in these markets might have been if these markets would have
the same high purchasing power as Norway. The differences in ARPU are now smaller. If Finland would have
had the same purchasing power as Norway, the mobile ARPU might actually be higher than Norway’s8.
Finnish mobile users are however getting much data more for their ARPU; we will compare that in section 10.
In comparison to Denmark and Sweden, Norway’s mobile ARPU is still high – even after having compensated
for differences in purchasing power.
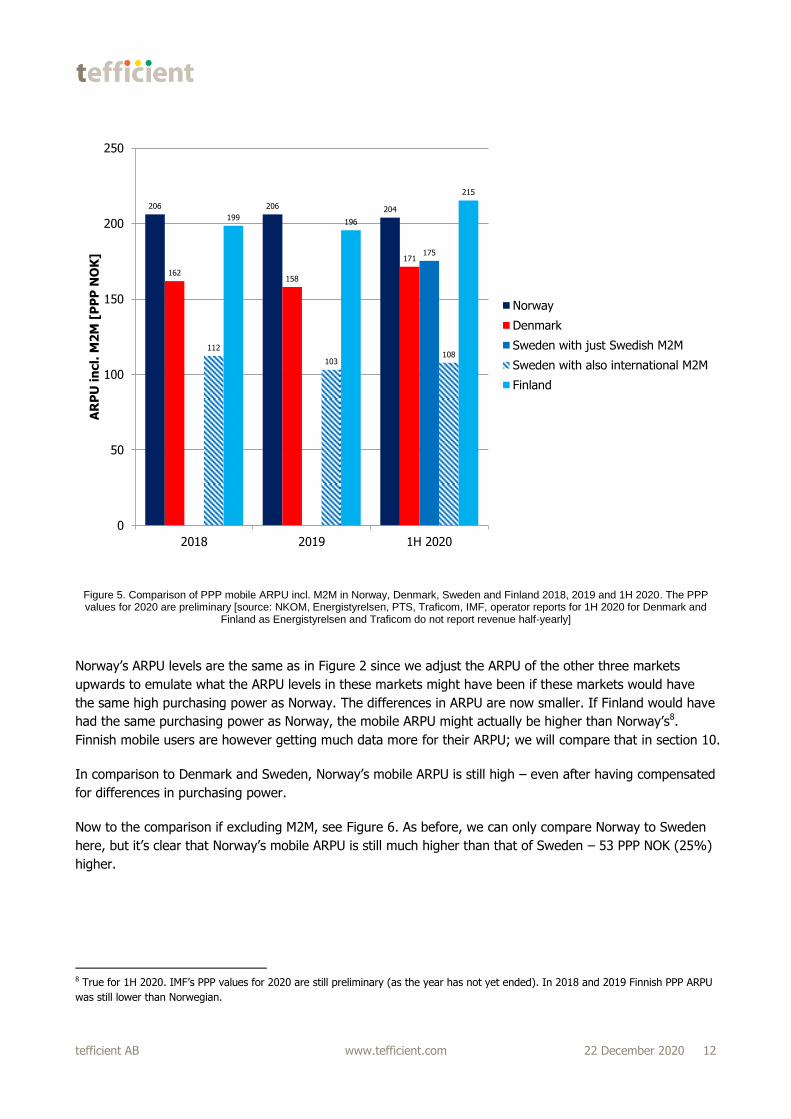
Now to the comparison if excluding M2M, see Figure 6. As before, we can only compare Norway to Sweden
here, but it’s clear that Norway’s mobile ARPU is still much higher than that of Sweden – 53 PPP NOK (25%)
higher.
8 True for 1H 2020. IMF’s PPP values for 2020 are still preliminary (as the year has not yet ended). In 2018 and 2019 Finnish PPP ARPU
was still lower than Norwegian.
206 206 204
162158
171175
112
103108
199196
215
0
50
100
150
200
250
2018 2019 1H 2020
AR
PU
in
cl.
M2
M [
PP
P N
OK
]
Norway
Denmark
Sweden with just Swedish M2M
Sweden with also international M2M
Finland
tefficient AB www.tefficient.com 22 December 2020 13
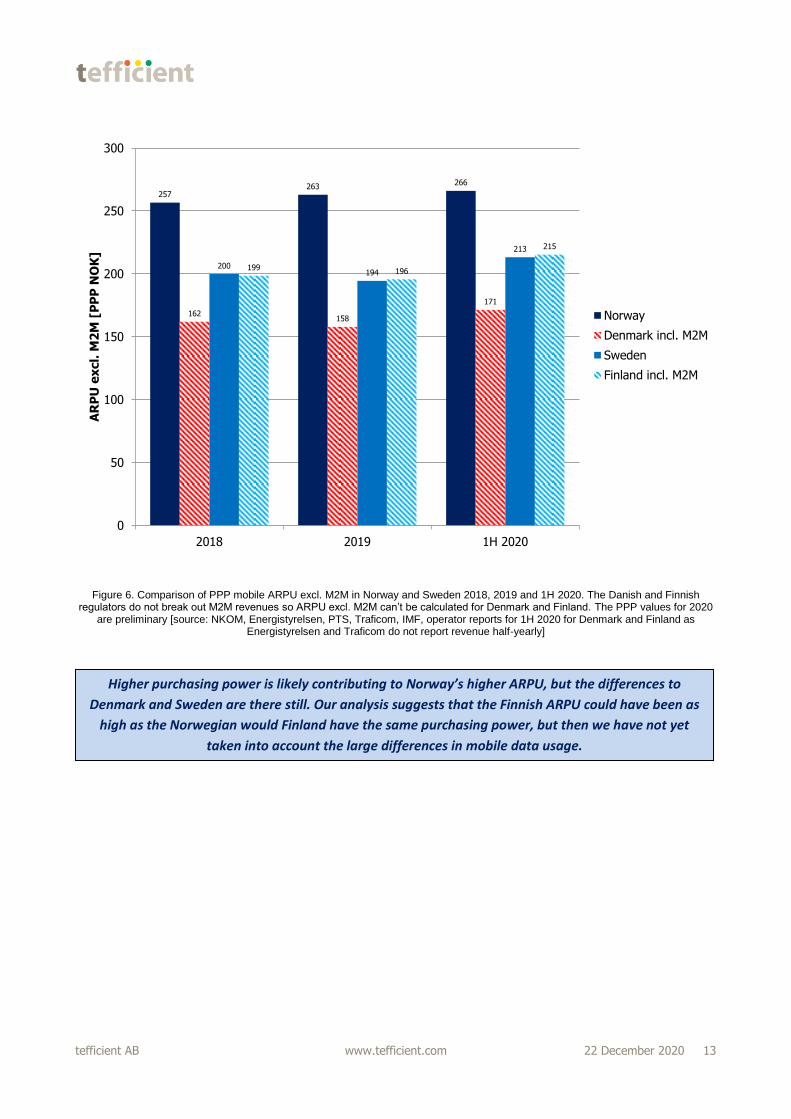
Figure 6. Comparison of PPP mobile ARPU excl. M2M in Norway and Sweden 2018, 2019 and 1H 2020. The Danish and Finnish regulators do not break out M2M revenues so ARPU excl. M2M can’t be calculated for Denmark and Finland. The PPP values for 2020
are preliminary [source: NKOM, Energistyrelsen, PTS, Traficom, IMF, operator reports for 1H 2020 for Denmark and Finland as Energistyrelsen and Traficom do not report revenue half-yearly]
257263
266
162158
171
200194
213
199 196
215
0
50
100
150
200
250
300
2018 2019 1H 2020
AR
PU
ex
cl.
M2
M [
PP
P N
OK
]
Norway
Denmark incl. M2M
Sweden
Finland incl. M2M
Higher purchasing power is likely contributing to Norway’s higher ARPU, but the differences to
Denmark and Sweden are there still. Our analysis suggests that the Finnish ARPU could have been as
high as the Norwegian would Finland have the same purchasing power, but then we have not yet
taken into account the large differences in mobile data usage.

tefficient AB www.tefficient.com 22 December 2020 14
6. Are Norwegian data-rich mobile plans more expensive?
It is relatively straight-forward to compare advertised prices on mobile plans between operators and
between markets, but we would like to warn against concluding solely based on such analysis as it’s not
representative for what mobile customers actually pay. It shows how much mobile customers could pay.
In the Nordics, only about 15-30% of mobile customers actually switch mobile provider during a year. 70-85%
of mobile customers are not. Many of these are subscribing to mobile plans that are different compared to
those that presently are marketed and sold. As there is ongoing price erosion and data bucket inflation in
the Nordics, most customers that are on old plans pay more for their usage than they could have
would they have been on a new plan.
Hence, we favour comparing the revenues derived from mobile users – as we just did when comparing
ARPU – as opposed to comparing price points. But to balance this analysis, we have done an almost
complete9 market scan of the pricing of data-rich (30 GB or more) mobile plans in our four countries.
To differentiate, operators use e.g. different policies, service bundling tactics, inclusive services, family
discounts, youth discounts and fixed-mobile bundling discounts. To make this comparison as like-for-like as
possible, we have applied the following criteria:
Only consumer prices considered – including VAT
Only plans with unlimited voice and messaging and EU roaming considered
Time limited discounts – like first three months for half price – not considered
Age based discounts not considered
Fixed-mobile bundling discounts not considered
Energy-mobile bundling discounts not considered
Family discounts not considered
Binding contracts – for example 24 months – not considered
Premium plans that include content – for example with several streaming services for an additional
fee – not considered
Figure 7 compares a total of 70 data-rich plans across our four markets. The vertical axis shows the
monthly price – recalculated into NOK10. The horisontal axis shows the size of the full speed data bucket.
Plans with an unlimited11 full-speed mobile data allowance are shown at the ∞ symbol.
9 All MNOs are covered if full. The most prominent sub-brands (if any) of each MNO are covered too. Also larger MVNOs that are strong
in data-rich plans are covered. 10 Using the actual exchange rate for the same day, 24 November 2020 11 Unlimited means 1000 GB with most Danish operators and with Ice’s Data Frihet. With most Swedish operators, the user will have to
answer an SMS after having used a certain amount of data in a day (in Telenor’s case e.g. 20 GB) to continue to use data.
tefficient AB www.tefficient.com 22 December 2020 15
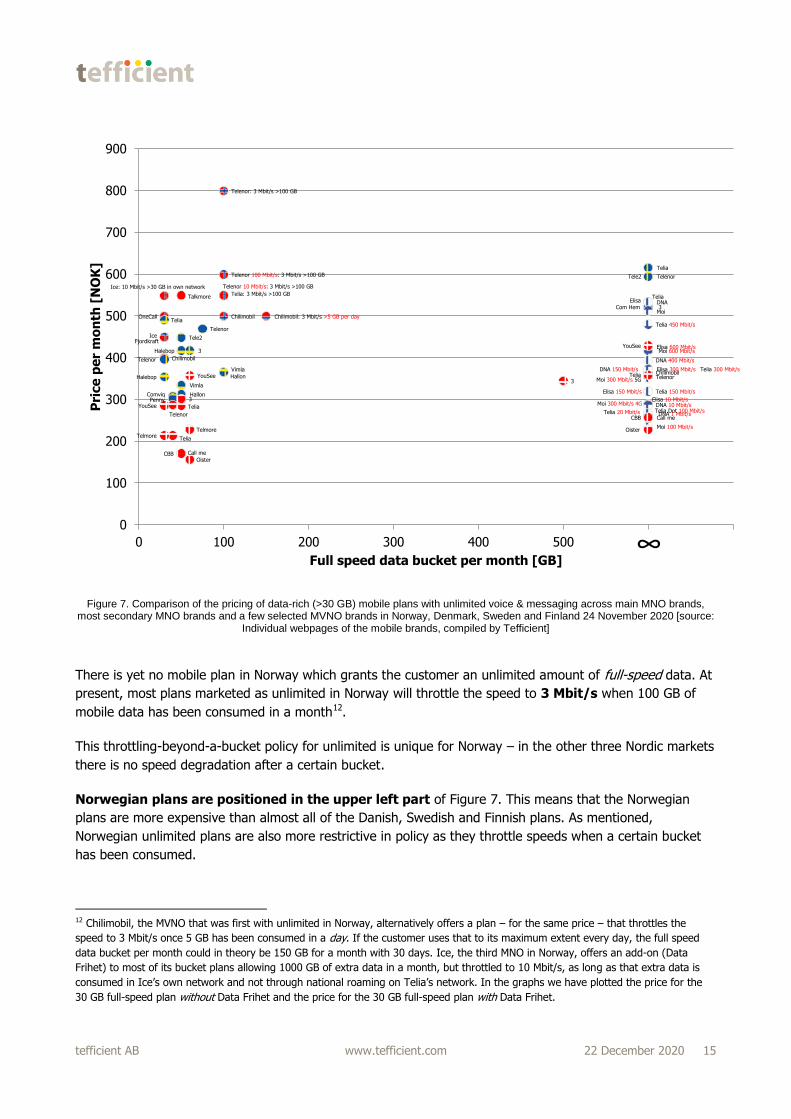
Figure 7. Comparison of the pricing of data-rich (>30 GB) mobile plans with unlimited voice & messaging across main MNO brands, most secondary MNO brands and a few selected MVNO brands in Norway, Denmark, Sweden and Finland 24 November 2020 [source:
Individual webpages of the mobile brands, compiled by Tefficient]
There is yet no mobile plan in Norway which grants the customer an unlimited amount of full-speed data. At
present, most plans marketed as unlimited in Norway will throttle the speed to 3 Mbit/s when 100 GB of
mobile data has been consumed in a month12.
This throttling-beyond-a-bucket policy for unlimited is unique for Norway – in the other three Nordic markets
there is no speed degradation after a certain bucket.
Norwegian plans are positioned in the upper left part of Figure 7. This means that the Norwegian
plans are more expensive than almost all of the Danish, Swedish and Finnish plans. As mentioned,
Norwegian unlimited plans are also more restrictive in policy as they throttle speeds when a certain bucket
has been consumed.
12 Chilimobil, the MVNO that was first with unlimited in Norway, alternatively offers a plan – for the same price – that throttles the
speed to 3 Mbit/s once 5 GB has been consumed in a day. If the customer uses that to its maximum extent every day, the full speed
data bucket per month could in theory be 150 GB for a month with 30 days. Ice, the third MNO in Norway, offers an add-on (Data
Frihet) to most of its bucket plans allowing 1000 GB of extra data in a month, but throttled to 10 Mbit/s, as long as that extra data is
consumed in Ice’s own network and not through national roaming on Telia’s network. In the graphs we have plotted the price for the
30 GB full-speed plan without Data Frihet and the price for the 30 GB full-speed plan with Data Frihet.
Chilimobil Chilimobil: 3 Mbit/s >5 GB per day
Chilimobil
Fjordkraft
Ice: 10 Mbit/s >30 GB in own network Telenor 10 Mbit/s: 3 Mbit/s >100 GB
Telenor: 3 Mbit/s >100 GB
Telenor 100 Mbit/s: 3 Mbit/s >100 GB
Telia: 3 Mbit/s >100 GB
OneCall
Talkmore
Ice
Telia
Telia
Halebop
3
Telenor
Tele2
3
ComviqPenny
Tele2
Telenor
Telenor
Vimla
Vimla
Halebop
Com Hem
Hallon
Hallon
Chilimobil
DNA
Elisa 600 Mbit/s
Elisa 300 Mbit/s
Telia 150 Mbit/s
DNA 10 Mbit/s
Telia 300 Mbit/s
Telia 450 Mbit/s
Telia
Elisa 150 Mbit/s
DNA 1 Mbit/sTelia Dot 100 Mbit/s
Elisa
DNA 400 Mbit/s
DNA 150 Mbit/s
Elisa 10 Mbit/s
Telia 20 Mbit/s
Moi 100 Mbit/s
Moi 300 Mbit/s 4G
Moi 300 Mbit/s 5G
Moi 600 Mbit/s
Moi
YouSee
YouSee
YouSee
Telmore
Telia
Telenor
Telenor
Call me
Call me
Telmore
Telia
Telia
CBB
CBB
3
3
Oister
Oister
0
100
200
300
400
500
600
700
800
900
0 100 200 300 400 500 600 700
Pri
ce
pe
r m
on
th [
NO
K]
Full speed data bucket per month [GB]
∞
tefficient AB www.tefficient.com 22 December 2020 16
Telenor Norway is offering unlimited (throttled to 3 Mbit/s after 100 GB) with three speed tiers: 10 Mbit/s,
100 Mbit/s and full speed. The latter plan is 799 NOK per month – 183 NOK more expensive than the second
most expensive plan in these four countries (Telia Sweden). The plan from Telia Sweden isn’t throttled after
100 GB.
Denmark is generally providing the most affordable data-rich plans in the Nordics – cluttered in the lower
left part of the chart. The cheapest unlimited plan is also Danish – from 3’s Oister brand: 228 NOK.
The chart is also showing that there are no other plans than unlimited in Finland. Finnish mobile customers
always get unlimited data, what they pay for is how fast they want the access to be (at best). A majority of
the unlimited plans with speeds up to 600 Mbit/s are cheaper than all Norwegian plans with 30 GB.
Sweden generally has more expensive plans than Denmark and Finland. This is particularly true for
unlimited plans. There is one exception though – hardly visible in Figure 7 – and that’s Chilimobil Sweden.
Chilimobil is an MVNO on 3’s network in Sweden and offers unlimited for just 349 SEK (365 NOK). Chilimobil
offers unlimited13 in Norway as MVNO on Telia’s network for 499 NOK. Although that is the cheapest
unlimited proposition in Norway, it is still 37% more expensive than in Sweden. This could be an
indication of the differences in mobile wholesale rates between Sweden (where four MNOs are hosting
MVNOs) and Norway (where two MNOs presently are hosting MVNO).
In a similar way as we adjusted the mobile ARPUs for differences in purchasing power, we have redrawn the
pricing comparison in PPP NOK in Figure 8 below. As in the ARPU section, this makes Denmark, Sweden and
Finland close in on Norway.
13 3 Mbit/s after 100 GB per month – or after 5 GB per day (two plan options)
Based on the pricing of current offers – without purchase power adjustment – it is not possible to
conclude that Norwegian data-rich mobile plans are moderately priced. Without adjustment,
Norway’s data-rich plans are more expensive and also, in the case of unlimited, more restricted in
policy.
tefficient AB www.tefficient.com 22 December 2020 17
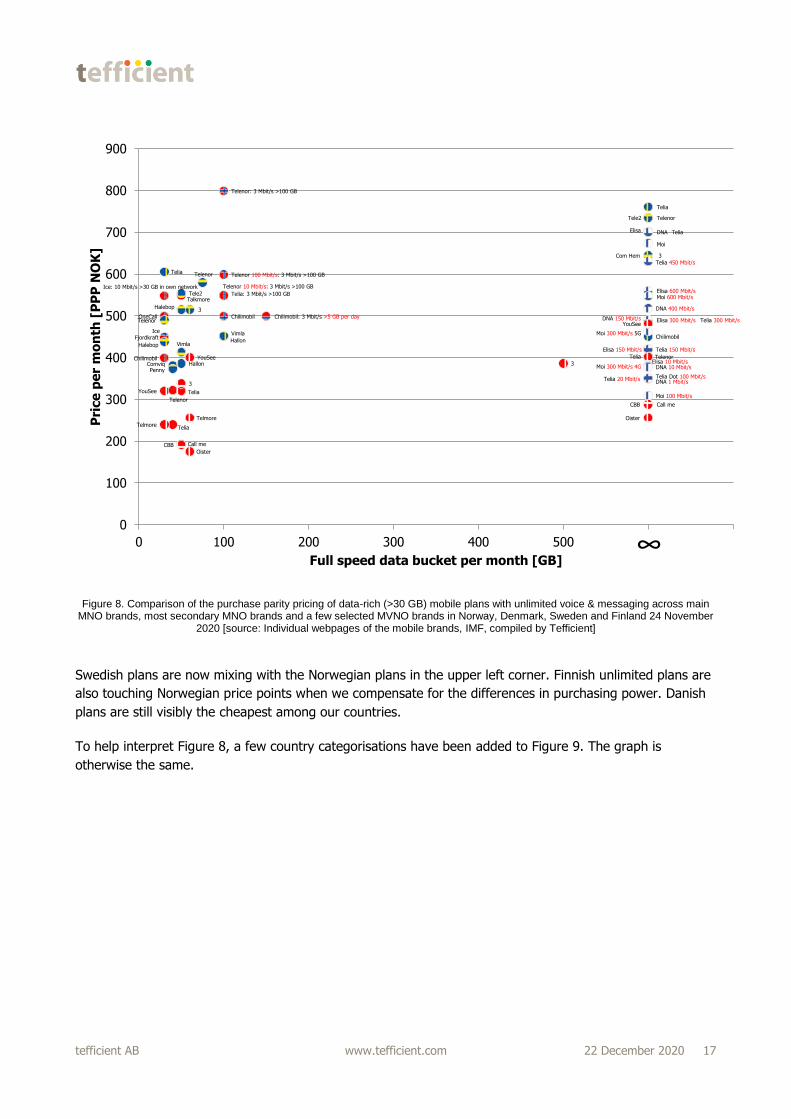
Figure 8. Comparison of the purchase parity pricing of data-rich (>30 GB) mobile plans with unlimited voice & messaging across main MNO brands, most secondary MNO brands and a few selected MVNO brands in Norway, Denmark, Sweden and Finland 24 November
2020 [source: Individual webpages of the mobile brands, IMF, compiled by Tefficient]
Swedish plans are now mixing with the Norwegian plans in the upper left corner. Finnish unlimited plans are
also touching Norwegian price points when we compensate for the differences in purchasing power. Danish
plans are still visibly the cheapest among our countries.
To help interpret Figure 8, a few country categorisations have been added to Figure 9. The graph is
otherwise the same.
Chilimobil Chilimobil: 3 Mbit/s >5 GB per day
Chilimobil
Fjordkraft
Ice: 10 Mbit/s >30 GB in own network Telenor 10 Mbit/s: 3 Mbit/s >100 GB
Telenor: 3 Mbit/s >100 GB
Telenor 100 Mbit/s: 3 Mbit/s >100 GB
Telia: 3 Mbit/s >100 GB
OneCall
Talkmore
Ice
Telia
Telia
Halebop
3
Telenor
Tele2
3
ComviqPenny
Tele2
Telenor
Telenor
Vimla
Vimla
Halebop
Com Hem
Hallon
Hallon
Chilimobil
DNA
Elisa 600 Mbit/s
Elisa 300 Mbit/s
Telia 150 Mbit/s
DNA 10 Mbit/s
Telia 300 Mbit/s
Telia 450 Mbit/s
Telia
Elisa 150 Mbit/s
DNA 1 Mbit/sTelia Dot 100 Mbit/s
Elisa
DNA 400 Mbit/s
DNA 150 Mbit/s
Elisa 10 Mbit/s
Telia 20 Mbit/s
Moi 100 Mbit/s
Moi 300 Mbit/s 4G
Moi 300 Mbit/s 5G
Moi 600 Mbit/s
Moi
YouSee
YouSee
YouSee
Telmore
Telia
Telenor
Telenor
Call me
Call me
Telmore
Telia
Telia
CBB
CBB
3
3
Oister
Oister
0
100
200
300
400
500
600
700
800
900
0 100 200 300 400 500 600 700
Pri
ce
pe
r m
on
th [
PP
P N
OK
]
Full speed data bucket per month [GB]
∞
tefficient AB www.tefficient.com 22 December 2020 18
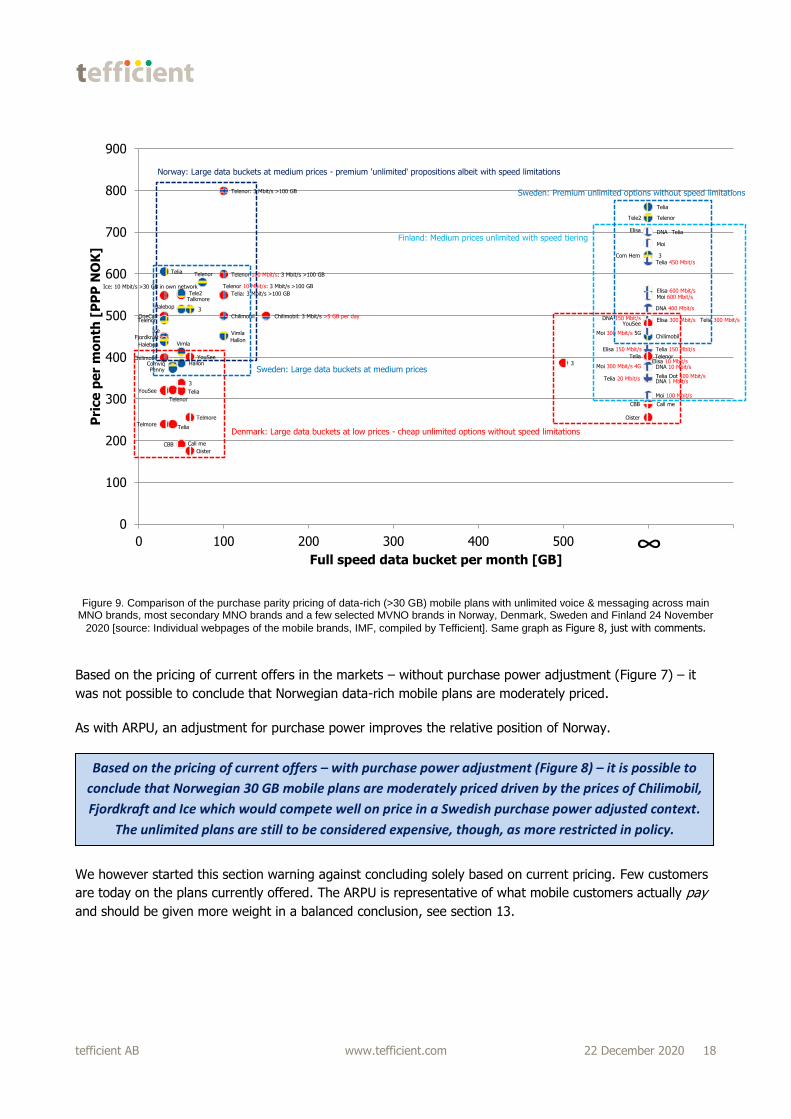
Figure 9. Comparison of the purchase parity pricing of data-rich (>30 GB) mobile plans with unlimited voice & messaging across main MNO brands, most secondary MNO brands and a few selected MVNO brands in Norway, Denmark, Sweden and Finland 24 November
2020 [source: Individual webpages of the mobile brands, IMF, compiled by Tefficient]. Same graph as Figure 8, just with comments.
Based on the pricing of current offers in the markets – without purchase power adjustment (Figure 7) – it
was not possible to conclude that Norwegian data-rich mobile plans are moderately priced.
As with ARPU, an adjustment for purchase power improves the relative position of Norway.
We however started this section warning against concluding solely based on current pricing. Few customers
are today on the plans currently offered. The ARPU is representative of what mobile customers actually pay
and should be given more weight in a balanced conclusion, see section 13.
Chilimobil Chilimobil: 3 Mbit/s >5 GB per day
Chilimobil
Fjordkraft
Ice: 10 Mbit/s >30 GB in own network Telenor 10 Mbit/s: 3 Mbit/s >100 GB
Telenor: 3 Mbit/s >100 GB
Telenor 100 Mbit/s: 3 Mbit/s >100 GB
Telia: 3 Mbit/s >100 GB
OneCall
Talkmore
Ice
Telia
Telia
Halebop
3
Telenor
Tele2
3
ComviqPenny
Tele2
Telenor
Telenor
Vimla
Vimla
Halebop
Com Hem
Hallon
Hallon
Chilimobil
DNA
Elisa 600 Mbit/s
Elisa 300 Mbit/s
Telia 150 Mbit/s
DNA 10 Mbit/s
Telia 300 Mbit/s
Telia 450 Mbit/s
Telia
Elisa 150 Mbit/s
DNA 1 Mbit/sTelia Dot 100 Mbit/s
Elisa
DNA 400 Mbit/s
DNA 150 Mbit/s
Elisa 10 Mbit/s
Telia 20 Mbit/s
Moi 100 Mbit/s
Moi 300 Mbit/s 4G
Moi 300 Mbit/s 5G
Moi 600 Mbit/s
Moi
YouSee
YouSee
YouSee
Telmore
Telia
Telenor
Telenor
Call me
Call me
Telmore
Telia
Telia
CBB
CBB
3
3
Oister
Oister
0
100
200
300
400
500
600
700
800
900
0 100 200 300 400 500 600 700
Pri
ce
pe
r m
on
th [
PP
P N
OK
]
Full speed data bucket per month [GB]
∞
Denmark: Large data buckets at low prices - cheap unlimited options without speed limitations
Sweden: Large data buckets at medium prices
Finland: Medium prices unlimited with speed tiering
Norway: Large data buckets at medium prices - premium 'unlimited' propositions albeit with speed limitations
Sweden: Premium unlimited options without speed limitations
Based on the pricing of current offers – with purchase power adjustment (Figure 8) – it is possible to
conclude that Norwegian 30 GB mobile plans are moderately priced driven by the prices of Chilimobil,
Fjordkraft and Ice which would compete well on price in a Swedish purchase power adjusted context.
The unlimited plans are still to be considered expensive, though, as more restricted in policy.
tefficient AB www.tefficient.com 22 December 2020 19
7. Are topology and population density affecting the number of sites
in mobile networks?
It’s a frequently narrative in Norway that the country’s topology – with mountains and fjords – and
demography with low population density require larger mobile networks. This would, in turn, drive the total
costs – OPEX and CAPEX – of an operator. And in order to be profitable and to compensate for these extra
network costs, mobile revenues need to be higher.
We will strive to test each element in that chain of logic:
a) Norway has more mountains & fjords and lower population density than the other Nordic countries –
but are the mobile networks larger? (tested in this section)
b) Are larger networks driving an operator’s total costs? (tested in section 8)
c) Are higher mobile revenues needed to compensate for these network costs? (tested in section 9)
Starting with a), the number of TETRA (Nødnett in Norway) base stations has been used to exemplify that
topology and population density drive the number of base stations. Tefficient believes that the TETRA
example isn’t representative for mobile networks – of several reasons. TETRA networks are primarily
dimensioned for coverage since the number of users and traffic are low. Mobile networks are carrying much
more traffic. Capacity, not coverage, is therefore since long the primary driver for the inter-site distance of
mobile networks in populated areas. TETRA is also operating on one, low frequency, band whereas mobile
networks operate on many, higher frequency, bands. The use cases and dimensioning criteria are also
totally different between a mission critical emergency network and a public mobile network. The number of
mobile base stations is defined by a multitude of factors where coverage is one – but definitely not the
only one.
Tefficient has combined information from multiple sources – public registers, operator reporting and
Tefficient’s own insight – to calculate the number of mobile network sites14 in Norway, Denmark, Sweden
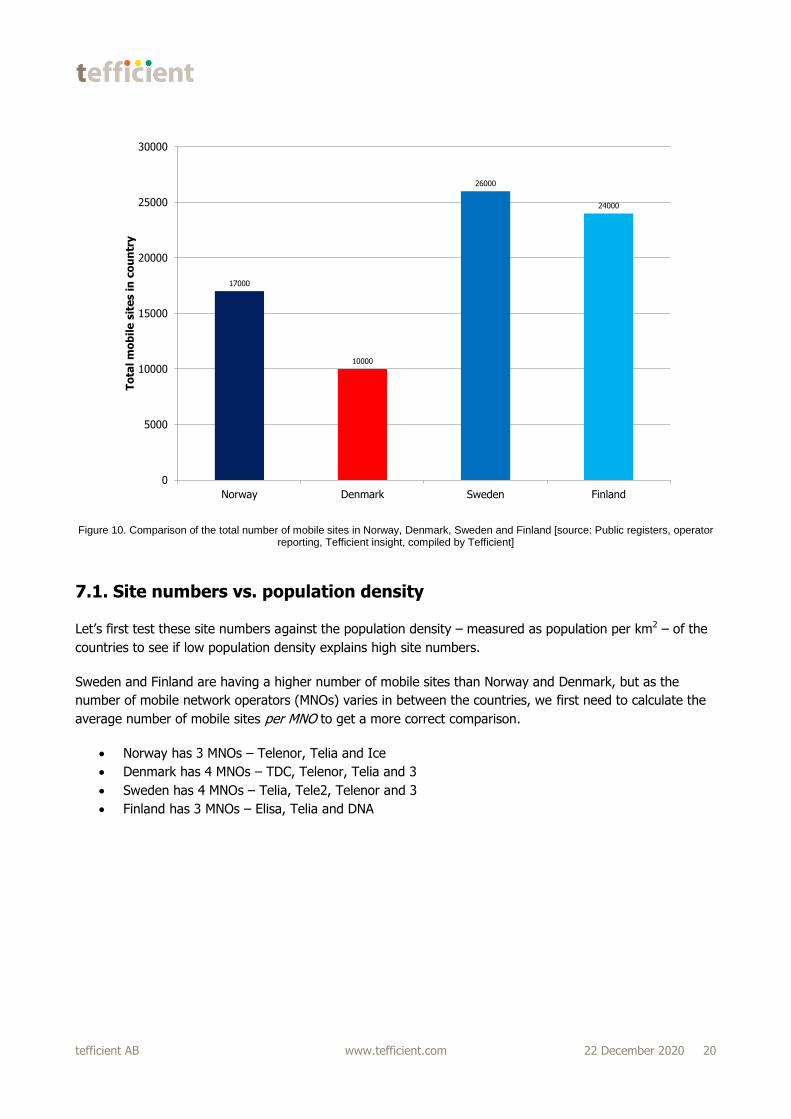
and Finland respectively. The numbers are rounded to the closest 1000, see Figure 10.
14 A site represents one physical address – typically a mast or a rooftop – and can host one or several base stations depending on the
capacity need, systems used (2G, 3G, 4G, 5G) and an operator’s chosen configuration and vendor mix
tefficient AB www.tefficient.com 22 December 2020 20
Figure 10. Comparison of the total number of mobile sites in Norway, Denmark, Sweden and Finland [source: Public registers, operator reporting, Tefficient insight, compiled by Tefficient]
7.1. Site numbers vs. population density
Let’s first test these site numbers against the population density – measured as population per km2 – of the
countries to see if low population density explains high site numbers.
Sweden and Finland are having a higher number of mobile sites than Norway and Denmark, but as the
number of mobile network operators (MNOs) varies in between the countries, we first need to calculate the
average number of mobile sites per MNO to get a more correct comparison.
Norway has 3 MNOs – Telenor, Telia and Ice
Denmark has 4 MNOs – TDC, Telenor, Telia and 3
Sweden has 4 MNOs – Telia, Tele2, Telenor and 3
Finland has 3 MNOs – Elisa, Telia and DNA
17000
10000
26000
24000
0
5000
10000
15000
20000
25000
30000
Norway Denmark Sweden Finland
To
tal m
ob
ile
sit
es i
n c
ou
ntr
y

tefficient AB www.tefficient.com 22 December 2020 21
Figure 11. Comparison of the average number of mobile sites per MNO in Norway, Denmark, Sweden and Finland [source: Public registers, operator reporting, Tefficient insight, compiled by Tefficient] with the population per km
2 [source: Kartverket, World Bank]
It’s obvious from Figure 11 that Denmark’s MNOs can have a low number of sites due to the relative
compact size of the country which results in a high population density. The differences between Norway,
Finland and Sweden are much smaller. Let’s zoom into from Figure 11 so that we only look at these three,
geographically larger, countries.
Norway
Sweden*
Finland*
Denmark*
0
1000
2000
3000
4000
5000
6000
7000
8000
9000
0 20 40 60 80 100 120 140 160
Ave
rag
e m
ob
ile
sit
es p
er
MN
O
Population per km2
*) With network sharing JVs between MNOs, lowering the total site number
tefficient AB www.tefficient.com 22 December 2020 22
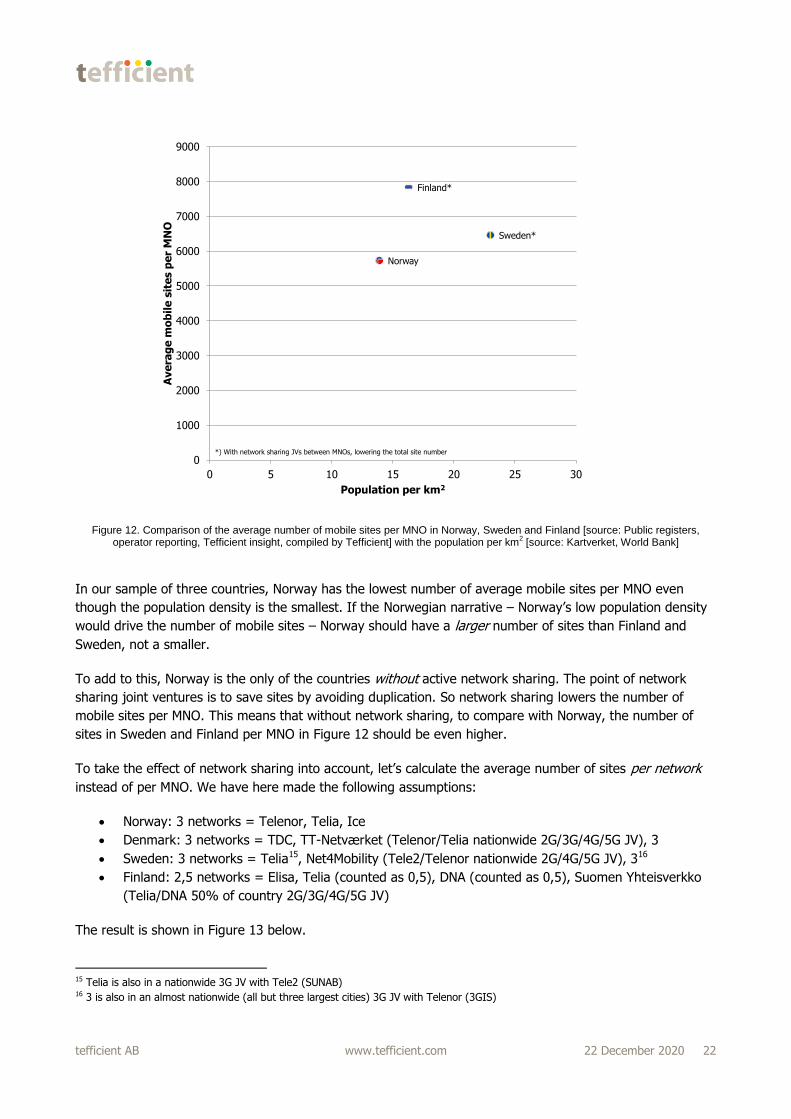
Figure 12. Comparison of the average number of mobile sites per MNO in Norway, Sweden and Finland [source: Public registers, operator reporting, Tefficient insight, compiled by Tefficient] with the population per km
2 [source: Kartverket, World Bank]
In our sample of three countries, Norway has the lowest number of average mobile sites per MNO even
though the population density is the smallest. If the Norwegian narrative – Norway’s low population density
would drive the number of mobile sites – Norway should have a larger number of sites than Finland and
Sweden, not a smaller.
To add to this, Norway is the only of the countries without active network sharing. The point of network
sharing joint ventures is to save sites by avoiding duplication. So network sharing lowers the number of
mobile sites per MNO. This means that without network sharing, to compare with Norway, the number of
sites in Sweden and Finland per MNO in Figure 12 should be even higher.
To take the effect of network sharing into account, let’s calculate the average number of sites per network
instead of per MNO. We have here made the following assumptions:
Norway: 3 networks = Telenor, Telia, Ice
Denmark: 3 networks = TDC, TT-Netværket (Telenor/Telia nationwide 2G/3G/4G/5G JV), 3
Sweden: 3 networks = Telia15, Net4Mobility (Tele2/Telenor nationwide 2G/4G/5G JV), 316
Finland: 2,5 networks = Elisa, Telia (counted as 0,5), DNA (counted as 0,5), Suomen Yhteisverkko
(Telia/DNA 50% of country 2G/3G/4G/5G JV)
The result is shown in Figure 13 below.
15 Telia is also in a nationwide 3G JV with Tele2 (SUNAB) 16 3 is also in an almost nationwide (all but three largest cities) 3G JV with Telenor (3GIS)
Norway
Sweden*
Finland*
0
1000
2000
3000
4000
5000
6000
7000
8000
9000
0 5 10 15 20 25 30
Ave
rag
e m
ob
ile
sit
es p
er
MN
O
Population per km2
*) With network sharing JVs between MNOs, lowering the total site number
tefficient AB www.tefficient.com 22 December 2020 23
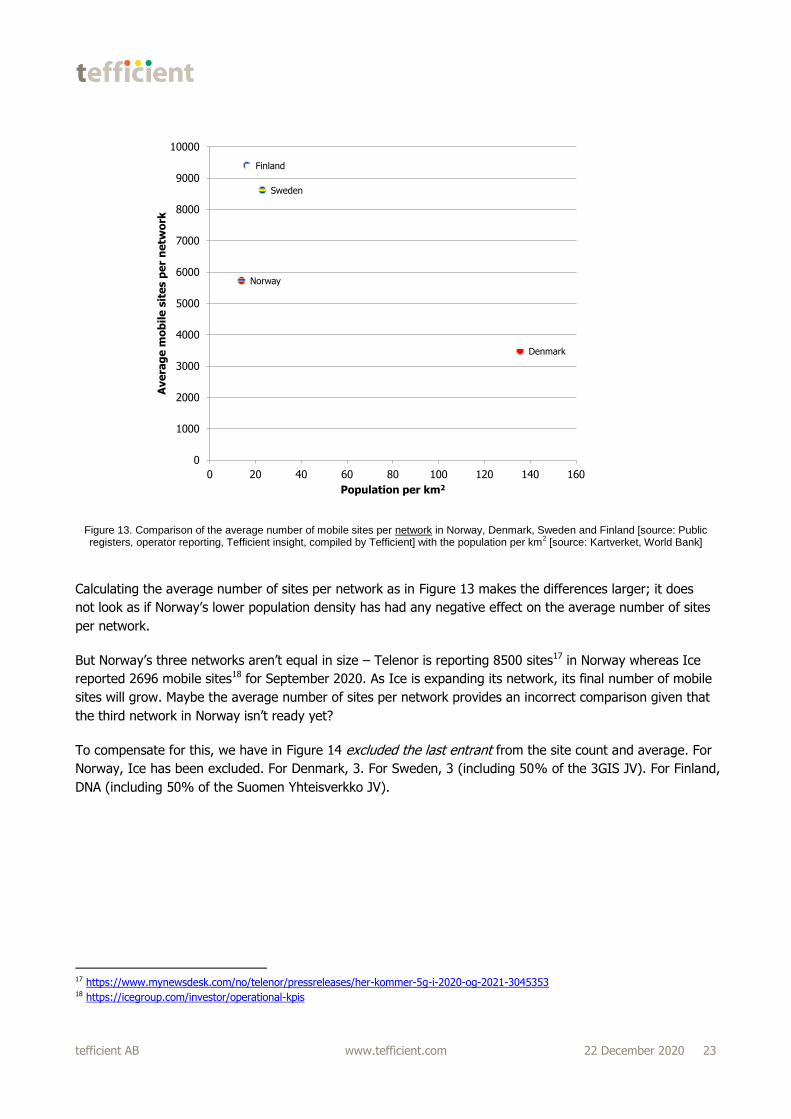
Figure 13. Comparison of the average number of mobile sites per network in Norway, Denmark, Sweden and Finland [source: Public registers, operator reporting, Tefficient insight, compiled by Tefficient] with the population per km
2 [source: Kartverket, World Bank]
Calculating the average number of sites per network as in Figure 13 makes the differences larger; it does
not look as if Norway’s lower population density has had any negative effect on the average number of sites
per network.
But Norway’s three networks aren’t equal in size – Telenor is reporting 8500 sites17 in Norway whereas Ice
reported 2696 mobile sites18 for September 2020. As Ice is expanding its network, its final number of mobile
sites will grow. Maybe the average number of sites per network provides an incorrect comparison given that
the third network in Norway isn’t ready yet?
To compensate for this, we have in Figure 14 excluded the last entrant from the site count and average. For
Norway, Ice has been excluded. For Denmark, 3. For Sweden, 3 (including 50% of the 3GIS JV). For Finland,
DNA (including 50% of the Suomen Yhteisverkko JV).
17 https://www.mynewsdesk.com/no/telenor/pressreleases/her-kommer-5g-i-2020-og-2021-3045353 18 https://icegroup.com/investor/operational-kpis
Norway
Sweden
Finland
Denmark
0
1000
2000
3000
4000
5000
6000
7000
8000
9000
10000
0 20 40 60 80 100 120 140 160
Ave
rag
e m
ob
ile
sit
es p
er
ne
two
rk
Population per km2
tefficient AB www.tefficient.com 22 December 2020 24
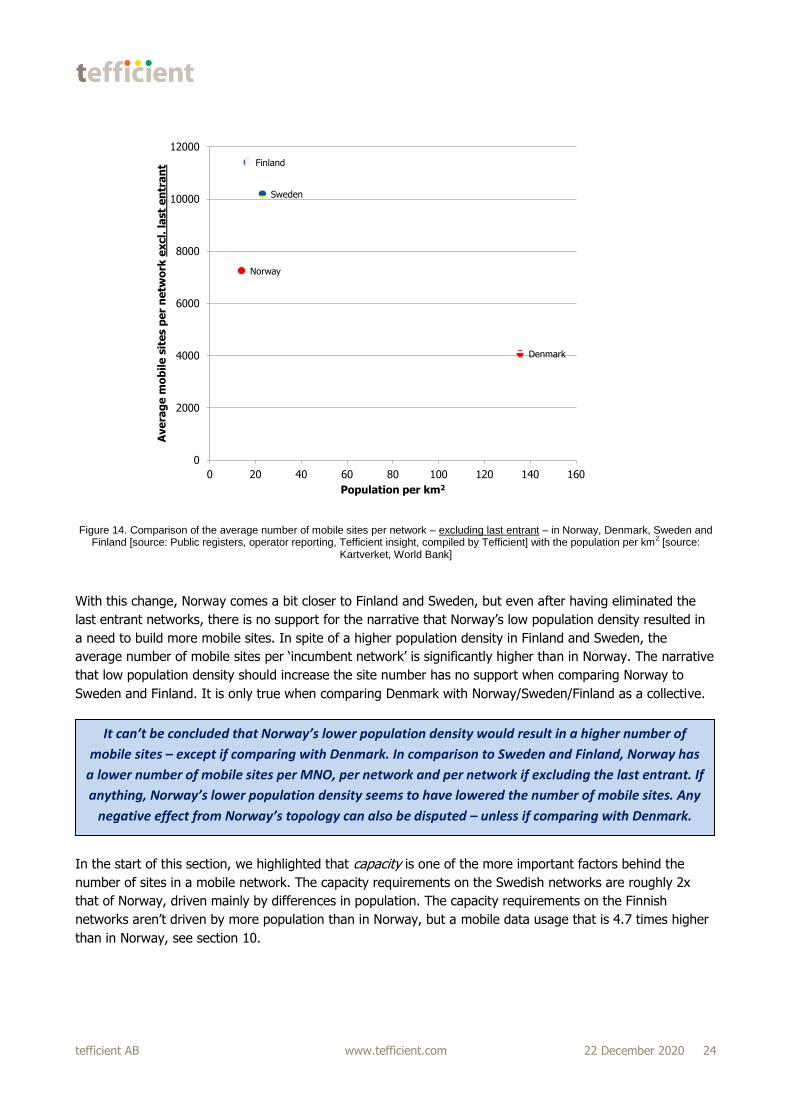
Figure 14. Comparison of the average number of mobile sites per network – excluding last entrant – in Norway, Denmark, Sweden and Finland [source: Public registers, operator reporting, Tefficient insight, compiled by Tefficient] with the population per km
2 [source:
Kartverket, World Bank]
With this change, Norway comes a bit closer to Finland and Sweden, but even after having eliminated the
last entrant networks, there is no support for the narrative that Norway’s low population density resulted in
a need to build more mobile sites. In spite of a higher population density in Finland and Sweden, the
average number of mobile sites per ‘incumbent network’ is significantly higher than in Norway. The narrative
that low population density should increase the site number has no support when comparing Norway to
Sweden and Finland. It is only true when comparing Denmark with Norway/Sweden/Finland as a collective.
In the start of this section, we highlighted that capacity is one of the more important factors behind the
number of sites in a mobile network. The capacity requirements on the Swedish networks are roughly 2x
that of Norway, driven mainly by differences in population. The capacity requirements on the Finnish
networks aren’t driven by more population than in Norway, but a mobile data usage that is 4.7 times higher
than in Norway, see section 10.
Norway
Sweden
Finland
Denmark
0
2000
4000
6000
8000
10000
12000
0 20 40 60 80 100 120 140 160
Ave
rag
e m
ob
ile
sit
es p
er
ne
two
rk e
xcl.
la
st
en
tra
nt
Population per km2
It can’t be concluded that Norway’s lower population density would result in a higher number of
mobile sites – except if comparing with Denmark. In comparison to Sweden and Finland, Norway has
a lower number of mobile sites per MNO, per network and per network if excluding the last entrant. If
anything, Norway’s lower population density seems to have lowered the number of mobile sites. Any
negative effect from Norway’s topology can also be disputed – unless if comparing with Denmark.
tefficient AB www.tefficient.com 22 December 2020 25
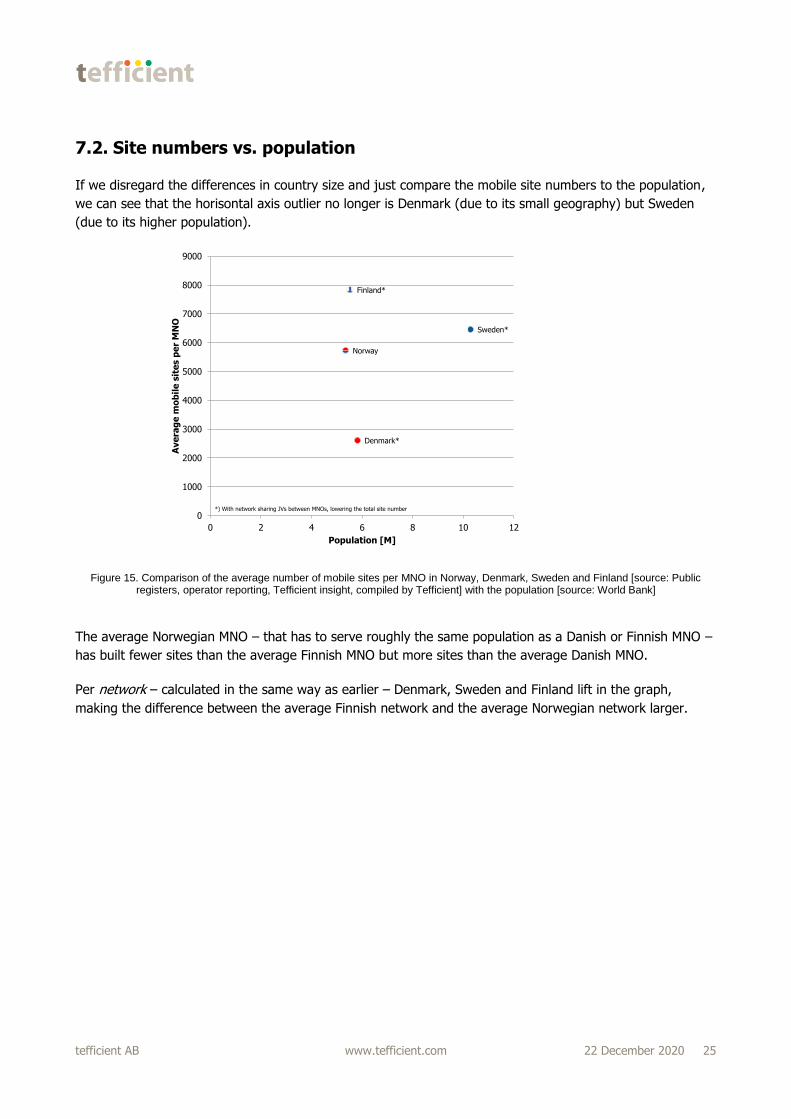
7.2. Site numbers vs. population
If we disregard the differences in country size and just compare the mobile site numbers to the population,
we can see that the horisontal axis outlier no longer is Denmark (due to its small geography) but Sweden
(due to its higher population).
Figure 15. Comparison of the average number of mobile sites per MNO in Norway, Denmark, Sweden and Finland [source: Public registers, operator reporting, Tefficient insight, compiled by Tefficient] with the population [source: World Bank]
The average Norwegian MNO – that has to serve roughly the same population as a Danish or Finnish MNO –
has built fewer sites than the average Finnish MNO but more sites than the average Danish MNO.
Per network – calculated in the same way as earlier – Denmark, Sweden and Finland lift in the graph,
making the difference between the average Finnish network and the average Norwegian network larger.
Norway
Sweden*
Finland*
Denmark*
0
1000
2000
3000
4000
5000
6000
7000
8000
9000
0 2 4 6 8 10 12
Ave
rag
e m
ob
ile
sit
es p
er
MN
O
Population [M]
*) With network sharing JVs between MNOs, lowering the total site number
tefficient AB www.tefficient.com 22 December 2020 26
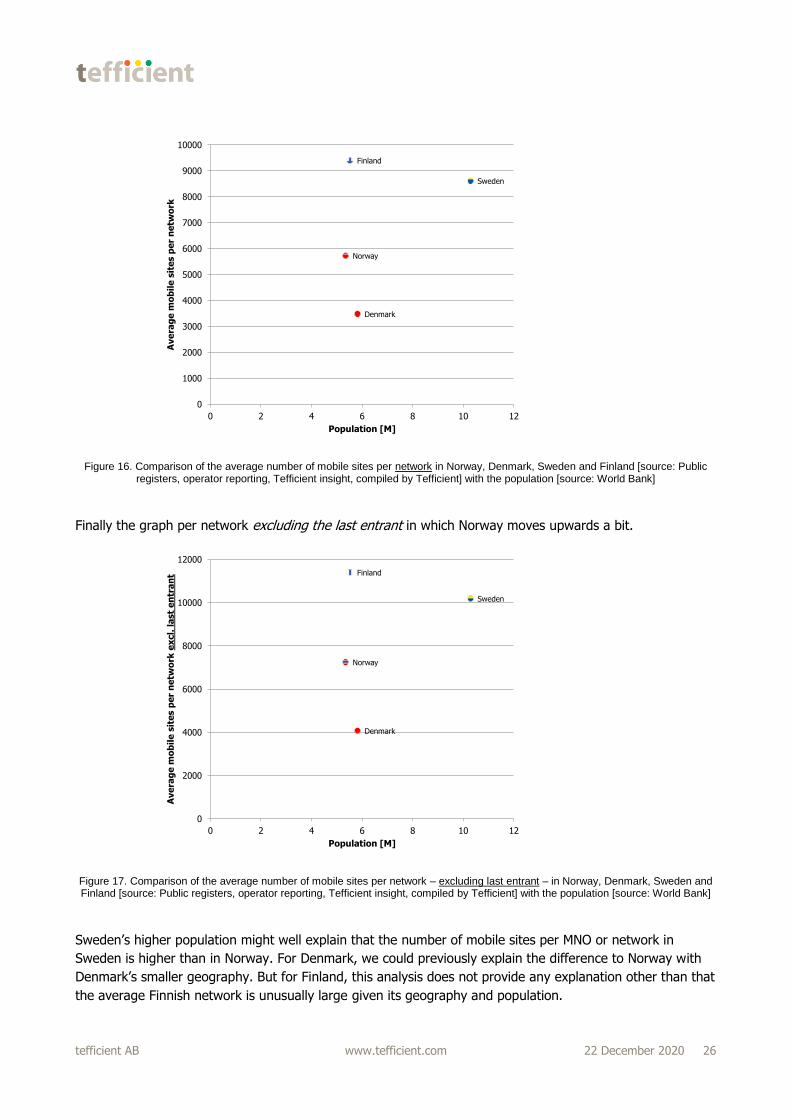
Figure 16. Comparison of the average number of mobile sites per network in Norway, Denmark, Sweden and Finland [source: Public registers, operator reporting, Tefficient insight, compiled by Tefficient] with the population [source: World Bank]
Finally the graph per network excluding the last entrant in which Norway moves upwards a bit.
Figure 17. Comparison of the average number of mobile sites per network – excluding last entrant – in Norway, Denmark, Sweden and Finland [source: Public registers, operator reporting, Tefficient insight, compiled by Tefficient] with the population [source: World Bank]
Sweden’s higher population might well explain that the number of mobile sites per MNO or network in
Sweden is higher than in Norway. For Denmark, we could previously explain the difference to Norway with
Denmark’s smaller geography. But for Finland, this analysis does not provide any explanation other than that
the average Finnish network is unusually large given its geography and population.
Norway
Sweden
Finland
Denmark
0
1000
2000
3000
4000
5000
6000
7000
8000
9000
10000
0 2 4 6 8 10 12
Ave
rag
e m
ob
ile
sit
es p
er
ne
two
rk
Population [M]
Norway
Sweden
Finland
Denmark
0
2000
4000
6000
8000
10000
12000
0 2 4 6 8 10 12
Ave
rag
e m
ob
ile
sit
es p
er
ne
two
rk e
xcl.
la
st
en
tra
nt
Population [M]
tefficient AB www.tefficient.com 22 December 2020 27
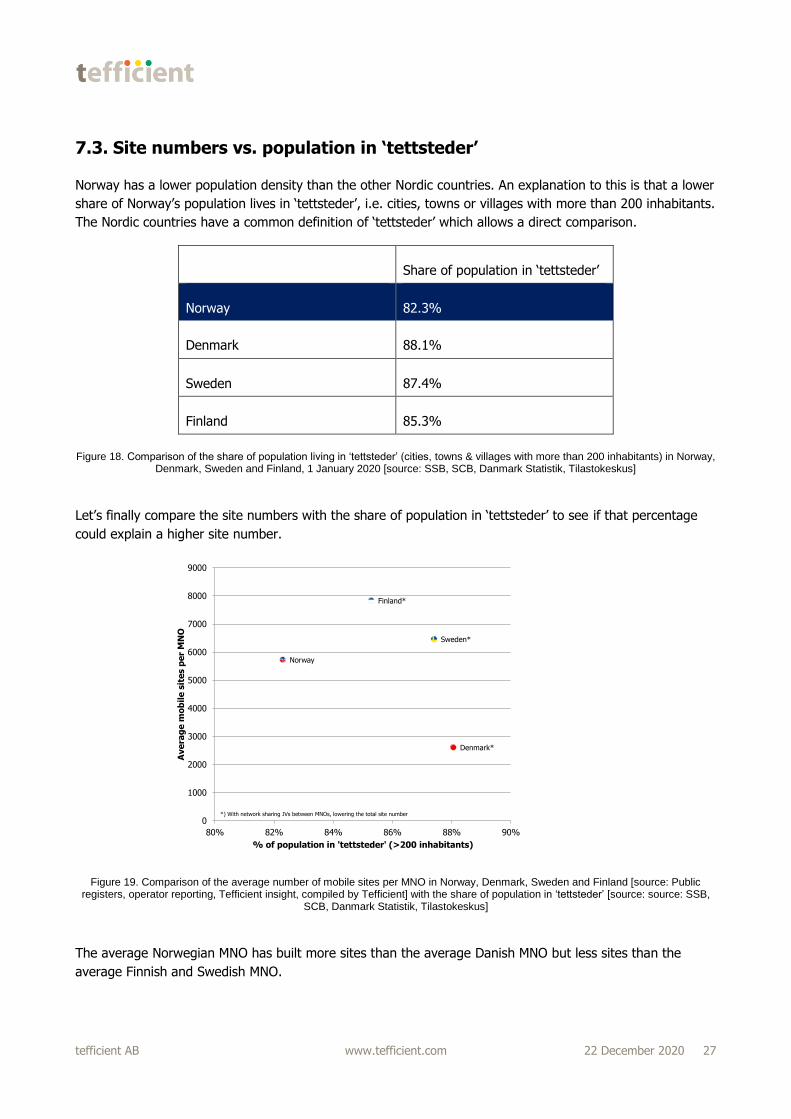
7.3. Site numbers vs. population in ‘tettsteder’
Norway has a lower population density than the other Nordic countries. An explanation to this is that a lower
share of Norway’s population lives in ‘tettsteder’, i.e. cities, towns or villages with more than 200 inhabitants.
The Nordic countries have a common definition of ‘tettsteder’ which allows a direct comparison.
Share of population in ‘tettsteder’
Norway 82.3%
Denmark 88.1%
Sweden 87.4%
Finland 85.3%
Figure 18. Comparison of the share of population living in ‘tettsteder’ (cities, towns & villages with more than 200 inhabitants) in Norway, Denmark, Sweden and Finland, 1 January 2020 [source: SSB, SCB, Danmark Statistik, Tilastokeskus]
Let’s finally compare the site numbers with the share of population in ‘tettsteder’ to see if that percentage
could explain a higher site number.
Figure 19. Comparison of the average number of mobile sites per MNO in Norway, Denmark, Sweden and Finland [source: Public registers, operator reporting, Tefficient insight, compiled by Tefficient] with the share of population in ‘tettsteder’ [source: source: SSB,
SCB, Danmark Statistik, Tilastokeskus]
The average Norwegian MNO has built more sites than the average Danish MNO but less sites than the
average Finnish and Swedish MNO.
Norway
Sweden*
Finland*
Denmark*
0
1000
2000
3000
4000
5000
6000
7000
8000
9000
80% 82% 84% 86% 88% 90%
Ave
rag
e m
ob
ile
sit
es p
er
MN
O
% of population in 'tettsteder' (>200 inhabitants)
*) With network sharing JVs between MNOs, lowering the total site number
tefficient AB www.tefficient.com 22 December 2020 28
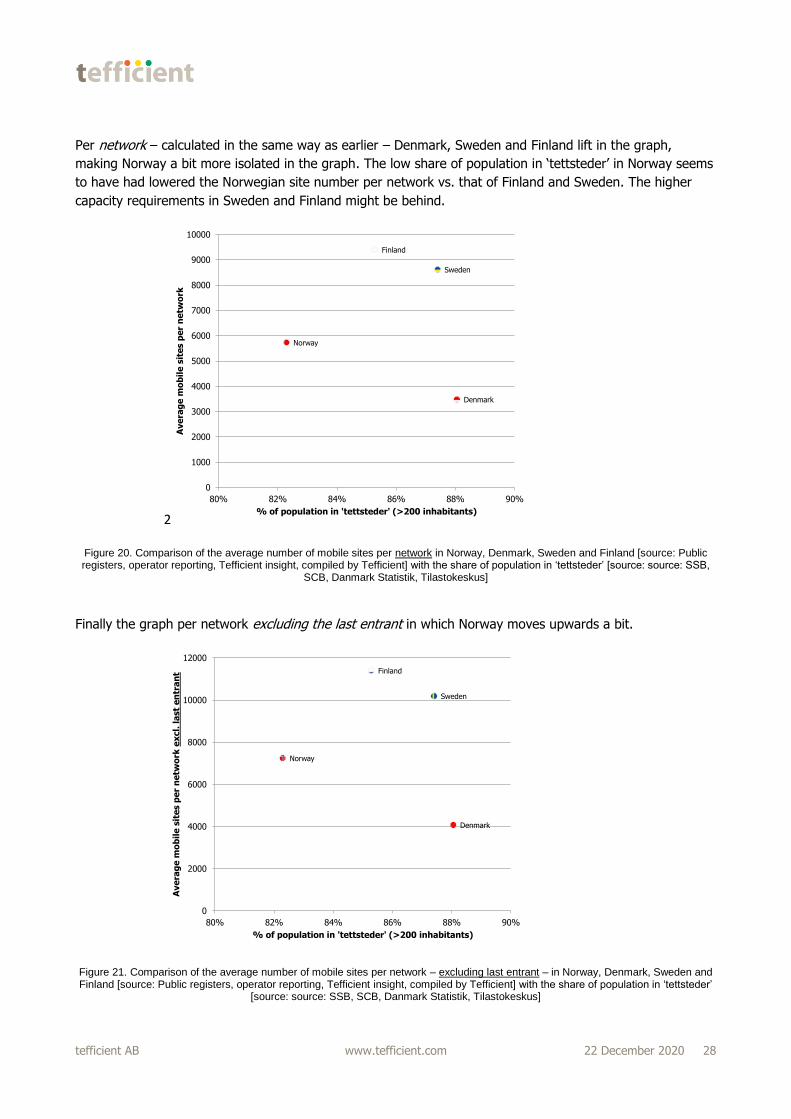
Per network – calculated in the same way as earlier – Denmark, Sweden and Finland lift in the graph,
making Norway a bit more isolated in the graph. The low share of population in ‘tettsteder’ in Norway seems
to have had lowered the Norwegian site number per network vs. that of Finland and Sweden. The higher
capacity requirements in Sweden and Finland might be behind.
2
Figure 20. Comparison of the average number of mobile sites per network in Norway, Denmark, Sweden and Finland [source: Public registers, operator reporting, Tefficient insight, compiled by Tefficient] with the share of population in ‘tettsteder’ [source: source: SSB,
SCB, Danmark Statistik, Tilastokeskus]
Finally the graph per network excluding the last entrant in which Norway moves upwards a bit.
Figure 21. Comparison of the average number of mobile sites per network – excluding last entrant – in Norway, Denmark, Sweden and Finland [source: Public registers, operator reporting, Tefficient insight, compiled by Tefficient] with the share of population in ‘tettsteder’
[source: source: SSB, SCB, Danmark Statistik, Tilastokeskus]
Norway
Sweden
Finland
Denmark
0
1000
2000
3000
4000
5000
6000
7000
8000
9000
10000
80% 82% 84% 86% 88% 90%
Ave
rag
e m
ob
ile
sit
es p
er
ne
two
rk
% of population in 'tettsteder' (>200 inhabitants)
Norway
Sweden
Finland
Denmark
0
2000
4000
6000
8000
10000
12000
80% 82% 84% 86% 88% 90%
Ave
rag
e m
ob
ile
sit
es p
er
ne
two
rk e
xcl.
la
st
en
tra
nt
% of population in 'tettsteder' (>200 inhabitants)
tefficient AB www.tefficient.com 22 December 2020 29
Sweden’s higher population – to a higher extent living in ‘tettsteder’ – might well explain that the number of
mobile sites per MNO or network in Sweden is higher than in Norway. For Denmark, we could previously
explain the difference to Norway with Denmark’s smaller geography. But for Finland, this analysis does not
provide any explanation other than that the average Finnish network is unusually large given its geography,
population and share of population living in ‘tettsteder’.
tefficient AB www.tefficient.com 22 December 2020 30
8. Are larger networks driving an operator’s total costs?
By comparing the total mobile site numbers between Norway, Sweden and Finland we have not been able to
prove that Norway’s mobile networks are larger than Swedish or Finnish networks.
Referring to our point b) from the previous section, Tefficient would anyhow like to test the notion that
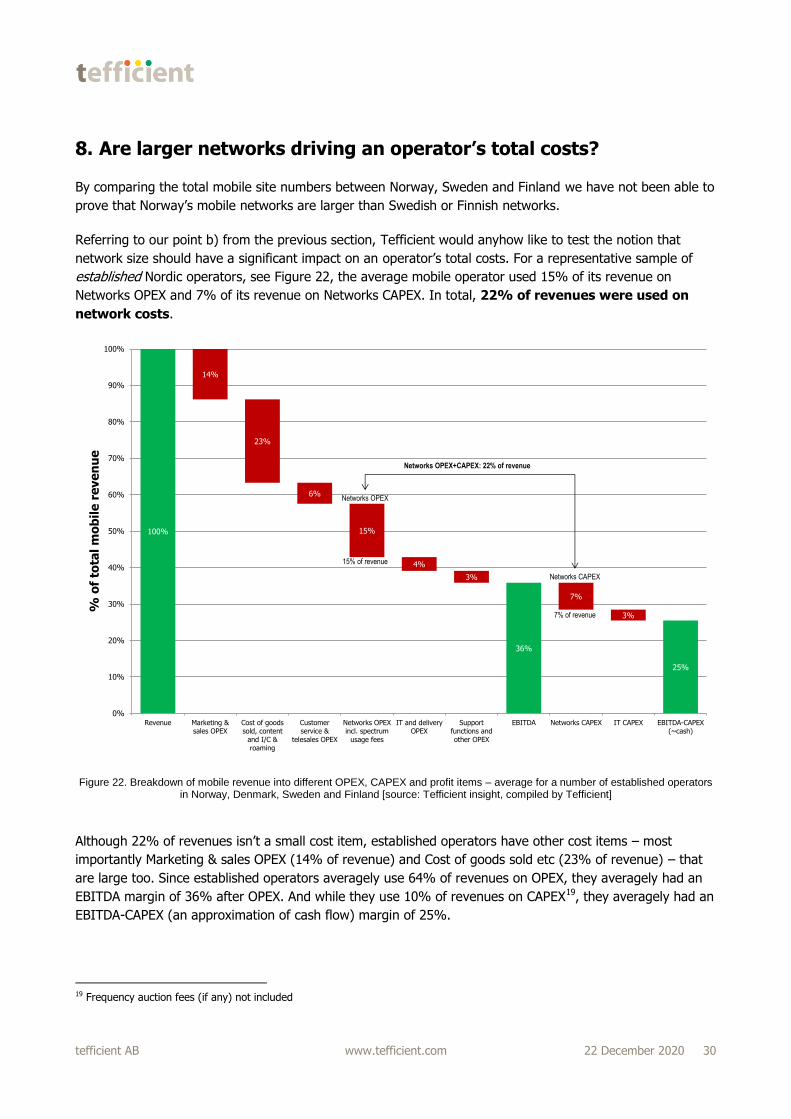
network size should have a significant impact on an operator’s total costs. For a representative sample of
established Nordic operators, see Figure 22, the average mobile operator used 15% of its revenue on
Networks OPEX and 7% of its revenue on Networks CAPEX. In total, 22% of revenues were used on
network costs.
Figure 22. Breakdown of mobile revenue into different OPEX, CAPEX and profit items – average for a number of established operators in Norway, Denmark, Sweden and Finland [source: Tefficient insight, compiled by Tefficient]
Although 22% of revenues isn’t a small cost item, established operators have other cost items – most
importantly Marketing & sales OPEX (14% of revenue) and Cost of goods sold etc (23% of revenue) – that
are large too. Since established operators averagely use 64% of revenues on OPEX, they averagely had an
EBITDA margin of 36% after OPEX. And while they use 10% of revenues on CAPEX19, they averagely had an
EBITDA-CAPEX (an approximation of cash flow) margin of 25%.
19 Frequency auction fees (if any) not included
100%
14%
23%
6%
15%
4%
3%
36%
7%
3%
25%
0%
10%
20%
30%
40%
50%
60%
70%
80%
90%
100%
Revenue Marketing &sales OPEX
Cost of goodssold, content
and I/C &roaming
Customerservice &
telesales OPEX
Networks OPEXincl. spectrum
usage fees
IT and deliveryOPEX
Supportfunctions andother OPEX
EBITDA Networks CAPEX IT CAPEX EBITDA-CAPEX(~cash)
% o
f to
tal m
ob
ile
re
ve
nu
e
Networks OPEX
15% of revenue
Networks CAPEX
7% of revenue
Networks OPEX+CAPEX: 22% of revenue
tefficient AB www.tefficient.com 22 December 2020 31
Whether or not a mobile operator has a few hundred mobile sites more or less doesn’t make any visible
difference to their cost distribution. Most of the revenues aren’t going to the networks; they go to other
costs (and to profit).
But what if Norwegian mobile sites are much more expensive to build? Sometimes Norwegian operators
have to pull cables for tens of kilometres to serve one rural base station with power and transmission. They
might have to build a dedicated road to it – or lift in the equipment with a helicopter and use snowmobiles
when servicing it. These anecdotes are impressive and operators deserve to be praised for walking the extra
mile, but it’s important to know that every operator in every rural Nordic country have similar rural sites
where costs to build and serve are truly over the top. But in the full picture, these sites are exceptions. An
absolute majority of sites in all mobile networks are totally uncomplicated standard type of masts and roof
tops. Although a Nordic operator might have a few tens truly unique and difficult rural sites, they drown in
the uncomplicated mass deployment of thousands of sites.
In Tefficient’s experience, the average mobile site is not more complicated to build and maintain in Norway
than in Sweden and Finland. Denmark, lacking the sizeable rural areas of Norway, Sweden and Finland, has
a slight benefit, but as a vast majority of mobile sites are totally uncomplicated in all countries, the
differences shouldn’t be exaggerated.
To add to it, a site is not only a cost item for a mobile operator – it is also a source of revenue.
Tefficient’s insight from established Nordic operators is that the site rental income per owned site averagely
is about 120,000 NOK per year. This revenue comes from the rent competitors or other networks pay for
being granted a right to install and operate base station equipment and antennas on the site and in the mast.
Operators that are first to establish a site in a previously uncovered area can often expect to have one or
several tenants.
The Spanish infrastructure company Cellnex Telecom recently (12 November 2020) acquired all the mobile
sites of CK Hutchison in Europe20. The operator of the ‘3’ brand, CK Hutchison, sold a total of 24,600 sites in
Italy, the UK, Ireland, Austria, Sweden and Denmark. 4,050 of these sites are today in Sweden and Denmark
– two of our four Nordic peer group markets.
The total acquisition price for the 24,600 sites was 10 billion EUR, meaning that the average European site –
among them Swedish and Danish sites – was acquired for 407,000 EUR or 4.2 million NOK. This
transaction is an example of how highly valued mobile sites actually are by investors. Cellnex’s business
model is to rent the acquired assets, the mobile sites, back to CK Hutchison – but also to find other tenants.
The expectation is of course that the company will be profitable in doing so. The business model is well
tested in e.g. the US, Latin American and APAC markets where companies such as American Tower
Corporation operate more than 170,000 sites with good profit21.
20 https://www.cellnextelecom.com/en/cellnex-to-add-c-30000-telecommunication-european-sites-from-ck-hutchison-to-its-portfolio/ 21 https://www.americantower.com/investor-relations/earnings-materials/
The notion that network size should have a significant impact on an established operator’s total costs
is exaggerating reality. A representative sample of established Nordic operators averagely used 22%
of revenues on Networks OPEX and CAPEX. 78% of revenues were used on other cost items and on
profit. Adding a few hundred sites to a mobile network doesn’t change these cost fundamentals.
tefficient AB www.tefficient.com 22 December 2020 32
Another indication of the asset values associated with mobile sites is that some operators in Europe are in
the process of spinning off their site assets in separate companies – like Vodafone did with Vantage Towers
in June 202022. Telenor has recently gathered its infrastructure in a separate company, Telenor Infra. Some
have speculated in that this is a preparation for a later spin-off23.
22 https://www.vodafone.com/news-and-media/vodafone-group-releases/news/vantage-towers 23 https://e24.no/teknologi/i/XgB84m/telenor-norge-splittes-opp-flytter-mobilmastene-over-i-nytt-selskap
A mobile network with many owned sites represents a revenue opportunity for the operator. The
mobile sites are seen as assets by infrastructure companies and some operators in Europe are
currently in the process of selling their site assets – or spinning off their sites in a separate company.
tefficient AB www.tefficient.com 22 December 2020 33
9. Are higher mobile revenues needed to compensate for these
network costs?
Now to the final c) element in the chain of logic: Are higher mobile revenues needed to compensate for
these network costs?
The conclusion of the previous section might have given you an idea of this already, but let’s use the
operator reported EBITDA and CAPEX figures to compare the EBITDA margins and EBITDA-CAPEX margins
between operators in Norway, Denmark, Sweden and Finland.
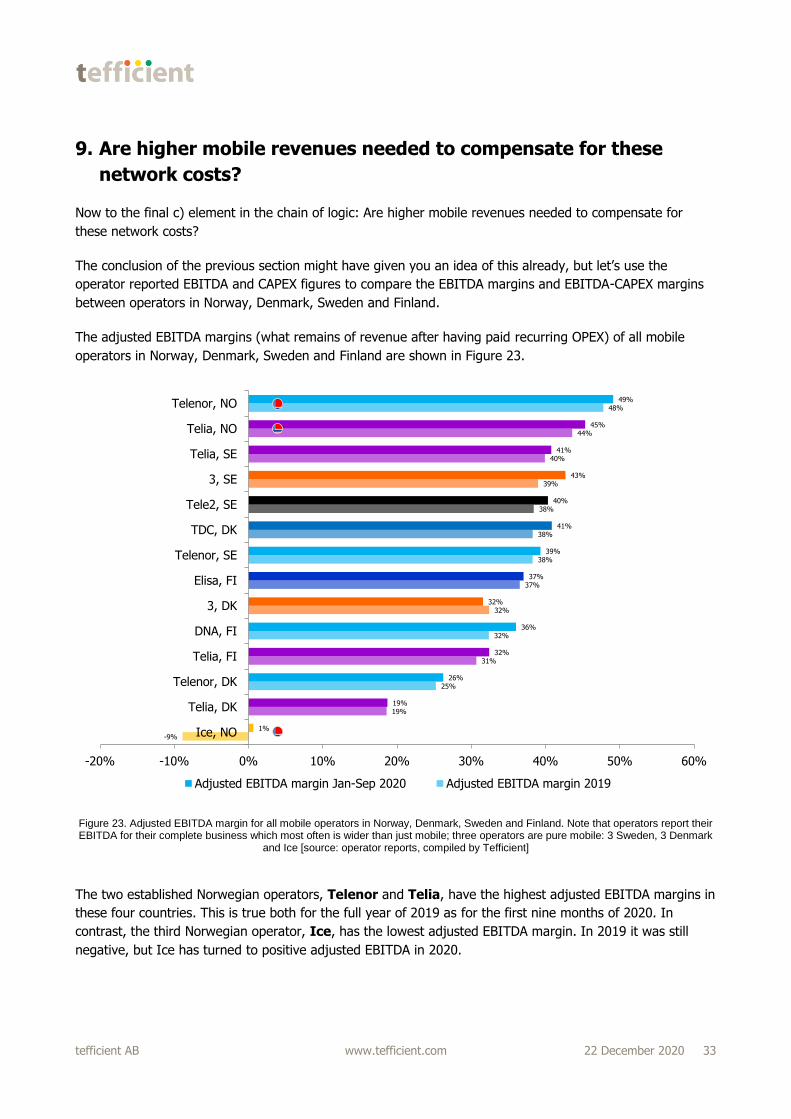
The adjusted EBITDA margins (what remains of revenue after having paid recurring OPEX) of all mobile
operators in Norway, Denmark, Sweden and Finland are shown in Figure 23.
Figure 23. Adjusted EBITDA margin for all mobile operators in Norway, Denmark, Sweden and Finland. Note that operators report their EBITDA for their complete business which most often is wider than just mobile; three operators are pure mobile: 3 Sweden, 3 Denmark
and Ice [source: operator reports, compiled by Tefficient]
The two established Norwegian operators, Telenor and Telia, have the highest adjusted EBITDA margins in
these four countries. This is true both for the full year of 2019 as for the first nine months of 2020. In
contrast, the third Norwegian operator, Ice, has the lowest adjusted EBITDA margin. In 2019 it was still
negative, but Ice has turned to positive adjusted EBITDA in 2020.
-9%
19%
25%
31%
32%
32%
37%
38%
38%
38%
39%
40%
44%
48%
1%
19%
26%
32%
36%
32%
37%
39%
41%
40%
43%
41%
45%
49%
-20% -10% 0% 10% 20% 30% 40% 50% 60%
Ice, NO
Telia, DK
Telenor, DK
Telia, FI
DNA, FI
3, DK
Elisa, FI
Telenor, SE
TDC, DK
Tele2, SE
3, SE
Telia, SE
Telia, NO
Telenor, NO
Adjusted EBITDA margin Jan-Sep 2020 Adjusted EBITDA margin 2019
tefficient AB www.tefficient.com 22 December 2020 34
That Telenor and Telia Norway have the strongest adjusted EBITDA margins is an indication of 1) that their
revenue is unusually high, or, 2) that their OPEX is unusually low, or, 3) both. Ice’s position is a result of
weaker revenue per customer (ARPU) and higher OPEX. In the first nine months of 2020, Ice’s national
roaming costs24 represented 23% of Ice’s total revenue25. The new national roaming agreement Ice made
with Telia following the new Market-15 regulation from NKOM will lower that costs item significantly for Ice
starting January 2021.
Concluding on Figure 23, it is very unlikely that Telenor or Telia could have a Networks OPEX issue of a
magnitude that would dominate their total OPEX – if they had, their adjusted EBITDA margins wouldn’t be
best in class.
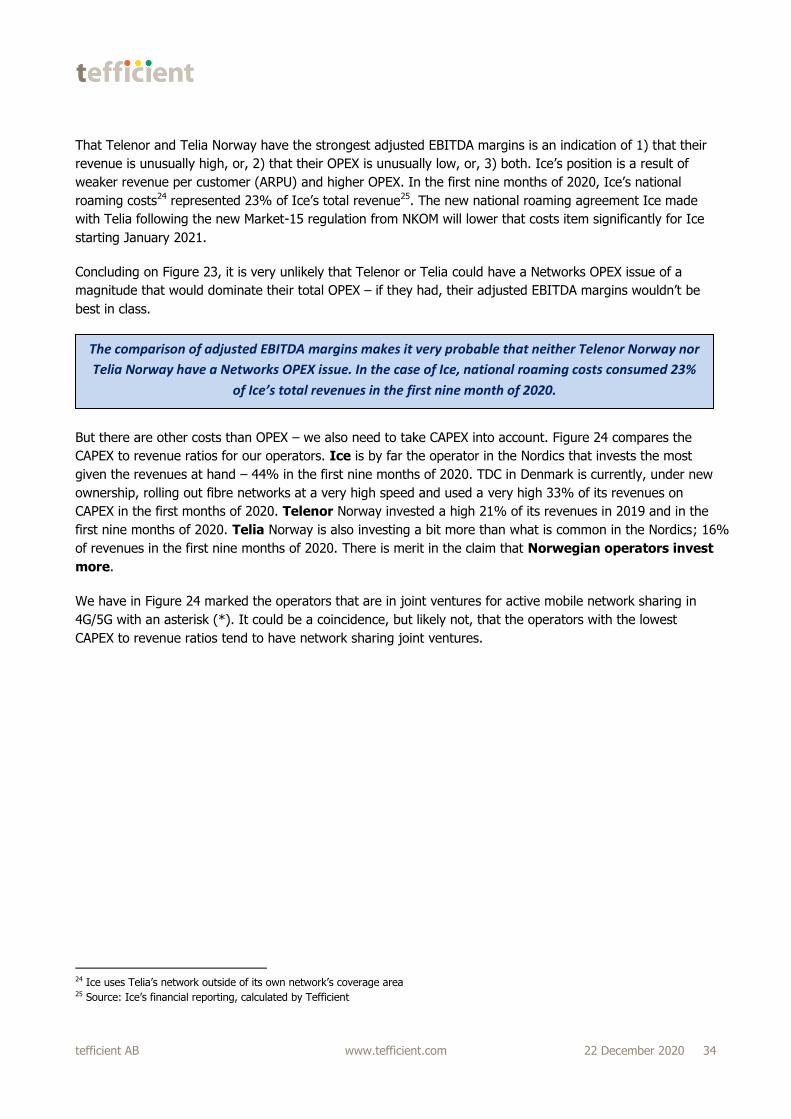
But there are other costs than OPEX – we also need to take CAPEX into account. Figure 24 compares the
CAPEX to revenue ratios for our operators. Ice is by far the operator in the Nordics that invests the most
given the revenues at hand – 44% in the first nine months of 2020. TDC in Denmark is currently, under new
ownership, rolling out fibre networks at a very high speed and used a very high 33% of its revenues on
CAPEX in the first months of 2020. Telenor Norway invested a high 21% of its revenues in 2019 and in the
first nine months of 2020. Telia Norway is also investing a bit more than what is common in the Nordics; 16%
of revenues in the first nine months of 2020. There is merit in the claim that Norwegian operators invest
more.
We have in Figure 24 marked the operators that are in joint ventures for active mobile network sharing in
4G/5G with an asterisk (*). It could be a coincidence, but likely not, that the operators with the lowest
CAPEX to revenue ratios tend to have network sharing joint ventures.
24 Ice uses Telia’s network outside of its own network’s coverage area 25 Source: Ice’s financial reporting, calculated by Tefficient
The comparison of adjusted EBITDA margins makes it very probable that neither Telenor Norway nor
Telia Norway have a Networks OPEX issue. In the case of Ice, national roaming costs consumed 23%
of Ice’s total revenues in the first nine month of 2020.
tefficient AB www.tefficient.com 22 December 2020 35
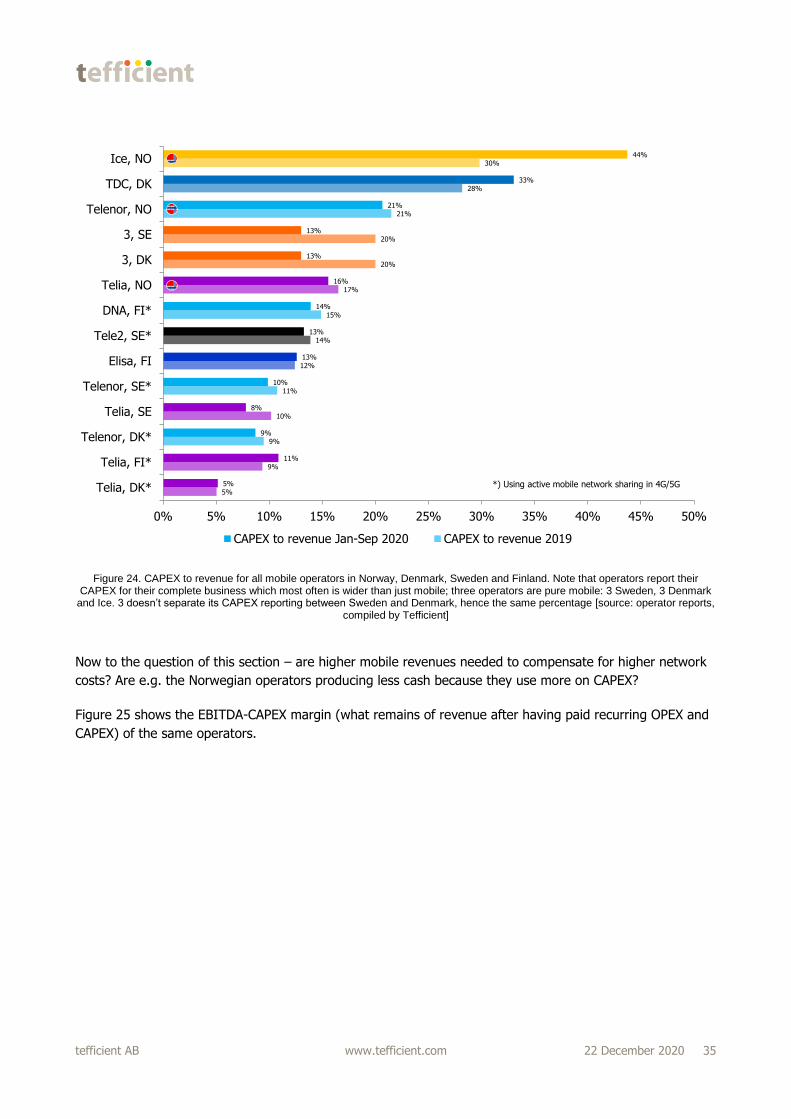
Figure 24. CAPEX to revenue for all mobile operators in Norway, Denmark, Sweden and Finland. Note that operators report their CAPEX for their complete business which most often is wider than just mobile; three operators are pure mobile: 3 Sweden, 3 Denmark
and Ice. 3 doesn’t separate its CAPEX reporting between Sweden and Denmark, hence the same percentage [source: operator reports, compiled by Tefficient]
Now to the question of this section – are higher mobile revenues needed to compensate for higher network
costs? Are e.g. the Norwegian operators producing less cash because they use more on CAPEX?
Figure 25 shows the EBITDA-CAPEX margin (what remains of revenue after having paid recurring OPEX and
CAPEX) of the same operators.
5%
9%
9%
10%
11%
12%
14%
15%
17%
20%
20%
21%
28%
30%
5%
11%
9%
8%
10%
13%
13%
14%
16%
13%
13%
21%
33%
44%
0% 5% 10% 15% 20% 25% 30% 35% 40% 45% 50%
Telia, DK*
Telia, FI*
Telenor, DK*
Telia, SE
Telenor, SE*
Elisa, FI
Tele2, SE*
DNA, FI*
Telia, NO
3, DK
3, SE
Telenor, NO
TDC, DK
Ice, NO
CAPEX to revenue Jan-Sep 2020 CAPEX to revenue 2019
*) Using active mobile network sharing in 4G/5G
tefficient AB www.tefficient.com 22 December 2020 36
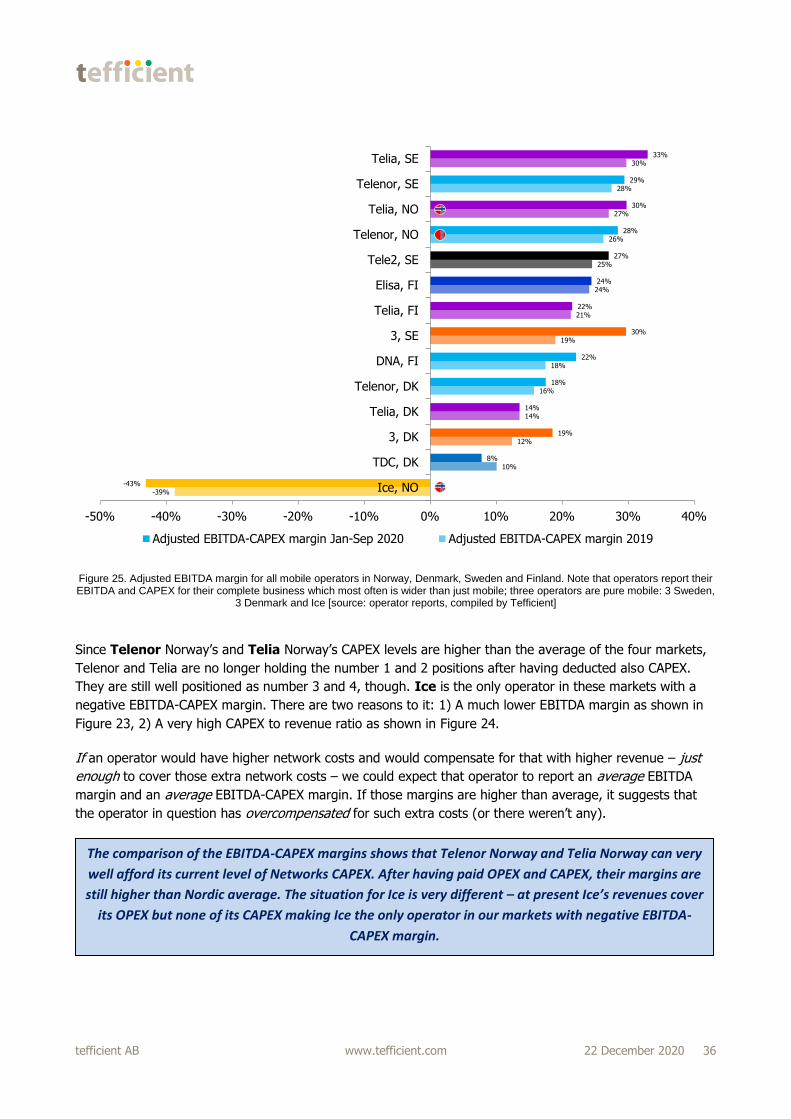
Figure 25. Adjusted EBITDA margin for all mobile operators in Norway, Denmark, Sweden and Finland. Note that operators report their EBITDA and CAPEX for their complete business which most often is wider than just mobile; three operators are pure mobile: 3 Sweden,
3 Denmark and Ice [source: operator reports, compiled by Tefficient]
Since Telenor Norway’s and Telia Norway’s CAPEX levels are higher than the average of the four markets,
Telenor and Telia are no longer holding the number 1 and 2 positions after having deducted also CAPEX.
They are still well positioned as number 3 and 4, though. Ice is the only operator in these markets with a
negative EBITDA-CAPEX margin. There are two reasons to it: 1) A much lower EBITDA margin as shown in
Figure 23, 2) A very high CAPEX to revenue ratio as shown in Figure 24.
If an operator would have higher network costs and would compensate for that with higher revenue – just
enough to cover those extra network costs – we could expect that operator to report an average EBITDA
margin and an average EBITDA-CAPEX margin. If those margins are higher than average, it suggests that
the operator in question has overcompensated for such extra costs (or there weren’t any).
-39%
10%
12%
14%
16%
18%
19%
21%
24%
25%
26%
27%
28%
30%
-43%
8%
19%
14%
18%
22%
30%
22%
24%
27%
28%
30%
29%
33%
-50% -40% -30% -20% -10% 0% 10% 20% 30% 40%
Ice, NO
TDC, DK
3, DK
Telia, DK
Telenor, DK
DNA, FI
3, SE
Telia, FI
Elisa, FI
Tele2, SE
Telenor, NO
Telia, NO
Telenor, SE
Telia, SE
Adjusted EBITDA-CAPEX margin Jan-Sep 2020 Adjusted EBITDA-CAPEX margin 2019
The comparison of the EBITDA-CAPEX margins shows that Telenor Norway and Telia Norway can very
well afford its current level of Networks CAPEX. After having paid OPEX and CAPEX, their margins are
still higher than Nordic average. The situation for Ice is very different – at present Ice’s revenues cover
its OPEX but none of its CAPEX making Ice the only operator in our markets with negative EBITDA-
CAPEX margin.

tefficient AB www.tefficient.com 22 December 2020 37
10. Comparison of mobile data usage and revenue
Figure 26 compares the mobile data usage per subscription (incl. M2M) between our four countries. Finland
is the world leader26 in average mobile data usage and totally dominates over the other Nordic countries
with an average of 22.4 GB used per subscription per month in 1H 2020.
Figure 26. Average mobile data usage per mobile subscription including M2M for Norway, Denmark, Sweden and Finland 2018, 2019 and 1H 2020 [source: NKOM, Energistyrelsen, PTS, Traficom, compiled by Tefficient]
The average mobile data usage of Norway was 4.2 GB per subscription per month in 1H 2020 – significantly
lower than Finland obviously, but also much lower than Denmark and Sweden.
To avoid M2M and the difficulties with the Swedish reporting, let’s now exclude M2M27, see Figure 27. Also
here, Finland totally dominates over the other Nordic countries with an average of 26.4 GB used per
subscription (excl. M2M) per month in 1H 2020.
26 https://tefficient.com/the-growth-in-mobile-data-wasnt-stopped-by-a-pandemic/ 27 Denmark and Finland aren’t separating out the M2M data traffic (Norway and Sweden do) but from the Norwegian and Swedish data
it’s clear that the M2M data traffic is very small compared to the overall data traffic – 0.4% in Norway and 0.5% in Sweden in 1H 2020.
We have therefore assumed that the M2M traffic in Denmark and Finland is zero rather than excluding the countries from this metric.
3,23,8
4,2
5,9
7,7
9,9
7,3
3,44,0
4,4
15,3
18,4
22,4
0
5
10
15
20
25
2018 2019 1H 2020
Mo
bil
e d
ata
usa
ge
pe
r su
bscri
pti
on
in
cl.
M2
M[G
B p
er
mo
nth
]
Norway
Denmark
Sweden with just Swedish M2M
Sweden with also international M2M
Finland
tefficient AB www.tefficient.com 22 December 2020 38
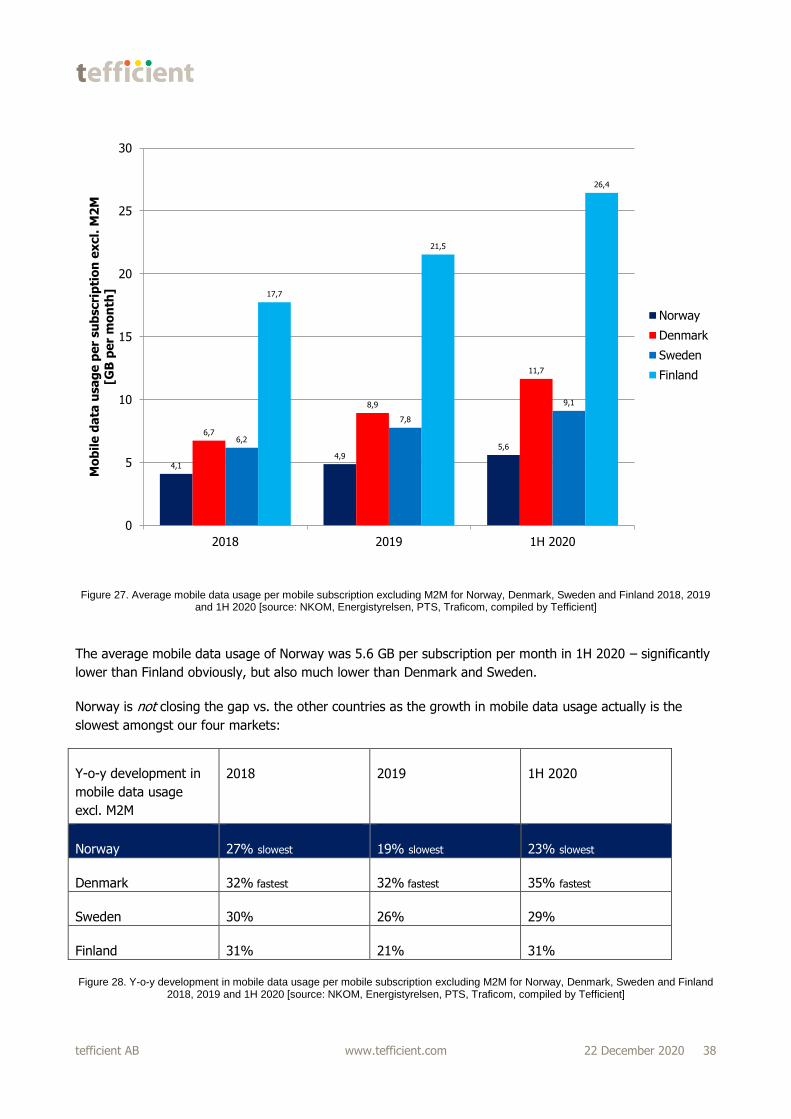
Figure 27. Average mobile data usage per mobile subscription excluding M2M for Norway, Denmark, Sweden and Finland 2018, 2019 and 1H 2020 [source: NKOM, Energistyrelsen, PTS, Traficom, compiled by Tefficient]
The average mobile data usage of Norway was 5.6 GB per subscription per month in 1H 2020 – significantly
lower than Finland obviously, but also much lower than Denmark and Sweden.
Norway is not closing the gap vs. the other countries as the growth in mobile data usage actually is the
slowest amongst our four markets:
Y-o-y development in
mobile data usage
excl. M2M
2018 2019 1H 2020
Norway 27% slowest 19% slowest 23% slowest
Denmark 32% fastest 32% fastest 35% fastest
Sweden 30% 26% 29%
Finland 31% 21% 31%
Figure 28. Y-o-y development in mobile data usage per mobile subscription excluding M2M for Norway, Denmark, Sweden and Finland 2018, 2019 and 1H 2020 [source: NKOM, Energistyrelsen, PTS, Traficom, compiled by Tefficient]
4,1
4,95,6
6,7
8,9
11,7
6,2
7,8
9,1
17,7
21,5
26,4
0
5
10
15
20
25
30
2018 2019 1H 2020
Mo
bil
e d
ata
usa
ge
pe
r su
bscri
pti
on
ex
cl.
M2
M[G
B p
er
mo
nth
]
Norway
Denmark
Sweden
Finland
tefficient AB www.tefficient.com 22 December 2020 39
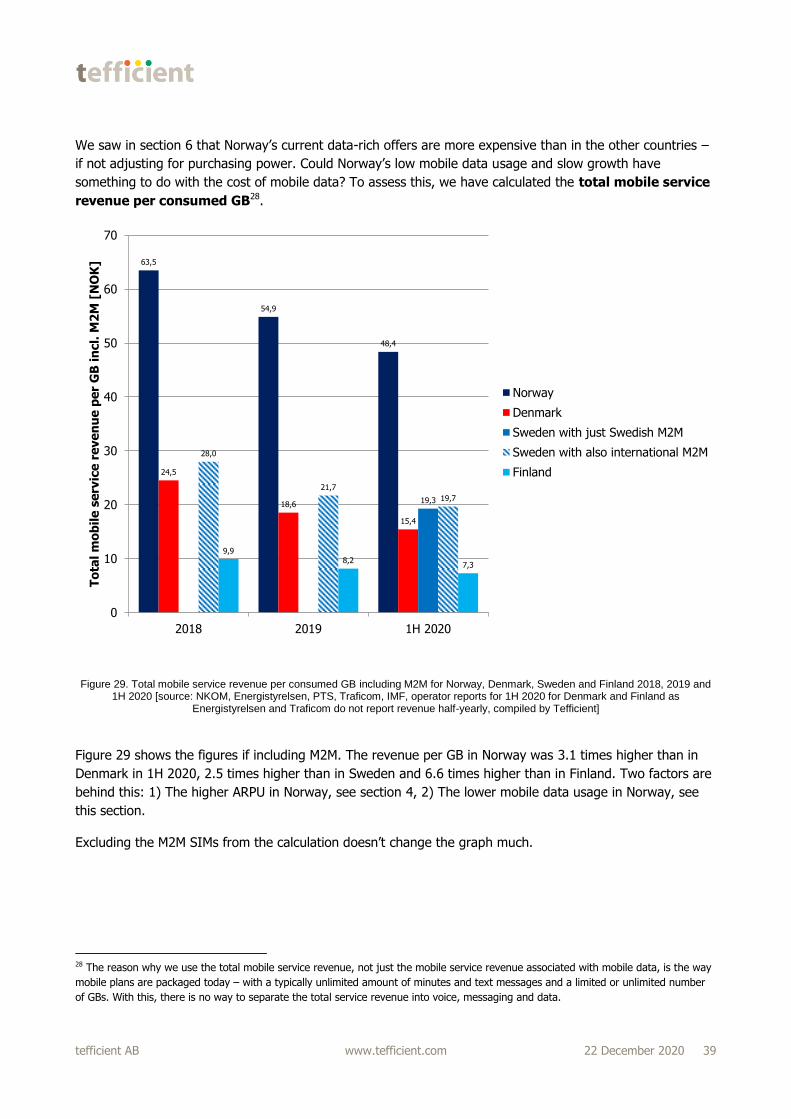
We saw in section 6 that Norway’s current data-rich offers are more expensive than in the other countries –
if not adjusting for purchasing power. Could Norway’s low mobile data usage and slow growth have
something to do with the cost of mobile data? To assess this, we have calculated the total mobile service
revenue per consumed GB28.
Figure 29. Total mobile service revenue per consumed GB including M2M for Norway, Denmark, Sweden and Finland 2018, 2019 and 1H 2020 [source: NKOM, Energistyrelsen, PTS, Traficom, IMF, operator reports for 1H 2020 for Denmark and Finland as
Energistyrelsen and Traficom do not report revenue half-yearly, compiled by Tefficient]
Figure 29 shows the figures if including M2M. The revenue per GB in Norway was 3.1 times higher than in
Denmark in 1H 2020, 2.5 times higher than in Sweden and 6.6 times higher than in Finland. Two factors are
behind this: 1) The higher ARPU in Norway, see section 4, 2) The lower mobile data usage in Norway, see
this section.
Excluding the M2M SIMs from the calculation doesn’t change the graph much.
28 The reason why we use the total mobile service revenue, not just the mobile service revenue associated with mobile data, is the way
mobile plans are packaged today – with a typically unlimited amount of minutes and text messages and a limited or unlimited number
of GBs. With this, there is no way to separate the total service revenue into voice, messaging and data.
63,5
54,9
48,4
24,5
18,6
15,4
19,3
28,0
21,7
19,7
9,98,2
7,3
0
10
20
30
40
50
60
70
2018 2019 1H 2020
To
tal m
ob
ile
se
rvic
e r
eve
nu
e p
er
GB
in
cl.
M2
M [
NO
K]
Norway
Denmark
Sweden with just Swedish M2M
Sweden with also international M2M
Finland
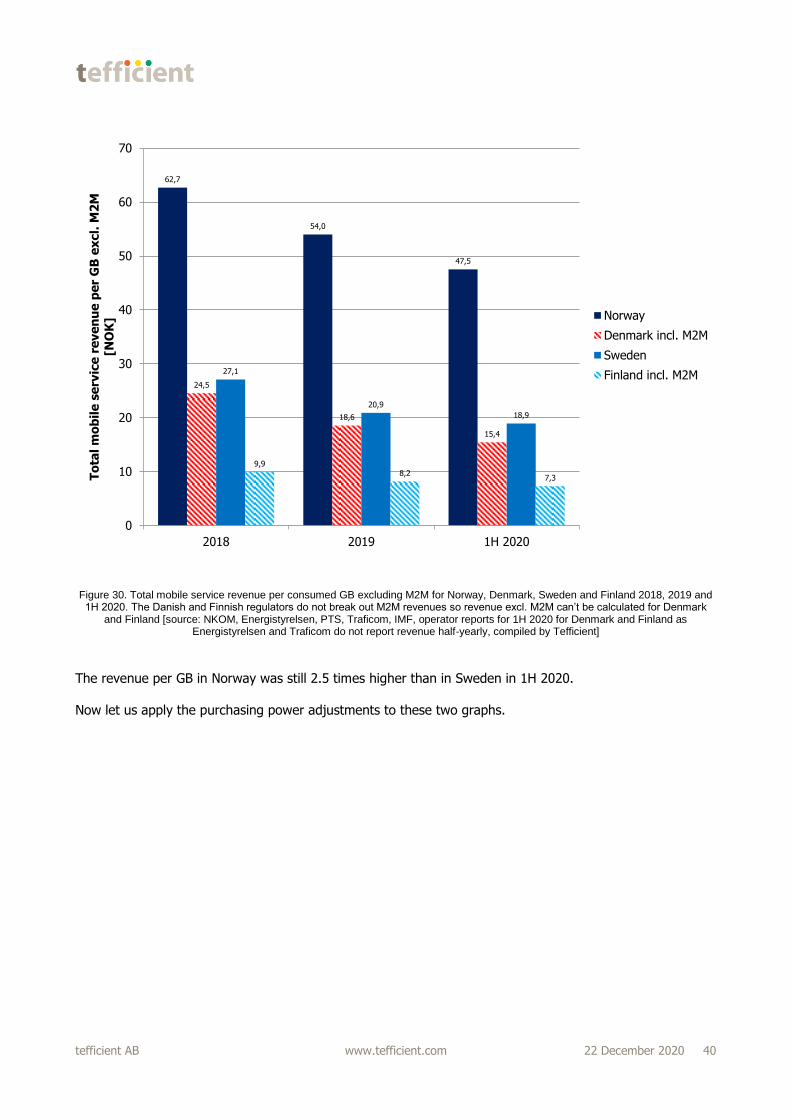
tefficient AB www.tefficient.com 22 December 2020 40
Figure 30. Total mobile service revenue per consumed GB excluding M2M for Norway, Denmark, Sweden and Finland 2018, 2019 and 1H 2020. The Danish and Finnish regulators do not break out M2M revenues so revenue excl. M2M can’t be calculated for Denmark
and Finland [source: NKOM, Energistyrelsen, PTS, Traficom, IMF, operator reports for 1H 2020 for Denmark and Finland as Energistyrelsen and Traficom do not report revenue half-yearly, compiled by Tefficient]
The revenue per GB in Norway was still 2.5 times higher than in Sweden in 1H 2020.
Now let us apply the purchasing power adjustments to these two graphs.
62,7
54,0
47,5
24,5
18,6
15,4
27,1
20,9
18,9
9,98,2
7,3
0
10
20
30
40
50
60
70
2018 2019 1H 2020
To
tal m
ob
ile
se
rvic
e r
eve
nu
e p
er
GB
ex
cl.
M2
M
[NO
K] Norway
Denmark incl. M2M
Sweden
Finland incl. M2M
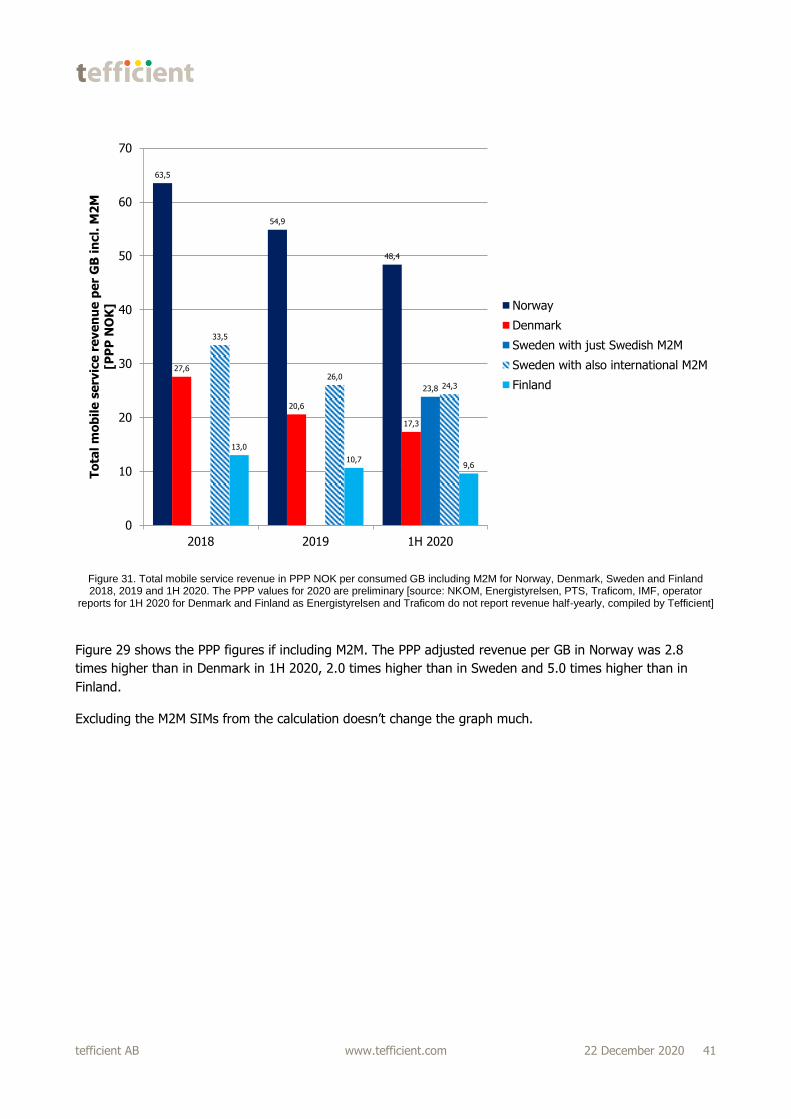
tefficient AB www.tefficient.com 22 December 2020 41
Figure 31. Total mobile service revenue in PPP NOK per consumed GB including M2M for Norway, Denmark, Sweden and Finland 2018, 2019 and 1H 2020. The PPP values for 2020 are preliminary [source: NKOM, Energistyrelsen, PTS, Traficom, IMF, operator
reports for 1H 2020 for Denmark and Finland as Energistyrelsen and Traficom do not report revenue half-yearly, compiled by Tefficient]
Figure 29 shows the PPP figures if including M2M. The PPP adjusted revenue per GB in Norway was 2.8
times higher than in Denmark in 1H 2020, 2.0 times higher than in Sweden and 5.0 times higher than in
Finland.
Excluding the M2M SIMs from the calculation doesn’t change the graph much.
63,5
54,9
48,4
27,6
20,6
17,3
23,8
33,5
26,024,3
13,0
10,79,6
0
10
20
30
40
50
60
70
2018 2019 1H 2020
To
tal m
ob
ile
se
rvic
e r
eve
nu
e p
er
GB
in
cl.
M2
M[P
PP
NO
K] Norway
Denmark
Sweden with just Swedish M2M
Sweden with also international M2M
Finland
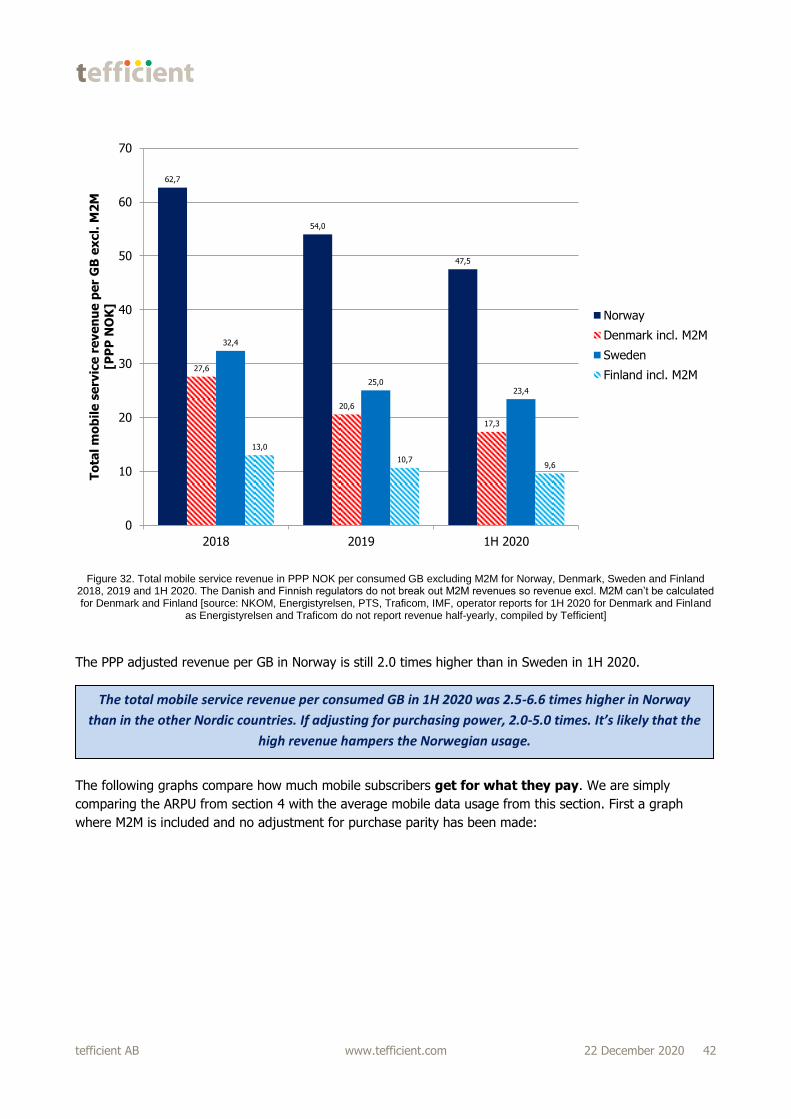
tefficient AB www.tefficient.com 22 December 2020 42
Figure 32. Total mobile service revenue in PPP NOK per consumed GB excluding M2M for Norway, Denmark, Sweden and Finland 2018, 2019 and 1H 2020. The Danish and Finnish regulators do not break out M2M revenues so revenue excl. M2M can’t be calculated for Denmark and Finland [source: NKOM, Energistyrelsen, PTS, Traficom, IMF, operator reports for 1H 2020 for Denmark and Finland
as Energistyrelsen and Traficom do not report revenue half-yearly, compiled by Tefficient]
The PPP adjusted revenue per GB in Norway is still 2.0 times higher than in Sweden in 1H 2020.
The following graphs compare how much mobile subscribers get for what they pay. We are simply
comparing the ARPU from section 4 with the average mobile data usage from this section. First a graph
where M2M is included and no adjustment for purchase parity has been made:
62,7
54,0
47,5
27,6
20,6
17,3
32,4
25,023,4
13,0
10,79,6
0
10
20
30
40
50
60
70
2018 2019 1H 2020
To
tal m
ob
ile
se
rvic
e r
eve
nu
e p
er
GB
ex
cl.
M2
M[P
PP
NO
K]
Norway
Denmark incl. M2M
Sweden
Finland incl. M2M
The total mobile service revenue per consumed GB in 1H 2020 was 2.5-6.6 times higher in Norway
than in the other Nordic countries. If adjusting for purchasing power, 2.0-5.0 times. It’s likely that the
high revenue hampers the Norwegian usage.

tefficient AB www.tefficient.com 22 December 2020 43
Figure 33. ARPU per mobile subscription including M2M vs. the average mobile data usage per subscription including M2M for Norway, Denmark, Sweden and Finland 2018, 2019 and 1H 2020 [source: NKOM, Energistyrelsen, PTS, Traficom, operator reports for 1H 2020
for Denmark and Finland as Energistyrelsen and Traficom do not report revenue half-yearly, compiled by Tefficient]
Norway’s ARPU is the highest, but the average mobile data usage is still the lowest.
Excluding M2M from Figure 33 simplifies the comparison as the Swedish M2M reporting problem is avoided.
On the other hand, as before, Denmark and Finland can’t be shown as the M2M revenues aren’t separated
out.
206 206 204
144 142
153
9486 87
142
151 150
164
3,23,8
4,2
5,9
7,7
9,9
3,44,0
4,4
7,3
15,3
18,4
22,4
0
5
10
15
20
25
0
50
100
150
200
250
300
Norway2018
Norway2019
Norway 1H2020
Denmark2018
Denmark2019
Denmark 1H2020
Swedenwith also
internationalM2M 2018
Swedenwith also
internationalM2M 2019
Swedenwith also
internationalM2M 1H
2020
Swedenwith just
SwedishM2M 2018
Swedenwith just
SwedishM2M 2019
Swedenwith just
SwedishM2M 1H
2020
Finland2018
Finland2019
Finland 1H2020
Mo
bil
e d
ata
usa
ge
pe
r su
bscri
pti
on
in
cl.
M2
M[G
B p
er
mo
nth
]
Mo
bil
e A
RP
U [
NO
K]
NOK GBs
Norway Denmark Sweden Finland
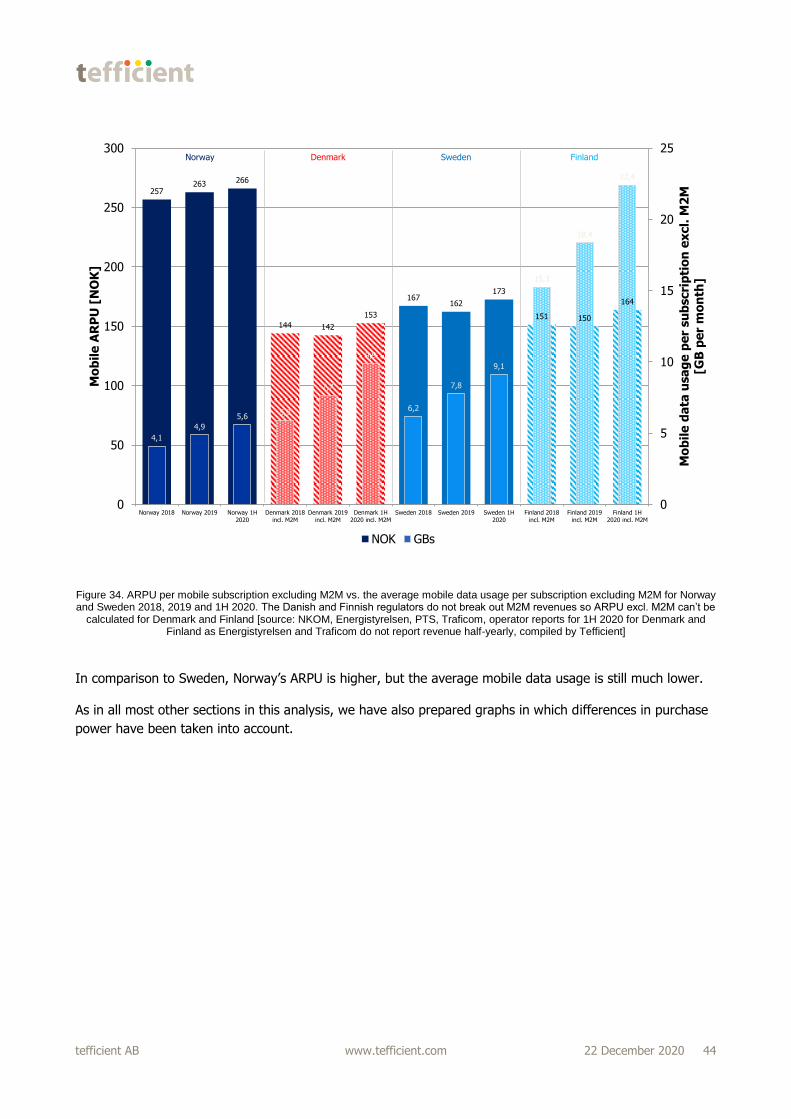
tefficient AB www.tefficient.com 22 December 2020 44
Figure 34. ARPU per mobile subscription excluding M2M vs. the average mobile data usage per subscription excluding M2M for Norway and Sweden 2018, 2019 and 1H 2020. The Danish and Finnish regulators do not break out M2M revenues so ARPU excl. M2M can’t be
calculated for Denmark and Finland [source: NKOM, Energistyrelsen, PTS, Traficom, operator reports for 1H 2020 for Denmark and Finland as Energistyrelsen and Traficom do not report revenue half-yearly, compiled by Tefficient]
In comparison to Sweden, Norway’s ARPU is higher, but the average mobile data usage is still much lower.
As in all most other sections in this analysis, we have also prepared graphs in which differences in purchase
power have been taken into account.
257263 266
144 142
153
167162
173
151 150
164
4,1
4,9
5,65,9
7,7
9,9
6,2
7,8
9,1
15,3
18,4
22,4
0
5
10
15
20
25
0
50
100
150
200
250
300
Norway 2018 Norway 2019 Norway 1H2020
Denmark 2018incl. M2M
Denmark 2019incl. M2M
Denmark 1H2020 incl. M2M
Sweden 2018 Sweden 2019 Sweden 1H2020
Finland 2018incl. M2M
Finland 2019incl. M2M
Finland 1H2020 incl. M2M
Mo
bil
e d
ata
usa
ge
pe
r su
bscri
pti
on
ex
cl.
M2
M[G
B p
er
mo
nth
]
Mo
bil
e A
RP
U [
NO
K]
NOK GBs
Norway Denmark Sweden Finland

tefficient AB www.tefficient.com 22 December 2020 45
Figure 35. PPP ARPU per mobile subscription including M2M vs. the average mobile data usage per subscription including M2M for Norway, Denmark, Sweden and Finland 2018, 2019 and 1H 2020. The PPP values for 2020 are preliminary [source: NKOM,
Energistyrelsen, PTS, Traficom, IMF, operator reports for 1H 2020 for Denmark and Finland as Energistyrelsen and Traficom do not report revenue half-yearly, compiled by Tefficient]
Applying PPP raises the ARPU bars for Denmark, Sweden and Finland. Finnish ARPU is now on par with – or
in 1H 2020 even higher – than the Norwegian ARPU. But the difference in how much mobile data is
consumed with that ARPU is still very significant. Versus Sweden and Denmark, the Norwegian ARPU is still
high, but the mobile data usage in Norway is lower.
Finally the PPP graph excluding M2M.
206 206 204
162158
171
112
103108
175
199 196
215
3,23,8
4,2
5,9
7,7
9,9
3,44,0
4,4
7,3
15,3
18,4
22,4
0
5
10
15
20
25
0
50
100
150
200
250
300
Norway2018
Norway2019
Norway 1H2020
Denmark2018
Denmark2019
Denmark 1H2020
Swedenwith also
internationalM2M 2018
Swedenwith also
internationalM2M 2019
Swedenwith also
internationalM2M 1H
2020
Swedenwith just
SwedishM2M 2018
Swedenwith just
SwedishM2M 2019
Swedenwith just
SwedishM2M 1H
2020
Finland2018
Finland2019
Finland 1H2020
Mo
bil
e d
ata
usa
ge
pe
r su
bscri
pti
on
in
cl.
M2
M[G
B p
er
mo
nth
]
Mo
bil
e A
RP
U [
PP
P N
OK
]
PPP NOK GBs
Norway Denmark Sweden Finland
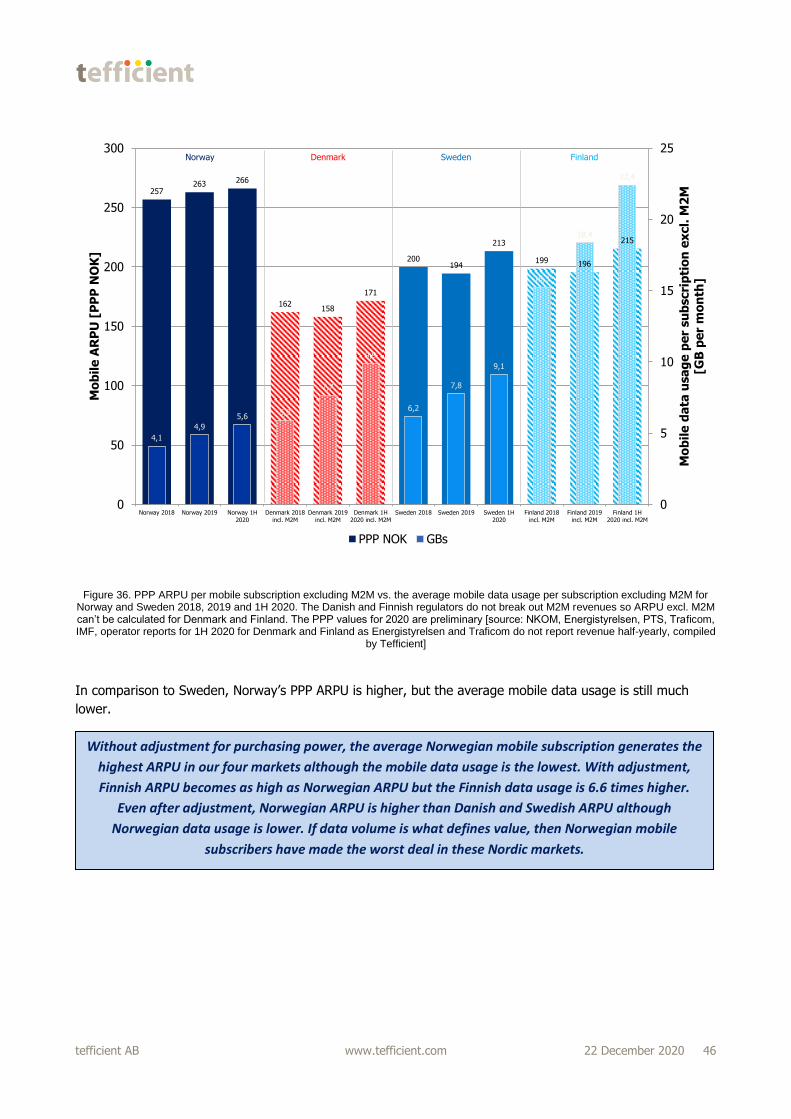
tefficient AB www.tefficient.com 22 December 2020 46
Figure 36. PPP ARPU per mobile subscription excluding M2M vs. the average mobile data usage per subscription excluding M2M for Norway and Sweden 2018, 2019 and 1H 2020. The Danish and Finnish regulators do not break out M2M revenues so ARPU excl. M2M can’t be calculated for Denmark and Finland. The PPP values for 2020 are preliminary [source: NKOM, Energistyrelsen, PTS, Traficom, IMF, operator reports for 1H 2020 for Denmark and Finland as Energistyrelsen and Traficom do not report revenue half-yearly, compiled
by Tefficient]
In comparison to Sweden, Norway’s PPP ARPU is higher, but the average mobile data usage is still much
lower.
257263 266
162158
171
200194
213
199 196
215
4,1
4,9
5,65,9
7,7
9,9
6,2
7,8
9,1
15,3
18,4
22,4
0
5
10
15
20
25
0
50
100
150
200
250
300
Norway 2018 Norway 2019 Norway 1H2020
Denmark 2018incl. M2M
Denmark 2019incl. M2M
Denmark 1H2020 incl. M2M
Sweden 2018 Sweden 2019 Sweden 1H2020
Finland 2018incl. M2M
Finland 2019incl. M2M
Finland 1H2020 incl. M2M
Mo
bil
e d
ata
usa
ge
pe
r su
bscri
pti
on
ex
cl.
M2
M[G
B p
er
mo
nth
]
Mo
bil
e A
RP
U [
PP
P N
OK
]
PPP NOK GBs
Norway Denmark Sweden Finland
Without adjustment for purchasing power, the average Norwegian mobile subscription generates the
highest ARPU in our four markets although the mobile data usage is the lowest. With adjustment,
Finnish ARPU becomes as high as Norwegian ARPU but the Finnish data usage is 6.6 times higher.
Even after adjustment, Norwegian ARPU is higher than Danish and Swedish ARPU although
Norwegian data usage is lower. If data volume is what defines value, then Norwegian mobile
subscribers have made the worst deal in these Nordic markets.
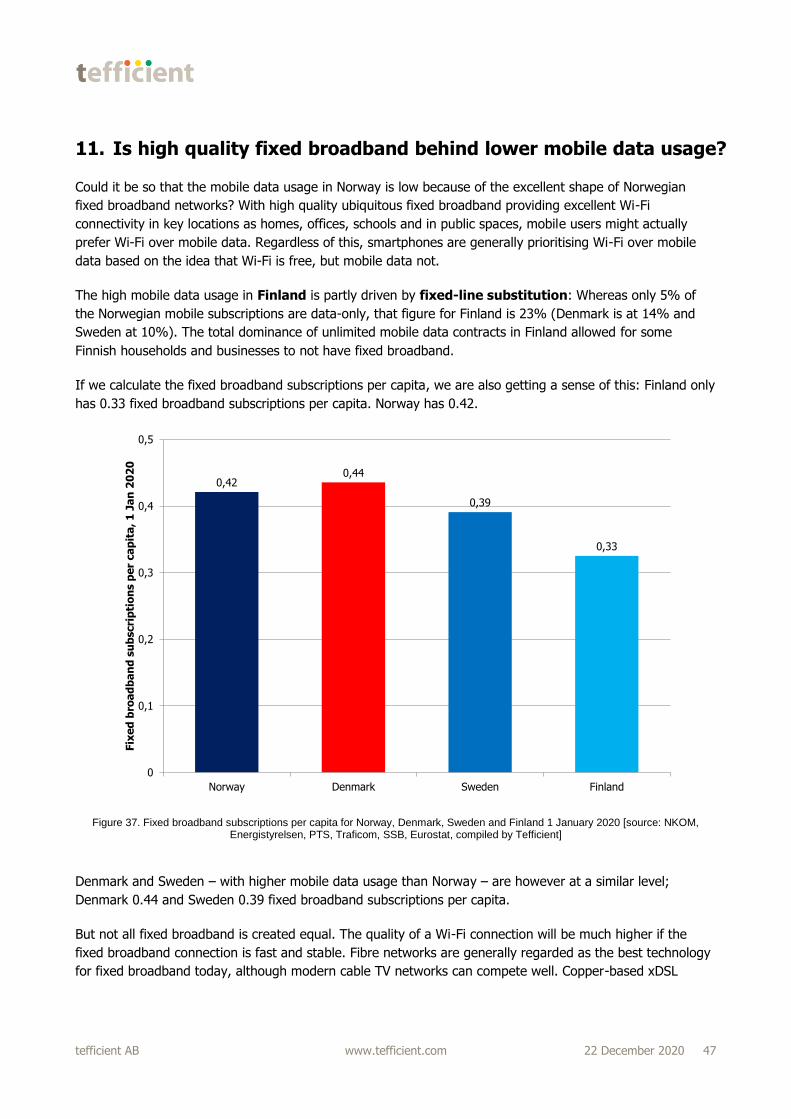
tefficient AB www.tefficient.com 22 December 2020 47
11. Is high quality fixed broadband behind lower mobile data usage?
Could it be so that the mobile data usage in Norway is low because of the excellent shape of Norwegian
fixed broadband networks? With high quality ubiquitous fixed broadband providing excellent Wi-Fi
connectivity in key locations as homes, offices, schools and in public spaces, mobile users might actually
prefer Wi-Fi over mobile data. Regardless of this, smartphones are generally prioritising Wi-Fi over mobile
data based on the idea that Wi-Fi is free, but mobile data not.
The high mobile data usage in Finland is partly driven by fixed-line substitution: Whereas only 5% of
the Norwegian mobile subscriptions are data-only, that figure for Finland is 23% (Denmark is at 14% and
Sweden at 10%). The total dominance of unlimited mobile data contracts in Finland allowed for some
Finnish households and businesses to not have fixed broadband.
If we calculate the fixed broadband subscriptions per capita, we are also getting a sense of this: Finland only
has 0.33 fixed broadband subscriptions per capita. Norway has 0.42.
Figure 37. Fixed broadband subscriptions per capita for Norway, Denmark, Sweden and Finland 1 January 2020 [source: NKOM, Energistyrelsen, PTS, Traficom, SSB, Eurostat, compiled by Tefficient]
Denmark and Sweden – with higher mobile data usage than Norway – are however at a similar level;
Denmark 0.44 and Sweden 0.39 fixed broadband subscriptions per capita.
But not all fixed broadband is created equal. The quality of a Wi-Fi connection will be much higher if the
fixed broadband connection is fast and stable. Fibre networks are generally regarded as the best technology
for fixed broadband today, although modern cable TV networks can compete well. Copper-based xDSL
0,420,44
0,39
0,33
0
0,1
0,2
0,3
0,4
0,5
Norway Denmark Sweden Finland
Fix
ed
bro
ad
ba
nd
su
bscri
pti
on
s p
er
ca
pit
a,
1 J
an
20
20
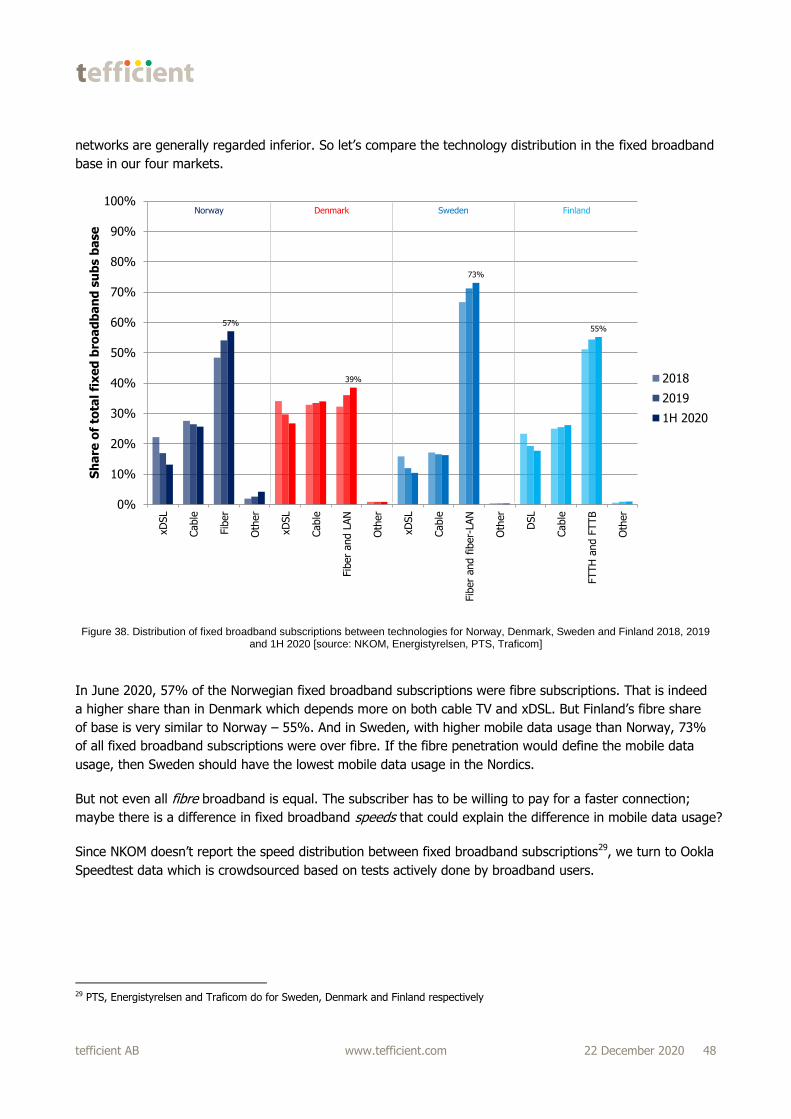
tefficient AB www.tefficient.com 22 December 2020 48
networks are generally regarded inferior. So let’s compare the technology distribution in the fixed broadband
base in our four markets.
Figure 38. Distribution of fixed broadband subscriptions between technologies for Norway, Denmark, Sweden and Finland 2018, 2019 and 1H 2020 [source: NKOM, Energistyrelsen, PTS, Traficom]
In June 2020, 57% of the Norwegian fixed broadband subscriptions were fibre subscriptions. That is indeed
a higher share than in Denmark which depends more on both cable TV and xDSL. But Finland’s fibre share
of base is very similar to Norway – 55%. And in Sweden, with higher mobile data usage than Norway, 73%
of all fixed broadband subscriptions were over fibre. If the fibre penetration would define the mobile data
usage, then Sweden should have the lowest mobile data usage in the Nordics.
But not even all fibre broadband is equal. The subscriber has to be willing to pay for a faster connection;
maybe there is a difference in fixed broadband speeds that could explain the difference in mobile data usage?
Since NKOM doesn’t report the speed distribution between fixed broadband subscriptions29, we turn to Ookla
Speedtest data which is crowdsourced based on tests actively done by broadband users.
29 PTS, Energistyrelsen and Traficom do for Sweden, Denmark and Finland respectively
57%
39%
73%
55%
0%
10%
20%
30%
40%
50%
60%
70%
80%
90%
100%
xD
SL
Cable
Fib
er
Oth
er
xD
SL
Cable
Fib
er
and L
AN
Oth
er
xD
SL
Cable
Fib
er
and f
iber-
LAN
Oth
er
DSL
Cable
FTTH
and F
TTB
Oth
er
Sh
are
of
tota
l fi
xe
d b
roa
db
an
d s
ub
s b
ase
2018
2019
1H 2020
Norway Denmark Sweden Finland
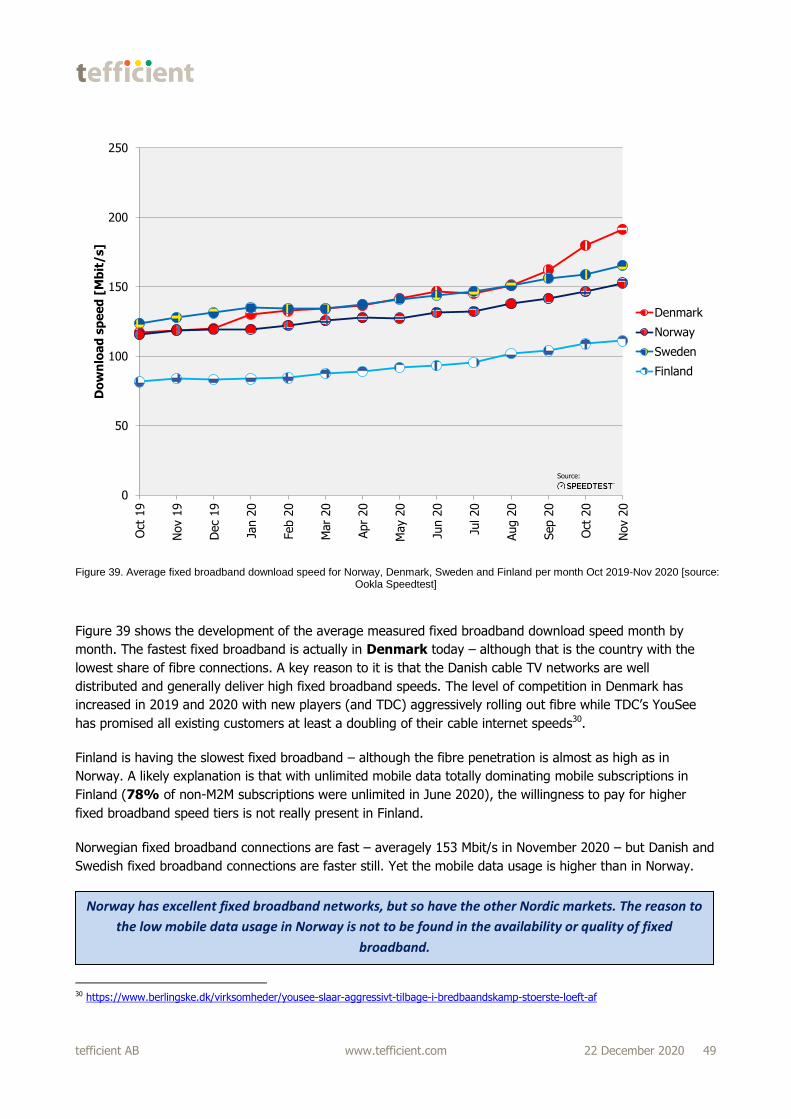
tefficient AB www.tefficient.com 22 December 2020 49
Figure 39. Average fixed broadband download speed for Norway, Denmark, Sweden and Finland per month Oct 2019-Nov 2020 [source: Ookla Speedtest]
Figure 39 shows the development of the average measured fixed broadband download speed month by
month. The fastest fixed broadband is actually in Denmark today – although that is the country with the
lowest share of fibre connections. A key reason to it is that the Danish cable TV networks are well
distributed and generally deliver high fixed broadband speeds. The level of competition in Denmark has
increased in 2019 and 2020 with new players (and TDC) aggressively rolling out fibre while TDC’s YouSee
has promised all existing customers at least a doubling of their cable internet speeds30.
Finland is having the slowest fixed broadband – although the fibre penetration is almost as high as in
Norway. A likely explanation is that with unlimited mobile data totally dominating mobile subscriptions in
Finland (78% of non-M2M subscriptions were unlimited in June 2020), the willingness to pay for higher
fixed broadband speed tiers is not really present in Finland.
Norwegian fixed broadband connections are fast – averagely 153 Mbit/s in November 2020 – but Danish and
Swedish fixed broadband connections are faster still. Yet the mobile data usage is higher than in Norway.
30 https://www.berlingske.dk/virksomheder/yousee-slaar-aggressivt-tilbage-i-bredbaandskamp-stoerste-loeft-af
0
50
100
150
200
250O
ct 1
9
Nov 1
9
Dec
19
Jan 2
0
Feb 2
0
Mar
20
Apr
20
May 2
0
Jun 2
0
Jul 20
Aug 2
0
Sep 2
0
Oct
20
Nov 2
0
Do
wn
loa
d s
pe
ed
[M
bit
/s]
Denmark
Norway
Sweden
Finland
Source:
Norway has excellent fixed broadband networks, but so have the other Nordic markets. The reason to
the low mobile data usage in Norway is not to be found in the availability or quality of fixed
broadband.
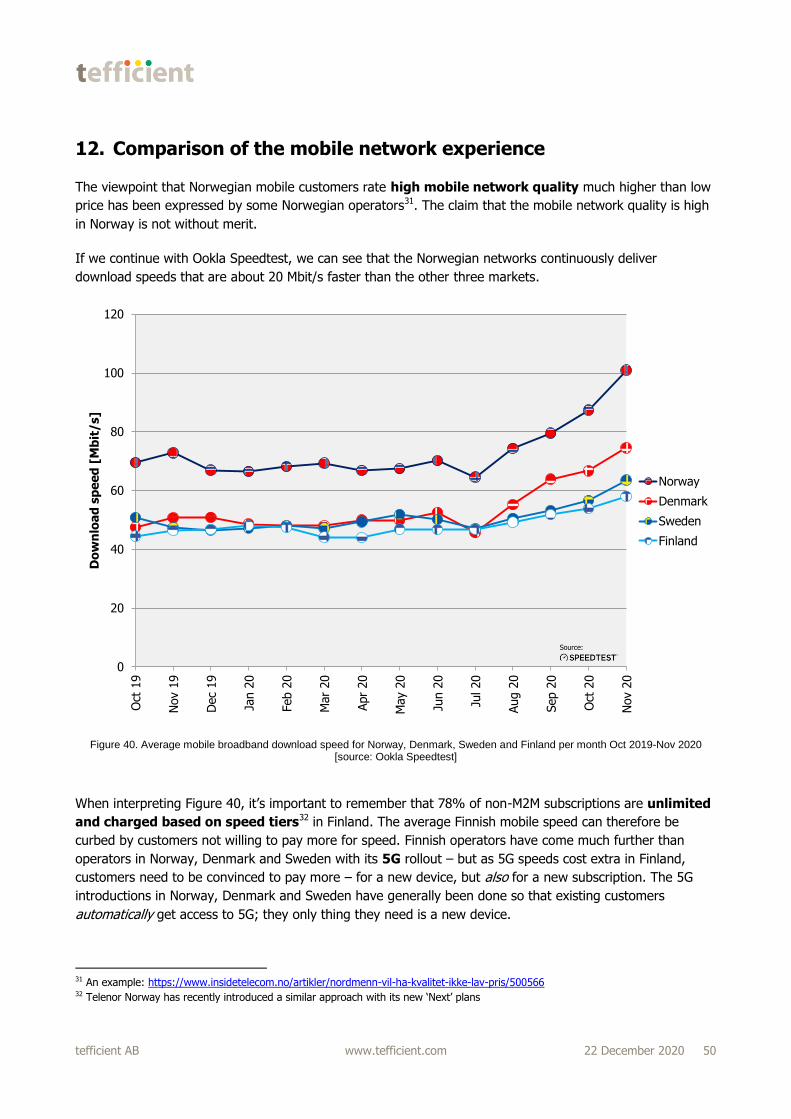
tefficient AB www.tefficient.com 22 December 2020 50
12. Comparison of the mobile network experience
The viewpoint that Norwegian mobile customers rate high mobile network quality much higher than low
price has been expressed by some Norwegian operators31. The claim that the mobile network quality is high
in Norway is not without merit.
If we continue with Ookla Speedtest, we can see that the Norwegian networks continuously deliver
download speeds that are about 20 Mbit/s faster than the other three markets.
Figure 40. Average mobile broadband download speed for Norway, Denmark, Sweden and Finland per month Oct 2019-Nov 2020 [source: Ookla Speedtest]
When interpreting Figure 40, it’s important to remember that 78% of non-M2M subscriptions are unlimited
and charged based on speed tiers32 in Finland. The average Finnish mobile speed can therefore be
curbed by customers not willing to pay more for speed. Finnish operators have come much further than
operators in Norway, Denmark and Sweden with its 5G rollout – but as 5G speeds cost extra in Finland,
customers need to be convinced to pay more – for a new device, but also for a new subscription. The 5G
introductions in Norway, Denmark and Sweden have generally been done so that existing customers
automatically get access to 5G; they only thing they need is a new device.
31 An example: https://www.insidetelecom.no/artikler/nordmenn-vil-ha-kvalitet-ikke-lav-pris/500566 32 Telenor Norway has recently introduced a similar approach with its new ‘Next’ plans
0
20
40
60
80
100
120
Oct
19
Nov 1
9
Dec
19
Jan 2
0
Feb 2
0
Mar
20
Apr
20
May 2
0
Jun 2
0
Jul 20
Aug 2
0
Sep 2
0
Oct
20
Nov 2
0
Do
wn
loa
d s
pe
ed
[M
bit
/s]
Norway
Denmark
Sweden
Finland
Source:
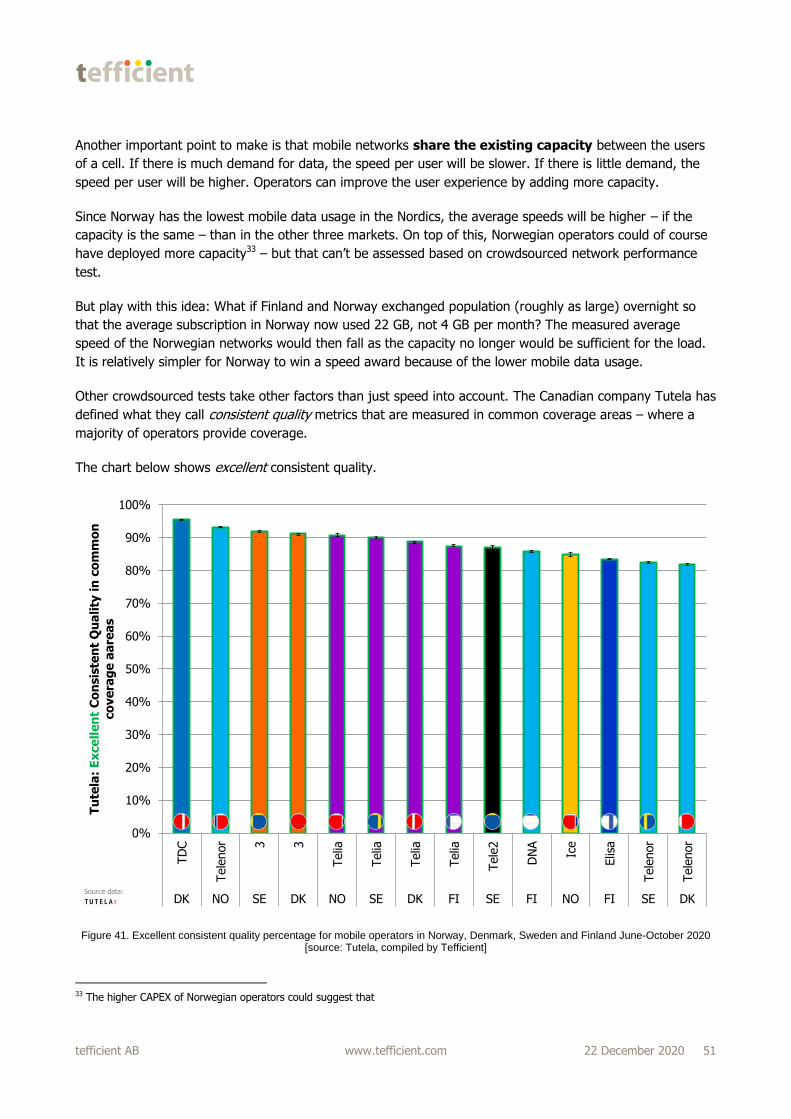
tefficient AB www.tefficient.com 22 December 2020 51
Another important point to make is that mobile networks share the existing capacity between the users
of a cell. If there is much demand for data, the speed per user will be slower. If there is little demand, the
speed per user will be higher. Operators can improve the user experience by adding more capacity.
Since Norway has the lowest mobile data usage in the Nordics, the average speeds will be higher – if the
capacity is the same – than in the other three markets. On top of this, Norwegian operators could of course
have deployed more capacity33 – but that can’t be assessed based on crowdsourced network performance
test.
But play with this idea: What if Finland and Norway exchanged population (roughly as large) overnight so
that the average subscription in Norway now used 22 GB, not 4 GB per month? The measured average
speed of the Norwegian networks would then fall as the capacity no longer would be sufficient for the load.
It is relatively simpler for Norway to win a speed award because of the lower mobile data usage.
Other crowdsourced tests take other factors than just speed into account. The Canadian company Tutela has
defined what they call consistent quality metrics that are measured in common coverage areas – where a
majority of operators provide coverage.
The chart below shows excellent consistent quality.
Figure 41. Excellent consistent quality percentage for mobile operators in Norway, Denmark, Sweden and Finland June-October 2020 [source: Tutela, compiled by Tefficient]
33 The higher CAPEX of Norwegian operators could suggest that
0%
10%
20%
30%
40%
50%
60%
70%
80%
90%
100%
TD
C
Tele
nor 3 3
Telia
Telia
Telia
Telia
Tele
2
DN
A
Ice
Elis
a
Tele
nor
Tele
nor
DK NO SE DK NO SE DK FI SE FI NO FI SE DK
Tu
tela
: E
xce
lle
nt
Co
nsis
ten
t Q
ua
lity
in
co
mm
on
co
ve
rag
e a
are
as
Source data:
tefficient AB www.tefficient.com 22 December 2020 52
Excellent consistent quality is defined as:
>5 Mbit/s download throughput
>1.5 Mbit/s upload throughput
<50 ms latency
<30 ms jitter
<1% packet loss
TDC provides the highest percentage of samples categorised as excellent consistent quality by Tutela:
95.5%. Telenor Norway is number 2 with 93.1%, Telia Norway number 5 with 90.8% and Ice number 11
with 84.9%.
In Tutela’s more multifaceted methodology, highest speed is not necessarily making a network a winner.
Unlike Ookla Speedtest’s results, there is no ‘country factor’ in the outcome – all countries have a spread
between the operators. It worthwhile mentioning that the Nordic results overall – on an international scale –
are very good. In a global report34 based on older data (from August 2019 to August 2020) for hundreds of
countries, Norway was ranked as #1 globally in excellent consistent quality, Denmark as #5, Finland as #15
and Sweden as #19.
There is also a lower quality tier called core consistent quality:
>1.5 Mbit/s download throughput
>0.5 Mbit/s upload throughput
<100 ms latency
<50 ms jitter
<5% packet loss
34 https://www.tutela.com/blog/global-mobile-experience-2020?utm_content=140867057

tefficient AB www.tefficient.com 22 December 2020 53
Figure 42. Core consistent quality percentage for mobile operators in Norway, Denmark, Sweden and Finland June-October 2020 [source: Tutela, compiled by Tefficient]
As the requirements are lower, the percentages are now higher. In contrast to excellent consistent quality,
there is a ‘country factor’ in core consistent quality: Danish networks are generally rated the highest,
Finnish networks the lowest. Telenor Norway is number 7, Telia Norway number 10 and Ice number 12.
In the global report mentioned, Denmark was ranked as #1 globally in core consistent quality, Sweden as
#2, Norway as #4 and Finland as #34.
We spoke about low load contributing to the high average download speed of Norwegian networks. Another
factor that helps on speed is a modern smartphone base.
0%
10%
20%
30%
40%
50%
60%
70%
80%
90%
100%
TD
C 3
Telia
Telia
Tele
nor 3
Tele
nor
Tele
2
Tele
nor
Telia
Telia Ice
DN
A
Elis
a
DK DK DK SE DK SE NO SE SE NO FI NO FI FI
Tu
tela
: C
ore
Co
nsis
ten
t Q
ua
lity
in
co
mm
on
co
ve
rag
e
aa
rea
s
Source data:
Norwegian mobile networks are generally providing a faster download speed than other Nordic
networks. Low mobile data usage contributes to this. It is also likely that Norwegian operators have
invested in capacity currently not fully utilised. With regards to consistent quality, Norwegian
networks are world-class – but so are the networks in Denmark, Sweden and Finland.

tefficient AB www.tefficient.com 22 December 2020 54
Norway has an unusually high share of Apple iPhone in its smartphone base. The sales top list of Telia
Norway in October35 and November36 show just how iPhone-centric Norway is: Apple iPhones are on
positions 1, 2, 3, 4, 5 and 6 (and in November also positions 8 and 9) on Telia’s top 10 list.
Without being able to prove it, Tefficient believes that the average age of the Norwegian smartphone base is
lower than in the other Nordic countries. This is likely an effect of the higher purchasing power in Norway. If
so, this is good news for the average speed of mobile networks; more modern iPhones37 are
providing significantly faster speeds than older iPhones. This is shown by Opensignal in a blog post38 – from
which the following graph is fetched:
Figure 43. How the age of an iPhone correlates with the average download speed [source: Opensignal]
35 https://presse.telia.no/pressreleases/telias-topp-10-oktober-apples-5g-telefoner-rett-inn-paa-pallen-3048045 36 https://presse.telia.no/pressreleases/telias-topp-10-november-apple-befester-sin-posisjon-3055471 37 This is likely true for any smartphone manufacturer as it is mainly an effect of performance improvements in chipsets and design 38 https://www.opensignal.com/2020/09/23/the-5g-iphone-lessons-from-existing-5g-smartphones
tefficient AB www.tefficient.com 22 December 2020 55
13. Conclusions
13.1. Summary of findings so far
This analysis shows that Norwegian revenue per mobile subscription is higher than in Denmark, Sweden and
Finland. The revenue per mobile GB is – after purchasing power adjustment – 2 to 5 times higher in
Norway. This is relatively undisputed. What historically has been discussed is what the root causes to this
are.
When adjusting the revenue of the other countries according to purchase power parity GDP, we can see that
Finnish revenue per subscription roughly matches that of Norway – and that Swedish and Danish revenues
come closer to Norway’s. We therefore find it likely that higher purchasing power is one likely root
cause – but it’s also clear that it is not the only explanation as revenue gaps aren’t entirely closed.
The analysis contains a comparison of current pricing of data-rich plans. When adjusting these for purchase
power parity GDP, Swedish pricing is actually quite similar to Norwegian for data-rich bucket plans (e.g. 30
GB). The Norwegian unlimited plans are still more expensive and more restricted in policy. It nevertheless
supports the conclusion that higher purchasing power contributes to (but doesn’t fully explain) Norway’s
higher mobile revenue.
The narrative that Norway’s lower population density would result in a higher number of sites is not correct
when comparing with Sweden and Finland – only when comparing with Denmark. Norway actually has a
lower number of mobile sites per MNO, per network and per network (if excluding the last entrant) when
comparing with Sweden and Finland. We therefore find it unlikely that Norway’s lower population
density is a root cause to the higher mobile revenue.
In general, we find the notion that the mobile network size should have a major impact on the total costs of
an established operator misconceived. Even if including CAPEX, network costs are merely consuming 22% of
the revenue of the average established Nordic operator. 78% of revenues were used on other cost items
and on profit. Hence we find it unlikely that larger mobile networks are a root cause to Norway’s
higher mobile revenue. (Norway’s mobile networks aren’t larger anyhow). Mobile network sites are
representing a revenue opportunity for operators and are regarded as assets by infrastructure companies.
In the case of Telenor and Telia Norway, high OPEX is an unlikely root cause to Norway’s higher mobile
revenue as these two companies have the highest EBITDA margins in the Nordics. Ice is though having an
EBITDA margin just above zero – in part driven by high OPEX for national roaming.
High CAPEX is a more likely root cause as our analysis shows that Norwegian operators invest more of
their revenue than most other Nordic operators. The largest investor in relation to revenue is however Ice.
When taking both OPEX and CAPEX into account and comparing EBITDA-CAPEX margins, it shows that
Telenor and Telia Norway can very well afford its current level of Networks CAPEX as their EBITDA-CAPEX
margins are higher than the Nordic average. Ice’s situation is again much different.
The least likely root cause for Norway’s higher mobile revenue is mobile data usage. Not only does
Norway have the lowest data usage, it is also growing slower than in Denmark, Sweden and Finland. When
comparing the revenue per mobile subscription with the average mobile data usage, Norway comes out very

tefficient AB www.tefficient.com 22 December 2020 56
unfavourable – from an end-user perspective – with high-to-highest revenue albeit the lowest usage. It’s
likely that the high revenue hampers the Norwegian usage.
Just as the other Nordic markets, Norway has excellent fixed broadband networks. Since there’s no edge
in the availability or speeds of Norwegian fixed broadband, the shape of Norway’s fixed broadband is an
unlikely root cause for the low mobile data usage of Norway and hence an unlikely root cause for the
higher mobile revenue.
A somewhat likelier root cause to the higher mobile revenue is the data speeds on Norwegian mobile
networks – because it indicates that Norwegian operators have invested in capacity currently not fully
utilised. With a more multifaceted comparison of mobile network quality, taking also factors such as latency,
jitter and packet loss into account, we come to a similar conclusion as for the fixed broadband networks;
Norway’s mobile networks are excellent – but so are the networks in Denmark, Sweden and Finland.
The most likely root cause to Norway’s higher mobile revenue is not yet mentioned in our analysis:
13.2. Market concentration
Figure 44 below shows the distribution of mobile service revenue in Norway between the three MNOs
Telenor, Telia and Ice – and other (non-MNO) providers.
Figure 44. Market share in mobile service revenue, Norway [source: NKOM]
56,0% 55,9% 55,9%
33,6% 33,1% 31,4%
6,4% 7,4%8,3%
4,0% 3,7% 4,4%
0%
10%
20%
30%
40%
50%
60%
70%
80%
90%
100%
2018 2019 1H 2020
Ma
rke
t sh
are
, m
ob
ile
se
rvic
e r
eve
nu
e
Others
Ice
Telia
Telenor
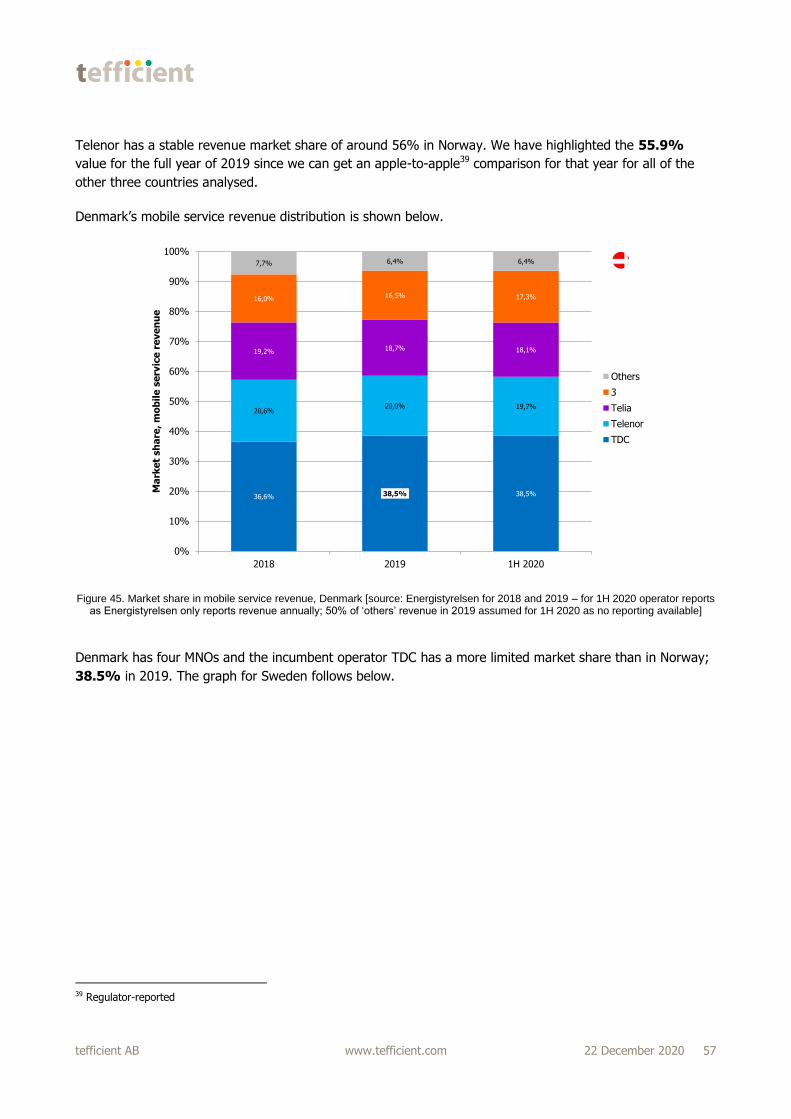
tefficient AB www.tefficient.com 22 December 2020 57
Telenor has a stable revenue market share of around 56% in Norway. We have highlighted the 55.9%
value for the full year of 2019 since we can get an apple-to-apple39 comparison for that year for all of the
other three countries analysed.
Denmark’s mobile service revenue distribution is shown below.
Figure 45. Market share in mobile service revenue, Denmark [source: Energistyrelsen for 2018 and 2019 – for 1H 2020 operator reports as Energistyrelsen only reports revenue annually; 50% of ‘others’ revenue in 2019 assumed for 1H 2020 as no reporting available]
Denmark has four MNOs and the incumbent operator TDC has a more limited market share than in Norway;
38.5% in 2019. The graph for Sweden follows below.
39 Regulator-reported
36,6% 38,5% 38,5%
20,6%20,0% 19,7%
19,2% 18,7% 18,1%
16,0% 16,5% 17,3%
7,7% 6,4% 6,4%
0%
10%
20%
30%
40%
50%
60%
70%
80%
90%
100%
2018 2019 1H 2020
Ma
rke
t sh
are
, m
ob
ile
se
rvic
e r
eve
nu
e
Others
3
Telia
Telenor
TDC

tefficient AB www.tefficient.com 22 December 2020 58
Figure 46. Market share in mobile service revenue, Sweden [source: PTS]
The incumbent in Sweden, Telia, had a 36.2% revenue market share in 2019.
Finally the graph for Finland:
Figure 47. Market share in mobile service revenue, Finland [source: Traficom for 2018 and 2019 – for 1H 2020 operator reports as Traficom only reports revenue annually; 50% of ‘others’ revenue in 2019 assumed for 1H 2020 as no reporting available]
36,3% 36,2% 36,1%
23,0% 23,7% 23,7%
20,7% 21,0% 20,3%
16,0% 15,1% 15,4%
3,9% 4,0% 4,5%
0%
10%
20%
30%
40%
50%
60%
70%
80%
90%
100%
2018 2019 1H 2020
Ma
rke
t sh
are
, m
ob
ile
se
rvic
e r
eve
nu
e
Others
3
Telenor
Tele2
Telia
34,9% 36,2% 35,4%
34,1%35,3% 35,4%
24,5%
26,8% 27,5%
6,5%1,6% 1,6%
0%
10%
20%
30%
40%
50%
60%
70%
80%
90%
100%
2018 2019 1H 2020
Ma
rke
t sh
are
, m
ob
ile
se
rvic
e r
eve
nu
e
Others
DNA
Elisa
Telia
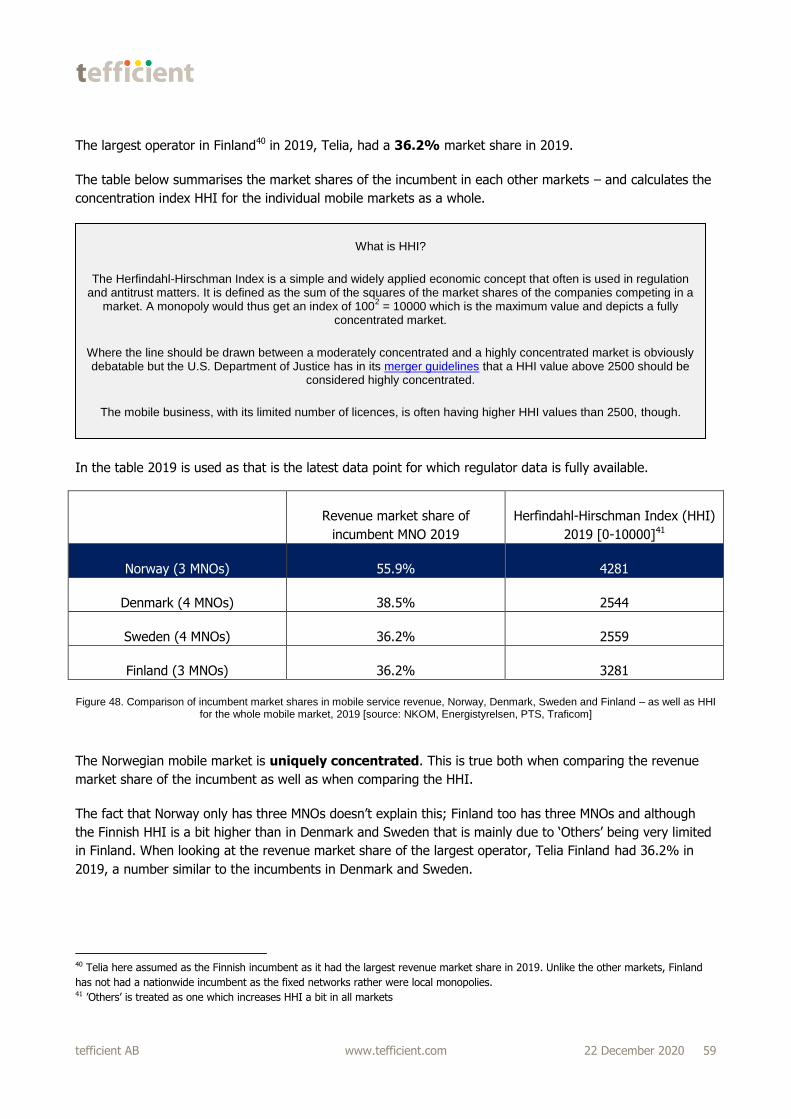
tefficient AB www.tefficient.com 22 December 2020 59
The largest operator in Finland40 in 2019, Telia, had a 36.2% market share in 2019.
The table below summarises the market shares of the incumbent in each other markets – and calculates the
concentration index HHI for the individual mobile markets as a whole.
In the table 2019 is used as that is the latest data point for which regulator data is fully available.
Revenue market share of
incumbent MNO 2019
Herfindahl-Hirschman Index (HHI)
2019 [0-10000]41
Norway (3 MNOs) 55.9% 4281
Denmark (4 MNOs) 38.5% 2544
Sweden (4 MNOs) 36.2% 2559
Finland (3 MNOs) 36.2% 3281
Figure 48. Comparison of incumbent market shares in mobile service revenue, Norway, Denmark, Sweden and Finland – as well as HHI for the whole mobile market, 2019 [source: NKOM, Energistyrelsen, PTS, Traficom]
The Norwegian mobile market is uniquely concentrated. This is true both when comparing the revenue
market share of the incumbent as well as when comparing the HHI.
The fact that Norway only has three MNOs doesn’t explain this; Finland too has three MNOs and although
the Finnish HHI is a bit higher than in Denmark and Sweden that is mainly due to ‘Others’ being very limited
in Finland. When looking at the revenue market share of the largest operator, Telia Finland had 36.2% in
2019, a number similar to the incumbents in Denmark and Sweden.
40 Telia here assumed as the Finnish incumbent as it had the largest revenue market share in 2019. Unlike the other markets, Finland
has not had a nationwide incumbent as the fixed networks rather were local monopolies. 41 ’Others’ is treated as one which increases HHI a bit in all markets
What is HHI?
The Herfindahl-Hirschman Index is a simple and widely applied economic concept that often is used in regulation and antitrust matters. It is defined as the sum of the squares of the market shares of the companies competing in a
market. A monopoly would thus get an index of 1002 = 10000 which is the maximum value and depicts a fully
concentrated market.
Where the line should be drawn between a moderately concentrated and a highly concentrated market is obviously debatable but the U.S. Department of Justice has in its merger guidelines that a HHI value above 2500 should be
considered highly concentrated.
The mobile business, with its limited number of licences, is often having higher HHI values than 2500, though.
tefficient AB www.tefficient.com 22 December 2020 60
Of the HHI for Norway, Telenor’s contribution is 73% (3120 of 4281 HHI points). In comparison TDC’s
contribution to the Danish HHI is 58%, Telia’s 51% to the Swedish HHI and Telia Finland’s 40% to the
Finnish HHI.
The Norwegian mobile market is uniquely concentrated. It is not just explained by the number of
MNOs. Telenor’s market share is behind 73% of Norway’s HHI.
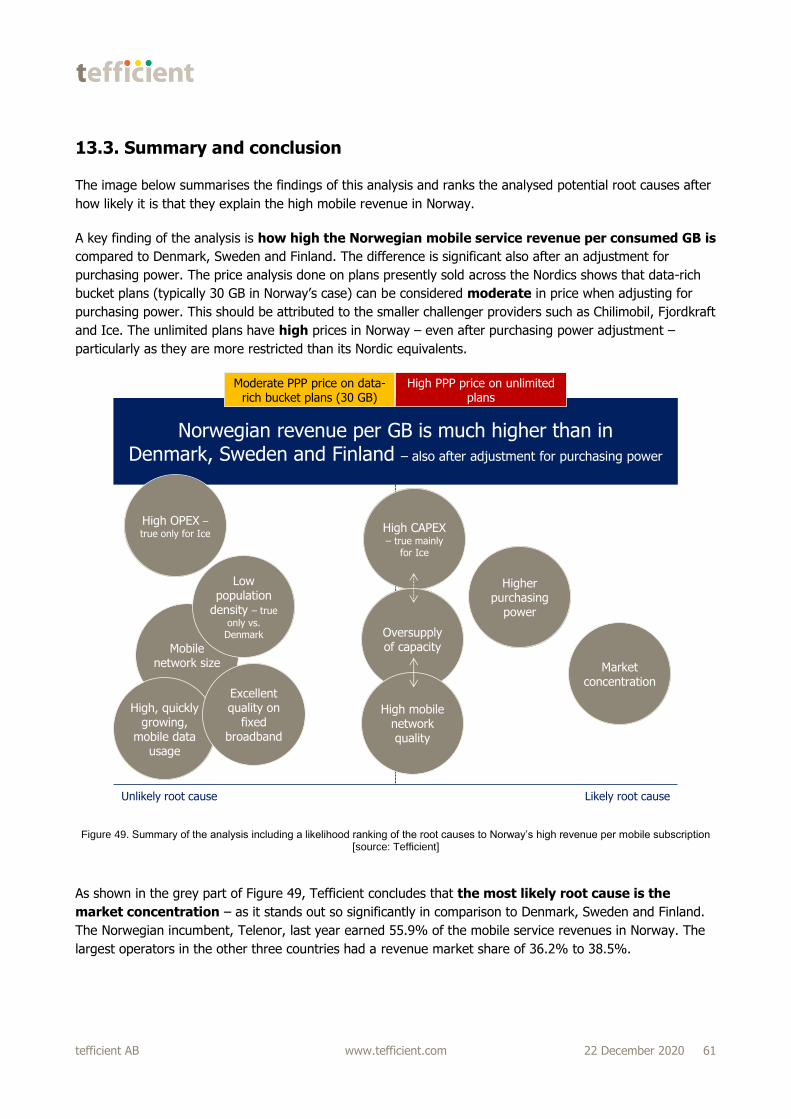
tefficient AB www.tefficient.com 22 December 2020 61
13.3. Summary and conclusion
The image below summarises the findings of this analysis and ranks the analysed potential root causes after
how likely it is that they explain the high mobile revenue in Norway.
A key finding of the analysis is how high the Norwegian mobile service revenue per consumed GB is
compared to Denmark, Sweden and Finland. The difference is significant also after an adjustment for
purchasing power. The price analysis done on plans presently sold across the Nordics shows that data-rich
bucket plans (typically 30 GB in Norway’s case) can be considered moderate in price when adjusting for
purchasing power. This should be attributed to the smaller challenger providers such as Chilimobil, Fjordkraft
and Ice. The unlimited plans have high prices in Norway – even after purchasing power adjustment –
particularly as they are more restricted than its Nordic equivalents.
Figure 49. Summary of the analysis including a likelihood ranking of the root causes to Norway’s high revenue per mobile subscription [source: Tefficient]
As shown in the grey part of Figure 49, Tefficient concludes that the most likely root cause is the
market concentration – as it stands out so significantly in comparison to Denmark, Sweden and Finland.
The Norwegian incumbent, Telenor, last year earned 55.9% of the mobile service revenues in Norway. The
largest operators in the other three countries had a revenue market share of 36.2% to 38.5%.
Norwegian revenue per GB is much higher than inDenmark, Sweden and Finland – also after adjustment for purchasing power
Likely root causeUnlikely root cause
Higher purchasing
power
Mobile network size
High OPEX –true only for Ice
High CAPEX– true mainly
for Ice
High, quickly growing,
mobile data usage
Excellent quality on
fixed broadband
Market concentration
Oversupply of capacity
High mobile network quality
Low population
density – true
only vs. Denmark
Moderate PPP price on data-rich bucket plans (30 GB)
High PPP price on unlimited plans
tefficient AB www.tefficient.com 22 December 2020 62
There are numerous academic studies on price vs. concentration and although science is not always in
agreement, market concentration is often seen as a problem; the disagreements have more been around
how to regulate it. Jean Tirole was in 2014 awarded The Sveriges Riksbank Prize in Economic Sciences in
Memory of Alfred Nobel for his analysis of market power and regulation.
The scientific background42 to this prize provides excellent, balanced, reading.
With market concentration as the most likely root cause, the higher purchasing power in Norway adds
to it. It is however a weaker root cause than the market concentration since an adjustment for purchasing
power doesn’t fully neutralise the differences in revenue and pricing.
Three factors – CAPEX level, oversupply of capacity and high mobile network quality – are
somewhat linked to each other. The high speeds of Norwegian mobile networks suggest an oversupply of
capacity at present, something that likely adds a bit to the CAPEX levels in Norway. There’s merit in the
claim that Norwegian CAPEX levels generally are high, but it’s not a very likely root cause for the high
revenue per GB.
The analysis shows that the other factors – including low population density – are unlikely root causes to
Norway’s higher revenue per GB.
International telco competitiveness specialist providing operators and suppliers with analysis, benchmarks and go-to-
market preparation. Expertise in data monetisation, customer loyalty, Nonstop Retention®, FMC, mobile video, fiber, Wi-
Fi, 5G.
www.tefficient.com
42 https://www.nobelprize.org/uploads/2018/06/advanced-economicsciences2014.pdf
“Many industries are dominated by a small number of large firms or a single monopoly. Left unregulated, such markets often produce socially undesirable results – prices higher than those motivated by costs, or unproductive
firms that survive by blocking the entry of new and more productive ones.
From the mid-1980s and onwards, Jean Tirole has breathed new life into research on such market failures. His analysis of firms with market power provides a unified theory with a strong bearing on central policy questions: how
should the government deal with mergers or cartels, and how should it regulate monopolies?”
Extract from the press release from The Royal Swedish Academy of Science when Jean Triole 2014 was awarded The Sveriges Riksbank Prize in Economic Sciences in Memory of Alfred Nobel