assessment of natural and man-made objects of the river
TRANSCRIPT

Modern Applied Science; Vol. 9, No. 2; 2015 ISSN 1913-1844 E-ISSN 1913-1852
Published by Canadian Center of Science and Education
332
Assessment of Natural and Man-Made Objects of the River Basin in Order to Organize an Environmental Monitoring System
Trifonova Tatiana Anatolievna1, Mishchenko Natalia Vladimirovna2 & Zhogolev Arseniy Vadimovich1
1 Lomonosov Moscow State University, GSP-1, Leninskie Gory, Moscow, Russia 2 Vladimir state university named after Alexander and Nikolay Stoletovs, Russia Correspondence: Mishchenko Natalia Vladimirovna, Vladimir state university named after Alexander and Nikolay Stoletovs, 87 Gorky str, Vladimir, 600000, Russia. E-mail: [email protected] Received: October 15, 2014 Accepted: October 25, 2014 Online Published: January 28, 2015
doi:10.5539/mas.v9n2p332 URL: http://dx.doi.org/10.5539/mas.v9n2p332 Abstract The paper presents the assessment results of the ecological status of natural and man-made objects in the drainage basin of the Sherna river with the help of remote sensing data and the GIS analysis. The scope of remote sensing application for studying ecological state of the river basin is analyzed. The maps of land use and orography are constructed. Based on the data obtained for the Sherna river basin for the first time we offered recommendations for environmental monitoring through an integrated use of remote sensing data.
Keywords: environmental monitoring, catchment area, land use, remote sensing, vegetation index
1. Introduction Ecology of river basins is considered as a relevant interdisciplinary field (Dobrovolsky, G., 2005; Korytny, L., 2001; Kolomyts, E., 2005). River basins are natural and historical territories, united by total catchment network of river valleys and ravines. They are formed because of development of the river catchment network, superimposed on the surface of the Earth's land area. All processes on the territory of river basins are interconnected. This statement gives status of the territorial geo-systems to regional river basin and makes it possible to conduct morphological and topological studies, as well as to interpret development of basins in relation to different natural conditions: climate, geology, vegetation, soil cover, etc. River basins, especially river valleys are areas of the most intense interaction of the naturalistic biosphere and the anthroposphere (primarily technosphere). This interaction in its present form is highly contradictory, often acquiring antagonistic orientation (inundation of floodplains, degradation of aquatic ecosystems, degradation under the influence of industrial and agricultural waste, etc.). The contradictory nature of this impact tends to strengthen as the techno sphere expands.
In this regard, the development of adaptive systems of space use and resources use of river basins conserving their natural ecological functions becomes of particular relevance. Drainage river basin is in fact a fundamental structure in the organization of the earth's surface, including the lithosphere, hydrosphere and biosphere. Therefore, a variety of natural processes and aspects of human activity are correlated with these structures, but so far many of the issues of their development remain unresolved or controversial (Trifonova, T., 2012; Ecology of river basins, 2013).
In complex ecological monitoring the use of remote sensing data (RSD) is growing, this data allows us to quickly assess spatial and temporal dynamics of ecosystem components and extrapolate results of ground-based measurements (Vinogradov, B., 1994; Rachkulik, V., 1981; Surin, V., 2006; Zamyatin, A., 2007; Kravtsov, V., 1995; Bartalev, S., 2005).
Both in Russia and abroad for quantitative characterization of projective vegetation cover of territories vegetation indexes are widely used, they are calculated from remote sensing data (Telesca, L., 2006; Wen, Z., 2006; Gamon, J., 2013; Besk, P., 2011). Techniques for using the NDVI vegetation index is also actively developed to assess forest productivity, management effectiveness, monitoring of forest harvesting, crop estimation of non-timber forest resources and so on.
It should be noted that remote sensing data and GIS are still the most commonly used for studying specific environmental problems of rivers and their basins. There are not enough papers on the comprehensive study of the ecological status of small river basins using remote sensing.

www.ccsenet.org/mas Modern Applied Science Vol. 9, No. 2; 2015
333
The aim of the study was a comprehensive assessment of the ecological status of the Sherna river basin, construction of a series of maps on the state of natural and man-made objects using remote sensing data and elaboration of recommendations to streamline environmental monitoring.
2. Objectives and Methods of the Research The study of natural and man-made objects was held within the boundaries of the Sherna catchment area. Sherna is the river in the Vladimir and Moscow regions of the Russian Federation, a left tributary of Klyazma. The catchment area of the river Sherna is 1820 sq. km. The climate in the basin area is temperate continental, with warm summers and moderately cold winters, and pronounced transitional seasons. The basin is located in the area of sod-podzolic soils of the southern taiga. Vegetation is represented mainly by mixed and pine-birch forests. Along the banks there are meadows, large areas are cultivated. Monitoring the river state is currently being implemented on a single alignment of hydro chemical control. According to the official sources, the water quality in the river Sherna meets quality standards for fishery water bodies (Annual Report, 2011; Resolution of the Head of the Vladimir region #149. (1995, May 6; Drukovsky, S., 2006).
While conducting the research we used the following methods:
1. Natural (field studies) are used to assess the condition of natural and man-made objects and clarify features of remote sensing data interpretation.
2. Space photo delineation The study used the following data of remote sensing (RSD):
• LandSat 5TM/7TM+ from 1986 till 2011;
• Space images resources in 1997;
• SPOT5 in June 2007;
• SRTM-3 – radar scan 2000.
The data deciphering was performed using the following software: Scanex Image Processor 3.7.1, Google.Earth 6, MapInfo Professional 10, Quantum GIS 1.80, EasyTrace 7.99 free and Global Mapper 12.02. We used the field studies data, photographs of the project Google.Earth, maps of the General Staff of 1:100000 and 1:200000, ready vector layers of the project «Open Street Maps» (OSM) to decipher.
Determining the vegetation state was carried out to analyze the Normalized Difference Vegetation Index (NDVI): NDVI = ,
where NIR – the closest infrared channel (4) of the Landsat satellite, and RED - the red satellite channel (3) of the Landsat satellite (NDVI – Theory and Practice, 2008).
To search for dynamically changing objects, we proposed a method for determining the dynamics of the NDVI, based on the summation of the NDVI differences for different dates (further the dynamics method of the index NDVI).
The general formula for calculating the NDVI dynamics: D =∑ |NDVI − NDVI |, where i – the serial number of the satellite image taken by ascending date, N – number of shots.
Based on interpretation of remote sensing we constructed bump maps and land use maps. Table 1 presents the technology for decoding objects. Table 1. Deciphering the natural-man-made objects RSD
Object Examined parameter Used RSD (spectral channels) Deciphering methods
Drainage basin
object boundaries SRTM visual deciphering
Fields
object boundaries Landsat 5/7/8 (1, 2, 3, 4, 5, 7) ISODATA overgrowing NDVI*, Landsat 5/7/8 (4, 3, 2) visual deciphering
surface slope SRTMslope calculation in Scanex Image Processor

www.ccsenet.org/mas Modern Applied Science Vol. 9, No. 2; 2015
334
type of crops NDVI, Landsat 5/7/8 (5, 4, 3) visual deciphering soils condition NDVI, Landsat 5/7/8 (5, 4, 3) visual deciphering
Settlements
object boundaries Landsat 5/7/8 (4, 3, 2; 3, 2, 1) visual deciphering seal and expansion NDVI*, Landsat 5/7/8 (4, 3, 2) visual deciphering Infrastructure (roads, businesses, etc.)
OSMready vector layers in the SHAPE format
Rivers object boundaries OSM, SRTM, SPOT5 (NIR, RED, GREEN)
visual deciphering, automatic tracing EasyTrace
condition of bank vegetation
NDVI*, SPOT5 (PAN, NIR, RED, GREEN) visual deciphering
Other water
objects object boundaries NDVI*, Landsat 5/7/8 (1, 2, 3, 4, 5, 7)
ISODATA, Binary Classifier, visual deciphering
Forests
object boundaries NDVI*, Landsat 5/7/8 (1 ,2, 3, 4, 5, 7) ISODATA logging sites NDVI*, Landsat 5/7/8 (1, 2, 3, 4, 5, 7) ISODATA fire sites Landsat 5/7/8 (7, 5, 4) ISODATA dominating rocks Landsat 5/7/8 (1, 2, 3, 4, 5, 6, 7) ISODATA forest condition NDVI visual deciphering cutting area condition SPOT5 (PAN) visual deciphering
3. Methods of mathematical statistics. To speed up land use maps construction process we used algorithms of automatic clusterisation, images built-in into the programme Scanex Image Processor: ISODATA and Binary Classifier. Space photos cluterisation was performed with the help of ISODATA algorithm with singling out excessive amounts of classes and then combining them by analyzing geo-referenced images and terrain data from the programme Google.Earth (photographs and description of a location, high resolution images).
4. Ecological mapping is based on geo-information systems (MapInfo) and the use of remote sensing data. A series of electronic maps and databases was created; these maps characterize patterns of land use, the condition of natural and man-made objects of the examined small river basin to identify the main factors that determine the environment situation of the area.
3. Results 3.1 The Results of Field Studies on the Sherna Basin Territory
The field studies allowed stating the following environmental problems of the river basin: overgrown fields, overgrown logging sites and illegal dumping grounds in the woods near the settlements (see Figure 1).
а) b)
c) d) Figure 1. Environmental problems in the Klyazma river basin (a – overgrown logging sites, b – overgrown fields,
c – overcrowding of settlements, g – illegal dumping grounds)

www.ccsenet.org/mas Modern Applied Science Vol. 9, No. 2; 2015
335
Also as a result of the field studies we specified features of various objects deciphering. In particular defining the predominance of softwood or hardwood in the forests of the area made it possible to compare them with their space image and to decipher them more accurately.
3.2 The NDVI Dynamics Calculation and the Identification of the Most Significant Trends in the Vegetation State
The NDVI parameter dynamics was calculated from 3 space images Landsat 5TM COP for August 1986, 1991 and 2011.
The particular form of the formula for calculating the NDVI index dynamics: = |( г − г)| + |( г −〖 〗_1986г)| In our study of the NDVI dynamics image, we identified the fastest changing areas of the Sherna river basin. Based on the analysis of the reasons of such NDVI index vegetation changes we detected the most significant ecological processes in the Sherna river basin, associated with changes in vegetation cover. These primarily include the change of crops (Figure 2) and overgrown fields (Figure 3).
The palette for the dynamics image of the NDVI index.
Figure 2. The NDVI dynamics on the example of an overgrown field (shades of green – strong change)
Figure 3. The river Sherna bank near the Sergeevka village

www.ccsenet.org/mas Modern Applied Science Vol. 9, No. 2; 2015
336
3.3 Land Use Structure Mapping
To present the results of deciphering in the program MapInfo we constructed electronic land use maps in 1986 and 2011 (see Figure 4), electronic elevation map.
Figure 4. Land use in the Sherna basin 2011 On the basis of land-use maps and deciphering results of the space images in the Sherna river basin we determined area of the examined objects (Table 2). Table 2. Area of the objects, deciphered from RSD
Objects Total area, sq. km
1986 2011
Water bodies 3 3 Forests with coniferous vegetation predominance 431 483 Forests with deciduous vegetation predominance 635 622 Grass-shrub vegetation and open soil 627 498 Fire sites 0 2 Settlements and industrial zones 128 216 The Sherna river basin 1824 1824
Almost the whole basin area with open soil and grass-shrub vegetation outside settlements relates to agricultural land, so the total area of these sites is approximately equal to the area of agricultural land.

www.ccsenet.org/mas Modern Applied Science Vol. 9, No. 2; 2015
337
4. Discussion The ratio of natural and man-made objects is an important parameter of the river basin state, indicating the extent of human impact on the environment. Forests can be considered as natural objects of the Sherna river basin, fields and settlements – man-made. It is established that the area of settlements and industrial sites on the territory of the Sherna river basin has also increased by 5% for 25 years, the forest area has increased by 2% as well. The agricultural land territory decreased by 7%. Thus, the ratio of strongly and slightly changed natural sites by the year 2011 amounted to 39/61.
The joint analysis of bump maps and land use maps (see Figure 4) shows that watershed areas in the basin are not used in the ecomony, which is, in general, good for the ecological condition of the basin.
With the use of land-use maps, it was found that from 1986 to 2011 the forest area with a predominance of coniferous vegetation had increased by 3% of, therefore, deciduous forest had been replaced by coniferous one for 25 years. The analysis of remote sensing data showed that from 1986 to 2011 there was overgrowth of cuting areas in the woods, at the same time there were virtually no new cuttings from 1986 to 2011.
Space images allow analyzing fire sites in detail, these fire sites formed as a result of forest fires. In 2010, there was an abnormally hot weather and low rainfall. This had led to a huge number of forest and peat fires across the territory of the Russian Federation. All fire sites were near populated areas, so we can assume that the fires occurred mainly due to the human factor. Another feature of the fire sites in 2010 was the fact that the overwhelming number of burnt areas were located near the southern part of the Sherna basin. Most likely, this is due to the fact that there are more large settlements, and the climate is dry. Within the boundaries of the Sherna river basin in 2010, there were no fire sites. However, the entire territory of the basin was filled with smoke heavily. In 2011, one fire site with the area of 2 sq. km. was deciphered in the basin area.
The study showed that the accumulation of coniferous forest stocks and overgrowth of logging sites in the Sherna river basin occurs. However, the data of reconnoitring and the analysis of SPOT5space images indicates that, together with overgrowth of logging, overgrowth of logging sites occurs. This increases the risk of forest fires. Since forest fires are one of the most important factors affecting the state of the environment, there is a need to monitor the effectiveness of fire management activities in forests, in particular, monitor the status of logging sites.
Total area of herbaceous vegetation and open soil in the basin has decreased by 130 sq. km. for 25 years, mainly due to overgrowing fields. Overgrowth of fields occurs in the entire basin.
There is a significant difference of the spectral composition of the space fields image between the beginning of the research period 1986-1991 and its end 2007-2011. In 1986 and 1991 the difference in the spectra of the fields image tells us that crops in those years were in various stages of vegetation. While in 2007 and 2011, most fields images, conversely, have a similar spectrum, the fields image colour indicates that most of the fields 2007 and 2011 were mowed.
The received data suggests that the amount of cultivated crop species decreased. From these statistics, it is known that currently in the Vladimir region mainly industrial crops are grown (Annual Report, 2011). Thus, we can talk about reducing the quality of agriculture due to overgrowth of agricultural land, as well as a decrease in the number of crops grown in the Sherna river basin.
With the use of land-use maps, it was found that the settlements area has increased by 90 sq. km. for 25 years. The expansion of settlements was mainly due to capturing the surrounding farmland.
The space images show that the area covered by vegetation in the settlements has reduced, i.e. overcrowding of the settlements occurs (see Figure 5). This is confirmed by the field studies.
Figure 5. The Fryanovo settlement (left image – 1986, right image – 2011)
www.ccsenet.org/mas Modern Applied Science Vol. 9, No. 2; 2015
338
Increase in the density of settlements can lead to reduced quality of life, problems of organizing dumping grounds. This field studies data confirm the presence of illegal dumping grounds in the woods near the settlements. Dumping grounds in the woods are almost impossible to decipher from RSD.
The reservoirs area has not changed much from 1986 to 2011.
From 1984 to 2011, the NDVI index along the river Shern decreased by 0.1-0.3. This is probably due to the oppression of the wood vegetation on the river banks. Degradation of riparian vegetation leads to the destruction of the riverbanks, reduction of the barrier for harmful substances entry into the river and negative changes in fish fauna habitats.
Thus, the ecological condition of the Sherna river basin is due to the natural environment recovery after a significant decline in rates of logging and agriculture in the 1980s, as well as an increase in population density. The major environmental issue identified by RSD is fields overgrowth.
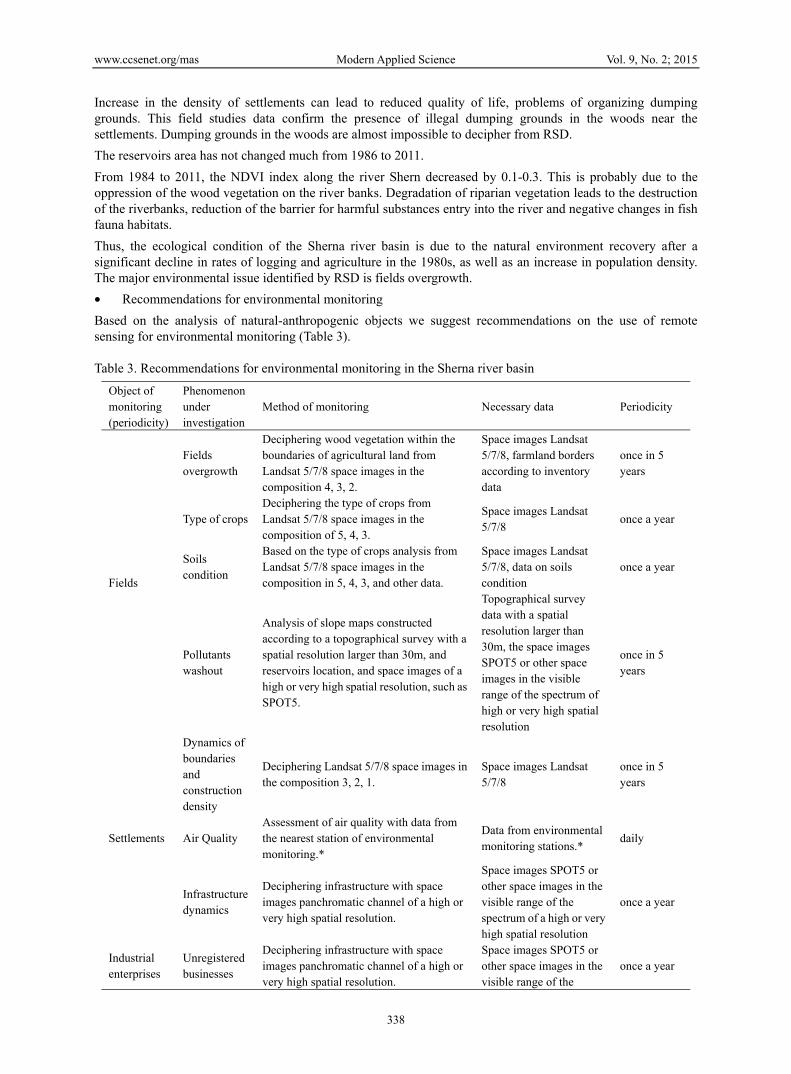
• Recommendations for environmental monitoring
Based on the analysis of natural-anthropogenic objects we suggest recommendations on the use of remote sensing for environmental monitoring (Table 3). Table 3. Recommendations for environmental monitoring in the Sherna river basin
Object of monitoring (periodicity)
Phenomenon under investigation
Method of monitoring Necessary data Periodicity
Fields
Fields overgrowth
Deciphering wood vegetation within the boundaries of agricultural land from Landsat 5/7/8 space images in the composition 4, 3, 2.
Space images Landsat 5/7/8, farmland borders according to inventory data
once in 5 years
Type of crops Deciphering the type of crops from Landsat 5/7/8 space images in the composition of 5, 4, 3.
Space images Landsat 5/7/8
once a year
Soils condition
Based on the type of crops analysis from Landsat 5/7/8 space images in the composition in 5, 4, 3, and other data.
Space images Landsat 5/7/8, data on soils condition
once a year
Pollutants washout
Analysis of slope maps constructed according to a topographical survey with a spatial resolution larger than 30m, and reservoirs location, and space images of a high or very high spatial resolution, such as SPOT5.
Topographical survey data with a spatial resolution larger than 30m, the space images SPOT5 or other space images in the visible range of the spectrum of high or very high spatial resolution
once in 5 years
Settlements
Dynamics of boundaries and construction density
Deciphering Landsat 5/7/8 space images in the composition 3, 2, 1.
Space images Landsat 5/7/8
once in 5 years
Air Quality Assessment of air quality with data from the nearest station of environmental monitoring.*
Data from environmental monitoring stations.*
daily
Infrastructure dynamics
Deciphering infrastructure with space images panchromatic channel of a high or very high spatial resolution.
Space images SPOT5 or other space images in the visible range of the spectrum of a high or very high spatial resolution
once a year
Industrial enterprises
Unregistered businesses
Deciphering infrastructure with space images panchromatic channel of a high or very high spatial resolution.
Space images SPOT5 or other space images in the visible range of the
once a year

www.ccsenet.org/mas Modern Applied Science Vol. 9, No. 2; 2015
339
spectrum of a high or very high spatial resolution
Water and air pollution
Monitoring the quality of water and air with the data from environmental monitoring stations. *
Data of environmental monitoring stations.*
Water monitoring – 2 times a year, air monitoring – every day
Scheduled inspections and environmental monitoring, performed by an enterprise.
Data of environmental inspections and enterprise internal environmental monitoring.
when necessary
Analysis of vegetation condition near an enterprise with space images of a high and very high spatial resolution, analysis of the gradient index of the NDVI index.
Space images SPOT5 or other space images in the visible range of the spectrum of a high or very high spatial resolution.
when necessary
Rivers
Dynamics of a river bed
Deciphering riverbeds by SRTM with specification according to a high or very high spatial resolution in the panchromatic channel or in compositions with the NIR channel.
SRTM, Space images SPOT5 or other space images in the visible range of the spectrum of a high or very high spatial resolution.
once in 5 years
Water quality
Assessment of water quality according to environmental monitoring stations.*
Data of environmental monitoring stations.*
once in 2 years
In addition, it is possible to use multispectral space images of ultrahigh spatial resolution to determine contamination features: oil, fertilizers, surfactants and others. It is not always effective because of high prices for such space images.
Space images of ultrahigh spatial resolution Quickbird, IKONOS and others.
when necessary
River banks and riparian vegetation condition
Deciphering space images of high or very high spatial resolution in the panchromatic channel and in the composition of NIR, RED, GREEN.
Space images SPOT5 or other space images in the visible range of the spectrum of a high or very high spatial resolution
once in 5 years
Other water bodies
Appearance of artificial reservoirs
Deciphering by Landsat 5/7/8 space images in the composition 4, 3, 2.
Space images Landsat 5/7/8
once in 5 years
Water quality One-time water quality analysis. Quality of water samples. when necessary
Forests
Logging Deciphering by Landsat 5/7/8 space images in the composition 4, 3, 2.
Space images Landsat 5/7/8
once a year
Сукцессии на вырубках
Deciphering by Landsat 5/7/8 space images in the composition 4, 3, 2.
Space images Landsat 5/7/8
once in 5 years
State of logging sites
Deciphering space images of a high or very high spatial resolution in the panchromatic channel.
Space images SPOT5 or other space images in the visible range of the spectrum of a high or very high spatial resolution
once in 5 years
Different objects
Fires Monitoring fires 24 hours late with ready MODIS data.
Ready MODIS data ** daily
Fire sites Deciphering by Landsat 5/7/8 space images in the composition 4, 3, 2.
Space images Landsat 5/7/8
when necessary
Ratio of Calculation based on the land use map, Space images Landsat once in 5

www.ccsenet.org/mas Modern Applied Science Vol. 9, No. 2; 2015
340
natural and man-made objects
constructed with the help of deciphering Landsat 5/7/8 space images.
5/7/8 years
* Environmental monitoring stations are suggested in the present research.
** MODIS fire data is available on the websites: FIRMS (Fire Information for Resource Management System (FIRMS), 2012) and the project "Space images of fires" (Space images of fires, 2013). RSD does not allow us to fully estimate the condition of surface waters, and data from one hydro chemical monitoring alignment is insufficient for detection and analysis of pollutants. Therefore, for a more detailed study of the state of the Sherna river water we propose to create a dense network of water status monitoring. The main factors of water pollution in the Sherna river are: domestic wastes, industrial wastes, agricultural water discharge and water withdrawal. Therefore, it is recommended to place observation water quality points downstream of the largest settlements and farmland.
As heavy smoke occurred several times in the study area, therefore information on the air state of the largest settlements is useful for a more detailed study of this environmental problem.
Based on the above, it was proposed to establish 11 water condition observation points and 6 air condition observation points. While compiling a network of environmental monitoring all possible factors of water pollution and air pollution of the Sherna river basin were not taken into account. For example, we did not take into account the impact of industrial enterprises on air pollution. In addition, a detailed analysis of the types of possible contaminants and their features was not carried out. Therefore, a further elaboration of the proposed network of environmental monitoring with a more complete view of the factors affecting the ecological status of the Sherna river basin is required.
5. Conclusion A method for determining the NDVI index dynamics for the analysis of time series of satellite images based on fixing the differences of NDVI images is elaborated. Thanks to the use of this method, we revealed spatial changes of the examined objects boundaries and localization of ecological processes affecting the examined objects.
We assessed the state of the natural-anthropogenic objects within the boundaries of the Sherna river catchment using remote sensing. The analysis of the data showed that the ecological condition of the Sherna river basin is due to the natural environment recovery after a significant decline in rates of logging and agriculture in the 1980s, as well as an increase in population density. On the basin territory overgrowth of logging and cutting areas in the forests occurs, which may lead to increased risk of forest fires. On 3% of the Sherna river basin territory, forest area dominates with the increased amount of coniferous vegetation. Throughout the Sherna river basin overgrowth of farmland occurs, the number of cultivated crops decreases.
In general, anthropogenic pressure on the basin territory is currently the optimal one: about 40% of the territory is intensely developed, which supposes normal functioning of natural ecosystems.
We elaborated recommendations for environmental monitoring of the Sherna river basin with the help of remote sensing data. A provisional map of the location of environmental monitoring observation points in the study area is constructed. However, its further elaboration is necessary with a more complete account of the factors affecting the ecological status of the Sherna river basin. The proposed guidelines can be used to study other river basins, after revising, taking into account the specifics of their territory. In the future we plan to continue our work in developing a unified network of monitoring small river basins within the boundaries of the Kliazma river basin.
Acknowledgements The scientific publication is a part of the state task VlSU № 37.2108.2014/K to perform public works in the field of scientific activity.
References Annual Report "On the state of the environment and public health of the Vladimir region in 2011". (2012). (19th
ed.). Vladimir.
Bartalev, S., & Lupian, E. (2005). Satellite monitoring of boreal ecosystems. Nature, 9, 44-53.
Besk, P., & Goetz, S. (2011). Satellite observation of high northen latitude vegetation productivity changes

www.ccsenet.org/mas Modern Applied Science Vol. 9, No. 2; 2015
341
between 1982 and 2008: Ecological variability and regional difference. Environmental Research letters, 6, 10. http://dx.doi.org/10.1088/1748-9326/6/4/045501.
Dobrovolsky, G. (2005). Floodplains soils of the Russian Plain center. Moscow: Moscow State University.
Drukovsky, S. (2006). Animal health and ecological characteristics of fishery ponds in the Moscow region. Dissertation of the candidate of veterinary sciences, Moscow.
Fire Information for Resource Management System (FIRMS). (n./d.). Retrieved April 20, 2012, from http://earthdata.nasa.gov/data/near-real-time-data/firms/
Gamon, J., Huemmrich, F., Stone, R., & Tweedie, C. (2013). Spatial and temporal variation in primary production (NDVI) of coastal Alaskan tundra: Decreased vegetation growth following earlier snowmelt. Remote sensing of environment, 129, 144-153.
Kolomyts, E. (2005). Boreal ecotone and geographic segmentation: atlas-monograph. Moscow: Nauka.
Korytny, L. (2001). Basin concept in wildlife management. Irkutsk: Publishing House of the Institute of Geography of the Russian Academy of Sciences.
Kravtsov, V. (1995). In Knizhnikov, Y. (Ed.), Space Methods for mapping. Moscow.
NDVI – theory and practice. (2008). GIS-Lab: Geographic information systems and remote sensing. Retrieved September 23, 2014, from http://gis-lab.info/qa/ndvi.html
Rachkulik, V., & Sitnikov, M. (1981). Reflection properties and the vegetation cover condition. Gidrometeoizdat.
Resolution of the Head of the Vladimir region "On the hydrochemical monitoring of surface waters in the Vladimir region" #149. (1995, May 6).
Satellite images of fires. (n./d.). Retrieved May 20, 2013, from http://fires.kosmosnimki.ru
Surin, V., & Shubin, M. (2006). Monitoring of natural and man-made systems for satellite images. Optical Magazine, 4(73), 88-92.
Telesca, L., & Lasaponara, R. (2006, September 28-30). Descended fluctuation analysis for evaluation post-fire induced variability from satellite temporal series. Second Workshop of the EARSel SIG on Land Use and Land Cover, Bonn.
Trifinova, T. (2013). Ecology of river basins. Proceedings of the 5th Intern. science-to-practice. conf. Vladimir: Vladimir State University.
Trifonova, T., Shirkin, L., & Mishchenko, N. (2012). Simulation of stationary states of a phitocenosis-soil system based on the example of the Klyaz’ma river basin. Eurasian soil science, 8(45), 793-801.
Vinogradov, B. (1994). Aerospace Survey as an environmental control tool. Herald of the RAS, 5(64), 417-424.
Wen, Z. (2006, September 28-30). A new classification method: A case study on vegetation classification by using spot vegetation data in East Asia. Second Workshop of the EARSel SIG on Land Use and Land Cover, Bonn.
Zamyatin, A. (2007). Analysis of the Earth's surface dynamics using remote sensing data. Moscow: FIZMATLIT.
Copyrights Copyright for this article is retained by the author(s), with first publication rights granted to the journal.
This is an open-access article distributed under the terms and conditions of the Creative Commons Attribution license (http://creativecommons.org/licenses/by/3.0/).