assessment of four molecular markers as potential dna ... · barcodes for red algae kappaphycusdoty...
TRANSCRIPT

Assessment of Four Molecular Markers as Potential DNABarcodes for Red Algae Kappaphycus Doty andEucheuma J. Agardh (Solieriaceae, Rhodophyta)Ji Tan1,2, Phaik-Eem Lim1,2*, Siew-Moi Phang1,2, Dang Diem Hong3, H. Sunarpi4, Anicia Q. Hurtado5
1 Institute of Biological Sciences, University of Malaya, Kuala Lumpur, Malaysia, 2 Institute of Ocean and Earth Sciences (IOES), University of Malaya, Kuala Lumpur,
Malaysia, 3 Institute of Biotechnology, Vietnamese Academy of Science and Technology, Cau Giay, Hanoi, Vietnam, 4 Faculty of Science and Mathematics, Mataram
University, Mataram, Lombok, Indonesia, 5 Integrated Services for the Development of Aquaculture and Fisheries, Tabuc Suba, Iliolo City, Philippines
Abstract
DNA barcoding has been a major advancement in the field of taxonomy, seeing much effort put into the barcoding of widetaxa of organisms, macro and microalgae included. The mitochondrial-encoded cox1 and plastid-encoded rbcL has beenproposed as potential DNA barcodes for rhodophytes, but are yet to be tested on the commercially importantcarrageenophytes Kappaphycus and Eucheuma. This study gauges the effectiveness of four markers, namely themitochondrial cox1, cox2, cox2-3 spacer and the plastid rbcL in DNA barcoding on selected Kappaphycus and Eucheumafrom Southeast Asia. Marker assessments were performed using established distance and tree-based identification criteriafrom earlier studies. Barcoding patterns on a larger scale were simulated by empirically testing on the commonly used cox2-3 spacer. The phylogeny of these rhodophytes was also briefly described. In this study, the cox2 marker which satisfies theprerequisites of DNA barcodes was found to exhibit moderately high interspecific divergences with no intraspecificvariations, thus a promising marker for the DNA barcoding of Kappaphycus and Eucheuma. However, the already extensivelyused cox2-3 spacer was deemed to be in overall more appropriate as a DNA barcode for these two genera. On a wider scale,cox1 and rbcL were still better DNA barcodes across the rhodophyte taxa when practicality and cost-efficiency were takeninto account. The phylogeny of Kappaphycus and Eucheuma were generally similar to those earlier reported. Still, theapplication of DNA barcoding has demonstrated our relatively poor taxonomic comprehension of these seaweeds, thussuggesting more in-depth efforts in taxonomic restructuring as well as establishment.
Citation: Tan J, Lim P-E, Phang S-M, Hong DD, Sunarpi H, et al. (2012) Assessment of Four Molecular Markers as Potential DNA Barcodes for Red AlgaeKappaphycus Doty and Eucheuma J. Agardh (Solieriaceae, Rhodophyta). PLoS ONE 7(12): e52905. doi:10.1371/journal.pone.0052905
Editor: Sofia Consuegra, Aberystwyth University, United Kingdom
Received September 7, 2012; Accepted November 23, 2012; Published December 20, 2012
Copyright: � 2012 Tan et al. This is an open-access article distributed under the terms of the Creative Commons Attribution License, which permits unrestricteduse, distribution, and reproduction in any medium, provided the original author and source are credited.
Funding: Project funding is by the E-Science Fund, Project No. 14-02-03-4027, Department of Fisheries Malaysia (53-02-03-1062) and University of Malaya Malaya,PPP (Phylogenetic analysis of Kappaphycus spp. and Eucheuma spp. with the application of various molecular markers; grant number: PV014/2011A). The fundershad no role in study design, data collection and analysis, decision to publish, or preparation of the manuscript.
Competing Interests: The authors have declared that no competing interests exist.
* E-mail: [email protected]
Introduction
The introduction of DNA barcodes by Herbert and co-workers
[1,2,3] has brought about large impacts on the advancement of
systematic biology; where short, easily amplified regions of DNA
exhibiting large variation among species, yet sufficiently variable
within species, are constantly used for species delineation,
identification as well as archiving with reference to known,
established species [4,5,6]. The Barcode of Life Data System
(BOLD) is notably the largest initiative in establishing a worldwide
DNA barcode library, signifying its importance and popularity for
the scientific community [7,8,9]. The usefulness of DNA
barcoding is evident when dealing with taxa displaying phenotypic
plasticity throughout diphasic or triphasic life cycles as well as taxa
involving cryptic species. These phenomena are generally
predominant in marine macroalgae, thereby enticing the applica-
tion of DNA barcoding, as reported in numerous studies
encompassing the order Gelidiales [10], Gigartinales, [11,12,13],
Graciliariales [14,15], Laminariales [16], and Fucales [17]. Studies
on DNA barcoding over broader taxa of rhodophytes have also
been reported with promising results [18,19,20].
The rhodophytes Kappaphycus and Eucheuma, commercially
known as ‘‘cottonii’’ and ‘‘spinosum’’, respectively are widely
established as lucrative sources of carrageenan, with Indonesia and
the Philippines being the largest carrageenophyte producers
worldwide [21]. Despite being extensively farmed, the morpho-
logically diverse nature of Kappaphycus and Eucheuma still poses
difficulties in species identification [22,23,24,25,26,27,28], even
leading to the cultivation of mixed populations that inevitably
reduces overall yield [29]. These have resulted in the subsequent
employment of molecular phylogenetic studies which all share one
main objective – to infer and understand the phylogenetic
relationships between Kappaphycus and Eucheuma congeners. As of
now, various molecular markers have been introduced for the
molecular taxonomy of these carrageenophytes, namely the
mitochondrial-encoded partial cox1 and cox2-3 spacer, nuclear-
encoded ribosomal Internal Transcribed Spacer (ITS) and 28S
large subunit (LSU), plastid-encoded rbcL, RuBisCO spacer and
the 23S Universal Plastid Amplicon (UPA) [23,28,30,31]. How-
ever, the suitability of these genetic markers as DNA barcodes are
to date, unassessed.
PLOS ONE | www.plosone.org 1 December 2012 | Volume 7 | Issue 12 | e52905

Ta
ble
1.
De
tails
of
sam
ple
su
sed
inth
isst
ud
y.
No
.S
am
ple
Na
me
Op
era
tio
na
lT
ax
on
om
icU
nit
(OT
U)
Sa
mp
lin
gL
oca
tio
nC
oll
ect
ion
Co
de
Ge
nB
an
kA
cce
ssio
nN
um
be
rs
Co
x1C
ox2
-3sp
ace
rC
ox2
rbcL
1K
ap
pa
ph
ycu
sa
lva
rezi
i1
3‘‘B
ua
ya’’
*K
A1
Sab
ang
kat,
Sab
ah,
Mal
aysi
aP
SM1
19
96
-UM
SS0
14
4-
JN6
63
76
2-
-
2K
ap
pa
ph
ycu
sa
lva
rezi
i1
8‘‘T
am
ba
lan
gG
ian
t’’
*Sa
ban
gka
t,Sa
bah
,M
alay
sia
PSM
12
00
1-U
MSS
01
54
-JN
66
37
68
--
3K
ap
pa
ph
ycu
sa
lva
rezi
i5
2‘‘B
ua
ya’’
*O
mad
al,
Sab
ah,
Mal
aysi
aP
SM1
20
29
-UM
SS0
19
6-
JN6
63
76
3-
-
4K
ap
pa
ph
ycu
sa
lva
rezi
i5
3‘‘T
an
ga
n-t
an
ga
n’’
*O
mad
al,
Sab
ah,
Mal
aysi
aP
SM1
20
30
-UM
SS0
19
8-
JN6
63
77
3-
-
5K
ap
pa
ph
ycu
sa
lva
rezi
i5
8‘‘T
an
ga
n-t
an
ga
n’’
*O
mad
al,
Sab
ah,
Mal
aysi
aP
SM1
20
35
-UM
SS0
20
3JX
62
40
14
JN6
63
77
4JX
62
40
43
JX6
23
98
5
6K
ap
pa
ph
ycu
sa
lva
rezi
i6
3‘‘T
am
ba
lan
gG
ian
t’’
Sisi
pan
,Sa
bah
,M
alay
sia
PSM
12
04
3-U
MSS
02
14
JN6
63
76
9-
7K
ap
pa
ph
ycu
sa
lva
rezi
i8
9‘‘T
am
ba
lan
gB
row
n’’
*Sa
nd
akan
,Sa
bah
,M
alay
sia
PSM
12
05
9-U
MSS
02
30
JX6
24
01
5JN
66
37
66
JX6
24
04
4JX
62
39
86
8K
ap
pa
ph
ycu
sa
lva
rezi
i1
03
*Sa
ban
gka
t,Sa
bah
,M
alay
sia
PSM
12
07
2-U
MSS
02
43
JX6
24
01
6JN
66
37
76
JX6
24
04
5JX
62
39
87
9K
ap
pa
ph
ycu
sa
lva
rezi
i1
09
‘‘Ta
ng
an
-ta
ng
an
’’Se
mp
orn
a,Sa
bah
,M
alay
sia
PSM
12
07
8-U
MSS
02
49
-JN
66
37
75
--
10
Ka
pp
ap
hyc
us
alv
are
zii
12
1‘‘T
am
ba
lan
gG
ree
n’’
*P
ang
kor
Isla
nd
,P
era
k,M
alay
sia
PSM
12
10
5-U
MSS
02
60
JX6
24
01
7JN
66
37
72
JX6
24
04
6JX
62
39
88
11
Ka
pp
ap
hyc
us
alv
are
zii
12
3‘‘T
am
ba
lan
gB
row
n’’
*P
ang
kor
Isla
nd
,P
era
k,M
alay
sia
PSM
12
10
7-U
MSS
02
62
-JN
66
37
67
--
12
Ka
pp
ap
hyc
us
alv
are
zii
BA
*Se
mp
orn
a,Sa
bah
,M
alay
sia
--
JN2
34
76
0-
-
13
Ka
pp
ap
hyc
us
alv
are
zii
BN
*Se
mp
orn
a,Sa
bah
,M
alay
sia
--
JN2
34
75
9-
-
14
Ka
pp
ap
hyc
us
alv
are
zii
YF*
Sem
po
rna,
Sab
ah,
Mal
aysi
a-
-JN
23
47
62
--
15
Ka
pp
ap
hyc
us
alv
are
zii
43
3T
elu
kEk
as,
Ind
on
esi
aP
SM1
22
90
-UM
SS0
43
3JX
62
40
18
JX6
24
07
2JX
62
40
47
JX6
23
98
9
16
Ka
pp
ap
hyc
us
alv
are
zii
ZA
M4
‘‘Milo
’’Z
amb
oan
ga
Cit
y,M
ind
anao
,P
hili
pp
ine
sA
QH
ZA
M0
04
-UM
SS0
38
0JX
62
40
19
JX6
24
07
3JX
62
40
48
JX6
23
99
0
17
Ka
pp
ap
hyc
us
alv
are
zii
V7
‘‘Dar
kG
ree
n’’
Son
Hai
,V
ietn
amP
SM1
23
80
-UM
SS0
52
5JX
62
40
20
JX6
24
07
4JX
62
40
49
JX6
23
99
1
18
Ka
pp
ap
hyc
us
alv
are
zii
E3*
Ve
ne
zue
la-
-A
Y6
87
42
7-
-
19
Ka
pp
ap
hyc
us
alv
are
zii
26
14
*H
awai
i-
-FJ
55
48
62
--
20
Ka
pp
ap
hyc
us
alv
are
zii
UR
13
*T
anza
nia
--
JQ7
13
90
2-
-
21
Ka
pp
ap
hyc
us
alv
are
zii
E13
0*
KA
2T
anza
nia
--
AY
68
74
27
--
22
Ka
pp
ap
hyc
us
alv
are
zii
Re
ef4
*P
aje
-Jam
bia
ni,
Tan
zan
ia-
-JQ
71
39
01
--
23
Ka
pp
ap
hyc
us
alv
are
zii
E16
*M
adag
asca
r-
-A
Y6
87
43
0-
-
24
Ka
pp
ap
hyc
us
alv
are
zii
E57
*K
A3
Haw
aii
--
AY
68
74
32
--
25
Ka
pp
ap
hyc
us
alv
are
zii
E71
*H
awai
i-
-A
Y6
87
43
3-
-
26
Ka
pp
ap
hyc
us
alv
are
zii
91
9*
Haw
aii
--
FJ5
54
86
0-
-
27
Ka
pp
ap
hyc
us
alv
are
zii
39
55
*H
awai
i-
-FJ
55
48
61
--
28
Ka
pp
ap
hyc
us
stri
atu
m1
‘‘Ye
llow
Flo
we
r’’
*K
S1Sa
ban
gka
t,Sa
bah
,M
alay
sia
PSM
11
98
4-U
MSS
01
28
JX6
24
02
1JN
66
37
79
JX6
24
05
0JX
62
39
92
29
Ka
pp
ap
hyc
us
stri
atu
m3
1‘‘G
ree
nFl
ow
er’
’*
Sab
ang
kat,
Sab
ah,
Mal
aysi
aP
SM1
20
11
-UM
SS0
17
0JX
62
40
22
JN6
63
78
0JX
62
40
51
JX6
23
99
3
30
Ka
pp
ap
hyc
us
stri
atu
m5
9‘‘G
ree
nFl
ow
er’
’*
Bu
m-B
um
Isla
nd
,M
alay
sia
PSM
12
03
9-U
MSS
02
08
JX6
24
02
3JN
66
37
77
JX6
24
05
2JX
62
39
94
31
Ka
pp
ap
hyc
us
stri
atu
m6
0‘‘G
ree
nFl
ow
er’
’*
Bu
m-B
um
Isla
nd
,M
alay
sia
PSM
12
04
0-U
MSS
02
09
-JN
66
37
78
--
32
Ka
pp
ap
hyc
us
stri
atu
mA
G*
Sem
po
rna,
Sab
ah,
Mal
aysi
a-
-JN
23
47
63
--
33
Ka
pp
ap
hyc
us
stri
atu
mG
F*Se
mp
orn
a,Sa
bah
,M
alay
sia
--
JN2
34
76
5-
-
DNA Barcoding of Kappaphycus and Eucheuma
PLOS ONE | www.plosone.org 2 December 2012 | Volume 7 | Issue 12 | e52905

Ta
ble
1.
Co
nt.
No
.S
am
ple
Na
me
Op
era
tio
na
lT
ax
on
om
icU
nit
(OT
U)
Sa
mp
lin
gL
oca
tio
nC
oll
ect
ion
Co
de
Ge
nB
an
kA
cce
ssio
nN
um
be
rs
Co
x1C
ox2
-3sp
ace
rC
ox2
rbcL
34
Ka
pp
ap
hyc
us
stri
atu
mG
TF*
Sem
po
rna,
Sab
ah,
Mal
aysi
a-
-JN
23
47
64
--
35
Ka
pp
ap
hyc
us
stri
atu
m4
60
Ke
rtas
ari,
Ind
on
esi
aP
SM1
22
93
-UM
SS0
46
0JX
62
40
24
JX6
24
07
5JX
62
40
53
JX6
23
99
5
36
Ka
pp
ap
hyc
us
stri
atu
mG
UI4
‘‘Co
tto
nii’
’G
uim
aras
Is.
Pan
ay,
Ph
ilip
pin
es
AQ
HG
UI0
04
-UM
SS0
36
0JX
62
40
25
JX6
24
07
6JX
62
40
54
JX6
23
99
6
37
Ka
pp
ap
hyc
us
stri
atu
mSI
T5
‘‘Co
tto
nii
ligh
tg
ree
n(s
aco
l)’’
Sita
ng
kai,
Taw
iM
ind
anao
,P
hili
pp
ine
sA
QH
SIT
00
5-U
MS
S03
94
JX6
24
02
6JX
62
40
77
JX6
24
05
5JX
62
39
97
38
Ka
pp
ap
hyc
us
stri
atu
mV
6‘‘P
aya
kaG
ree
n’’
Cam
Ran
h,
Vie
tnam
PSM
12
37
9-U
MSS
05
24
JX6
24
02
7JX
62
40
78
JX6
24
05
6JX
62
39
98
39
Ka
pp
ap
hyc
us
stri
atu
mE8
9*
Ph
ilip
pin
es
--
AY
68
74
34
--
40
Ka
pp
ap
hyc
us
stri
atu
m8
3*
KS2
Sab
ang
kat,
Sab
ah,
Mal
aysi
aP
SM1
20
53
-UM
SS0
22
4JX
62
40
28
JN6
63
78
1JX
62
40
57
JX6
23
99
9
41
Ka
pp
ap
hyc
us
stri
atu
m9
8*
Sab
ang
kat,
Sab
ah,
Mal
aysi
aP
SM1
20
67
-UM
SS0
23
8JX
62
40
29
JN6
63
78
2JX
62
40
58
JX6
24
00
0
42
Ka
pp
ap
hyc
us
stri
atu
m1
05
*Sa
ban
gka
t,Sa
bah
,M
alay
sia
PSM
12
07
4-U
MSS
02
45
JX6
24
03
0JN
66
37
83
JX6
24
05
9JX
62
40
01
43
Ka
pp
ap
hyc
us
stri
atu
mD
13
*Se
mp
orn
a,Sa
bah
,M
alay
sia
--
JN6
45
17
7-
-
44
Ka
pp
ap
hyc
us
stri
atu
mD
14
*Se
mp
orn
a,Sa
bah
,M
alay
sia
--
JN6
45
17
8-
-
45
Ka
pp
ap
hyc
us
stri
atu
mSI
T4
‘‘Ka
b-k
ab
gre
en
’’Si
tan
gka
i,T
awi
Min
dan
ao,
Ph
ilip
pin
es
AQ
HSI
T0
04
-UM
SS0
39
3JX
62
40
31
JX6
24
07
9JX
62
40
60
JX6
24
00
2
46
Ka
pp
ap
hyc
us
stri
atu
mE1
17
*In
do
ne
sia
--
AY
68
74
35
--
47
Ka
pp
ap
hyc
us
stri
atu
mE4
8*
Ind
on
esi
a-
-A
Y6
87
43
1-
-
48
Ka
pp
ap
hyc
us
sp.
14
‘‘Ari
ng
-ari
ng
’’*
KA
rSa
ban
gka
t,Sa
bah
,M
alay
sia
PSM
11
99
7-U
MSS
01
46
-JN
66
37
84
--
49
Ka
pp
ap
hyc
us
sp.
49
‘‘Ari
ng
-ari
ng
’’*
Sab
ang
kat,
Sab
ah,
Mal
aysi
aP
SM1
20
26
-UM
SS0
19
2JX
62
40
32
JN6
63
78
5JX
62
40
61
JX6
24
00
3
50
Ka
pp
ap
hyc
us
sp.
93
‘‘Ari
ng
-ari
ng
’’*
Sab
ang
kat,
Sab
ah,
Mal
aysi
aP
SM1
20
63
-UM
SS0
23
4JX
62
40
33
JN6
63
78
6JX
62
40
62
JX6
24
00
4
51
Ka
pp
ap
hyc
us
sp.
11
5‘‘A
rin
g-a
rin
g’’
Sab
ang
kat,
Sab
ah,
Mal
aysi
aP
SM1
21
00
-UM
SS0
25
5JX
62
40
34
JX6
24
08
0JX
62
40
63
JX6
24
00
5
52
Euch
eum
ad
enti
cula
tum
44
‘‘Sp
ino
sum
’’*
ED1
Sab
ang
kat,
Sab
ah,
Mal
aysi
aP
SM1
20
21
-UM
SS0
18
7JX
62
40
35
JN6
63
78
7JX
62
40
64
JX6
24
00
6
53
Euch
eum
ad
enti
cula
tum
45
‘‘Sp
ino
sum
’’*
Sab
ang
kat,
Sab
ah,
Mal
aysi
aP
SM1
20
22
-UM
SS0
18
8JX
62
40
36
JN6
63
78
8JX
62
40
65
JX6
24
00
7
54
Euch
eum
ad
enti
cula
tum
46
‘‘Sp
ino
sum
’’*
Sab
ang
kat,
Sab
ah,
Mal
aysi
aP
SM1
20
23
-UM
SS0
18
9-
JN6
63
78
9-
-
55
Euch
eum
ad
enti
cula
tum
56
‘‘Sp
ino
sum
’’*
Om
adal
,Sa
bah
,M
alay
sia
PSM
12
03
3-U
MSS
02
01
JX6
24
03
7JN
66
37
90
JX6
24
06
6JX
62
40
08
56
Euch
eum
ad
enti
cula
tum
57
‘‘Sp
ino
sum
’’*
Om
adal
,Sa
bah
,M
alay
sia
PSM
12
03
4-U
MSS
02
02
-JN
66
37
91
--
57
Euch
eum
ad
enti
cula
tum
99
‘‘Sp
ino
sum
’’*
Sab
ang
kat,
Sab
ah,
Mal
aysi
aP
SM1
20
68
-UM
SS0
23
9-
JN6
63
79
2-
-
58
Euch
eum
ad
enti
cula
tum
DM
*Se
mp
orn
a,Sa
bah
,M
alay
sia
--
JN2
34
75
6-
-
59
Euch
eum
ad
enti
cula
tum
AD
*Se
mp
orn
a,Sa
bah
,M
alay
sia
--
JN9
80
40
3-
-
60
Euch
eum
ad
enti
cula
tum
AB
*Se
mp
orn
a,Sa
bah
,M
alay
sia
--
JN2
34
75
8-
-
61
Euch
eum
ad
enti
cula
tum
E13
*In
do
ne
sia
--
AY
68
74
29
--
62
Euch
eum
ad
enti
cula
tum
45
4ED
2K
ert
asar
i,In
do
ne
sia
PSM
12
29
2-U
MSS
04
54
JX6
24
03
8JX
62
40
81
JX6
24
06
7JX
62
40
09
63
Euch
eum
ad
enti
cula
tum
BO
H5
‘‘Sp
ino
sum
’’B
oh
ol,
Ce
ntr
alV
isay
as,
Ph
ilip
pin
es
AQ
HB
OH
00
5-U
MSS
03
71
JX6
24
03
9JX
62
40
82
JX6
24
06
8JX
62
40
10
64
Euch
eum
ad
enti
cula
tum
41
‘‘Ca
cin
g’’
Sab
ang
kat,
Sab
ah,
Mal
aysi
aP
SM1
20
18
-UM
SS0
18
1JX
62
40
40
JX6
24
08
3JX
62
40
69
JX6
24
01
1
65
Euch
eum
ad
enti
cula
tum
42
‘‘Ca
cin
g’’
Sab
ang
kat,
Sab
ah,
Mal
aysi
aP
SM1
20
19
-UM
SS0
18
3JX
62
40
41
JX6
24
08
4JX
62
40
70
JX6
24
01
2
DNA Barcoding of Kappaphycus and Eucheuma
PLOS ONE | www.plosone.org 3 December 2012 | Volume 7 | Issue 12 | e52905

Having high quality DNA barcodes for Kappaphycus and
Eucheuma would hasten the identification and recording of these
seaweeds throughout the globe, particularly those within Southeast
Asian waters, where it is believed that many species are yet to be
described. Accurate identification of undescribed species would be
most useful in developing improved commercial varieties, prefer-
ably ones with higher carrageenan yield, faster growth as well as
better disease resistance. Apart from species diversity, data on the
distribution of Kappaphycus and Eucheuma would also be useful in the
detection of invasive strains [23,32]. The potential benefits of
DNA barcoding for Kappaphycus and Eucheuma underline the main
purpose of the present study, which is to gauge the efficacy of four
molecular markers, including the commonly used mitochondrial
cox1 and plastid rbcL barcodes, the mitochondrial cox2-3 spacer
and a newly designed cox2 molecular marker as potential DNA
barcodes for selected Kappaphycus and Eucheuma specimens found in
Southeast Asia. Marker assessment and comparison were carried
out using the tree-based DNA identification technique as well as
the distance technique- Best Match (BM), Best Close Match (BCM)
and All Species Barcodes (ASB) criteria [1,33]. Additionally, the effect
of larger datasets on the accuracy and robustness of DNA
barcoding was assessed by incorporating sequences of the widely
used cox2-3 spacer marker which includes specimens collected
from different parts of the world, to that generated in the present
study.
Materials and Methods
Ethics StatementKappaphycus and Eucheuma specimens were not collected from
any national parks or protected areas, thus not requiring any
specific permits for sampling. Specimens were collected from open
coastal areas as well as from aquaculture sites with consents from
the respective owners. Members of the two genera are not
endangered or protected species.
Sample ProcessingDetails of samples used in this study are summarized in Table 1.
Specimens were either sampled directly from farms, retrieved via
snorkeling or scuba diving. Sample preservation and genomic
DNA extraction were based on protocols described by [29].
Details on molecular markers and primers utilized in this study are
summarized in Table 2. The mitochondrial encoded cytochrome c
oxidase subunit 2 (cox2) primers were designed based on the cox2
region of the complete mitochondrial genome of Chondrus crispus
(GenBank no. NC_001677) [34]. PCR parameters of the cox2
molecular marker are similar to that of rbcL, but with 30
amplification cycles. Amplicons were electrophoresed using a
SYBRHSafe (Invitrogen, USA) stained 1.0% agarose gel, prior to
purification using LaboPassTM (Cosmo Gentech, Korea) gel and
PCR purification kits. Purified products were sent to Lucigen
(Taiwan) for ABI SoLiD sequencing.
Resulting electropherograms were viewed, truncated at termi-
nals and contigs generated using ChromasPro V1.5 (Technelysium
Pty Ltd). Multiple sequence alignments were computed using
ClustalX V2.0 [35] and converted into NEXUS format prior to
subsequent analyses.
Considering the poor taxonomic status of Kappaphycus and
Eucheuma, certain molecular marker assessments were conducted
using two different criteria, where (i) species were named and
processed based on Operational Taxonomic Units (OTU) (Table 1)
[36], or (ii) original species names were used with no alterations
whatsoever throughout the analyses, herein termed non-OTU.
The 2nd criterion is only applicable under the Large Dataset
Ta
ble
1.
Co
nt.
No
.S
am
ple
Na
me
Op
era
tio
na
lT
ax
on
om
icU
nit
(OT
U)
Sa
mp
lin
gL
oca
tio
nC
oll
ect
ion
Co
de
Ge
nB
an
kA
cce
ssio
nN
um
be
rs
Co
x1C
ox2
-3sp
ace
rC
ox2
rbcL
66
Euch
eum
ad
enti
cula
tum
97
‘‘Ca
cin
g’’
Sab
ang
kat,
Sab
ah,
Mal
aysi
aP
SM1
20
66
-UM
SS0
23
7JX
62
40
42
JX6
24
08
5JX
62
40
71
JX6
24
01
3
67
Euch
eum
ad
enti
cula
tum
CG
*Se
mp
orn
a,Sa
bah
,M
alay
sia
--
JN2
34
75
7-
-
68
Euch
eum
ad
enti
cula
tum
E32
*In
do
ne
sia
--
AY
68
74
37
--
69
Euch
eum
ad
enti
cula
tum
88
8*
Haw
aii
--
FJ5
54
85
9-
-
70
Euch
eum
ad
enti
cula
tum
E8*
ED3
Mad
agas
car
--
AY
68
74
28
--
71
Euch
eum
ad
enti
cula
tum
PA
C5
*P
aje
-Jam
bia
ni
--
JQ7
13
90
3-
-
72
Euch
eum
ad
enti
cula
tum
E60
*M
auri
tiu
s-
-A
Y6
87
43
9-
-
73
Euch
eum
ad
enti
cula
tum
39
53
Haw
aii
--
FJ5
61
73
3-
-
74
Euch
eum
ap
laty
cla
du
mE6
5*
EPT
anza
nia
--
AY
68
74
23
--
75
Euch
eum
ap
laty
cla
du
mE1
11
*K
en
ya-
-A
Y6
87
42
2-
-
76
Solie
ria
12
0-
Me
ram
bo
ng
,Jo
ho
r,M
alay
sia
PSM
12
10
4-U
MSS
02
59
-JN
66
37
93
--
Spe
cim
en
sw
ere
gro
up
ed
into
Op
era
tio
nal
Tax
on
om
icU
nit
s(O
TU
)fo
rse
lect
ed
anal
yse
s.D
ash
es
(2)
ind
icat
en
on
-ava
ilab
leo
rir
rele
van
td
ata.
Ast
eri
sks
(*)
ind
icat
esa
mp
les
wh
ere
corr
esp
on
din
gco
x2-3
spac
er
seq
ue
nce
sw
ere
ob
tain
ed
fro
mth
eG
en
Ban
kan
du
sed
for
Larg
eD
ata
set
Ass
essm
ent.
do
i:10
.13
71
/jo
urn
al.p
on
e.0
05
29
05
.t0
01
DNA Barcoding of Kappaphycus and Eucheuma
PLOS ONE | www.plosone.org 4 December 2012 | Volume 7 | Issue 12 | e52905

Assessment. An OTU in this context refers to a cluster of species-
specific specimens constituting a monophyletic clade which is (i)
sufficiently variable genetically from the sister taxa such that
bifurcating patterns are observed or (ii) geographically distinct.
Morphological criteria were not applied due to the extensive
morphological plasticity of these red algae.
Distance-based AssessmentDistance analyses were performed using TaxonDNA’s Species
Identifier v1.7.7 [33] for each molecular marker dataset. The
pairwise distances for intra- and interspecific frequencies; calculated
using both the uncorrected and the Kimura 2-parameter (K2P)
corrected pairwise distances, were plotted to observe overlaps in
genetic variability, if present. These pairwise distances were
computed using the (i) total overlap range and (ii) 90% overlapping
range- the largest 5% of the intraspecific and lowest 5% of the
interspecific samples excluded. Minimum base pairs in common for
distance calculations were set at 300 bp for all molecular markers
assessed. The effectiveness of respective molecular markers was
tested based on the Best Match (BM) and Best Close Match (BCM)
criteria comprehensively described by Meier and co-workers [33]. In
short, the BM criterion assigns a species name to the query sequence
based on its best barcode match, regardless of the magnitude of
similarity between the query and the barcode sequences. BCM, on
the other hand involves the initial identification of the best-matched
barcode, determination of whether the barcode is sufficiently similar
to the query, followed lastly by the assignment of a species name
[33]. The smallest interspecific distance generated using the Pairwise
Summary module for each molecular marker was used as threshold
value for BM and BCM computations.
Tree-based AssessmentNeighbor-Joining (NJ) trees were generated based on the Kimura
2-parameter model using default PAUP 4.0b10 [37] settings for each
DNA marker to provide visual displays of genetic variation within
and between species. Tree nodal supports were generated via 1,000
bootstrap replicates. Resulting NJ trees were analyzed and processed
using Figtree v1.3.1 [38]. For all trees, the success of species
identification was determined based on the criteria proposed in [1]
and [33]. Under Hebert and co-workers [1], identification was
considered a success when the query clusters along with all conspecific
sequences; and considered a failure when the query matches
conspecific sequences occurring in multiple clusters or clades within
the tree. Ambiguous were all singletons within the dataset. Meier and
co-workers [33] used a revised, and more stringent identification
criteria for the tree-based approach. Queries were considered
correctly identified when in polytomy with conspecifics, or at least
one node into a clade of conspecifics. Misidentification were those
queries in polytomy with only allospecific sequences or those at least
one node into an allospecific clade. Queries without conspecific
sequences or queries sister to conspecifics were considered as
ambiguous or unidentified. Additionally, the phylogeny of Kappaphycus
and Eucheuma were interpreted and briefly described based on the
resulting NJ, Maximum Likelihood (ML), Maximum Parsimony
(MP) and Bayesian Inference (BI) trees.
Large Dataset AssessmentThe cox2-3 spacer, currently the most widely used genetic
marker for Kappaphycus and Eucheuma, were used to simulate
empirically the effectiveness of a molecular marker in relatively
larger datasets. Cox2-3 spacer sequences from recent studies
[23,29,32,39] were obtained from the GenBank. Specimens of
ambiguous or uncertain identity were excluded from the dataset.
Multiple sequence alignments were generated and subjected to
similar K2P distance and tree-based analyses. Datasets were
analyzed based on the application of the OTU and non-OTU
criteria. An additional distance-based identification criterion
termed All Species Barcodes (ASB) was also employed using Species
Identifier v1.7.7 [33]. This relatively more subtle approach
compares the query to barcodes generated using the same
threshold for BM and BCM. Queries were considered as
successfully identified when matched with at least two conspecific
barcodes of the species in question. Ambiguous were all queries
followed by only one conspecific barcode or only a portion of the
conspecific sequences. Queries were designated misidentified when
matched with allospecific barcodes.
Phylogenetic trees were also inferred for the cox2-3 spacer based
on Maximum Likelihood (ML), Maximum Parsimony (MP) and
Bayesian (BI) algorithms. Solieria was used as the outgroup for each
analyses [29]. Parsimony analyses were conducted using PAUP
4.0b10 [37] as heuristic searches using 1,000 bootstrapping
replications; with 100 stepwise random sequence addition and
Table 2. Primer details and corresponding annealing temperatures for the cox1, cox2, cox2-3 spacer and rbcL genetic markersused in this study.
DNA Markers Primers Primer Sequences* ReferenceAnnealingtemperature, Tm
Cox1 COXI43FC622FC880RCOXI1549R
59-TCAACAAATCATAAAGATATTGGWACT-39
59-CCTGTNTTAGCAGGWGCTATTACAATGC-39
59-ACAGTATACATATGATGNGCTCAAAC-39
59-AGGCATTTCTTCAAANGTATGATA-39
[46,47] 52uC
Cox2-3 spacer Cox2_forCox3_rev
59-GTACCWTCTTTDRGRRKDAAATGTGATGC-39
59-GGATCTACWAGATGRAAWGGATGTC-39
[55] 50uC
Cox2 Kcox2_F71Kcox2_R671
59-TTCAAGATCCTGCAACTCC-39
59-ATTTCACTGCATTGGCCAT-39
This Study 51uC
rbcL F-7F-577R-753R-rbcS start
59-AACTCTGTAGTAGAACGNACAAG-39
59-GTATATGAAGGTCTAAAAGGTGG-39
59-GCTCTTTCATACATATCTTCC-39
59-GTTCTTTGTGTTAATCTCAC-39
[58,59] 50uC
Ambiguous nucleotide codes are in accordance to IUPAC: K = G/T; R = A/G; W = A/T; N = A/T/C/G.doi:10.1371/journal.pone.0052905.t002
DNA Barcoding of Kappaphycus and Eucheuma
PLOS ONE | www.plosone.org 5 December 2012 | Volume 7 | Issue 12 | e52905

tree bisection reconnection (TBR) branch swapping. All characters
were assigned unordered and unweighted. Retention indices (RI)
and Consistency indices (CI) were also generated.
ML analysis was performed using raxmlGUI [40] and BI via
Mr. Bayes v3.2.1 [41,42]. Best fit nucleotide substitution models
were determined for each DNA region using Kakusan 4 [43],
Figure 1. Plot of intra- and interspecific genetic distances for the cox1, cox2, cox2-3 spacer and rbcL DNA markers. Numeric values arearranged according to: the difference between the smallest interspecific but intrageneric distance and the largest intraspecific distance|smallestpairwise distance between interspecific but intrageneic sequences|largest pairwise distance between intraspecific sequences; followed by thenumber of observations affected (in brackets).doi:10.1371/journal.pone.0052905.g001
DNA Barcoding of Kappaphycus and Eucheuma
PLOS ONE | www.plosone.org 6 December 2012 | Volume 7 | Issue 12 | e52905

Figure 2. Neighbour Joining (NJ) trees of selected Kappaphycus and Eucheuma from Southeast Asia based on (a) cox1; (b) cox2; (c)cox2-3 spacer; (d) rbcL molecular markers. Numbers at node indicate corresponding bootstrap values over 1,000 replicates. Clade annotationsrepresent Operational Taxonomic Units (OTU), where KA = Kappaphycus alvarezii; KS = Kappaphycus striatum; KAr = Kappaphycus sp. ‘‘Aring-aring’’;ED = Eucheuma denticulatum.doi:10.1371/journal.pone.0052905.g002
DNA Barcoding of Kappaphycus and Eucheuma
PLOS ONE | www.plosone.org 7 December 2012 | Volume 7 | Issue 12 | e52905

generating command files for RAxML and input files for MrBayes.
ML trees were inferred using the ML + thorough bootstrap
algorithm, with the GTR+GAMMA model over 20 independent
searches and 1,000 non-parametric bootstrap replicates. Identical
sequences were not omitted for the analysis. For the BI analyses,
two sets of four Monte Carlo Markov Chains (MCMC) were
performed in parallel over 2,000,000 generations, with trees
sampled every 500th generation. Tracer v1.5 (http://196 tree.-
bio.ed.ac.uk/software/tracer/) was used to assess convergence of
log likelihood values, where 100,000 generations were discarded as
burn-ins, well after stationarity was achieved. Results were used to
generate a 50% majority-rule consensus tree. All trees were again
analysed and processed using Figtree v1.3.1 [38].
Results
All 29 sequences were continuous and easily aligned for all four
molecular markers, generating datasets of different final lengths:
cox1 (1,411 bp), cox2 (575 bp), cox2-3 spacer (365 bp) and for rbcL
(1,464bp). Cox1 exhibited the most phylogenetically informative
sites of 277 (19.6%) characters, followed by rbcL with 126 (8.6%)
characters, cox2 with 115 (20%) characters and the cox2-3 spacer
with 76 (20.8%) characters. All sequences were deposited into
GenBank (see Table 1). The cox1 sequences amplified in this study
encompasses the ones by Saunders et al. [19] and Robba et al.
[18].
Distance-based AssessmentPairwise distances (based on the corrected Kimura 2-parameter)
showing the intra- and interspecific genetic variability for cox1,
cox2, cox2-3 spacer and rbcL were plotted in Figure 1. Both the
corrected and uncorrected pairwise distances generated similar
results for cox2, cox2-3 spacer and rbcL. No overlapping in terms of
intra- and interspecific genetic divergence was observed for all four
molecular markers. However, the rbcL marker showed the least
distance (0.06% differences for total and 90% overlaps) between
the smallest pairwise distance among interspecific but intrageneric
samples and the largest pairwise distance among intraspecific
sequences- smaller ‘‘barcoding gap’’. This was followed by cox2-3
spacer (0.06% for total and 90% overlaps), cox2 (0.52% for total
and 90% overlaps) and cox1 (K2P: 0.64% for total overlaps and
0.71% for 90% overlaps; uncorrected pairwise distance: 0.63% for
total overlaps and 0.70% for 90% overlaps).
Results based on the Best Match (BM) and Best Close Match (BCM)
criteria are as follows: All four genetic markers were able to
correctly identify all 29 species based on the BM criteria. For the
BCM criteria, rbcL showed the highest success in identification
with 100%, followed by cox2 (96.6%), cox2-3 spacer (93.1%) and
cox1 (79.3%). No matches were recorded at values 3.44%, 6.89%
and 20.68% for cox2, cox2-3 spacer and cox1 respectively.
Figure 3. Plot of intra- and interspecific genetic distances of the cox2-3 spacer with the application of OTU and non-OTU criteria.Numeric values are arranged according to: the difference between the smallest interspecific but intrageneric distance and the largest intraspecificdistance|smallest pairwise distance between interspecific but intrageneic sequences|largest pairwise distance between intraspecific sequences;followed by the number of observations affected (in brackets).doi:10.1371/journal.pone.0052905.g003
DNA Barcoding of Kappaphycus and Eucheuma
PLOS ONE | www.plosone.org 8 December 2012 | Volume 7 | Issue 12 | e52905

Tree-based AssessmentResulting NJ phylogenetic trees are shown in Figure 2. Similar
tree topologies were observed based on the cox1, cox2, cox2-3 spacer
and the rbcL molecular markers, all showing an apparent
phylogenetic delineation between Kappaphycus and Eucheuma i.e.
Neighbor Joining bootstrap supports (NJ-BS) of 100% respectively.
Better resolution was observed for the mitochondrial-encoded
genetic markers compared to the plastid-encoded rbcL counterpart
on the species level, with relatively higher discrimination in the
clustering of specimens.
Tree-based DNA identification using Hebert et al.’s [1] criteria
showed 100% identification success across all species for all four
genetic markers. Apart from the plastid rbcL DNA marker,
identification success saw a decrease with the application of Meier
et al.’s [33] revised identification criteria. For the cox1 marker,
identification success was recorded at 89.7%, with the remaining
10.3% sequences assigned as ambiguous. Both the cox2 and cox2-3
spacer showed identification success of 96.6%, with 3.4%
ambiguity.
Tree topologies based on ML, MP and BI analyses were
identical to that of the NJ trees and were not shown (to be
distributed upon request). For the monophyletic Kappaphycus clade,
four subclades were generated, denoted as OTUs KA1, KS1, KS2
and KAr; corresponding to K. alvarezii, K. striatum 1, K. striatum 2
and Kappaphycus sp. ‘‘Aring-aring’’ respectively. All K. alvarezii
specimens were inferred to be the same species with no significant
genetic variation by all four markers (NJ-BS = 99–100%). Two
genotypic strains of K. striatum-KS1 (1, 31, 59, 460, GUI4, SIT5
and V6) and KS2 (83, 98, 105 and SIT4) were observed with high
support (NJ-BS = 99–100%) for each marker, although the
clustering was less obvious for rbcL. Cox1 demonstrated more
specific delineation within species, where the Philippine GUI4
specimen was inferred to be genetically different from the rest of
the KS1 specimens (NJ-BS = 99%). Based on all four markers,
Kappaphycus sp. ‘‘Aring-aring’’, first reported by Tan and co-workers
(2012), formed a highly supported monophyletic clade (NJ-
BS = 95–100%) sister to that of K. alvarezii and K. striatum (NJ-
BS = 100%). Specimens 49 and 115, which were both from Sabah,
were shown with moderate support (NJ-BS = 72% and 75%) to be
more closely related to one another compared to that of sample 93
by the cox2-3 spacer and cox2 genetic marker respectively.
Eucheuma denticulatum specimens formed a monophyletic clade
composed of subclades termed as ED1 (44, 45, 56, 454 and
BOH5) and ED2 (41, 42 and 97) for all four molecular markers
(NJ-BS = 100%). Similar to that observed for K. striatum, the
assortment of ED1 and ED2 was not that discrete for the rbcL
marker. Conversely, the cox1 marker exhibited relatively better
intraspecific delineation, where the Indonesian 454 specimen was
shown to be different from the remaining ED1 samples (NJ-
BS = 100%). Although moderately supported (NJ-BS = 77%),
samples 42 and 97 were inferred by cox1 to be distinct from that
of sample 41.
Despite the equal ability of all four markers to cluster species
consistently and somewhat accurately, the cox1, cox2 and rbcL NJ
trees showed increased robustness in terms of nodal supports, of
which the cox1 marker exhibited more specific resolution in terms
of intraspecific genetic variations.
Large Dataset AssessmentMultiple sequence alignments with a length of 341bp were
generated from the dataset incorporating all selected 76 cox2-3
spacer sequences (including the Solieria outgroup), representing ten
OTUs or five non-OTUs. Cox2-3 spacer sequences generated from
this study were truncated to allow better comparisons with shorter
Figure 4. Identification success of the cox2-3 spacer. Kappaphycus and Eucheuma samples were categorized under either OperationalTaxonomic Units (OTU) or non-OTU conditions. Results were generated based on the Best Match (BM), Best Close Match (BCM) and All Species Barcodes(ASB) criteria.doi:10.1371/journal.pone.0052905.g004
DNA Barcoding of Kappaphycus and Eucheuma
PLOS ONE | www.plosone.org 9 December 2012 | Volume 7 | Issue 12 | e52905
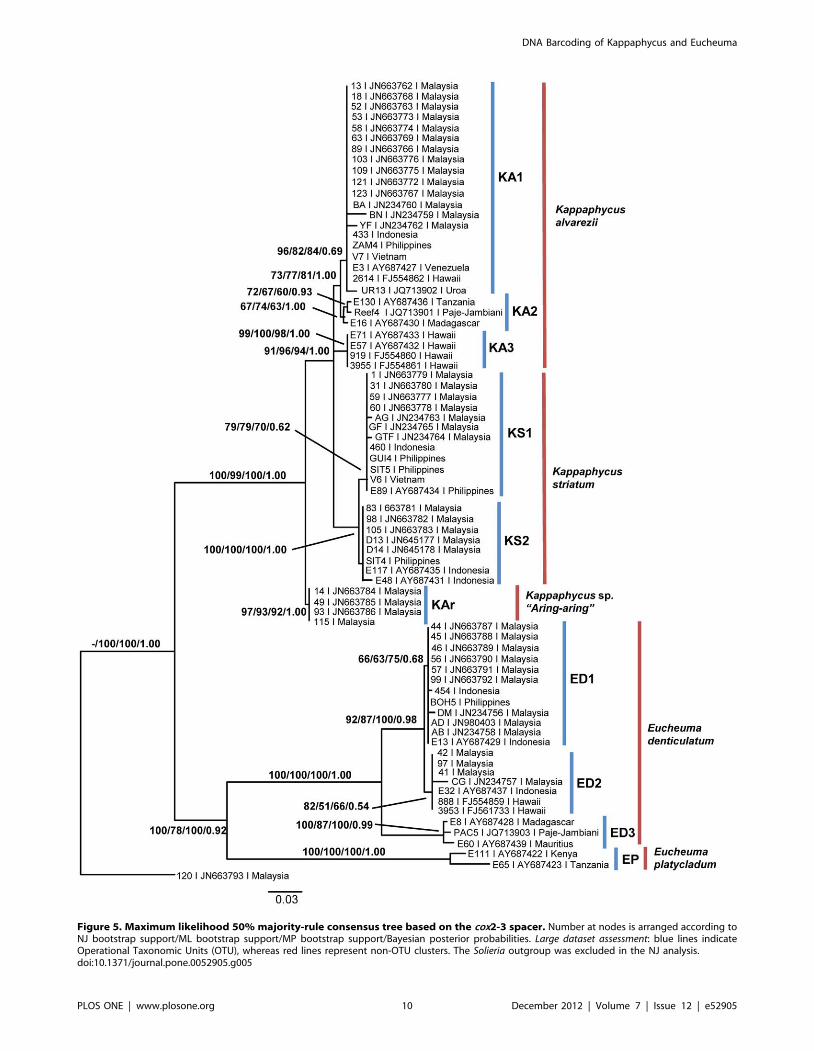
Figure 5. Maximum likelihood 50% majority-rule consensus tree based on the cox2-3 spacer. Number at nodes is arranged according toNJ bootstrap support/ML bootstrap support/MP bootstrap support/Bayesian posterior probabilities. Large dataset assessment: blue lines indicateOperational Taxonomic Units (OTU), whereas red lines represent non-OTU clusters. The Solieria outgroup was excluded in the NJ analysis.doi:10.1371/journal.pone.0052905.g005
DNA Barcoding of Kappaphycus and Eucheuma
PLOS ONE | www.plosone.org 10 December 2012 | Volume 7 | Issue 12 | e52905

GenBank counterparts. 118 phylogenetically informative and 192
constant characters were recorded.
Figure 3 illustrates the intraspecific and interspecific genetic
divergence based on the K2P model between OTUs and non-
OTUs. For the former, a pairwise distance overlap of 0.29% was
observed between the smallest interspecific and the largest
intraspecific sequences; whereas no overlaps were observed for
the latter.
Identification successes based on the BM and BCM criteria are
shown in Figure 4. All species were correctly identified under BM
for OTU and non-OTU analyses. Under BCM selection, 90.66%
of samples were correctly identified when species were considered
as OTUs, and 97.33% when species were not considered as
OTUs. No matches were found for the remaining queries. Under
the All Species Barcodes (ASB) identification criteria, an identification
success of 90.66% and 61.33% were observed for OTU and non-
OTU species categorization respectively. 36% of sequences were
considered as ambiguous under the non-OTU criteria whereas the
remaining queries were designated matchless.
Due to the similarity in tree topologies based on the NJ, ML,
MP and BI algorithms, and for simplicity, resulting data are
compiled and depicted as Figure 5. The NJ, MP and BI
phylogenetic trees are provided as supporting data Figure S1, S2
and S3 respectively. Tree-based DNA identification is assessed
using the NJ tree without taking into account the Solieria outgroup
not used in the NJ dataset. In accordance to identification criteria
by Hebert and co-workers [1], 100% identification success is
reported when tree-based identification is based on the OTU
concept. When taxa are queried using conventional taxonomic
naming (non-OTU), percentage of successful identification is
reduced to 94.6%, where the remaining 5.4% indicated misiden-
tifications. Application of Meier et. al.’s [33] identification criteria
returned comparatively lower successful identification rates, where
95.9% success and 4.1% ambiguity was recorded for OTUs; and
67.6% successful identification, 27% ambiguity and 5.4%
misidentification for non-OTUs.
Phylogenetic analyses of the entire cox2-3 spacer dataset is
inclusive of the Solieria outgroup. A total of 32 most parsimonious
trees were produced by Parsimony analysis, with a Retention
Index (RI) and Consistency Index (CI) of 0.9748 and 0.7934
respectively. The tree topology is generally similar to the NJ trees
generated for molecular marker assessment, with most specimens
clustering into existing clades. Remaining GenBank samples,
mostly of different species or locality, were inferred as additional,
discrete monophyletic clades. Nevertheless, the overall tree
topology is still congruent to that of phylogenetic trees reported
in earlier studies [23,28,29] and will not be discussed in detail.
Nodal supports of the phylogenetic tree (Figure 5) were arranged
in the order of Neighbor Joining bootstrap supports (NJ-BS),
Maximum Likelihood bootstrap supports (ML-BS), Maximum
Parsimony bootstrap supports (MP-BS) and Bayesian Inference
posterior probabilities (BI-PP). Major nodes were mostly moderate
to highly supported despite the addition in taxa. Fairly high
support were observed for the monophyly of Kappaphycus (NJ-
BS = 100%; ML-BS = 99%; MP-BS = 100%; BI-PP = 1.00) and
Eucheuma (NJ-BS = 100%; ML-BS = 78%; MP-BS = 100%; BI-
PP = 0.92) used in this study. Although strongly supported (NJ-
BS = 91%; ML-BS = 96%; MP-BS = 94%; BI-PP = 1.00), polyt-
omy is observed between K. alvarezii (KA1, KA2 and KA3) and K.
striatum; where KA2 (NJ-BS = 67%; ML-BS = 74%; MP-
BS = 63%; BI-PP = 1.00) and KA3 (NJ-BS = 99%; ML-
BS = 100%; MP-BS = 98%; BI-PP = 1.00) represent K. alvarezii
specimens from the African and Hawaiian regions respectively.
Kappaphycus sp. ‘‘Aring-aring’’ (NJ-BS = 97%; ML-BS = 93%; MP-
BS = 92%; BI-PP = 1.00) and Eucheuma denticulatum (NJ-
BS = 100%; ML-BS = 100%; MP-BS = 100%; BI-PP = 1.00) were
inferred to be monophyletic as well. Clade EP (NJ-BS = 100%;
ML-BS = 100%; MP-BS = 100%; BI-PP = 1.00) comprises of
Eucheuma platycladum collected from around Southeast Africa.
Discussion
The dataset in the present study represents a small conglom-
erate of selected and commonly available Kappaphycus and
Eucheuma samples from Southeast Asia. Sampling size is restricted
to an amount supposedly cost-effective for molecular marker
assessments as potential DNA barcodes. Owing to the relatively
scarce records of Kappaphycus and Eucheuma in the GenBank, this
study will also serve as a preliminary work to increase the amount
of reference data using the potential DNA barcode, which can
eventually be established as a barcode library.
Molecular Marker AssessmentThe accuracy of a DNA barcode is largely determined by the
magnitude of overlap between intraspecific variation and inter-
specific divergence. Ideally, the absence of an overlap would
render species identification straightforward but this condition is
virtually non-existent in very large datasets, in which the less the
overlap, the more accurate it is for species identification [3,6,44].
Results indicated that no overlaps were observed for the cox1, cox2,
cox2-3 spacer and the rbcL genetic markers and have minimal
impact on the accuracy of species identification for Kappaphycus and
Eucheuma in this study (Figure 1). However, the absence of overlaps
may be attributed to the small taxa limited to Southeast Asia
(particularly so the genus Eucheuma) at this time, and is expected to
change as more samples of different species or from different
geographical locations are included in the future [6,45]. The
presence of a ‘‘barcoding gap’’ (the absence of overlaps between
intra- and interspecific genetic variations) may also be explained
by the relatively lower genetic diversity amongst red algae as
compared to those observed in arthropods.
All four molecular markers collectively showed an identification
success of 100% for the BM criteria. Under the BCM criteria, the
plastid encoded rbcL gene exhibited the highest identification
success of 100% whereas the mitochondrial encoded cox2, cox2-3
spacer and cox1 spacer recorded slightly lower success of 96.6%,
93.1% and 79.3% respectively. Misidentification of species was not
reported for all four molecular markers. The eventual increase in
conspecific DNA sequences for Kappaphycus and Eucheuma is
expected to reduce the probability of queries not meeting any
matching sequences. All these results reflect the relatively less
variable rbcL region as compared to mitochondrial counterparts,
which was also reported by Geraldino et al. [46] and Yang et al.
[47]. Although widely championed as a good potential DNA
barcode, the relatively higher intraspecific variation of the cox1
marker (,0.43% for Kappaphycus; ,0.07% for Eucheuma) requires
caution in avoiding misidentifications. Similar or higher intraspe-
cific patterns were pointed out in previous studies associated with
rhodophytes [18,19,46,47,48,49].
Tree-based DNA identification approach returned 100%
success in species identification for all four molecular markers
using the criteria by Hebert and co-workers [1]. Although the
application of the relatively stricter identification criteria by Meier
and co-workers [33] generally lowered the successful identification
scores, they were still higher compared to the results derived from
the distance-based approach. For instance, cox1 and cox2 showed a
higher identification success of 89.7% and 96.6% respectively.
Ambiguous identification in this study was mostly caused by
DNA Barcoding of Kappaphycus and Eucheuma
PLOS ONE | www.plosone.org 11 December 2012 | Volume 7 | Issue 12 | e52905
queries that formed a sister group to a cluster of conspecific
sequences. This is also expected to decrease as more reference
sequences are deposited in the GenBank for Kappaphycus and
Eucheuma. Contrary to the better results obtained by the tree-based
method in this study, empirical studies involving much larger taxa
coverage have reported the preference of distance-based assess-
ment over tree-based ones in terms of accuracy and robustness
[33,50].
Based on both the distance and tree-based DNA identification
approaches, the relatively conserved nature and the absence of
overlaps between inter- and intraspecific genetic variability of the
rbcL gene serves as a better potential DNA barcode for Kappaphycus
and Eucheuma. However, the reduced genetic variation would also
imply the incapability of the rbcL marker to detect incipient
speciation or genetic diversity within species [5,51]. This will not
only result in an underestimate of the actual genetic richness of
these seaweeds, but will most likely overestimate interspecific
variation as well due to the unavailability of closely related species
[6]. The drawbacks of the plastid encoded rbcL marker can be
accounted for using supplementary molecular data generated from
the relatively more variable, mitochondrial derived cox1, cox2 or
cox2-3 spacer. The concept of combined molecular data, in this
case of molecular markers, is not new considering the occasional
failures of the DNA barcodes in correctly and consistently
identifying species, as observed in Karner blue butterflies [52],
seagrasses [53] and flowering plants [54]. Utilization of genomic
DNA from different origin i.e. mitochondrial, plastid or nuclear
with different evolutionary rates would offer a better picture with
respect to gene genealogy and evolutionary lineage.
The cox1 and cox2 DNA markers hold better potential as
supplementary DNA barcodes compared to the cox2-3 spacer
because of their protein coding properties. These markers are
more conserved across taxa with less indel mutations and are
much simpler to check for errors through amino-acid translation.
Lack of recombination and uniparental inheritance of mitochon-
drial markers are added advantages [55]. The relatively high
mitochondrial copy numbers also enable ease of amplification.
The cox2 genetic marker, with its moderately high interspecific
divergences within generic level and non-existent intraspecific
variation, has demonstrated relatively successful results in terms of
species identification in this study and is thus regarded as a
potential mitochondrial DNA barcode for Kappaphycus and
Eucheuma. Large scale application of this molecular marker is
expected to bring about advancements mainly in the field of
agriculture, taxonomy and biomonitoring. However, considering
the already widely utilized cox2-3 spacer exhibited almost similar
barcoding traits as that of the mitochondrial cox2 marker,
continual implementation is recommended, in spite of its non-
coding nature. The implementation of the cox2 molecular marker
across taxa may pose a problem as well since the full potential of
the cox2 marker has yet to be tested in other rhodophytes.
Additionally, the massively abundant and readily available cox1
sequences within the GenBank (although not extensively tested on
Kappaphycus and Eucheuma at that time, cox1 has been proposed as
the potential universal DNA barcode for red algae) is apparently
more practical and economical to work with, despite the relatively
higher intraspecific variations which may reduce the accuracy for
species identification [10,18,19,46,47,48,49]. Based on the results
of this study, the authors have come to a consensus that the
mitochondrial cox2-3 spacer was in overall the best potential DNA
barcode for Kappaphycus and Eucheuma; whereas the combined
mitochondrial-encoded cox1 and the plastid-encoded rbcL markers
serve better as DNA barcodes encompassing the entire rhodophyte
taxa.
The robustness and efficiency of DNA barcoding tends to
increase with increased reference sequences and taxonomic
scrutiny [1,6,44,50]. This includes genetically distinct individuals
within a species’ range to account for molecular markers with high
variability such as the cox1 [33]. Although this would greatly
increase GenBank data and hence lead to an inevitable increment
in terms of computational demand, larger and properly annotated
datasets would expedite phylogeography, evolutionary biology,
biodiversity or population genetic studies in the future.
Large Dataset AssessmentAn additional 46 GenBank cox2-3 spacer sequences of
Kappaphycus and Eucheuma were compiled to simulate the effective-
ness of a molecular marker in large, empirical datasets. Certain
specimens of unknown or uncertain identity i.e. Kappaphycus cottonii,
Eucheuma isiforme etc. were not used to avoid data confounding.
Morphological plasticity of these seaweeds has rendered species
identification and description challenging, even to seasoned
taxonomists. As of now, distinctive morphological characters are
still undiscovered despite ample of DNA evidence supporting the
possible existence of new, or perhaps cryptic species. This has led
to the amplification of Operational Taxonomic Units (OTU) in
this context; representing genotypic diversity possibly overlooked
via conventional morphological traits.
Distance-based results on the cox2-3 spacer dataset have shown
that the incorporation of more sequences decreases the ‘‘barcoding
gap’’ (when not overlapping), and to the extent of forming overlaps
between inter- and intraspecific divergence. When Kappaphycus and
Eucheuma species were regarded as non-OTUs, the ‘‘barcoding
gap’’ for the entire length of cox2-3 spacer genetic marker
decreased from 0.27% to 0%. When under OTU assortment,
the intra- and interspecific genetic divergences formed an overlap
of 0.29%. These observations were not surprising considering the
larger sample size would eventually lead to higher occurrence of
specimens with varying genetic composition [6,45]. This would
undoubtedly affect the identification accuracy of DNA barcoding.
BCM results saw a slight dip from 93.1% to 90.7% when samples
were regarded as OTUs. Similar patterns were observed for tree-
based DNA identification under Meier’s (2006) [33] criteria,
where identification success reduced from 96.6% to 95.9% for
non-OTUs, caused mainly by ambiguous sequences. These
‘‘singleton’’ sequences or query sequences sister to known species
can be avoided with increased data and taxonomic rectification or
reformation.
The distance-based All Species Barcodes (ASB) assessment, being
relatively stricter compared to BM and BCM; has reflected our
poor taxonomic comprehension on Kappaphycus and Eucheuma, in
which at our current state (represented by non-OTU species
assortment); a mere 61.3% of queries could be identified correctly
using DNA barcoding. This figure is probably overestimated
considering the large amount of Kappaphycus and Eucheuma yet to be
discovered and described. Misidentifications under non-OTU
conditions were caused by the African (KA2) and Hawaiian (KA3)
K. alvarezii specimens, where the latter remained unresolved using
the cox2-3 spacer and cox1 (results not shown) molecular markers.
Still, combined cox2-3 spacer and RuBisCO spacer data has shown
with moderate support that the KA3 specimens were more closely
related to K. alvarezii than K. striatum [28]. This implies the possible
limitation in resolving power of individual markers at intraspecific
levels although the rbcL and cox2 molecular markers are yet to be
tested. On the other hand, ASB has returned relatively higher
identification successes (90.7%) when Kappaphycus and Eucheuma
species were regarded as OTUs, thus providing invaluable insights
DNA Barcoding of Kappaphycus and Eucheuma
PLOS ONE | www.plosone.org 12 December 2012 | Volume 7 | Issue 12 | e52905

into the possible taxonomic structure of these rhodophytes in the
future.
Phylogenetic InterpretationThe inclusion of GenBank sequences did not cause significant
alterations to the phylogenetic tree topology (Figure 2 and
Figure 5), apart from the additional clade KA3 composed of
Hawaiian Kappaphycus alvarezii and clade EP consisting of Eucheuma
platycladum. The monophyly of both Kappaphycus (NJ-BS = 100%;
ML-BS = 99%; MP-BS = 100%; BI-PP = 1.00) and Eucheuma (NJ-
BS = 100%; ML-BS = 78%; MP-BS = 100%; BI-PP = 0.92) was
moderate to highly supported. Taxonomic statuses of specimens
excluded in this study i.e. Kappaphycus cottonii, Kappaphycus
procrusteanus, Betaphycus philippinensis and Eucheuma isiforme remained
unaddressed at this time. Solid inferences can only be made when
type specimens are sequenced, or when more reference sequences
are available.
KappaphycusSimilar patterns of biodiversity as to that earlier reported were
observed [23,28,29]. K. alvarezii KA1, being the most widely
distributed genotype, was reported throughout Southeast Asia,
Africa, Columbia, Panama as well as Hawaii. Cox2-3 spacer
genealogy suggested that the African and Hawaiian strains of K.
alvarezii KA1 may possibly be introduced strains, presumably
traceable back to the Philippines. This is not surprising as there
were efforts to introduce foreign, good strains of Kappaphycus for
cultivation in the past [23,28,56]. Phylogenetic trees generated
using the cox1, cox2 and rbcL DNA markers (Figure 2) have
collectively displayed similar topologies constituted of similar
specimens for clade KA1. This supports the report by Tan and co-
workers (2012) [29] that local varieties of cultivated K. alvarezii do
not differ genetically despite the distinctive morphologies, at least
for Malaysian specimens. K. alvarezii KA2 and KA3 represent
genotypes unique to Africa and Hawaii respectively. The
taxonomic position of the Hawaiian K. ‘‘alvarezii’’ specimens
(KA3) remained unresolved using the cox1 (results not shown) and
cox2-3 spacer marker, where the Hawaiian samples occur as a
polytomy to both K. alvarezii and K. striatum. Although GenBank
sequences are limited, combined analysis using both the cox1 and
cox2-3 spacer suggested that clade KA3 is sister to that of K.
alvarezii and K. striatum (Results not shown). This contradicts the
phylogenetic results based on the combined cox2-3 spacer and
RuBiSCO spacer dataset, where the Hawaiian Kappaphycus
specimens were inferred to be sister to K. alvarezii (KA1 and
KA2 in this context) with moderate support (MP-BS = 70%) [28].
Application of the mitochondrial cox2 and plastid rbcL marker may
better elucidate the current confusion associated with clade KA3.
As earlier reported, two genotypes were observed for Kappaphycus
striatum [28,29], denoted here as clades KS1 and KS2. No
distinctive differences in terms of gross morphology were identified
between these two genotypes as of now and it is unsure whether
cryptic species may apply in this situation. However, it appears
that cultivated K. striatum mostly reside within clade KS1 and are
largely common in Southeast Asia, although a recent study has
also reported its occurrence in Uroa, Tanzania as a result of strain
introduction [32]. Kappaphycus sp. ‘‘Aring-aring’’ from Malaysia was
earlier shown to be phenotypically and genotypically different
from K. alvarezii and K. striatum [29]; comparative studies against
type specimens, particularly that of Kappaphycus cottonii (Weber-van
Bosse) Doty ex P.C.Silva are currently underway in order to
determine its validity as a new species.
EucheumaEucheumatoids are relatively poorly studied compared to
Kappaphycus, possibly due to identification difficulties as well as
lower economic value. Eucheuma denticulatum, being the more
popularly cultivated species, were clustered into three genotypi-
cally distinct subclades. Subclade ED1 represents specimens from
Southeast Asia and Hawaii, subclade ED2 from Southeast Asia,
Hawaii and Tanzania [28] whereas samples within ED3 were
exclusively from Africa. Despite coexisting in the South China and
Celebes seas, Southeast Asian Eucheuma denticulatum ED1 and ED2
does not share similar morphological characteristics. This was
shown by Ganzon-Fortes and co-workers [57], demonstrating the
differences between the ‘‘Endong/Spaghetti’’ variety (ED2) from that
of the usual Spinosum variety (ED1) of Eucheuma denticulatum. The
‘‘Endong’’ variety, thence named E. denticulatum (Burman) Collins &
Hervey var. endong Trono & Ganzon-Fortes var. nov. exhibited
smooth, slender terete axes with whorls of determinate branchlets
at predictable intervals [57]. Recent samplings in Malaysia have
also revealed that the local Eucheuma denticulatum ‘‘Cacing’’ variety
fits the morphological and biochemical descriptions of the
‘‘Endong’’ variety, and its genotypic affinity also supported by
cox1 and rbcL molecular data (data not shown). The apparent and
distinctive morphological characters of the ‘‘Endong’’ variety does
not fit the original descriptions for E. denticulatum, thus suggesting
that it may be a new species instead of a rare variety. With
reference to Figure 2, this was shown to be potentially true using
the full length cox1 genetic marker, where the monophyly of clades
ED1 and ED2 were highly supported. Relatively lower nodal
supports were displayed by the cox2-3 spacer and cox2 DNA
markers, followed lastly by the rbcL marker which fails to clearly
indicate monophyly of ED1 and ED2. These patterns are
reflective of the genetic variability of each molecular marker and
suggest that clades ED1 and ED2 are probably undergoing
divergence or have recently diverged. E. denticulatum ED3 was
inferred to share a common ancestry with E. denticulatum ED1 and
ED2, and are to date only reported in Africa. Considering the
significantly different morphologies reported for ED2, it would be
interesting to relook into the detailed anatomy of the African E.
denticulatum.
Supporting Information
Figure S1 Neighbor-Joining (NJ) tree based on the cox2-3spacer marker. Numeric values at nodes indicate NJ bootstrap
supports. Large dataset assessment: blue lines indicate Operational
Taxonomic Units (OTU), whereas red lines represent non-OTU
clusters. The Solieria outgroup was omitted from the analysis to
enable implementation of tree-based identification criteria.
(TIF)
Figure S2 Maximum Parsimony (MP) phylogenetic treebased on the cox2-3 spacer. Number at nodes indicates MP
bootstrap supports. Large dataset assessment: blue lines indicate
Operational Taxonomic Units (OTU), whereas red lines represent
non-OTU clusters.
(TIF)
Figure S3 Bayesian (BI) phylogenetic tree based on thecox2-3 spacer DNA marker. Number at nodes indicates BI
posterior probabilities. Large dataset assessment: blue lines indicate
Operational Taxonomic Units (OTU), whereas red lines represent
non-OTU clusters.
(TIF)
DNA Barcoding of Kappaphycus and Eucheuma
PLOS ONE | www.plosone.org 13 December 2012 | Volume 7 | Issue 12 | e52905
Acknowledgments
We would like to thank the Department of Fisheries Sabah, Prof. Dr.
Suhaimi Md. Yasir, En. Adibi Rahiman bin Md. Nor, Dr. Yeong Hui Yin,
Fiona Keng Seh Lin and Japson Wong for helping in seaweed collection.
We thank Gaurav Vaidya for his support on using TaxonDNA. We would
also like to thank Song Sze Looi, Ng Poh Kheng and Poong Sze Wan for
their advice and guidance on molecular taxonomy. We are grateful to the
University of Malaya and the Institute of Earth and Ocean Sciences (IOES)
for research facilities.
Author Contributions
Conceived and designed the experiments: PL JT. Performed the
experiments: PL JT. Analyzed the data: PL JT. Contributed reagents/
materials/analysis tools: PL JT SP DH HS AH. Wrote the paper: PL JT SP
DH AH.
References
1. Hebert PDN, Cywinska A, Ball SL, de Waard JR (2003a) Biological
identifications through DNA barcodes. Proceedings of the Royal Society B:Biological Sciences 270: 313–321.
2. Hebert PDN, Ratnasingham S, de Waard JR (2003b) Barcoding animal life:
cytochrome c oxidase subunit 1 divergences among closely related species.Proceedings of the Royal Society B: Biological Sciences 270: S96–S99.
3. Hebert PDN, Stoeckle MY, Zemlak TS, Francis CM (2004) Identification of
birds through DNA barcodes. PLoS Biol 2: e312.
4. Ellegren H, Hubert N, Hanner R, Holm E, Mandrak NE, et al. (2008)Identifying Canadian Freshwater Fishes through DNA Barcodes. PLoS ONE 3:
e2490.
5. Hollingsworth PM, Graham SW, Little DP (2011) Choosing and Using a PlantDNA Barcode. PLoS ONE 6: e19254.
6. Jinbo U, Kato T, Ito M (2011) Current progress in DNA barcoding and future
implications for entomology. Entomological Science 14: 107–124.
7. Ratnasingham S, Hebert PDN (2007) BOLD: the Barcode of Life Data System(www.barcodinglife.org). Molecular Ecology Notes 7: 355–364.
8. Sarkar IN, Trizna M (2011) The Barcode of Life Data Portal: Bridging the
Biodiversity Informatics Divide for DNA Barcoding. PLoS ONE 6: e14689.
9. Wong LL, Peatman E, Lu J, Kucuktas H, He S, et al. (2011) DNA Barcoding ofCatfish: Species Authentication and Phylogenetic Assessment. PLoS ONE 6:
e17812.
10. Freshwater DW, Tudor K, O’Shaughnessy K, Wysor B (2010) DNA barcodingin the red algal order Gelidiales: comparison of COI with rbcL and verification of
the ‘‘barcoding gap’’. Cryptogamie, Algologie 31: 435–449.
11. Clarkston BE, Saunders GW (2010) A comparison of two DNA barcode markersfor species discrimination in the red algal family Kallymeniaceae (Gigartinales,
Florideophyceae), with a description of Euthora timburtonii sp. nov. Botany 88:119–131.
12. Le Gall L, Saunders GW (2010) DNA Barcoding Is a Powerful Tool to Uncover
Algal Diversity: A Case Study of the Phyllophoraceae (Gigartinales, Rhodo-phyta) in the Canadian Flora. Journal of Phycology 46: 374–389.
13. Saunders GW (2008) A DNA barcode examination of the red algae family
Dumontiaceae (Gigartinales, Florideophyceae) in Canadian waters revealssubstantial cryptic species diversity. 1. The foliose Dilsea-Neodilsea complex
and Weeksia. Botany 86: 773–789.
14. Kim MS, Yang MY, Cho GY (2010) Applying DNA barcoding to Korean
Gracilariaceae (Rhodophyta). Cryptogamie, Algologie 31: 387–401.
15. Saunders GW (2009) Routine DNA barcoding of Canadian Gracilariales
(Rhodophyta) reveals the invasive species Gracilaria vermiculophylla in British
Columbia. Molecular Ecology Resources 9: 140–150.
16. McDevit DC, Saunders GW (2010) A DNA barcode examination of the
Laminariaceae (Phaeophyceae) in Canada reveals novel biogeographical and
evolutionary insights. Phycologia 49: 235–248.
17. Kucera H, Saunders GW (2008) Assigning morphological variants of Fucus
(Fucales, Phaeophyceae) in Canadian waters to recognized species using DNA
barcoding. Botany 86: 1065–1079.
18. Robba L, Russell SJ, Barker GL, Brodie J (2006) Assessing the use of themitochondrial cox1 marker for use in DNA barcoding of red algae (Rhodophyta).
American Journal of Botany 93: 1101–1108.
19. Saunders GW (2005) Applying DNA barcoding to red macroalgae: apreliminary appraisal holds promise for future applications. Philosophical
Transactions of the Royal Society B: Biological Sciences 360: 1879–1888.
20. Sherwood AR, Kurihara A, Conklin KY, Sauvage T, Presting GG (2010) TheHawaiian Rhodophyta Biodiversity Survey (2006-2010): a summary of principal
findings. BMC Plant Biology 10: 258.
21. Bixler HJ, Porse H (2010) A decade of change in the seaweed hydrocolloidsindustry. Journal of Applied Phycology 23: 321–335.
22. Bindu MS, Levine IA (2010) The commercial red seaweed Kappaphycus alvarezii–
an overview on farming and environment. Journal of Applied Phycology.
23. Conklin KY, Kurihara A, Sherwood AR (2009) A molecular method foridentification of the morphologically plastic invasive algal genera Eucheuma and
Kappaphycus (Rhodophyta, Gigartinales) in Hawaii. Journal of Applied Phycology21: 691–699.
24. Doty MS (1985a) Eucheuma alvarezii, sp. Nov. (Gigartinales, Rhodophyta) from
Malaysia. In: Abbott IA, Norris JN, editors. Taxonomy of economic seaweeds:
with reference to some Pacific and Caribbean spcies. La Jolla, California:California Sea Grant College Program. 37–45.
25. Doty MS, Norris JN (1985b) Eucheuma species (Solieriaceae, Rhodophyta) that
are major sources of carrageenan. In: Abott IA, Norris JN, editors. Taxonomy of
economic seaweeds: with reference to some Pacific and Caribbean species. La
Jolla, California: California Sea Grant College Program. 47–61.
26. Paula EJ, Pereira R, Ohno M (1999) Strain selection in Kappaphycus alvarezii var.
alvarezii (Solieriaceae, Rhodophyta) using tetraspore progeny. Journal of Applied
Phycology 11: 111–121.
27. Phang SM, Yeong HY, Lim PE, Adibi Rahiman Md Nor, Gan KT (2010)
Commercial varieties of Kappaphycus and Eucheuma in Malaysia. Malaysian
Journal of Science 29: 214–223.
28. Zuccarello GC, Critchley AT, Smith J, Sieber V, Lhonneur GB, et al. (2006)
Systematics and genetic variation in commercial Kappaphycus and Eucheuma
(Solieriaceae, Rhodophyta). Journal of Applied Phycology 18: 643–651.
29. Tan J, Lim PE, Phang SM (2012) Phylogenetic relationship of Kappaphycus Doty
and Eucheuma J. Agardh (Solieraceae, Rhodophyta) in Malaysia. Journal of
Applied Phycology DOI: 10.1007/s10811-012-9833-1.
30. Fredericq S, Freshwater DW, Hommersand MH (1999) Observations on the
phylogenetic systematics and biogeography of the Solieriaceae (Gigartinales,
Rhodophyta) inferred from rbcL sequences and morphological evidence.
Hydrobiologia 398/399: 25–38.
31. Zhao S, He P (2011) Molecular identification based on ITS sequences for
Kappaphycus and Eucheuma cultivated in China. Chinese Journal of Oceanology
and Limnology 29: 1287–1296.
32. Halling C, Wikstrom SA, Lillieskold-Sjoo G, Mork E, Lundsør E, et al. (2012)
Introduction of Asian strains and low genetic variation in farmed seaweeds:
indications for new management practices. Journal of Applied Phycology In
press.
33. Meier R, Shiyang K, Vaidya G, Ng P (2006) DNA Barcoding and Taxonomy in
Diptera: A Tale of High Intraspecific Variability and Low Identification Success.
Systematic Biology 55: 715–728.
34. Leblanc C, Boyen C, Richard O, Bonnard G, Grienenberger JM, et al. (1995)
Complete sequence of the mitochondrial DNA of the rhodophyte Chondrus crispus
(Gigartinales). Gene content and genome organization. Journal of Molecular
Biology 250: 484–495.
35. Larkin MA, Blackshields G, Brown NP, Chenna R, McGettigan PA, et al. (2007)
ClustalW and ClustalX version 2.0. Bioinformatics 23: 2947–2948.
36. Meyer CP (2004) Toward comprehensiveness: Increased molecular sampling
within Cypraeidae and its phylogenetic implications. Malacologia 46: 127–156.
37. Swofford DL (2003) PAUP*. Phylogenetic Analysis Using Parsimony (* and
other methods). Version 4. Sinauer Associates, Sunderland, Massachusetts.
38. Rambaut A, Drummond A. FigTree v1.3.1. Institute of Evolutionary Biology,
University of Edinburgh, Edinburgh, United Kingdom 2010. http://tree.bio.ed.
ac.uk/software/figtree/.
39. Zuccarello GC, West JA (2006) Molecular phylogeny of the subfamily
Bostrychioideae (Ceramiales, Rhodophyta): subsuming Stictosiphonia and highlight-
ing polyphyly in species of Bostrychia. Phycologia 45: 24–36.
40. Silvestro D, Michalak I (2011) raxmlGUI: a graphical front-end for RAxML.
Organisms Diversity and Evolution. 10.1007/s13127-011-0056-0.
41. Huelsenbeck JP, Ronquist F, Nielsen R, Bollback JP (2001) Bayesian inference of
phylogeny and its impact on evolutionary biology. Science 294: 2310–23114.
42. Ronquist F, Huelsenbeck JP (2003) MrBayes 3: Bayesian phylogenetic inference
under mixed models. Bioinformatics 19: 1572–1574.
43. Tanabe AS (2011) Kakusan4 and Aminosan: two programs for comparing
nonpartitioned, proportional and separate models for combined molecular
phylogenetic analyses of multilocus sequence data. Molecular Ecology Resources
11: 914–921.
44. Meyer CP, Paulay G (2005) DNA Barcoding: Error rates based on
comprehensive sampling. PLoS Biol 3: e422.
45. Meier R, Zhang G, Ali F (2008) The Use of Mean Instead of Smallest
Interspecific Distances Exaggerates the Size of the ‘‘Barcoding Gap’’ and Leads
to Misidentification. Systematic Biology 57: 809–813.
46. Geraldino PJL, Yang EC, Boo SM (2006) Morphology and Molecular
Phylogeny of Hypnea flexicaulis (Gigartinales, Rhodophyta) from Korea. Algae
21: 417–423.
47. Yang EC, Kim MS, Geraldino PJL, Sahoo D, Shin J-A, et al. (2007)
Mitochondrial cox1 and plastid rbcL genes of Gracilaria vermiculophylla (Gracilar-
iaceae, Rhodophyta). Journal of Applied Phycology 20: 161–168.
48. Geraldino PJL, Yang EC, Kim MS, Boo SM (2009) Systematics of Hypnea asiatica
sp. nov. (Hypneaceae, Rhodophyta) based on morphology and nrDNA SSU,
plastid rbcL, and mitochondrial cox1. Taxon 58: 606–616.
DNA Barcoding of Kappaphycus and Eucheuma
PLOS ONE | www.plosone.org 14 December 2012 | Volume 7 | Issue 12 | e52905

49. Wiriyadamrikul J, Park JK, Lewmanomont K, Boo SM (2010) Additional
records of Gelidiella fanii (Gelidiales, Rhodophyta) from the western Pacific based
on morphology, rbcL and cox1 analyses. Botanica marina 53: 343–350.
50. Virgilio M, Backeljau T, Nevado B, De Meyer M (2010) Comparative
performances of DNA barcoding across insect orders. BMC Bioinformatics
11: 206.
51. van Velzen R, Weitschek E, Felici G, Bakker FT (2012) DNA Barcoding of
Recently Diverged Species: Relative Performance of Matching Methods. PLoS
ONE 7: e30490.
52. Gompert Z, Nice CC, Fordyce JA, Forister ML, Shapiro AM (2006) Identifying
units for conservation using molecular systematics: the cautionary tale of the
Karner blue butterfly. Molecular Ecology 15: 1759–1768.
53. DeSalle R, Lucas C, Thangaradjou T, Papenbrock J (2012) Development of a
DNA Barcoding System for Seagrasses: Successful but Not Simple. PLoS ONE
7: e29987.
54. Kress WJ (2005) Use of DNA barcodes to identify flowering plants. Proceedings
of the National Academy of Sciences 102: 8369–8374.55. Zuccarello GC, Burger G, West JA, King RJ (1999a) A mitochondrial marker
for red algal intraspecific relationships. Molecular Ecology 8: 1443–1447.
56. Pickering TD, Skelton P, Sulu RJ (2007) Intentional introductions ofcommercially harvested alien seaweeds. Botanica Marina 50: 338–350.
57. Ganzon-Fortes ET, Trono GC, Villanueva RD, Romero JB, Montano MNE(2011) ‘Endong’, a rare variety of the farmed carrageenophyte Eucheuma
denticulatum (Burman) Collins & Hervey from the Philippines. Journal of Applied
Phycology DOI: 10.1007/s10811-011-9740-x.58. Freshwater DW, Rueness J (1994) Phylogenetic relationships of some European
Gelidium (Gelidiales, Rhodophyta) species, based on rbcL nucleotide sequenceanalysis. Phycologia 33: 187–194.
59. Gavio B, Fredericq S (2002) Grateloupia turuturu (Halymeniaceae, Rhodophyta) isthe correct name of the non-native species in the Atlantic known as Grateloupia
doryphora. European Journal of Phycology 37: 349–359.
DNA Barcoding of Kappaphycus and Eucheuma
PLOS ONE | www.plosone.org 15 December 2012 | Volume 7 | Issue 12 | e52905