assessment of drinking water quality and its health impact
TRANSCRIPT

Advances in Environmental Research, Vol. 6, No. 3 (2017) 203-216
DOI: https://doi.org/10.12989/aer.2017.6.3.203 203
Copyright © 2017 Techno-Press, Ltd.
http://www.techno-press.org/?journal=aer&subpage=7 ISSN: 2234-1722 (Print), 2234-1730 (Online)
Assessment of drinking water quality and its health impact on local community in coastal belt Karachi
Saleem Raza Samo, Raja Siraj Ahmed Channa and Kishan Chand Mukwana*
Energy & Environment Engineering Department, Quaid e Awam University of Engineering, Science and
Technology, Nawabshah, Sindh, Pakistan
(Received April 13, 2017, Revised October 31, 2017, Accepted November 13, 2017)
Abstract. For survival of human beings clean water is an essential commodity whereas contamination in
drinking water threatens to mankind. The main cause of water contamination is social and development
activities of human being along with increasing population. The community in the study area has acute
shortage of drinking water along with about 40 to 60% has no access to safe drinking water. This study
indicates drinking water quality of two major sources of coastal belt of Karachi one is supplied by Karachi
Water & Sewerage Board (KWSB) as tap water and the other through groundwater. The physicochemical
analysis was carried out by following the standard methods for checking the quality of drinking water. The
analyzed results showed that the quality of groundwater was unfit as potable water. The most critical
situation was observed as high level of contamination followed by high turbidity and increased salinity
levels. TDS in surface water were found 12% above and TDS in groundwater was 20% below the National
Drinking Water Quality Standards (NDWQS) of Pakistan as well as the permissible WHO drinking water
quality guidelines.
Keywords: coastal belt; tap water; groundwater; contamination; physicochemical; health; community
1. Introduction
Water is an essential natural resource that is vital for ecosystem functioning and human being
water is an essential component of life (Okoro et al. 2016). Water occupies more than 70% of the
Earth’s surface but out of this total stock less than 3% is sweet freshwater. Again out of this total
3% the quantity of freshwater accessible for human intake is hardly 0.01%; the remaining water is
confined in snow caps and glaciers (Ahmed et al. 2014). Accessible lesser portion of the Earth’s
total fresh water is becoming highly contaminated due to numerous human influenced activities
like dumping of residential, industrial and chemical waste along with application of fertilizers and
pesticides in agricultural practices. The human influenced practices induce numerous injurious
constituents in the water and they consequently cause water based and water related diseases in the
society (Soomro et al. 2011).
The situation is not good in developing countries as majority of the people use that water which
*Corresponding author, E-mail: [email protected]

Saleem Raza Samo, Raja Siraj Ahmed Channa and Kishan Chand Mukwana
is contaminated with objectionable level of toxic substances, pathogenic organisms as well
suspended solids (Amin et al. 2012). The United Nations (UN) in an study has projected that
around 2.5 billion people have no proper sanitary system in developing countries and more than
780 million have no access to potable water (UNICEF and WHO 2012). Resultantly
approximately 2.3 billion people are suffering from water related diseases all around the world
(UNESCO 2003).
In Pakistan, state of inferior water quality is one of the core health associated apprehensions.
The raw water sources both surface as well as groundwater are suspected to be contaminated with
numerous toxic compounds and microorganisms (Azizullah et al. 2011). World Health
Organization estimated that 1.6 million deaths of children per year are attributed to unsafe drinking
water, poor sanitation and lack of hygiene (WHO 2013). In Pakistan, it is estimated that 100-150
children die every day due to diarrhea infection caused by unsafe drinking water and unhygienic
conditions, about 65 to 75 million people of 2010 census are lacking safe drinking water and
sanitation. The demand of water will increase as the country’s current population about 194
million is projected to increase to 384 million in 2050, (Population Reference Bureau 2014).
The findings of various researchers show that about 68% rural population of Pakistan is
drinking water of poor quality (Tahir et al. 1998). One hundred million cases of diarrheal diseases
are being registered in hospitals of Pakistan within one year (Tahir et al. 1997). Poor water quality
is major health risk in Pakistan (Anwar et al. 2013).
Pakistan’s coastline is about 970 km; out of which Sindh’s coastline is 270 km long (Siddiqui
et al. 2004) and Karachi’s coastal belt is only 30 km. Currently Karachi the biggest, highly
industrialized and thickly populated city of Pakistan is experiencing severe air as well as water
pollution related issues (Waseem et al. 1995).
2. Purpose of study
This scientific study was conducted to determine:
• To determine the biological and the physicochemical characteristics of surface as well as
groundwater in the research area i.e., Karachi coastal belt.
• To compare the physicochemical as well as biological parameters with the Pakistan’s
National Water Quality Standards as well as WHO drinking water guidelines.
3. Area of researck work
The area of this research work focuses on coastline of Karachi city which lies in Malir district.
The Malir district is geographically located at 24◦ 45
◦ to 25
◦ 37
◦ N and 67
◦ 06
◦ to 67
◦ 34
◦E as shown
in Fig. 1. The area of Malir district is approximately 2268 square kilometers. The location area of
this research work is also shown in Fig. 1. Karachi city census reports 1998 of Malir along with
selected locations are given in Table 1. The name of villages in District Malir are: 1-Latt Basti
Goth, 2-Bakhtawar Goth, 3-Sach Dino Goth, 4-Rehri Miann Goth, 5-Rehri Miann Goth-2, 6- Salih
Mohammad Goth, 7-Dawood Usman Goth, 8-Hassan Jatt Goth, 9-Jumma Kalmati Goth, 10- Ali
Akber Shah Goath, 11-Ali Akber Shah Goath-2, 12-Chashma Goth.
204

Assessment of drinking water quality and its health impact...
Fig. 1 Map of district Malir and study area
Table 1 Local name of location and their code
Sr. No. Name of Location Code No.
1 Latt Basti Goth LB
2 Bakhtawar Goth Bakht
3 Sach Dino Goth SD
4 Rehri Miann Goth RM
5 Rehri Miann Goth–2 RM2
6 Salih Mohammad Goth SM
7 Dawood Usman Goth DU
8 Hassan Jatt Goth HJ
9 Jumma Kalmati Goth JK
10 Ali Akber Shah Goath AASh
11 Ali Akber Shah Goath - 2 AASh2
12 Chashma Goth Chash
205

Saleem Raza Samo, Raja Siraj Ahmed Channa and Kishan Chand Mukwana
The most common problem in this area is shortage and supply of polluted drinking water. The
source of drinking water is tribulation network and at the point of end user it is heavily
contaminated with fecal coliforms throughout the study area. The drinking water contamination
estimated accounts for 60 to 80 % of all waterborne diseases. This water pollution in the study area
is due to discharge of untreated industrial effluent of Karachi Export Processing Zone (KEPZ),
industries, factories, wastage of slaughterhouse and municipal wastewater directly in to the
neighborhood area and Arabian Sea. The stagnant untreated industrial effluent and municipal
wastewater is shown in Fig. 2.
4. Materials and methods
Twelve (12) different locations were selected for investigation of tap and groundwater quality.
The samples were taken during the months of May 2015 to January 2016, according to population
density in different area by method of cluster analyses (CA). The global position system (GPS)
coordinates are shown in Table 2 and also noted at each sample collection station to mark sample
location on the map of study area as shown in Fig. 3.
Fig. 2 Stagnant untreated industrial effluent and municipal wastewater
Table 2 Name of sample location and their coordinates
Sr. No. Name of location Latitude Longitude
1 Latt Basti Goth 24.816186 67.249868
2 Bakhtawar Goth 24.819293 67.233264
3 Sach Dino Goth 24.815173 67.241449
4 Rehri Mian Goth 24.815194 67.228924
5 Rehri Mian Goth-2 24.822294 67.240661
6 Salih Mohammad Goth 24.869619 67.244139
7 Dawood Usman Goth 24.820165 67.199032
8 Hassan Jatt Goth 24.815219 67.241519
9 Jumma Kalmati Goth 25.273525 66.754112
10 Ali Akber Shah Goath 24.803682 67.159719
11 Ali Akber Shah Goath - 2 24.803847 67.157809
12 Chashma Goth 24.803682 67.193981
206

Assessment of drinking water quality and its health impact...
Fig. 3 Location map of research area and location of sampling station
Two types of water samples i.e., tap water supplied by Karachi Water and Sewerage Board
(KWSB) and groundwater, were collected from the study area. During water samples analyses the
shallow groundwater is less saline, but the deep groundwater was found more saline. The usage of
groundwater increased in condition of shortage of water by Karachi Water and Sewage Board.
The samples from tap and ground water were collected in fresh polythene plastic bottles having
capacity of 0.5 and 1.0 liter each. The collected samples were placed in thermostat container at
25◦C and then they were analyzed (Samo et al. 2015). Prior to sample collection the sample bottles
were washed away properly and thoroughly rinsed with distilled water. Then the samples
immediately transported to the laboratory. The relevant equipment were calibrated as per standard
methods of water testing (APHA, AWWA and WEF 1998). After words all sample bottles were
brought to Pakistan Council for Research in Water Resources (PCRWR) laboratory, Karachi for
testing respective water quality parameters.
Under the study 36 numbers of samples were collected randomly from 12 sampling stations.
Samples were taken from the tap water of government sector Karachi Water and Sewerage Board
(KWSB) supply system as well as private sector borings. During sampling of tap water and
groundwater, noted proper location and depth of bore, health status, waterborne diseases, water
based and water related diseases through NGO’s, CBO’s, Social activates and local community
people of the study area.
5. Results and discussion
The collected water samples of tap water samples showed minimum result of Electrical
Conductivity (EC) as 603 µS/cm and maximum result of 933 µS/cm whereas the ground water
samples showed the minimum result of 3900 µS/cm and maximum result of 9960 µS/cm. On the
contrary the National Drinking Water Quality Standard (NDWQS) has not set guideline value. The
analyzed results of tap water and groundwater are shown in Figs. 4 and 5 respectively.
207

Saleem Raza Samo, Raja Siraj Ahmed Channa and Kishan Chand Mukwana
Fig. 4 Electrical Conductivity (E.C) of tap water at respective sampling locations
Fig. 5 Electrical Conductivity (E.C) of groundwater at respective sampling locations
The level of Total Dissolve Salts (TDS) of 95% of tap water samples were found under
acceptable levels and only 5% of water samples showed higher level. However in groundwater
samples the minimum TDS level was 2496 mg/L and maximum level was 6374 mg/L. Whereas
the National as well as WHO acceptable level is 1000 mg/L. The results of TDS of tap water and
groundwater are shown in Figs. 6 and 7 respectively.
Fig. 6 TDS results of tap water samples of respective sampling locations
208
Assessment of drinking water quality and its health impact...
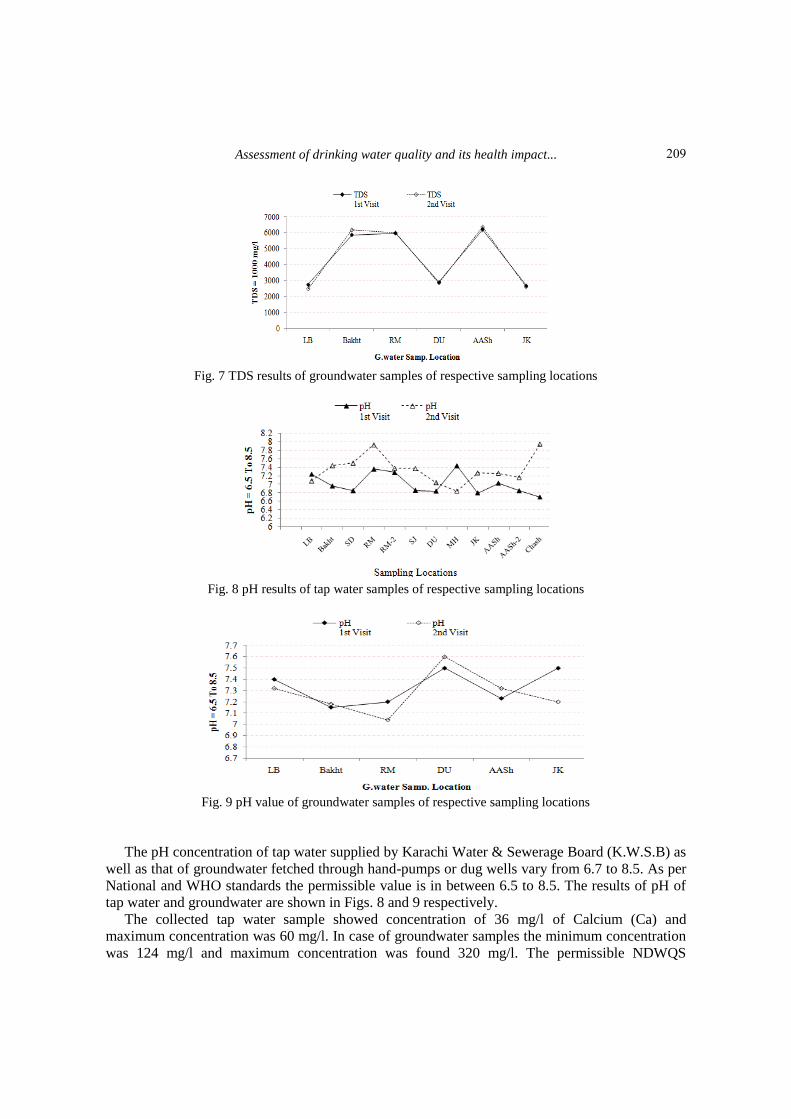
Fig. 7 TDS results of groundwater samples of respective sampling locations
Fig. 8 pH results of tap water samples of respective sampling locations
Fig. 9 pH value of groundwater samples of respective sampling locations
The pH concentration of tap water supplied by Karachi Water & Sewerage Board (K.W.S.B) as
well as that of groundwater fetched through hand-pumps or dug wells vary from 6.7 to 8.5. As per
National and WHO standards the permissible value is in between 6.5 to 8.5. The results of pH of
tap water and groundwater are shown in Figs. 8 and 9 respectively.
The collected tap water sample showed concentration of 36 mg/l of Calcium (Ca) and
maximum concentration was 60 mg/l. In case of groundwater samples the minimum concentration
was 124 mg/l and maximum concentration was found 320 mg/l. The permissible NDWQS
209

Saleem Raza Samo, Raja Siraj Ahmed Channa and Kishan Chand Mukwana
concentration is 75 mg/l. The results of Ca of tap water and groundwater are shown in Figs. 10 and
11 respectively.
The Magnesium (Mg) concentration was found less than permissible levels in all water
samples of tap water. Whereas in the ground water samples, 50% samples showed lower level as
against the permissible level and 50% samples showed above the permissible levels. The results of
Mg of tap water and groundwater samples are shown in Figs. 12 and 13 respectively.
Fig. 10 Results of Ca tap water samples of respective sampling locations
Fig. 11 Results of Ca groundwater samples of respective sampling locations
Fig. 12 Level of Mg of tap water samples of respective sampling locations
210

Assessment of drinking water quality and its health impact...
Fig. 13 Level of Mg of ground water samples of respective sampling locations
Fig. 14 Result of Na of tap water samples of respective sampling locations
Fig. 15 Result of Na of groundwater samples of respective sampling locations
In 95 % tap water samples the Sodium (Na) level was found under permissible limits and in
only 5 % of the samples Na was found above the limits. But in groundwater the minimum level of
211

Saleem Raza Samo, Raja Siraj Ahmed Channa and Kishan Chand Mukwana
Na was found 542 mg/l and maximum concentration was found 1420 mg/l. The permissible
National Standard as well as WHO guideline is 200 mg/L. The results of Na of tap water and
groundwater samples are shown in Figs. 14 and 15 respectively.
In 85% of tap water samples the Potassium (K) level was under permissible limits and in 15%
samples was above the limits. Where as in groundwater samples the K levels varies from 14.7 to
78.4 mg/l. The National Standard and WHO guideline for K is 12 mg/l. The results of K of tap
water and groundwater samples are shown in Figs. 16 and 17 respectively.
Fig. 16 The Result of K tap water samples of respective sampling locations
Fig. 17 The result of K of groundwater samples of respective sampling locations
Fig. 18 Result of Sulphate (SO4) of tap water samples of respective sampling locations
212

Assessment of drinking water quality and its health impact...
Fig. 19 Result of sulphate (SO4) of groundwater samples of respective sampling locations
The concentration of Sulphates (SO4) of all tap water samples were found below the acceptable
levels. However, in case of groundwater samples all the results of the samples showed higher
results in comparison to National Standards or WHO guidelines which is 250 mg/l. The results of
SO4 of tap water and groundwater samples are shown in Figs. 18 and 19 respectively.
The analyzed results of Chloride (Cl) in all the collected tap water samples were within the
acceptable levels. On the other hand, all the ground water samples indicated higher concentrations
as against the permissible National Standards as well as WHO guidelines which is 250 mg/l. The
results of Cl of tap water and groundwater samples are shown in Figs. 20 and 21 respectively.
Fig. 20 Result of Cl of tap water samples of respective sampling locations
Fig. 21 Result of Cl of groundwater samples of respective sampling locations
213

Saleem Raza Samo, Raja Siraj Ahmed Channa and Kishan Chand Mukwana
Fig. 22 Results of NO3-N of tap water samples of respective sampling locations
Fig. 23 Results of NO3-N of groundwater samples of respective sampling locations
The concentration of Nitrate-Nitrogen (NO3-N) in all the tap water samples was found within
the acceptable levels and in case of groundwater samples all of the water samples indicated higher
levels in comparison to the permissible National Standards as well as WHO guidelines which is 10
mg/l. The results of NO3-N of tap water and groundwater samples are shown in Figs. 22 and 23
respectively.
Fig. 24 Results of Fl of tap water samples of respective sampling locations
214
Assessment of drinking water quality and its health impact...
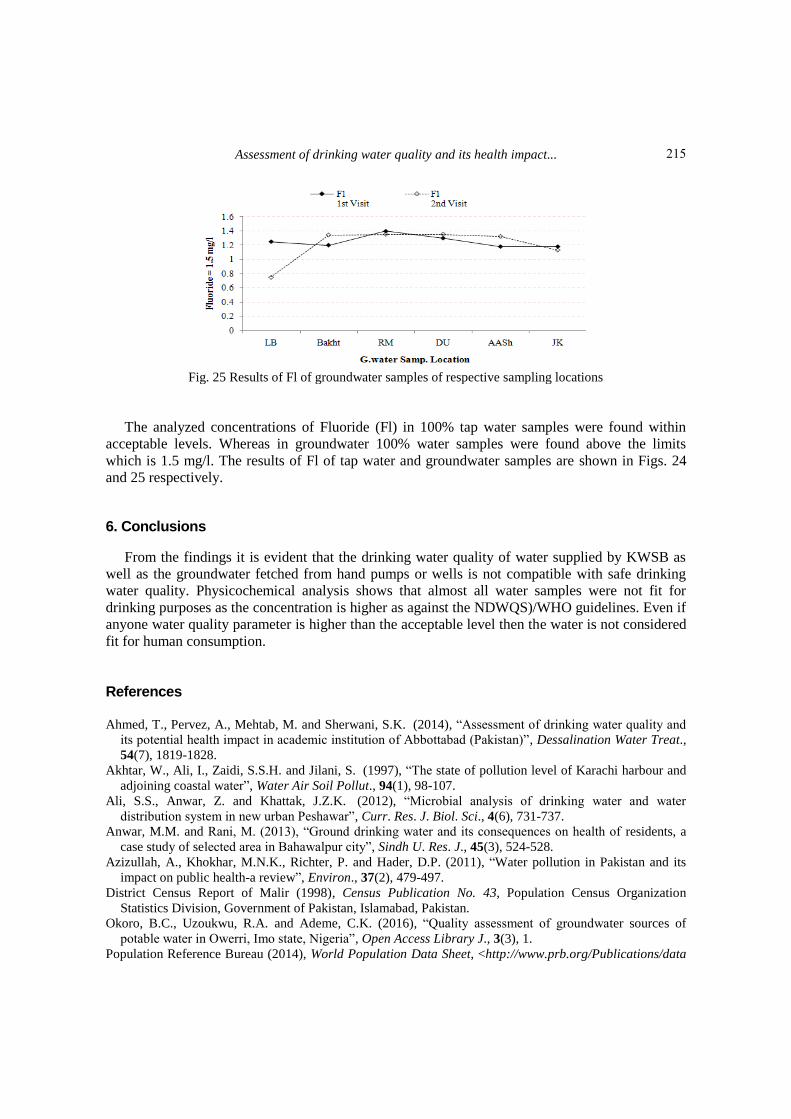
Fig. 25 Results of Fl of groundwater samples of respective sampling locations
The analyzed concentrations of Fluoride (Fl) in 100% tap water samples were found within
acceptable levels. Whereas in groundwater 100% water samples were found above the limits
which is 1.5 mg/l. The results of Fl of tap water and groundwater samples are shown in Figs. 24
and 25 respectively.
6. Conclusions
From the findings it is evident that the drinking water quality of water supplied by KWSB as
well as the groundwater fetched from hand pumps or wells is not compatible with safe drinking
water quality. Physicochemical analysis shows that almost all water samples were not fit for
drinking purposes as the concentration is higher as against the NDWQS)/WHO guidelines. Even if
anyone water quality parameter is higher than the acceptable level then the water is not considered
fit for human consumption.
References Ahmed, T., Pervez, A., Mehtab, M. and Sherwani, S.K. (2014), “Assessment of drinking water quality and
its potential health impact in academic institution of Abbottabad (Pakistan)”, Dessalination Water Treat.,
54(7), 1819-1828.
Akhtar, W., Ali, I., Zaidi, S.S.H. and Jilani, S. (1997), “The state of pollution level of Karachi harbour and
adjoining coastal water”, Water Air Soil Pollut., 94(1), 98-107.
Ali, S.S., Anwar, Z. and Khattak, J.Z.K. (2012), “Microbial analysis of drinking water and water
distribution system in new urban Peshawar”, Curr. Res. J. Biol. Sci., 4(6), 731-737.
Anwar, M.M. and Rani, M. (2013), “Ground drinking water and its consequences on health of residents, a
case study of selected area in Bahawalpur city”, Sindh U. Res. J., 45(3), 524-528.
Azizullah, A., Khokhar, M.N.K., Richter, P. and Hader, D.P. (2011), “Water pollution in Pakistan and its
impact on public health-a review”, Environ., 37(2), 479-497.
District Census Report of Malir (1998), Census Publication No. 43, Population Census Organization
Statistics Division, Government of Pakistan, Islamabad, Pakistan.
Okoro, B.C., Uzoukwu, R.A. and Ademe, C.K. (2016), “Quality assessment of groundwater sources of
potable water in Owerri, Imo state, Nigeria”, Open Access Library J., 3(3), 1.
Population Reference Bureau (2014), World Population Data Sheet, <http://www.prb.org/Publications/data
215

Saleem Raza Samo, Raja Siraj Ahmed Channa and Kishan Chand Mukwana
- sheet>.
Samo, S.R., Jatoi, A.R., Mangi, F.H., Lagari, A.N. and Mukwana, K.C. (2015), “Design of a slow sand bed
filtration system for purification of canal water”, Quaid-e-Awam U. Res. J. Eng. Sci. Technol., 14(1), 14-
18.
Siddiqui, M.N. and Majid, S. (2004), “Monitoring of geomorphological changes for planning reclamation
work in coastal area of Karachi, Pakistan”, Adv. Sp. Res., 33(7), 1200-1205.
Soomro, Z.A., Khokhar, M.I.A., Hussain, W. and Husain, M. (2011), Drinking Water Quality Challenges in
Pakistan, Pakistan Council of Research in Water Resources, Lahore, Pakistan, 17-28.
Tahir, M.A. and Rashid, A (1997), “Performance of local water decontamination product”, J. Drain. Water
Manage., 1, 70-74.
Tahir, M.A., Chandio, B.A., Abdullah, M. and Rashid, A. (1998), “Drinking water quality monitoring in the
rural areas of Rawalpindi”, Proceedings of the National Workshop on Quality of Drinking Water,
Islamabad, Pakistan, March.
UNESCO (2003), “Water for people water for life. The united nation world water development report”
United Nations Educational, Scientific and Cultural Organization.
UNICEF and WHO (2012), Progress on Drinking Water and Sanitation: Update, UNICEF and World
Health Organization, New York, U.S.A.
WHO, (2003), The Right to Water, World Health Organization, United Nation World Water Development.
CC
216