assessment of climate change on the agricultural resources ... · assessment of climate change on...
TRANSCRIPT
1
Assessment of Climate Change on the Agricultural
Resources of the Canadian Prairies
Wade N. Nyirfa1 and Bill Harron1 1 Agriculture and Agri-Food Canada, Prairie Farm Rehabilitation Administration, Regina, SK S4P 4L2
PARC QS-3 Determination of sustainability of farming practices on the Prairies with predicted climate change scenarios
Introduction “Since the settlement of the prairies in the 19th and early 20th centuries, land use and farming practices have evolved to match the various climates and soil types on the prairies and adapted to changing markets, technology and transportation systems. The abandonment of farms in the Special Areas of Alberta during the early 1920s and southwestern Saskatchewan in the 1930s, provides evidence of these adjustment processes. More recently, since the 1980s, there has been a reduction in summerfallow and an expansion of crop varieties, particularly in areas of higher moisture” (PFRA, 2000). This statement from the Prairie Agricultural Landscapes (PAL) report by PFRA reinforces the need for continued study on the impact of climate change on agricultural systems. Beside the social and economic factors, soil, landform, vegetation and climatic factors contribute greatly to the limitation of agricultural systems to change (Dumanski and Kirkwood, 1988; Huffman et al, 1993). There has been much discussion of the potential for climate change as the result of global warming. A study by the International Institute for Applied Systems Analysis (IIASA) a Global Agro-ecological Assessment for Agriculture in the 21st Century suggests that climate change will create varying impacts on crop production. Developed countries will gain substantial potential, with developing countries losing potential (Fischer et al, 2001). A more specific report on Adaptation of Agricultural Production to Climate change in Atlantic Canada suggests significant shifts away from small grain cereals to high energy and high protein crops (corn and soybeans) which adapt better to warmer climates (Bootsma et al, 2001). On the Prairies, temperature increase estimates range from 1 to 5 degrees Celsius and there will be less water supply, particularly in western Canada, due to shrinking glaciers in the Rocky Mountains (Schindler, 2001). The objective of this study is to develop a process to evaluate climate change impacts on agricultural resources of the Prairies and demonstrate the process using an accepted climate change scenario. Central to this process is the Land Suitability Rating System (LSRS) that was developed by agricultural experts to evaluate the potential of soils, landscapes and climate to
2
sustainably produce crops. The LSRS uses specific climate parameters that can be calculated from existing or climate model data, linking predicted climate change with the Soil Landscapes of Canada (SLC) to determine potential impacts. Output from the Canadian Global Circulation Model (CGCM1) was used to test the process and to analyze the impact of this scenario on agricultural land resources. The process and results from this study can lead to further analysis and discussion of potential impacts of climate change on Prairie agriculture. This project was supported mainly by the Prairie Adaptation Research Collaborative (PARC) and Agriculture and Agri-Food Canada (AAFC). Success of this project can be attributed to the many participants from the following agencies: GIS Unit and Prairie Agroclimate Unit, Prairie Farm Rehabilitation Administration
(AAFC/PFRA) Eastern Cereal and Oilseed Research Centre (ECORC) and the Western Land Resource
Group (WLRG), Research Branch, AAFC. Department of Geography, University of Regina Canadian Forest Service, Natural Resources Canada Canadian Institute for Climate Studies (CICS).
Methodology This study compares the 1961-1990 (30 year mean) climate normals and the 2040-2069 (30 year mean) climate model predictions for temperature, precipitation, precipitation minus potential evapotranspiration (P-PE), and effective growing degree days (EGDD). The climatic parameters (P-PE and EGDD) derived from this process were input into the Land Suitability Rating System (LSRS). This program, based on the Soil Landscapes of Canada (SLC), was used to determine changes in climate and land suitability rating between the two time periods. Land Suitability Rating System (LSRS) The LSRS is an interpretive system that rates the suitability of land for spring-seeded small grains (wheat, barley, oats, etc.) based on limitations for crop production. This system was developed in the early 1990s to replace the Canada Land Inventory (CLI) suitability rating for agriculture. The CLI seven class system was retained in the LSRS. Class 1 land has the highest suitability or least limitations and Class 7 land, the lowest suitability or greatest limitations (Agronomic Interpretations Working Group, 1995). The rating system is comprised of three components (climate, soils and landscape) which determine the suitability of land for crops. Each component is rated separately and is assigned a value between 100 and 0 (Table 1). The final land suitability rating is determined by the most limiting of the three components. The LSRS provides the suitability “class” and the “subclass” which describes the nature of the limitation (eg. aridity, stoniness, or steep slopes). Classes 1-3 are considered to be suitable for sustained crop production of spring-seeded small grains. Class 4 is considered marginal and 5-7 not suitable or incapable of sustainable production of these crops using current agricultural technologies (Agronomic Interpretations Working Group, 1995).

3
Table 1 Relationship of LSRS suitability class to index points Suitability Class Index Points Limitations for specified crop* 1 2 3 4 5 6 7
80-100 60-79 45-59 30-44 20-29 10-19 0-9
None to slight Slight Moderate Severe Very severe Extremely severe Unsuitable
* Limitations are for production of the specified crops. This does not imply that the land could not be developed for other crops or for other uses A computer program has been developed to interpret soil, landscape and climate information into LSRS classes and subclasses (Lelyk and Pettapiece, 1995). In this project, soil and landscape limitations were calculated using the soil component (CMP), soil names (SNF) and soil layer files (SLF) for the SLC (AAFC, 1995). The LSRS uses moisture deficit (P-PE) and temperature factor (EGDD) values to interpret climatic limitations. The climate data was compiled for SLC polygons using data provided by the Eastern Cereal and Oilseeds Research Centre (ECORC) and the Canadian Forest Service (CFS). The climate rating was applied to each SLC polygon, while the soil and landscape ratings were applied to each soil component. Calculations of area affected by climate change were based on the soil components. Maps for the two time periods were prepared showing the change in LSRS climate class and the change in the limiting LSRS (most limiting of climate, soil and landscape) class of the dominant soil component in each SLC polygon. Considerable work was required to interpret all of the soil, landscape and climate data for the Prairie provinces. The LSRS computer program requires a specific data structure and each file must conform to this structure. Missing data related to non-soil polygons (rock, ice) and provincial boundaries were provided by pedologists from the Western Land Resource Group (WLRG). Climate Change Scenarios The Canadian Institute for Climate Studies (CICS) and Meteorological Service of Canada/Canadian Centre for Climate Modeling and Analysis (CCCMA) have initiated a project called the Canadian Climate Impacts Scenarios (CCIS) (www.cics.uvic.ca/scenarios/) to provide a Canadian perspective on climate change scenarios for impacts researchers (Frischke and Sauchyn, 2000). The CICS web site offers Intergovernmental Panel on Climate Change (IPCC)-recommended future time periods: the 2020s (2010-2039), the 2050s (2040-2069) and the 2080s (2070-2099) for various climatic model scenarios. The Canadian model (CGCM1) developed by CCCMA was recommended for use in this study in a report completed by the University of Regina (Frischke and Sauchyn, 2000). The specific
4
model results used in this study are from a doubling of atmospheric carbon dioxide (2X CO2 Greenhouse Gas with Aerosol Simulation - GAX) scenario for the 2040-69 period at a gridded spatial resolution of 3.75 degrees latitude by 3.75 degrees longitude. The 2040-69 period was chosen because it represents a reasonable time interval to observe adjustments in agriculture to climate change. The recommendations to use the CGCM1 were based on several factors. Bootsma et al, 2001 used the CGCM1 in their study of Adaptation of Agricultural Production to Climate Change in Atlantic Canada. The model is considered to be quite stable, with the mean global temperatures, sea level pressure patterns and atmospheric circulation simulations considered to be close to reality and the general characteristics of the present baseline climate considered well modeled (Hengeveld, 2000). Calculation of LSRS Climate Parameters LSRS requires the climate parameters of (P-PE, EGDD) to be in a structured database format for each soil component. This necessitated converting the 1961-90 climate station information and the 2040-69 CGCM1 model results to LSRS compatible format. ECORC and CFS provided the following data interpolated to a 500 arc second grid (approximately 10 to 15 km): 1961-90 mean monthly temperature and precipitation data from climate stations 2040-69 mean monthly temperature and precipitation data from the CGCM1 results 1961-90 and 2040-69 P-PE and EGDD calculated from the mean monthly temperature
and precipitation data
The methodology to calculate climate parameters was used in Adaptation of Agricultural Production to Climate Change in Atlantic Canada (Bootsma et al, 2001). The 1961-90 mean monthly temperature and precipitation and the average monthly change in temperature and precipitation as determined by the CGCM1 were interpolated using ANUSPLIN software (A. Bootsma, pers. comm.). For each month, the change in temperature was added to the gridded station data, while each monthly gridded precipitation value was multiplied by the precipitation ratio. The mean monthly temperature and precipitation were interpolated to daily values using the Brooks sine wave interpolation procedure. These values were then used by ECORC and CFS to calculate P-PE and EGDD and were provided to PFRA in ArcInfo grid format.
For this project, the P-PE represents deficits from May 1 to August 31, and is consistent with the previously calculated LSRS value for 1951-80 (A. Bootsma, T. Brierley and W. Pettapiece, pers. comm.) The EGDD starts accumulating daily growing degree days 10 days after the mean temperature is >= 5 C in spring. EGDD stop accumulating the day before the average date of the first fall frost, ie. the first occurrence of minimum temperature <= 0 C (Bootsma, 2000). The ArcInfo grid cells were converted to centroid points. The temperature and precipitation, P-PE, and EGDD values for each SLC were then calculated as the average of the centroid points in the SLC. The LSRS climate file was created by assigning the SLC climate parameters to each soil component, with the value of P-PE set at –50 for May and 0 for September. Maps were created to show: mean annual maximum temperature (1961-90) and change in mean annual maximum
temperature

5
mean annual minimum temperature (1961-90) and change in mean annual minimum temperature
mean annual precipitation (1961-90) and change in mean annual precipitation moisture deficit (P-PE) for 1961-90 and 2040-69 temperature factor (EGDD) for 1961-90 and 2040-69
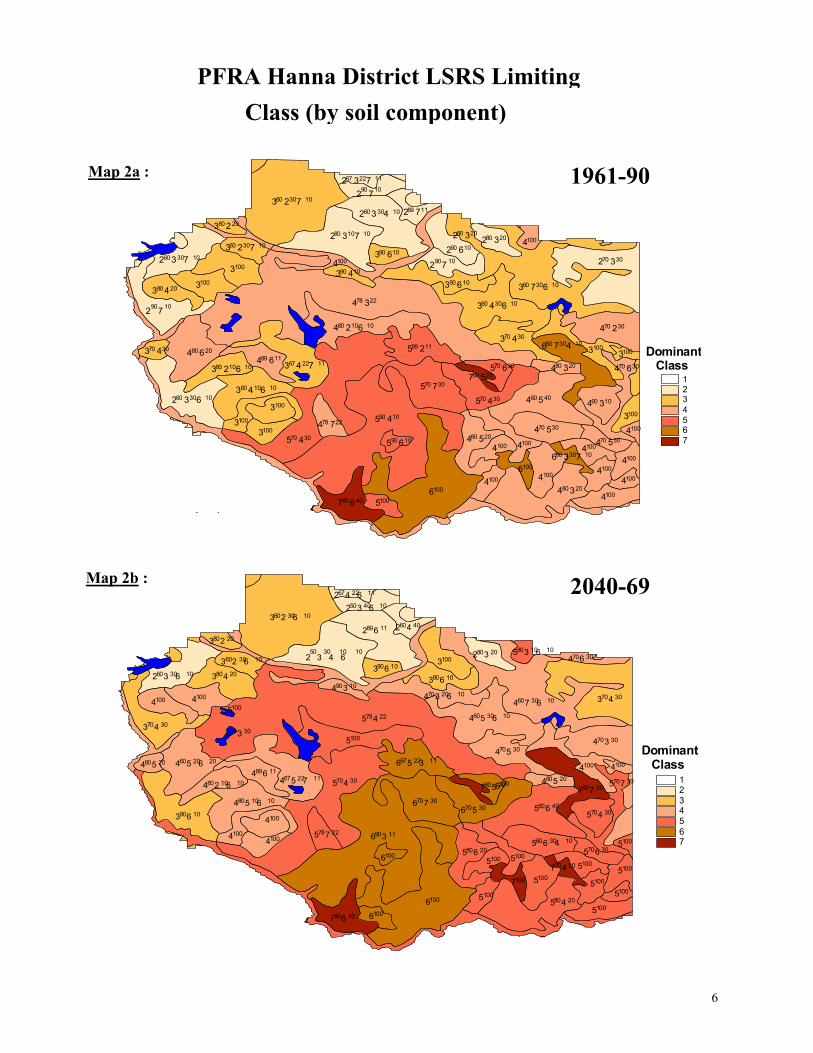
Calculation of LSRS Class Values Once all data was structured for the SLC soil components, the LSRS was run for 1961-90 and 2040-69 data to determine index points and suitability class for climate, landscape and soil limitations. It is important to note that this study has not taken into account any modifying factors such as excess spring and fall moisture or fall frost (Agronomic Interpretations Working Group, 1995). Maps for each time period were produced showing the climate class for each SLC and the final land suitability rating for the dominant soil component of the SLC. Maps were also produced to illustrate the change between the time periods. The impact of this change was measured in terms of potential agricultural land resources and current agricultural land. The analysis on current agricultural land used the total cropland from the 1996 agricultural census on an SLC basis to demonstrate the distribution of LSRS climate class change (Hiley, 1999). Although the LSRS classes are depicted on a Prairie-wide basis, the analysis is based on detail at the SLC soil component level. Map 1 depicts the Prairie provinces with the agricultural area as defined by the 1996 Agricultural Census. This line is referenced throughout the maps and discussion to distinguish between agricultural and non-agricultural area. Map 1 also shows the location of the PFRA Hanna District used to demonstrate the level of the detail of the analysis (Maps 2a and 2b).
Map 1 :
PFRA Hanna DistrictExtent of Agricultural Area
Prairie Provinces of Canada
3 2 660 30 10
2 4 667 22 11
2 3 650 40 10
5 3 680 10 10
2 3 660 30 10
2 460 402 689 11
4 7 660 30 10
2 3 4 650 30 10 10
3100
3 280 20
2 380 203 2 660 30 10
3 480 203 690 10
3 690 10
5 478 22
3 470 30
4 3 670 20 10
4 5 660 30 10
4 390 10
41004100
5100
5100
4 370 30
4 5 660 20 204 570 30
4 5 767 22 11
6 5 367 22 11
5 470 30
4 580 20
4 689 11
4 2 680 10 10
3 690 106 770 30
4 580 261007 580 20
6 570 30
6 390 11
4 5 680 10 105 660 40
4100 5 778 22
4100
51005 680 205 6 460 30
6100
4100
61005100
7 70
51007100
5 80 5100
7 690 10 6100
3 2 760 30 10
2 3 767 22 11
4 2 680 10 10
2 3 760 30 10
2 3 460 30 10
4100
2 789 11
3 7 660 30 10
2 3 780 10 10 2 380 203 280 20
2 380 20
2 790 10
3 2 760 30 10
3100
3 690 10 2 690 10
4 378 22
3 690 10
3 4 660 30 10
3 490 10
31003 480 20
4100
4 680 20
3 470 30
3 4 767 22 11
5 289 11
5 470 30
6 7 60 33 470 30
4 689 11
3 2 680 10 10
2 3 660 30 105 770 30
4 805 670 30
7 580 20
5 470 30
5 490 10
3 4 680 10 10
4 560 40
3100 4 778 22
3100
41004 580 204 570 30
6100
3100
5 690 104100
6 60
41006100
44100
7 660 40 5100
2 790 10
2 790 10
PFRA Hanna District LSRS Limiting Class (by soil component)
Map 2a :
Map 2b :
1961-902 370 30
3100
4 270 30
40 10
3100
4 670 303 20
4 390 10
4100
4 570 304100
41003 7 30 10
4100
380 204100
4100
1003
234567
1
Dominant Class
2040-696
4 670 30
3 470 30
4100
4 370 30
7 790 30
4100
5 770 300
5 470 30
10 5100
5 670 30
510051004 30
5100
4 205100
5100
234567
1
Dominant Class
7
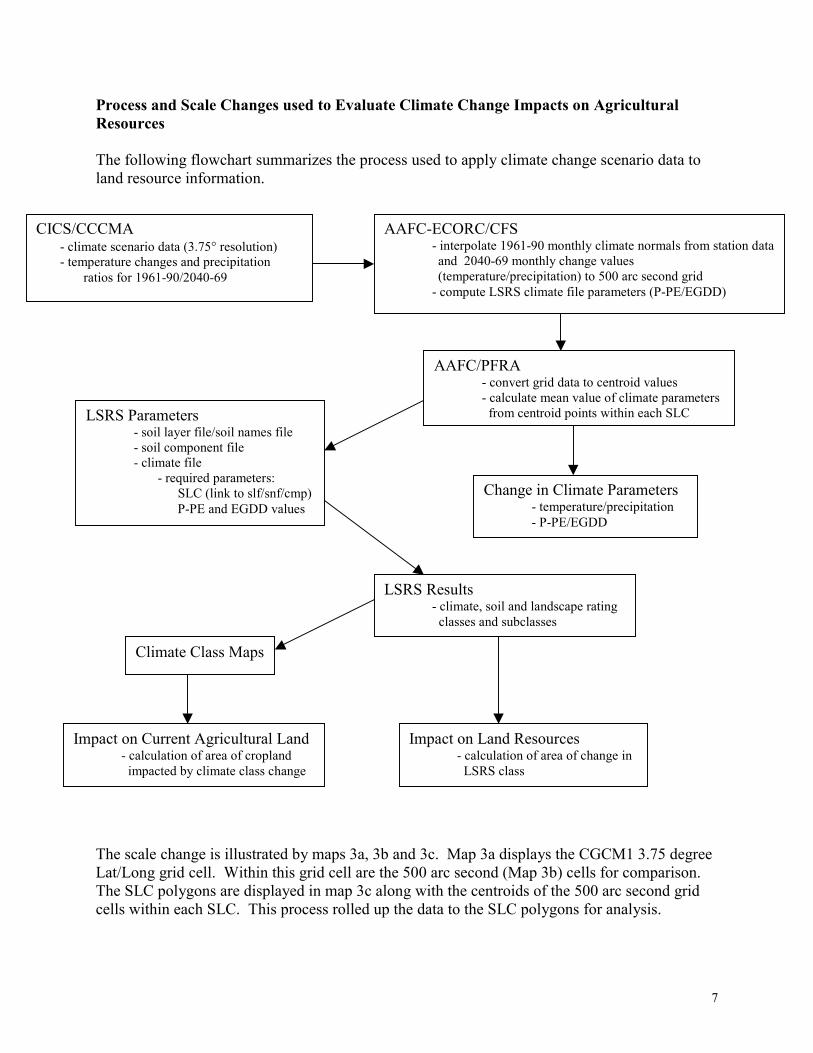
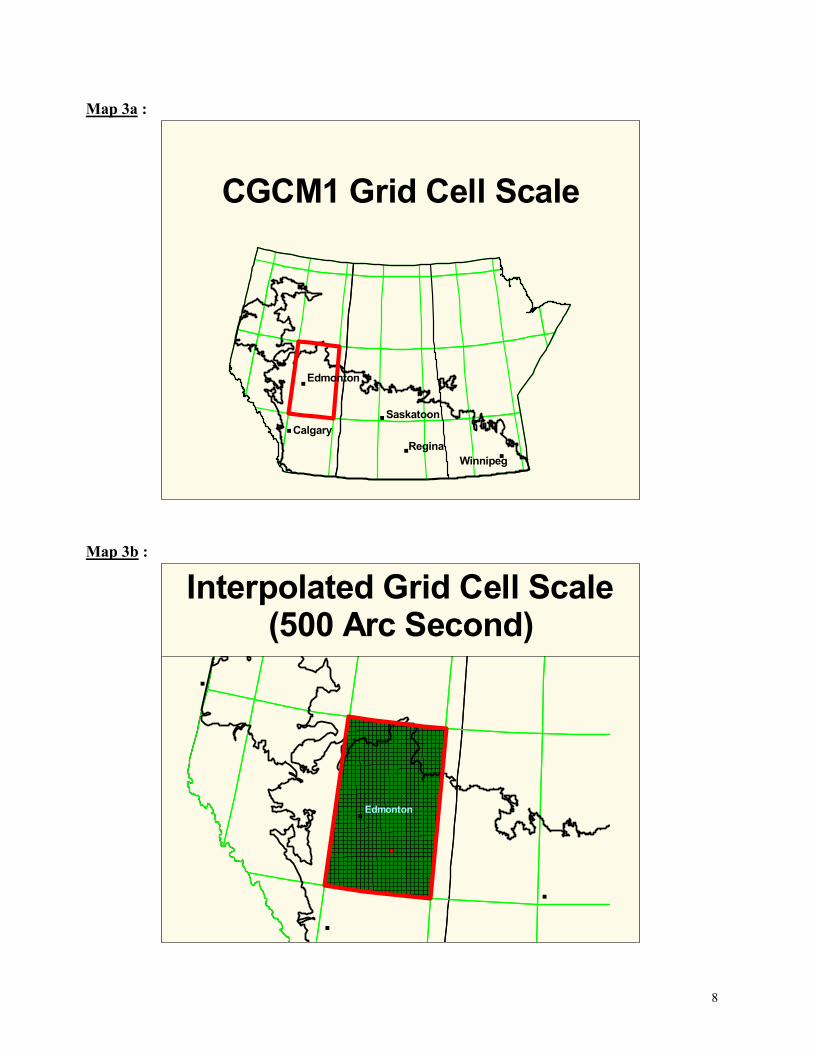
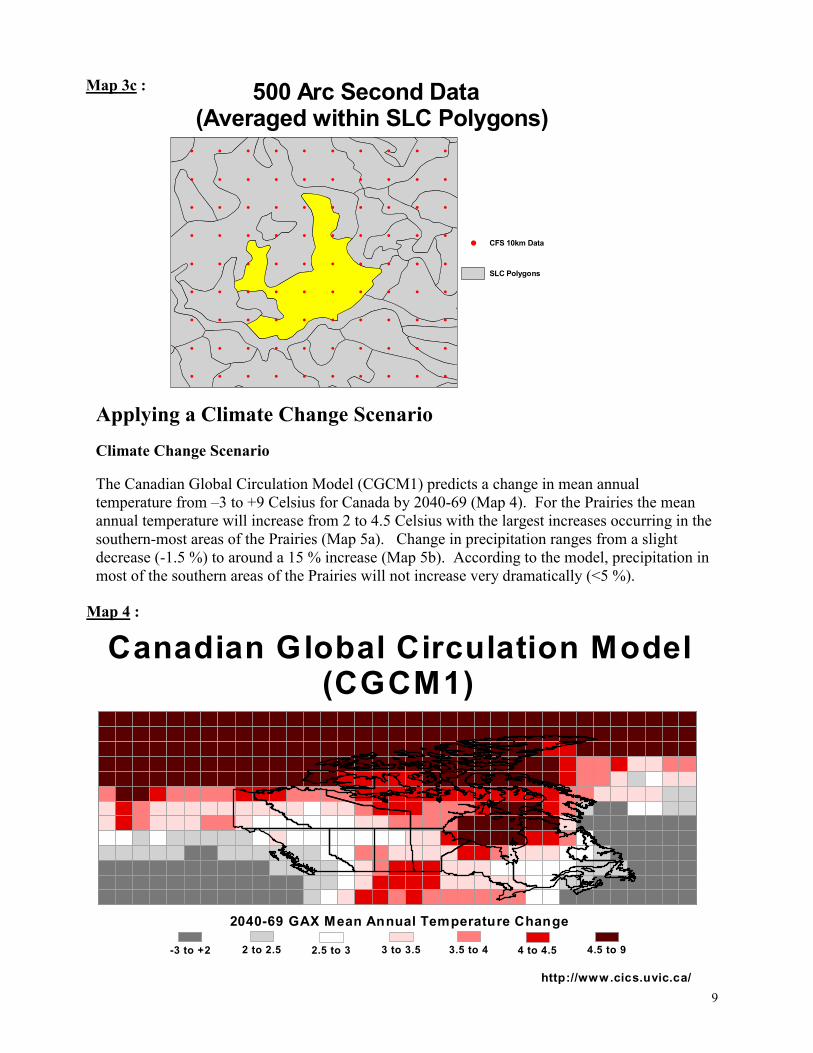
Process and Scale Changes used to Evaluate Climate Change Impacts on Agricultural Resources The following flowchart summarizes the process used to apply climate change scenario data to land resource information. The scale change is illustrated by maps 3a, 3b and 3c. Map 3a displays the CGCM1 3.75 degree Lat/Long grid cell. Within this grid cell are the 500 arc second (Map 3b) cells for comparison. The SLC polygons are displayed in map 3c along with the centroids of the 500 arc second grid cells within each SLC. This process rolled up the data to the SLC polygons for analysis.
CICS/CCCMA - climate scenario data (3.75° resolution) - temperature changes and precipitation ratios for 1961-90/2040-69
AAFC-ECORC/CFS - interpolate 1961-90 monthly climate normals from station data and 2040-69 monthly change values (temperature/precipitation) to 500 arc second grid
- compute LSRS climate file parameters (P-PE/EGDD)
AAFC/PFRA - convert grid data to centroid values - calculate mean value of climate parameters from centroid points within each SLCLSRS Parameters
- soil layer file/soil names file - soil component file - climate file
- required parameters: SLC (link to slf/snf/cmp) P-PE and EGDD values
Change in Climate Parameters - temperature/precipitation - P-PE/EGDD
LSRS Results - climate, soil and landscape rating classes and subclasses
Climate Class Maps
Impact on Land Resources - calculation of area of change in LSRS class
Impact on Current Agricultural Land - calculation of area of cropland impacted by climate class change
8
Edmonton
Calgary%
%
%
%
%
Regina
SaskatoonCalgary
Edmonton
Winnipeg
CGCM1 Grid Cell Scale
Edmonton
Calgary%
%
%
%
Edmonton
Interpolated Grid Cell Scale (500 Arc Second)
Map 3b :
Map 3a :
9
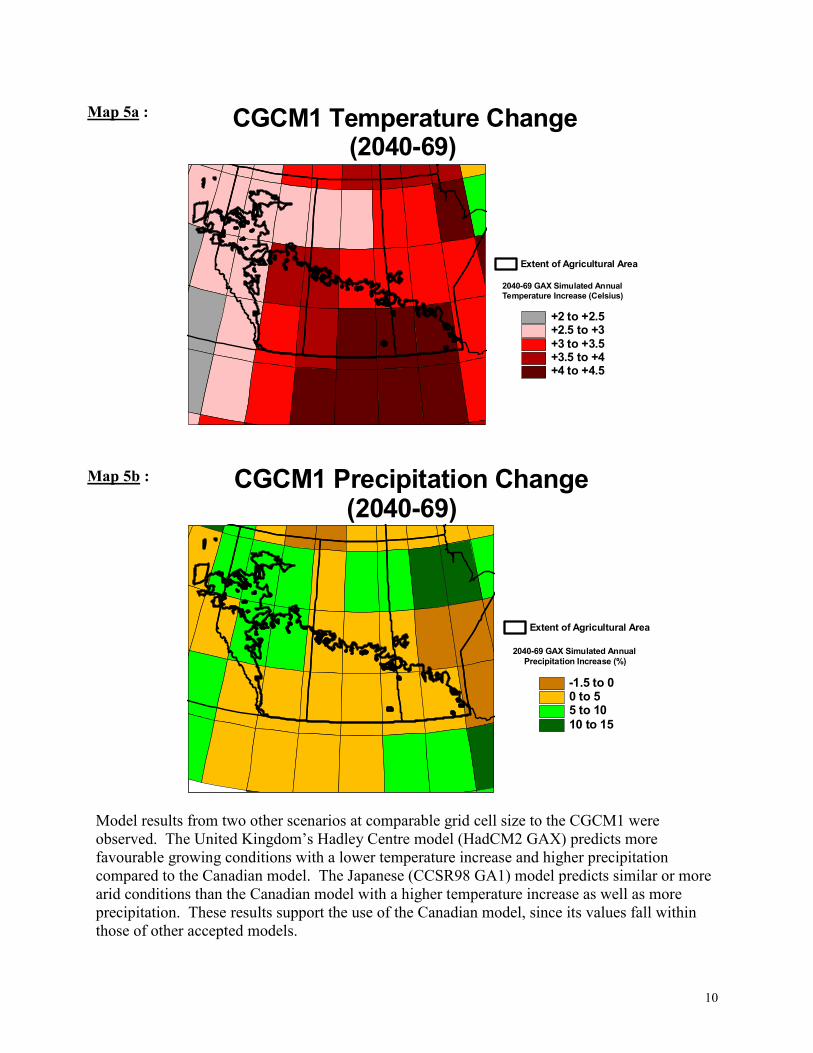
Applying a Climate Change Scenario Climate Change Scenario The Canadian Global Circulation Model (CGCM1) predicts a change in mean annual temperature from –3 to +9 Celsius for Canada by 2040-69 (Map 4). For the Prairies the mean annual temperature will increase from 2 to 4.5 Celsius with the largest increases occurring in the southern-most areas of the Prairies (Map 5a). Change in precipitation ranges from a slight decrease (-1.5 %) to around a 15 % increase (Map 5b). According to the model, precipitation in most of the southern areas of the Prairies will not increase very dramatically (<5 %).
Canadian Global Circulation Model (CGCM1)
2040-69 GAX Mean Annual Temperature Change
-3 to +2 2 to 2.5 2.5 to 3 3 to 3.5 3.5 to 4 4 to 4.5 4.5 to 9
http://www.cics.uvic.ca/
Map 3c :
# # # # # # # # # #
# # # # # # # # # #
# # # # # # # # # #
# # # # # # # # # #
# # # # # # # # # #
# # # # # # # # # #
# # # # # # # # # #
# # # # # # # # # #
# # # # # # # # # #
SLC Polygons
# CFS 10km Data
500 Arc Second Data (Averaged within SLC Polygons)
Map 4 :
10
Model results from two other scenarios at comparable grid cell size to the CGCM1 were observed. The United Kingdom’s Hadley Centre model (HadCM2 GAX) predicts more favourable growing conditions with a lower temperature increase and higher precipitation compared to the Canadian model. The Japanese (CCSR98 GA1) model predicts similar or more arid conditions than the Canadian model with a higher temperature increase as well as more precipitation. These results support the use of the Canadian model, since its values fall within those of other accepted models.
Extent of Agricultural Area
2040-69 GAX Simulated AnnualTemperature Increase (Celsius)
+2 to +2.5+2.5 to +3+3 to +3.5+3.5 to +4+4 to +4.5
CGCM1 Temperature Change (2040-69)
Extent of Agricultural Area
2040-69 GAX Simulated Annual Precipitation Increase (%)
-1.5 to 00 to 55 to 1010 to 15
CGCM1 Precipitation Change (2040-69)
Map 5a :
Map 5b :
11
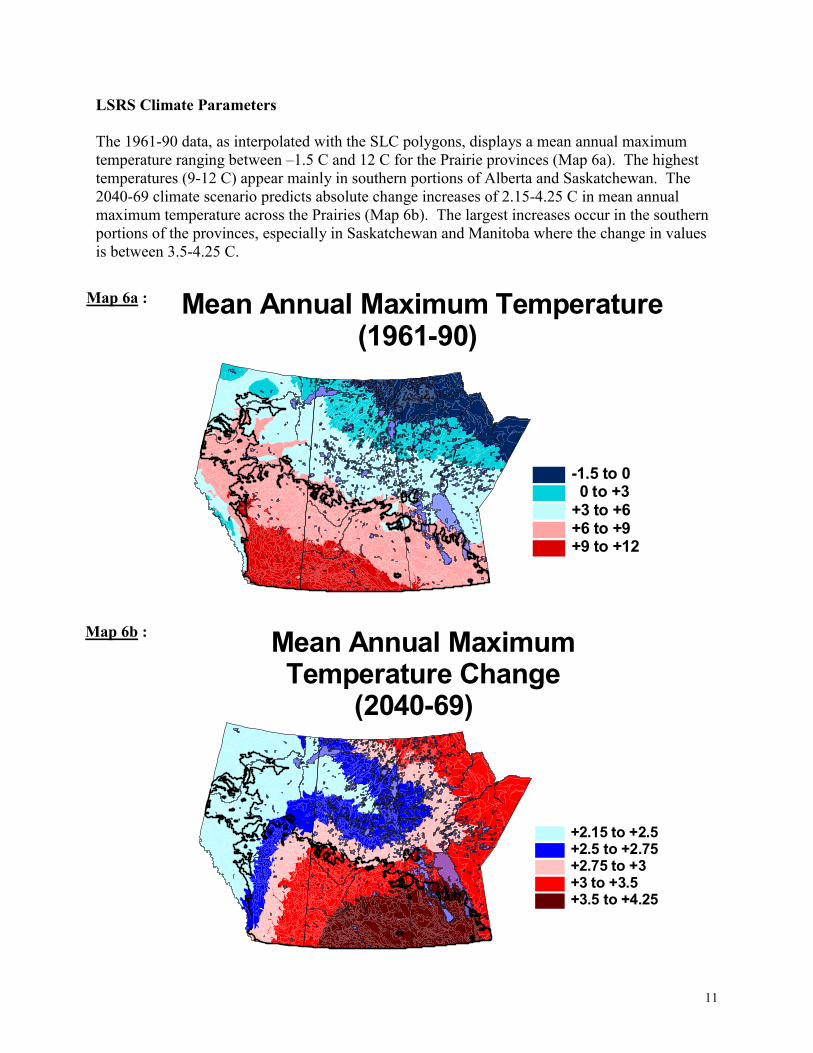
LSRS Climate Parameters The 1961-90 data, as interpolated with the SLC polygons, displays a mean annual maximum temperature ranging between –1.5 C and 12 C for the Prairie provinces (Map 6a). The highest temperatures (9-12 C) appear mainly in southern portions of Alberta and Saskatchewan. The 2040-69 climate scenario predicts absolute change increases of 2.15-4.25 C in mean annual maximum temperature across the Prairies (Map 6b). The largest increases occur in the southern portions of the provinces, especially in Saskatchewan and Manitoba where the change in values is between 3.5-4.25 C.
-1.5 to 0
+9 to +12+6 to +9+3 to +60 to +3
Mean Annual Maximum Temperature (1961-90)
Mean Annual Maximum Temperature Change (2040-69)
+2.15 to +2.5+2.5 to +2.75+2.75 to +3+3 to +3.5+3.5 to +4.25
Map 6a :
Map 6b :
12
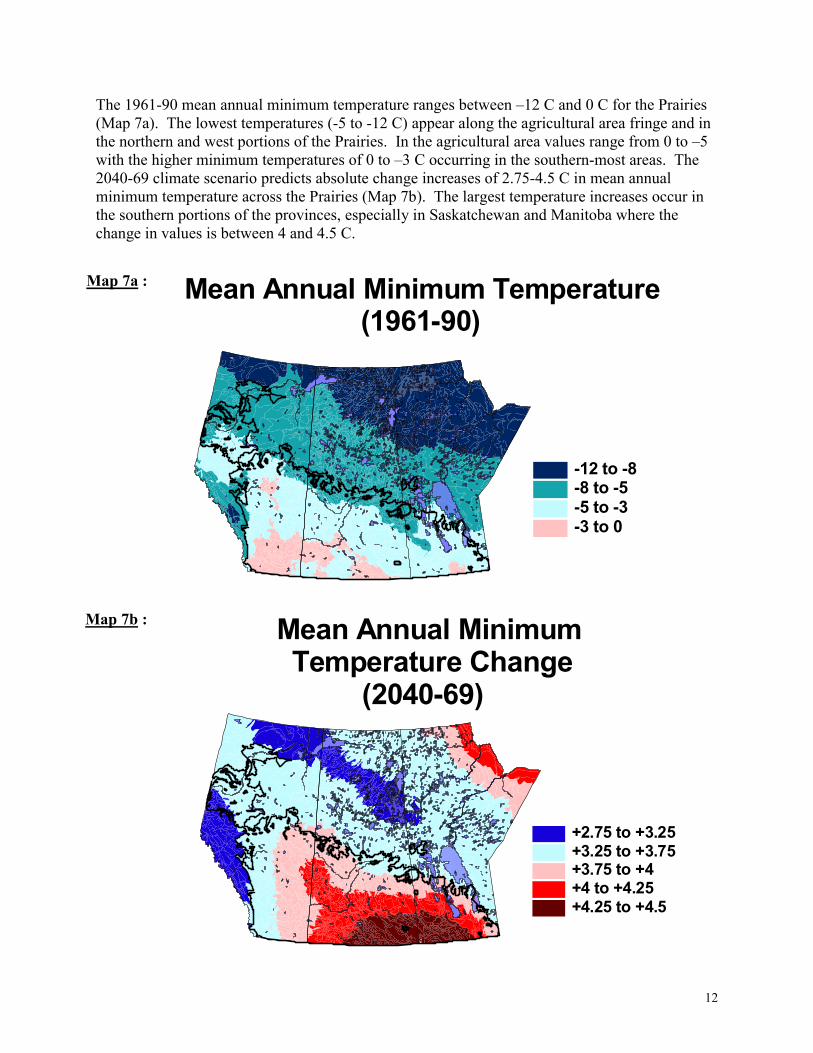
The 1961-90 mean annual minimum temperature ranges between –12 C and 0 C for the Prairies (Map 7a). The lowest temperatures (-5 to -12 C) appear along the agricultural area fringe and in the northern and west portions of the Prairies. In the agricultural area values range from 0 to –5 with the higher minimum temperatures of 0 to –3 C occurring in the southern-most areas. The 2040-69 climate scenario predicts absolute change increases of 2.75-4.5 C in mean annual minimum temperature across the Prairies (Map 7b). The largest temperature increases occur in the southern portions of the provinces, especially in Saskatchewan and Manitoba where the change in values is between 4 and 4.5 C.
-12 to -8-8 to -5-5 to -3-3 to 0
Mean Annual Minimum Temperature (1961-90)
Map 7a :
Map 7b : Mean Annual Minimum Temperature Change (2040-69)
+2.75 to +3.25+3.25 to +3.75+3.75 to +4+4 to +4.25+4.25 to +4.5

13
The 1961-90 data for mean annual precipitation ranges between 285 and 600mm for the Prairies (Map 8a). For the majority of the agricultural area of Alberta and Saskatchewan the values are 285-450mm with Manitoba at 450-600mm. The change for the 2040-69 period suggests increases in precipitation ranging from 3.75-75mm prairie-wide, with the majority of the agricultural area falling in the 3.75-30mm precipitation increase (Map 8b).
Map 8b :
Map 8a :
285 to 350350 to 450450 to 600600 to 1000> 1000
Mean Annual Precipitation (mm) (1961-90)
Mean Annual Precipitation Change (mm) (2040-69)
3.75-1515 - 3030 - 4545 - 6060-75
14
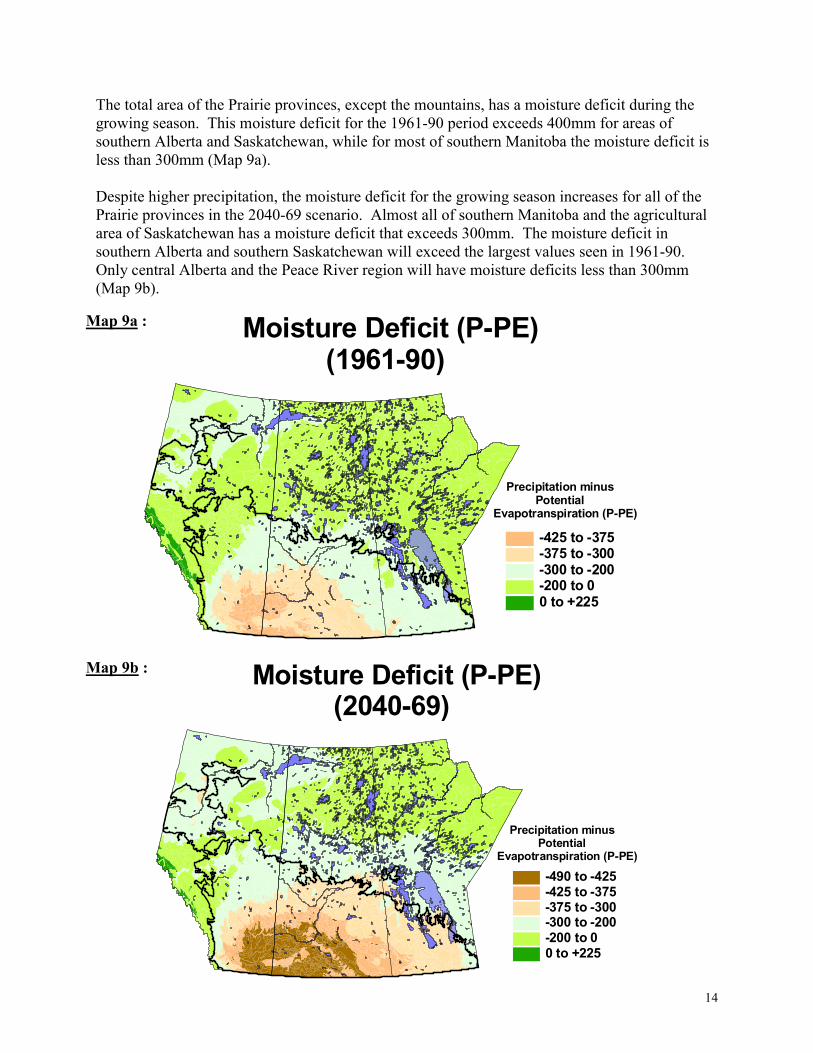
The total area of the Prairie provinces, except the mountains, has a moisture deficit during the growing season. This moisture deficit for the 1961-90 period exceeds 400mm for areas of southern Alberta and Saskatchewan, while for most of southern Manitoba the moisture deficit is less than 300mm (Map 9a). Despite higher precipitation, the moisture deficit for the growing season increases for all of the Prairie provinces in the 2040-69 scenario. Almost all of southern Manitoba and the agricultural area of Saskatchewan has a moisture deficit that exceeds 300mm. The moisture deficit in southern Alberta and southern Saskatchewan will exceed the largest values seen in 1961-90. Only central Alberta and the Peace River region will have moisture deficits less than 300mm (Map 9b).
Moisture Deficit (P-PE) (1961-90)
Precipitation minus Potential Evapotranspiration (P-PE)
-425 to -375-375 to -300-300 to -200-200 to 00 to +225
Map 9a :
Map 9b : Moisture Deficit (P-PE) (2040-69)
Precipitation minus Potential Evapotranspiration (P-PE)
-490 to -425-425 to -375-375 to -300-300 to -200-200 to 00 to +225

The Temperature Factor is the Effective Growing Degree Days (EGDD) which is calculated from the length of season, degree days, and day length, taking into account a longer day length at higher latitudes (Bootsma, 2000). The EGDD values for the 1961-90 period range between 50 and 500 in parts of western Alberta up to 1400 to 1650 in the southern areas of the Prairies (Map 10a). In general, most of the agricultural area falls in the 1200-1650 range. For the 2040-69 period, the modeled values predict that the temperature factor is allowing for a longer growing season with warmer temperatures. In most portions of the agricultural area of the Prairies values will be mostly all at 1650 and above, up to as high as 2400 EGDD (Map 10b). By comparison present day southern Ontario has EGDD values from 2000-2400 (W. Pettapiece, pers. comm.).
Map 10a15
Map 10b :
50 to 500500 to 10001000 to 12001200 to 14001400 to 1650
Temperature Factor (EGDD) (1961-90)
Temperature Factor (EGDD) (2040-69)
50 to 500500 to 10001000 to 12001200 to 14001400 to 16501650 to 20002000 to 2400

16
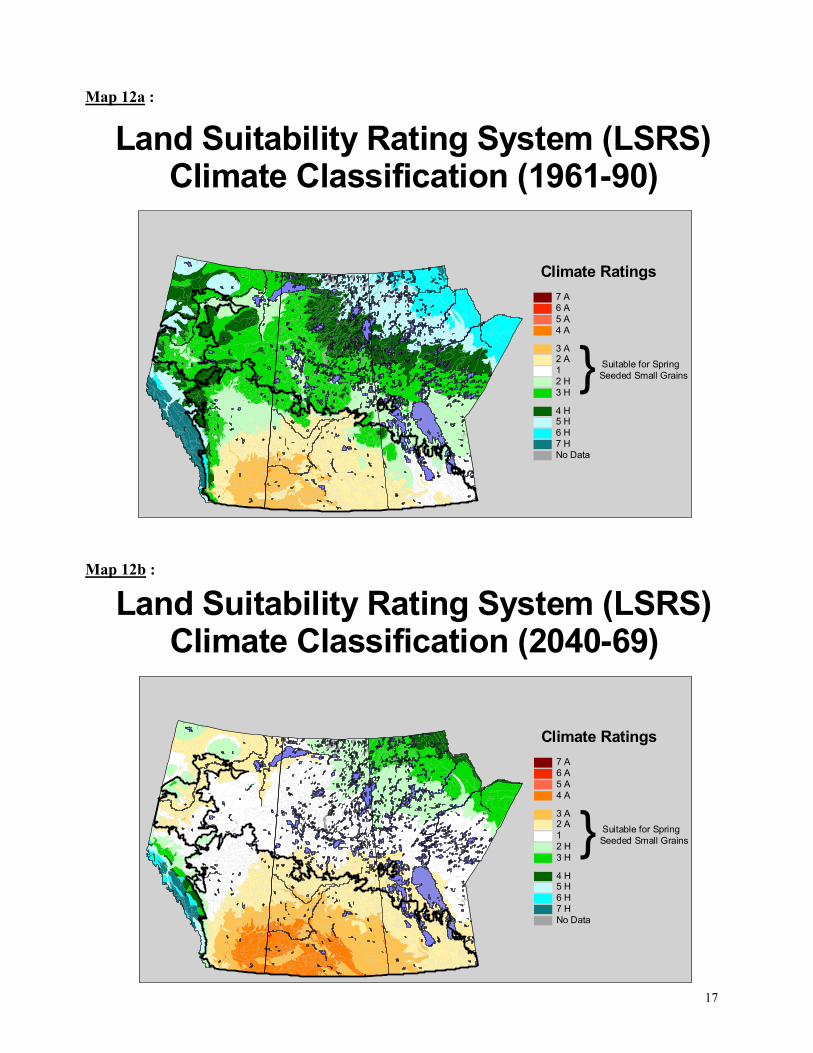
In the 2040-69 climate scenario precipitation increases do not keep pace with increasing temperatures, therefore, triggering a greater moisture deficit (drier) and a considerably longer growing season. LSRS Climate Rating The LSRS climate class rating results are depicted in maps 12a and 12b. The classifications are the result of the LSRS climate parameter changes for 1961-90 and 2040-69. The values display the class and a subclass representing the type of climate limitation. “A” indicates a moisture or aridity limitation required for optimal growth of the specified crops. “H” depicts a temperature or heat units limitation required for optimal growth of specified crops (Agronomic Interpretations Working Group, 1995). Discussion of the climate rating results refer to the Soil Zones of the Canadian Prairies (Map 11). The LSRS was developed using 1951-80 climate normals. This project provides, for the first time, LSRS interpretations using 1961-90 climate normals for the Prairies. The LSRS values for 1961-90 may differ from previously published maps and data. In addition, the LSRS ratings have never been validated for the more extreme aridity ratings predicted for some areas by the climate model for 2040-69 (W. Fraser, pers. comm.). The climate rating for 1961-90 shows class 3A within the southern (Brown soil zone) portions of Alberta and Saskatchewan, with only very small areas classed as 4A. Previous LSRS maps based on the 1951-80 climate normals indicated no class 4A climate rating at all on the prairies (W. Pettapiece, pers. Comm.).
Black
GrayDark GrayDark BrownBrown
Soil Zones of the Canadian PrairiesMap 11 :
17
Map 12a :
Map 12b :
Climate Ratings7 A6 A5 A4 A
3 A2 A12 H3 H
4 H5 H6 H7 HNo Data
} Suitable for SpringSeeded Small Grains
Land Suitability Rating System (LSRS) Climate Classification (1961-90)
Climate Ratings7 A6 A5 A4 A
3 A2 A12 H3 H
4 H5 H6 H7 HNo Data
} Suitable for SpringSeeded Small Grains
Land Suitability Rating System (LSRS) Climate Classification (2040-69)

18
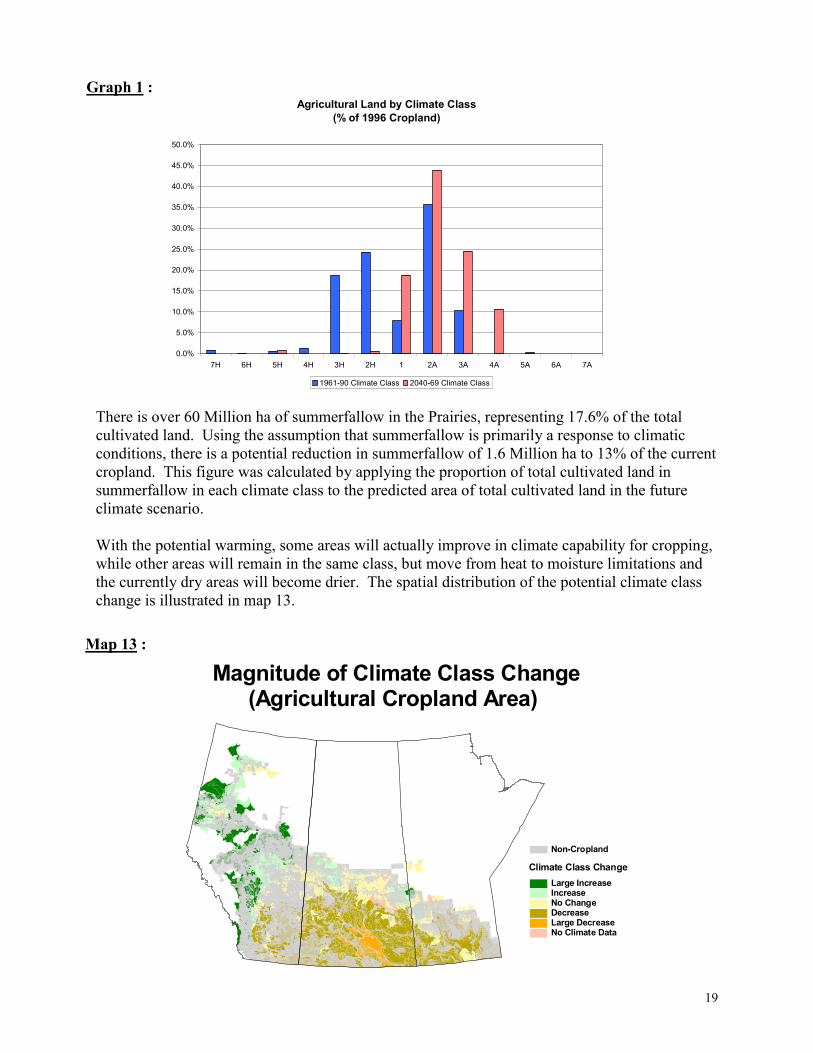
Most areas in the Dark Brown and Black soil zones are classed as 2A. Manitoba is the only province with class 1 climate over a large amount of its agricultural area. It also has 2A, 2H and 3H class climate along the Saskatchewan/Manitoba border and the fringe of the agricultural area. Saskatchewan’s agricultural fringe also has some class 2H and 3H. Alberta has a larger portion of 2H and 3H in central and the northern Peace River area. In the non-agricultural, northern portion of the Prairie provinces there is mainly 2H, 3H and 4H, with larger areas of northern Saskatchewan and Manitoba as 5H and 6H. In the 2040-69 scenario the climate rating for the southern (Brown soil zone) portions of Alberta and Saskatchewan changes from 3A in 1961-90 to 4A. Northward, in the Dark Brown and Black soil zones the class changes from mostly 2A to larger areas of 3A along with, however, a northern expansion of 2A. Most of Manitoba will have a 2A climate with pockets of southwestern areas as 3A along the Saskatchewan border. The climate in the northern extents of Saskatchewan’s agricultural area change to 2A from 2H and 3H. Central Alberta, and through the Peace River area will have larger areas of class 1 and 2A climate, an improvement from the 2H and 3H in 1961-90. The climate in the non-agricultural, northern portions of the Prairie provinces will change from 2H, 3H and 4H to large areas of class 1 and 2A with northern-most areas as 2H, 3H and some 4H. From these results it is evident that the changing climate classification depicts a warmer, drier growing season in the southern portion of the Prairies. Much of the present grain growing area in Manitoba, Saskatchewan and southern Alberta would face more severe climate limitations for spring-seeded small grain production in 2040-69. Warmer and drier conditions in central Alberta and the Peace River region may make this area more suitable for spring seeded cereals. In the northern extents of the agricultural area there could be agricultural expansion into traditionally non-agricultural areas, where soil and landscape permit, given the predicted climate change. Impact on Current Agricultural Land The scenario presented in this project suggests a warmer and, despite higher precipitation, a more arid climate. The southern Prairies are more likely to face drier conditions since that area is predicted to have larger increases in temperature and smaller increases in precipitation than the northwestern areas of the Prairies. These changes would result in a significant impact on the current agricultural land use of the Prairies. Graph 1 shows the distribution of cropland (based on 1996 agricultural census) for each climate class under 1961-90 conditions compared to the 2040-69 scenario. Currently, eight percent of the cropland is found in class 1 climate, while the remaining land is affected equally by aridity (A) or lack of heat (H). Under the 2040-69 scenario, 19% of the current cropland will be in class 1 climate, while only 1% will have heat limitations. Aridity will affect 80% of the land that is currently cropped. None of the land in 4A climate class is currently cropped, but by 2040-69, over 10% (3.0 Million ha) of the current cropland will be classified as climatically marginal for spring-seeded small grains.
19
There is over 60 Million ha of summerfallow in the Prairies, representing 17.6% of the total cultivated land. Using the assumption that summerfallow is primarily a response to climatic conditions, there is a potential reduction in summerfallow of 1.6 Million ha to 13% of the current cropland. This figure was calculated by applying the proportion of total cultivated land in summerfallow in each climate class to the predicted area of total cultivated land in the future climate scenario. With the potential warming, some areas will actually improve in climate capability for cropping, while other areas will remain in the same class, but move from heat to moisture limitations and the currently dry areas will become drier. The spatial distribution of the potential climate class change is illustrated in map 13.
Climate Class Change Large IncreaseIncreaseNo ChangeDecreaseLarge DecreaseNo Climate Data
Non-Cropland
Magnitude of Climate Class Change (Agricultural Cropland Area)
Agricultural Land by Climate Class(% of 1996 Cropland)
0.0%
5.0%
10.0%
15.0%
20.0%
25.0%
30.0%
35.0%
40.0%
45.0%
50.0%
7H 6H 5H 4H 3H 2H 1 2A 3A 4A 5A 6A 7A
1961-90 Climate Class 2040-69 Climate Class
Graph 1 :
Map 13 :

20
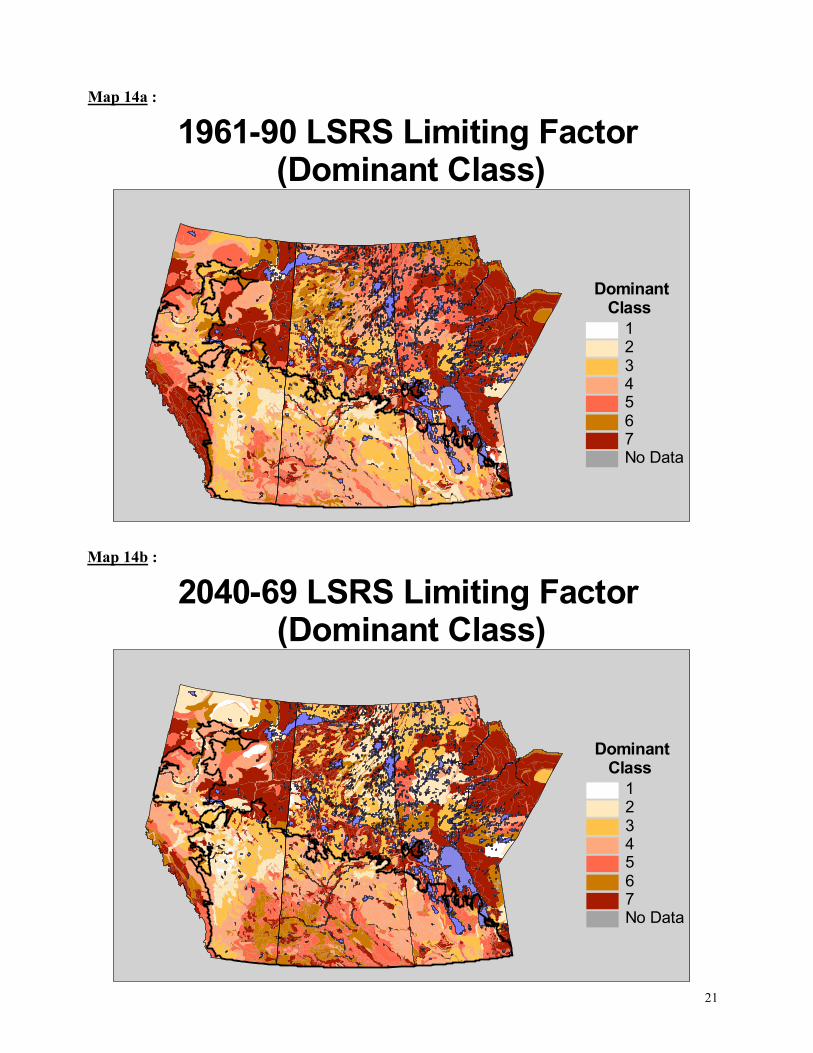
An improvement of 2 or more classes in climate rating is predicted for 12% of the cropland. Much of these increases will occur on the current agricultural fringe, where heat units limit cropping options. In these areas, there is a high proportion of pasture and forage lands. Some of these lands will likely be converted to cultivated land, where the soils and topography are suitable. An improvement of 1 climate rating class occurs on 19% of the cropland. Most of this increase occurs in the lands currently cropped to small grains, particularly barley, in central Alberta, the Peace River area. Other areas where there is an improvement of climate for cropping is in areas of majority pasture along the agricultural fringe in Saskatchewan. These areas could have wider cropping options and a conversion of pasture and forage to cultivated land, where the soils and topography are suitable. No change in overall climate class occurs on 26% of the cropland. Although there is no change in the climate class most of this land has changed from 2H or 3H to 2A or 3A, indicating that the climatic limitation will be lack of moisture instead of lack of heat. The majority of these areas are in central Alberta and northeastern Saskatchewan where there will likely be a shift from short season grains such as barley to longer season crops such as wheat, pulses and oilseeds. A decrease in climate rating (degradation of 1 class) occurs on 40% of the cropland, but mainly affects the most diverse and productive areas of the prairies. Over 2/3 of this change occurs in the low summerfallow areas of the Black soil zone. In many cases this is an change from Class 1 to Class 2A or 2H to 3A. This change implies a narrower range of crops and an increase in summerfallow to compensate for the increased aridity. Almost 2/3 of the crops on highly productive Black lacustrine and till soils of the eastern Prairies will be affected. A large decrease in climate rating (degradation of 2 or more classes) occurs on only 2% of the cropland, affecting an area of southern Saskatchewan near Regina. In this area there may be a shift to more pasture, more summerfallow, more winter wheat and early seeded crops to avoid late season drought. The climate change scenario presented in this project will provide significant adaptive challenges to the current agricultural system. The warmer and drier conditions will lead to cropping changes, shifts in pasture areas and possible expansion of cultivated land to new areas. Impact on Land Resources The impact on land resources concentrates on the 1961-90 and 2040-69 LSRS limiting maps (Maps 14a and 14b). This is the most limiting value of the climate, soil and landscape ratings produced from the LSRS. Examining the 1961-90 map, the agricultural area consists largely of class 4 rated land for southern Alberta and Saskatchewan with some pockets of 5, 6 and 7 located mostly in the Brown soil zone. In Manitoba, land within the agricultural area, which is located in the more productive Black soil zone, is classed mainly as 3 and 4 with small pockets of 1, 2, 5, 6, and 7. In northern extents of the agricultural areas of Saskatchewan, land is classed as 2 and 3 with small areas of 4,
21
1234567No Data
Dominant Class
1961-90 LSRS Limiting Factor (Dominant Class)
Map 14a :
1234567No Data
Dominant Class
2040-69 LSRS Limiting Factor (Dominant Class)
Map 14b :
22
5, 6, and 7 also. This is land within the Dark Brown, Black and Dark Gray soil zones. The majority of central to western and northern extents of Alberta’s agricultural area, including Peace River, are classed as 2 and 3, with pockets of classes 4, 5, 6, and 7 also. In the non-agricultural area of the Prairies there is a majority of class 7 land. This is mainly due to the temperature factor and the shallow soils over the rock of the Canadian shield across much of Manitoba and Saskatchewan. There are, however, areas of Alberta and Manitoba where a longer growing season could create more suitable conditions for agriculture. The 2040-69 LSRS Limiting map demonstrates considerable change. Southeastern Alberta and the majority of southern Saskatchewan is rated as classes 5, 6 and 7, mainly in the Brown and Dark Brown soil zones. The Black and Dark Gray are class 4 mainly in the rest of Saskatchewan’s agricultural area, with small pockets of classes 2 and 3 also. In Manitoba, land is rated as 3, 4 and 5 with some 6 and 7 in pockets and along the Manitoba/Ontario border. In the southwest and more central to northern portions of Alberta’s agricultural area there is more class 2, 3 and 4 with some small areas of class 1. In the Peace River area there is mainly class 4 with some small areas of classes 2, 3, 5, 6 and 7. Areas of non-agricultural land still remain largely as class 7, however, include a scattering of the other classes across all provinces. The LSRS takes into account the ability of the soil to maintain adequate moisture to produce a crop. In the southern portions of Alberta and Saskatchewan, the aridity, reflected in 4A climate, combined with the soil texture, produces 5M class land. In areas of higher moisture, the soil texture is not as significant a limitation. In southern Manitoba and across the more northern portions of the agricultural area moisture levels are higher and consequently the LSRS ratings are higher. Further illustrating the changes occurring in land resources on the prairies, the following graph depicts the class changes and percent of land area affected by the change. Graph 2 compares agricultural vs. non-agricultural area. There is very little class 1 within the agricultural area for either time period. In the non-agricultural area, however, the area of class 1 land increases quite substantially for 2040-69. Class 2 land in the agricultural area decreases a little while non-agricultural class 2 land area increases by more than five times. Land area for class 3 decreases by nearly half in the agricultural area while the non-agricultural area class 3 increases. For class 4 land decreases are observed in both agricultural and non-agricultural land area. The amount of class 5 almost doubles in the agricultural area, with the non-agricultural decreasing in area by more than half. Increases in agricultural area is observed for class 6 land with non-agricultural area class 6 remaining fairly consistent. Finally, class 7 land increases by about a third in the agricultural area, however, decreases slightly in the non-agricultural area.

23
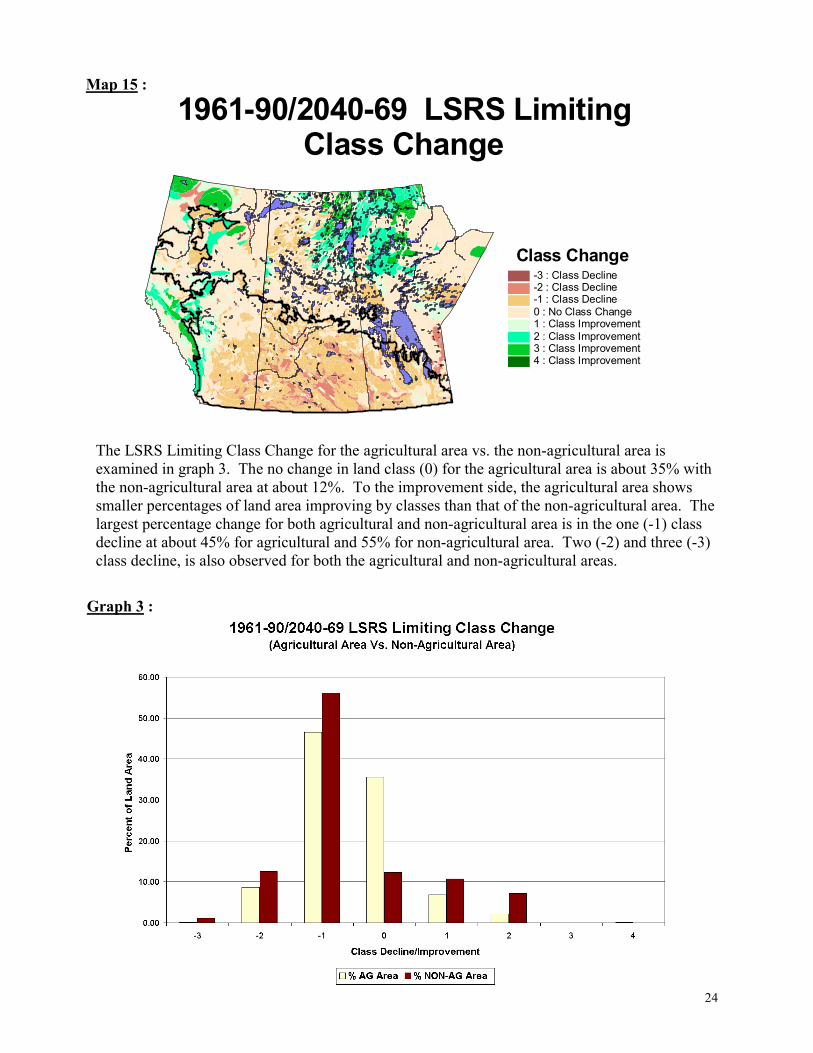
From this analysis it is evident that substantial changes in LSRS Limiting class would significantly altar the agricultural area of the Prairies according to the climate change inputs from the model. With the climate scenario predictions for temperature, precipitation, P-PE, and EGDD note that the area of class 5, 6 and 7 land across the heartland of the agricultural area in Alberta and Saskatchewan mainly appears to be caused by the increasing temperature. The growing season is longer (maps 10a and 10b) and there is also increased precipitation (maps 8a and 8b). However, increased evapotranspiration (maps 9a and 9b) causes the drier conditions thus putting a further limitation on the land resource. Areas of Manitoba, while affected by the changing climate somewhat do not see as large a change as they may receive higher moisture levels. In the west, central and northern areas of Alberta there is less of a change than in the warmer and drier southern portions of Alberta and Saskatchewan. This would be due to the higher temperature and moisture levels not evaporating as much as is evident in the southern areas. The LSRS Limiting Class Change map illustrates the magnitude of change from the 1961-90 LSRS ratings and the 2040-69 LSRS ratings (Map 15). A “0” indicates no change and this map demonstrates that a large portion of the northern area of the Prairies may not experience any change. No change is also is also evident in pockets within the agricultural areas of each province, especially in the central and Peace River areas. Over the rest of the agricultural area, the change is generally observed as being a one (-1) or two (-2) class decline (ie. class 2 to 3 or 2 to 4). Improvement in class does occur in small pockets within the agricultural area, however, is quite minimal in Saskatchewan and Manitoba. In the more western portions of Alberta’s agricultural area there is larger areas with one (+1) and two (+2) class improvement. Outside the agricultural area to the west and in northern, non-agricultural areas of the Prairies, class improvements of one (+1), two (+2), three (+3), and four (+4) are observed.
Graph 2 :
24
The LSRS Limiting Class Change for the agricultural area vs. the non-agricultural area is examined in graph 3. The no change in land class (0) for the agricultural area is about 35% with the non-agricultural area at about 12%. To the improvement side, the agricultural area shows smaller percentages of land area improving by classes than that of the non-agricultural area. The largest percentage change for both agricultural and non-agricultural area is in the one (-1) class decline at about 45% for agricultural and 55% for non-agricultural area. Two (-2) and three (-3) class decline, is also observed for both the agricultural and non-agricultural areas.
Map 15 :
1961-90/2040-69 LSRS Limiting Class Change
Class Change-3 : Class Decline-2 : Class Decline-1 : Class Decline0 : No Class Change1 : Class Improvement2 : Class Improvement3 : Class Improvement4 : Class Improvement
Graph 3 :

25
Conclusions A process was developed that converted coarse scale climate change scenario data into a finer scale format that allowed climate change impact analysis of agricultural land resources. Central to this process is the Land Suitability Rating System (LSRS) that was developed by agricultural experts to evaluate the potential of soils, landscapes and climate to sustainably produce crops. The LSRS uses specific climate parameters that were calculated from existing and climate model data, linking predicted climate change with the Soil Landscapes of Canada (SLC) to determine potential impacts. In this study, a few considerations must be acknowledged with respect to the LSRS. At this scale of study, the program has not been tested on all of the soil codes that exist across the prairies, however, only minor areas are affected. Secondly, the SLC component file, unlike the detailed soil files, has only four broad slope classes and no stoniness class. This could result in the LSRS under-rating landscape limitations, particularly for very stony soils, such as those in the Manitoba Interlake region (W. Fraser, pers. comm.). The LSRS was developed using 1951-80 climate normals. This project provides, for the first time, LSRS interpretations using 1961-90 climate normals for the Prairies. The LSRS values may differ from previously published maps and data. The LSRS ratings have not been validated for the extreme aridity ratings predicted for some areas by the climate model for 2040-69 (W. Fraser, pers. comm.). The results from this study of the observed climate station data demonstrate that current (1961-90) agricultural production on the Prairies is constrained by moisture and heat in the Brown soil zones of the Prairies and more by heat along with occasional moisture deficits in the Black soil zones and further northward into the Gray soil zones. Changes predicted by the Canadian Global Circulation Model (CGCM1) for the 2040-69 period suggest a significantly higher moisture limitation over much of the agricultural area causing concern regarding the production of spring-seeded small grain crops. Driving these changes are increasing temperature and evapotranspiration that is not offset by predicted increasing precipitation. The warmer and drier conditions will present adaptation challenges for the current agricultural system resulting in cropping changes, shifts in pasture areas and the possible expansion of cultivated land to new, traditionally non-agricultural areas. In any event, significantly more work would be required to determine the adaptability of current cropping systems to this climate scenario. The results achieved with this study are best suited to stimulate discussion. The objective of this study was to develop a process to evaluate climate change impacts on agricultural resources of the Prairies and demonstrate the process using an accepted climate change scenario. Although the IPCC recommends users apply multiple scenarios in their research to demonstrate the range of predicted results (www.cics.uvic.ca/scenarios/), this project uses only the output from the Canadian Global Circulation Model (CGCM1) to test the process and to analyze the impact of this scenario on agricultural land resources. The process and results from this study can lead to
26
further analysis and discussion of potential impacts of climate change on Prairie agriculture. Future work could include other climate change scenarios in this process. Agriculture as we know it today could require dramatic adaptation. Being prepared for possible change is the best way to adapt to that change if or when it is required. "In the fields of observation chance favors only the prepared mind." -Louis Pasteur Acknowledgements The authors would most gratefully like to thank a number of individuals who contributed their time, assistance and insight into this project. The success of this study would not have been possible without their data support, technical assistance and helpful review comments. Andrew Bootsma, Peter Schut, AAFC, Eastern Cereal and Oilseed Research Centre, Ottawa, Ontario; Tony Brierley, Walter Fraser, Warren Eilers, AAFC, Western Land Resource Group; Dan Mckenney, Kevin Lawrence, Natural Resources Canada, Canadian Forest Service, Sault Ste. Marie, Ontario; David Ackerman, Karla Magnusson, Malcolm Black, Ted O’Brien, AAFC, Prairie Farm Rehabilitation Administration, Regina, Saskatchewan; David Sauchyn, Julie Frischke, University of Regina, Prairie Adaptation Research Collaborative, Regina, Saskatchewan; Elaine Barrow, Canadian Institute for Climate Studies, Regina, Saskatchewan. This research was funded in part by the Prairie Adaptation Research Collaborative. References Agriculture and Agri-Food Canada. 1995. Soil Landscapes of Canada, Version 2.1, National Soil Database, Agriculture and Agri-Food Canada, Research Branch, Ottawa, Ontario. Agronomic Interpretations Working Group. 1995. Land Suitability Rating System for Agricultural Crops: 1. Spring-seeded small grains. Edited by W.W. Pettapiece. Tech. Bull. 1995-6E. Centre for Land and Biological Resources Research, Agriculture and Agri-Food Canada, Ottawa, 90 pp. Bootsma, A. 2000. Procedure for Calculating: crop heat units, growing degree-days, effective growing degree-days, precipitation deficit/surplus, aridity index from monthly climate normals data. Eastern Cereal and Oilseed Research Centre, Agriculture and Agri-Food Canada, Ottawa. Bootsma, A., Gameda, S. and McKenney, D.W. 2001. Adaptation of Agricultural Production to Climate Change in Atlantic Canada. Eastern Cereal and Oilseed Research Centre, Agriculture and Agri-Food Canada, Ottawa, ON, Canadian Forest Service, Great Lakes Forestry Centre, Sault Ste. Marie, ON Canadian Institute for Climate Studies. 2000. Canadian Climate Impacts Scenarios (CCIS) Project web site. Available: http://www.cics.uvic.ca/scenarios/ [1996-2000].

27
Dumanski, J. and Kirkwood, V. 1988. Crop Production Risks in the Canadian Prairie Region in relation to Climate and Land Resources. Research Branch, Agriculture and Agri-Food Canada, Technical Bulletin 1988-5E. 144 pp. Fischer, G.; Shah, M.; Velthuizen, H. and Nachtergaele, F. O. 2001. Global Agro-ecological Assessment for Agriculture in the 21st Century. International Institute for Applied Systems Analysis, Laxenburg, Austria. 33pp. Frischke, J. and Sauchyn, D. 2000. Climate Change Parameters and Scenarios as they Relate to Prairie Agriculture. Department of Geography, University of Regina. Hengeveld, H.G. 2000. Climate Change Digest: Projections for Canada’s Climate Future. CCD 00-01 Special Edition. Environment Canada. Hiley, J.C. 1999. Farmers work with nature’s bounty. In Gaye, W., ed., Canadian agriculture at a glance. Statistics Canada, Ottawa, ON, Canada. No. 96-325-XPB. Pp. 191-195. Huffman, E.C.; Kirkwood, V.; Hiley, J.C.; Toogood, K.E. 1993. Assessment of cropping systems in Manitoba using agroecological resource regions. Research Branch, Agriculture Canada, Ottawa, ON, Canada. Technical Bulletin 1993-4E. 53 pp. Lelyk, G. W. and Pettapiece, W. W. 1995. Land Suitability Rating System. LSRS_BAT Users Manual, Special Report Series 96-4. AAFC, Manitoba Land Resource Unit, Brandon, MB, Alberta Land Resource Unit, Lethbridge, AB. Prairie Farm Rehabilitation Administration, Agriculture and Agri-Food Canada. 2000 Prairie Agricultural Landscapes: A Land Resource Review. Minister of Public Works and Government Services 2000, Regina, Saskatchewan. 179 pp. Schindler, D. W. 2000. The Cumulative effects of climate warming and other human stresses on Canadian freshwaters in the new millenium. Department of Biological Sciences, University of Alberta, Edmonton, AB, Canada. 29pp.