assessment of biogas production from mbt waste under...
TRANSCRIPT

General rights Copyright and moral rights for the publications made accessible in the public portal are retained by the authors and/or other copyright owners and it is a condition of accessing publications that users recognise and abide by the legal requirements associated with these rights.
• Users may download and print one copy of any publication from the public portal for the purpose of private study or research. • You may not further distribute the material or use it for any profit-making activity or commercial gain • You may freely distribute the URL identifying the publication in the public portal
If you believe that this document breaches copyright please contact us providing details, and we will remove access to the work immediately and investigate your claim.
Downloaded from orbit.dtu.dk on: May 09, 2018
Assessment of biogas production from MBT waste under different operatingconditions
Pantini, Sara; Verginelli, Jason; Lombardi, Francesco; Scheutz, Charlotte; Kjeldsen, Peter
Published in:Waste Management
Link to article, DOI:10.1016/j.wasman.2015.06.019
Publication date:2015
Document VersionPeer reviewed version
Link back to DTU Orbit
Citation (APA):Pantini, S., Verginelli, J., Lombardi, F., Scheutz, C., & Kjeldsen, P. (2015). Assessment of biogas productionfrom MBT waste under different operating conditions. Waste Management, 43, 37-49. DOI:10.1016/j.wasman.2015.06.019
Assessment of biogas production from MBT waste under different operating 1
conditions 2
Sara Pantini 1*, Iason Verginelli 1, Francesco Lombardi 1, Charlotte Scheutz 2, Peter Kjeldsen 2 3
4
1 Department of Civil Engineering and Computer Science Engineering, University of Rome “Tor Vergata” 5
Via del Politecnico, 1, 00133 Rome (Italy) 6
Tel.: +39 06 72597497; fax: +39 06 72597021 7
*E‐mail address: [email protected] 8
2 Department of Environmental Engineering, Technical University of Denmark 9
Miljoevej, Building 113, DK‐2800 Kgs. Lyngby (Denmark) 10
11
Abstract 12
In this work, the influence of different operating conditions on the biogas production from mechanically‐13
biologically treated (MBT) wastes is investigated. Specifically, different lab‐scale anaerobic tests varying the 14
water content (26‐43 %w/w up to 75 %w/w), the temperature (from 20‐25 °C up to 55 °C) and the amount 15
of inoculum have been performed on waste samples collected from a full‐scale Italian MBT plant. For each 16
test, the gas generation yield and, where applicable, the first‐order gas generation rates were determined. 17
Nearly all tests were characterised by a quite long lag‐phase. This result was mainly ascribed to the 18
inhibition effects resulting from the high concentrations of volatile fatty acids (VFAs) and ammonia 19
detected in the different stages of the experiments. Furthermore, water content was found as one of the 20
key limiting factor of the anaerobic biological process. Indeed, the experimental results showed that when 21

the moisture was lower than 32 %w/w, the methanogenic microbial activity was completely inhibited. For 22
the higher water content tested (75 %w/w), high values of accumulated gas volume (up to 150 Nl/kgTS) and 23
a relatively short time period to deplete the MBT waste gas generation capacity were observed. At these 24
test conditions, the effects of temperature became evident, leading to gas generation rates of 0.007 d‐1 at 25
room temperature that increased to 0.03‐0.05 d‐1 at 37 °C and to 0.04‐0.11 d‐1 at 55 °C. Overall, the 26
obtained results highlighted that the operative conditions can drastically affect the gas production from 27
MBT wastes. This suggests that particular caution should be paid when using the results of lab‐scale tests 28
for the evaluation of long‐term behaviour expected in the field where the boundary conditions change 29
continuously and vary significantly depending on the climate, the landfill operative management strategies 30
in place (e.g. leachate recirculation, waste disposal methods), the hydraulic characteristics of disposed 31
waste, the presence and type of temporary and final cover systems. 32
KEYWORDS 33
mechanically biologically treated waste; biochemical methane potential test (BMP); anaerobic tests; gas 34
generation model; first‐order kinetic constants 35
1 Introduction 36
Landfills still represent the dominant option for waste disposal in many parts of the world (Laner et al. 37
2012). However, as known, this option may pose a threat to groundwater pollution, soil contamination and 38
global warming effects due to the potential emission of leachate and landfill gas to the surrounding 39
environment (Pantini et al., 2014; Scaglia et al., 2010; Thomsen et al., 2012; White and Beaven, 2013). 40
Indeed, landfill has been recognized as one of the main source of anthropogenic methane emission and a 41
significant contributor to global warming (Bogner et al., 2008). Gas emissions from landfills are mainly 42
dominated by methane and carbon dioxide that are generated from the anaerobic conversion of organic 43
matter contained in waste as a result of biological processes naturally occurring in landfill sites. Moreover, 44
due to the generally high nitrogen content in wastes, there is also a considerable potential for nitrous oxide 45
emissions from municipal solid waste (MSW) landfills that can further enhance the global warming effects 46
(Harborth et al., 2013). 47
In view of these concerns, throughout the world, new regulations in waste management and treatment 48
strategies of municipal solid waste (MSW) have been introduced. For instance, in Europe, the Landfill 49
European Directive 1999/31/EC imposes member states only landfill wastes that have been preliminary 50
subjected to treatment or incineration. The directive aims at limiting the amount of biodegradable waste in 51
landfills while encouraging alternative strategies in order to move towards more sustainable waste 52
management system, according to the waste hierarchy approach (De Gioannis et al., 2009; Sormunen et al., 53
2008). To meet the European targets, member states have adopted different options, such as separate 54
collection and recycling of organic waste stream, MSW incineration with energy recovery, biological 55
treatments of source separated organic wastes or Mechanical Biological Treatment (MBT) plants of residual 56
MSW (Lornage et al., 2007; Pantini et al., 2015; Scaglia et al., 2010). Among these, the MBT technology is 57
playing a key role in the waste management system of unsorted MSW wastes (Adani et al., 2004; Farrell 58
and Jones, 2009; Pantini et al., 2015; Siddiqui et al., 2013;). All over Europe, MBT facilities can apply 59
different combinations of mechanical sorting, bio‐drying, and biological processes depending on the 60
specific target, that may be a pre‐treatment before incineration or a pre‐treatment to produce a bio‐61
stabilized product that has a lower impact when disposed of in landfills (Adani et al., 2004; Di Maria et al., 62
2013; Farrell and Jones, 2009; Montejo et al., 2013). In the latter case, the MBT plant consists of a 63
mechanical pre‐processing stage including crushing, sieving and recovering of recyclable materials (such as 64
metals, glass and plastics). This stage leads to two distinct flows: the oversize fraction, which is further 65
processed to produce refuse‐derived fuel, and the undersize fraction, rich in organic putrescible matter, 66
which is biologically treated using an anaerobic/aerobic process in order to stabilize it. The main distinction 67
between different MBT systems concerns the sequence of process steps and the type and duration of the 68
biological treatment (Pan and Voulvoulis, 2007; Pantini et al., 2015). The specific technology and process 69
applied may strongly affect the long‐term behaviour of MBT wastes in landfills in terms of both liquid 70
composition and gas generation (Boldrin et al., 2011; Siddiqui et al., 2013). However, gas emissions from 71
MBT waste have been rarely measured on full scale MBT landfills (Harborth et al., 2013). Hence, the current 72

state of knowledge on biogas emissions is based either on laboratory tests or on large scale experiments 73
such as lysimeters (Sormunen et al., 2008). Depending on the specific aim of the test, lab scale studies on 74
gas emissions from MBT wastes and solid organic wastes are usually carried out using different procedures 75
and operative conditions (see Table 1). As highlighted by Lornage et al. (2007), the differences in the 76
experimental procedure adopted may modify the biogas yield and kinetics, thus leading to results that are 77
not always comparable. The anaerobic process is indeed sensitive to several factors such as pH, water 78
content, temperature, particle size, as well as by the presence of inhibitors such as of volatile fatty acids 79
(VFAs), ammonia and heavy metals (Cabbai et al., 2013; Elbeshbishy et al., 2012; Labatut et al., 2011; 80
Lornage et al., 2007; Raposo et al., 2011). Among these, pH is recognised as the key parameter to be 81
maintained in an appropriate range (6.4‐7.5) in order to enhance the methane yield (Adani et al., 2004; 82
Argun et al., 2008; Lo et al., 2010). High pH values would result in increased toxicity due to the shift to 83
higher concentrations of ammonia, which is identified as one of the most toxic agent for methanogenic 84
bacteria (Chen et al., 2008; Vigneron et al., 2007). In contrast, low pH values are indicative of the 85
accumulation of VFAs within the system (Bouallagui et al., 2005; Li et al., 2011). VFAs represent the main 86
intermediate products during the initial acidogenic stage of the anaerobic process that are successively 87
converted into methane and carbon dioxide. However, VFAs concentrations at high level may result in an 88
inhibition of the methanogenic activity, as observed by several authors (Argun et al., 2008; Borzacconi et 89
al., 1997; Cabbai et al., 2013). Regarding the other operative conditions, an increase of temperature has a 90
positive effect on the microbial growth and activity (Chen et al., 2008) thus leading to a faster gas 91
generation process. Similarly, increasing the water content of incubated waste is beneficial for methane 92
yield since it enhances the solute transport of nutrient, the organic matter solubilisation and the 93
microorganism mobilization within micro‐environments, as well as dilutes the concentration of inhibitors 94
(Donovan et al., 2010; Mora‐Naranjo et al., 2004). Finally, the particle size of materials exerts a relevant 95
influence on the process kinetic; it is well accepted that particle size reduction results in higher methane 96
generation rate (Esposito et al., 2012; Lesteur et al., 2010, Mata‐Alvarez et al., 2000), whereas its effect on 97
biogas yield is still not completely elucidated (Mshandete et al., 2006; Nopharatana et al., 2007). 98
Table 1 99
The objective of this work was to evaluate the effects of temperature, water content and inoculum addition 100
on biogas generation from mechanically‐biologically treated waste by performing anaerobic batch tests at 101
different operating conditions. Furthermore, in order to determine the potential gas generation capacity 102
under optimal conditions, biomethane potential tests (BMP) were carried out. All these tests were then 103
compared in terms of cumulative biogas yield and rates. Besides, where applicable, a first‐order kinetic 104
model was used to compute the biogas rate constants from the cumulative gas generation curves observed 105
in each experiment. Finally, the obtained results were addressed to assess the possible implications 106
resulting from the different environmental conditions expected in the field. 107
2 Materials and Methods 108
2.1 MBT waste material 109
Mechanically‐biologically treated waste samples were collected at the belt discharge point of the secondary 110
refinement unit of a full‐scale MBT plant operating in Italy. This MBT plant receives residual municipal solid 111
waste (226,000 ton/y in 2013), with the average composition shown in Table 2. 112
Table 2 113
In this plant the incoming wastes are subjected to a mechanical pre‐processing consisting of pre‐sorting of 114
bulky materials, shredding and size separation. From these processes two flows are obtained: the light 115
fraction with particle size>80 mm (96,500 ton/y in 2013), which is further processed to produce refuse 116
derived fuel (55,500 ton/y in 2013), and the undersize fraction (126,000 ton/y in 2013), which is sent to the 117
biostabilization basins; the remaining flow is represented by recovered metals (3500 ton/y in 2013). In the 118
biostabilization basins, the aerobic process occurs for 28 days at forced ventilation condition, with daily 119
water addition and waste turning. Then, the stabilized output goes to a secondary sieving process to 120
remove improper materials. The undersize fraction (<20 mm) is the organic MBT waste analysed in this 121
study. The MBT waste sample was collected in May 2014 using standard procedures (UNI 10802:2013). A 122
final MBT waste sample of about 80 kg was sent to the laboratory and stored at 4 °C for few days until the 123
physico‐chemical analyses were performed. In the laboratory, three representative sub‐samples were 124
obtained by the “coning and quartering” method. One sub‐sample was analysed to determine the moisture 125
content (W), total (TS) and volatile solids (VS), pH, total (TC) and organic carbon (TOC) content, total 126
Kjeldahl (TKN) and soluble nitrogen (NH4‐N), the Chemical Oxygen Demand (COD) and the water content at 127
field capacity (FC) of waste (i.e. the water‐retaining capacity including both the hygroscopic and capillary 128
water). All measurements were performed at least in triplicate; initial waste water content, dry matter and 129
waste field capacity are expressed as percentage of wet weight whereas the other parameters are 130
computed on dry weight basis. Average values and standard deviations are reported in Table 2. A sub‐131
sample (3‐4 kg) was used for BMP tests. Before to perform the BMP analysis, the sub‐sample was dried at 132
room temperature (25 °C) to avoid losses of volatile organic compounds and then shredded to 1 mm 133
particle size. The last sub‐sample was used in the incubation tests as received since, currently, the MBT 134
waste is not subjected to further treatment before landfilling it. 135
2.2 Analytical Methods 136
In order to characterize the MBT waste with regards to its physical and chemical properties, different 137
analytical methods were applied. These tests provide basic information that are essential for the 138
interpretation of the biological test results. 139
Moisture content (W), total (TS) and volatile solids (VS), total carbon (TC) and organic carbon (TOC) 140
content, pH 141
Moisture (W) and total solid (TS) content were determined according to the standard method UNI EN 142
14346 (2006). Volatile solids (VS) were measured by loss‐on‐ignition (LOI) at 550 °C for 8 h (UNI/TS 11184, 143
2006). Total carbon (TC) and organic carbon content (TOC) were analysed by Shimadzu SSM‐5000A 144
instrument according to UNI EN 13137( 2001). The own pH of MBT waste was determined after elution 145
following the standard method UNI EN 12457‐2 (2004). 146
Total (TKN) and soluble nitrogen (NH4-N) 147
Total Kjeldahl Nitrogen (TKN) was measured on solid waste samples (2.5‐3 g) by mineralization with a 148
strong acid medium (97% sulphuric acid) followed by steam distillation and titrimetric determination, as 149
proposed by Mohajer et al. (2010) and Tremier et al. (2005). Blank and control tests were performed 150
simultaneously, in triplicate. In blank tests, 4 ml of deionized water were used whereas in control tests, to 151
evaluate the efficiency of ammonia recovery, 4 ml of L‐glutamic acid (1000 mg/l) were utilized. Samples 152
were digested in FOSS 2020 Digestor at 180 °C for 1 h and thereafter at 350 °C for 1‐2 hours (warm‐up time 153
excluded). After cooling, samples were distilled using FOSS Kjeltec 8100 distillation unit. In the distillation 154
method, 30 ml of deionized water and 70 ml of the alkaline solution (32 %w/w NaOH) were added to each 155
tube. The steam supply was set to 60% and the distillation time was 5 minutes. A solution consisting of 50 156
ml deionized water, 4 ml boric acid (40 g/l) and 3 drops of Kjeldhal indicator (mixture of methyl red 157
indicator and Bromocresol green indicator, MERCK KGaA) was used as absorbent solution during 158
distillation. The ammonia content was determined by tritation of distillate with 0.1 M H2SO4. 159
Determination analyses of soluble nitrogen (NH4‐N) were carried out on 2.5‐3 g using the same procedure 160
of TKN. For the distillation method, 30 ml of deionized water and 50 ml of the alkaline solution (32 %w/w 161
NaOH) were added to each tube. Steam supply and distillation time were the same as mentioned above, as 162
well as the titration method. The ammonia recovery of the instrument was evaluated by adding 4 ml of a 163
known solution (1000 mg/l NH4‐N) to 50 ml of deionized water. An efficiency up to 100% was detected. 164
Chemical Oxygen Demand (COD) 165
To determine the COD of wet solid samples, the modified method proposed by Raposo et al. (2008) was 166
adopted. This method consists of a wet oxidation with potassium dichromate as the oxidant and silver 167
sulphate as the catalyst in a strong sulphuric acid solution (Raposo et al., 2008). COD measurements were 168
carried out on 1.0 g of MBT waste sample, adding 6 ml of 97% sulphuric acid and 30 ml of deionized water 169
to the flask while stirring it for 30 minutes. Then, 2.0 ml of Potassium Dichromate 0.025 M (for high range 170
detection) and 4.5 ml of silver sulphate sulphuric acid solution were added to each flask containing 3.5 ml 171
of initial solution. The reaction mixtures were boiled in a Holm & Halby Techne Dri Block at 148 ± 2 °C for 172
110 minutes. After cooling, 5.0 ml of deionized water and 3 drops of ferroin indicator were added and 173
samples were titrated with 0.035 M Ferrous Ammonium Sulphate solution. COD measurements were 174

performed in triplicate. Five blanks (3.5 ml of deionized water) and three control tests (3.5 ml of 500 mg 175
COD/l standard solution) were carried out simultaneously. 176
Volatile Fatty Acids (VFAs) 177
VFAs were measured in fresh solid waste as well as in waste samples at different incubation time. Samples 178
were prepared weighing about 5 g of MBT waste, adding 12.5 ml of deionized water and acidifying them 179
with 0.4 ml of 97% sulphuric acid to ensure pH<2. A magnet was inserted and samples stirred for 180
approximatively 10‐15 minutes to homogenize them. Then, 1.5 ml of each sample was placed in an 181
Eppendorf tube and centrifuged at Eppendorf mini spin table centrifuge at 13,400 rpm for 10 min. After 182
centrifugation, 1.0 ml sample was transferred to a GC glass vial and 0.1 ml of internal standard (2.2 mM 4‐183
Methyl valeric acid) was added. Concentrations of acetate, propionate, iso‐butyrate, butyrate, iso‐valerate, 184
valerate, hexanoic acids were determined by using GC Shimadzu GC – 2010 equipped with and FID (flame‐185
ionization‐detector). VFA compounds were separated by a capillary column (ZB – FFAP, 30 m, 0,53 mm I.D x 186
1,0 µm) and concentrations were computed by means of a linear calibration curve obtained after standards 187
injection (range: 5‐1500 mg/l). All measurements were performed in triplicate. 188
MBT waste field capacity (FC) 189
Water content of MBT waste at field capacity was determined by performing column test. A Plexiglas 190
column with an inner diameter of 3.5 cm and a total height of 15 cm was packed with about 70 g of as 191
received MBT waste (water content at 19.4% w/w), corresponding to initial wet density of 0.5 g/cm3 (dry 192
bulk density of 0.4 g/cm3). The packed column was weighted (Min) and then saturated from the bottom 193
section until a water head of few millimeters formed at the top and the pump was stopped. After 194
saturation, the column was let drain until no significant outgoing flow was detected and weighted again 195
(Mend). The difference in weight (Mend ‐ Min) is the adsorbed water (Mw,ads). The ratio between the total 196
water in the column at the end of the experiment (i.e. sum of adsorbed water and initial moisture water, 197
W) and the final mass of MBT material in the column (Min,MBT + Mw,ads), shown in Eq. (1), represents a rough 198
estimation of the field capacity of MBT waste (expressed as percentage of wet weight): 199
, ,
, ,
%% / *100w ads in MBT
in MBT w ads
M W MFC w w
M M
(1) 200
2.3 Gas production tests 201
Biochemical Methane Potential test (BMP) 202
Different BMP assays, experimental set‐ups and employed protocols can be found in literature due to a lack 203
of harmonization and standardization of biochemical methane potential methods. Indeed, some methods 204
are designed to evaluate the biodegradability of chemical substances under methanogenic conditions (ISO 205
14853, 1999; ASTM E2170‐01, 2008 (withdrawn 2013); ASTM D5210‐92, 2007; DIN 38414‐8, 1985) while 206
others aim at quantifying the ultimate biodegradability and gas generation of complex organic substrates 207
(ISO 11734, 1995; ISO/DIS 14853, 1999) using different experimental set‐ups. Additionally, these methods 208
were applied differently or modified by researchers (Angelidaki et al., 2009), making the inter‐comparison 209
of BMP test results quite difficult. In this study, the BMP protocol proposed by Hansen et al. (2004) was 210
adopted. Glass bottles (1 l) with a thick rubber septum were used as reactors. Approximatively 1 g of air 211
dried waste sample (particle size < 1 mm), 80 ml of deionized water and 320 ml of a fresh de‐gased 212
inoculum were used in the experiments in order to achieve an organic load of 1.4 gVS/l (weight of VS in 213
substrate per unit volume of inoculum). Tests were carried out for 30 days with six replicates, due to the 214
relatively high heterogeneity of the MBT material. Thermophilically digested material from a full‐scale 215
biogas plant was used as inoculum. Three blanks with only water and inoculum were run to test the biogas 216
production from the inoculum itself. Control tests, containing 0.8 g of AVICEL (Fluka, Sigma Aldrich, 217
Vallensbæk Strand, Denmark) as a standard substrate, were performed to check the quality of the 218
inoculum. After set‐up, the reactors were flushed with N2 for 10 minutes, to ensure the establishment of 219
anaerobic conditions in the headspace of the glass bottles, then sealed and placed in the incubator at 55 °C 220
(± 1 °C). The methane concentration in the reactors was measured every two days during the first two 221
weeks, and later once per week. Gas samples (0.2 – 0.5 ml) were taken from the headspace of the reactors 222
by using a syringe with a pressure lock and directly injected into the gas chromatograph for methane 223
determination (Shimadzu GC 14A) and for qualitative analysis of gas composition in terms of %CH4 and 224
%CO2 (Mikrolab GC Aarhus ). In order to avoid build‐up of high pressure inside the reactors, the gas was 225
released during the experiment. Based on the difference of CH4 concentration before and after release of 226
excess gas, the generated amount of CH4 was computed. 227
Anaerobic gas generation tests 228
In order to evaluate the effects of temperature and water content on the gas generation rate and yield, 229
anaerobic batch tests were performed at three different temperatures: room temperature (20‐25 °C), 37 °C 230
and 55 °C. In tests at room temperature and 37 °C, a mesophilic inoculum derived from a biogas plant 231
carrying out mesophilic co‐digestion of manure and organic waste was utilized whereas in tests at 55 °C the 232
same inoculum of BMP tests (thermophilically digested material) was used. 233
Before starting the anaerobic tests, different amounts of water were added to four MBT sub‐samples (as 234
received material with 19.4% water content) in order to achieve four values of the initial water content in 235
waste: 26%, 32%, 38%, 43% (expressed on wet weight basis). After homogenizing the samples, an aliquot of 236
each sub‐sample at the specific water content was weighted and introduced into reactor and then 237
incubated at the corresponding temperature. The values set for temperature and water content aimed at 238
covering the actual ranges generally observed at real scale landfill sites (Mor et al., 2006; Mora‐Naranjo et 239
al., 2004). Note that the operating conditions of anaerobic tests were selected in order to simulate 240
different disposal scenarios and, hence, they differ from the optimal ranges usually set in biogas plant 241
treating MSW waste organic fractions. Namely, in these plants, the anaerobic digestion of incoming 242
feedstock, usually mixed with a large amount of digester effluent or sewage sludge, may be carried out in 243
dry systems (60‐80% water content) or in wet systems (water content >90%) at thermophilic or mesophilic 244
conditions in continuous or static digesters (Braber 1995; Gunaseelan 1997; Schievano et al., 2010). 245
Incubation tests at 37 °C and 55 °C consisted of 1 l glass bottle filled with waste sample (0.5‐0.7 kg), sealed 246
with a rubber septum and equipped with a PVC pipe, which connected it to a 3 l SKC Tedlar Sampling Bag 247
(SKC Inc., Eighty Four, PA, US) for gas collection. At each measurement, 5 ml of gas were sampled with a 248
syringe and injected into evacuated glass vials fitted with pierceable rubber septa (Exetainer Vail, Labco Ltd, 249
Lampeter, UK), which were then analysed for determining gas composition. A 490‐PRO Micro GC (Agilent 250

Technologies Denmark Aps, Glostrup, Denmark) equipped with two columns (PoraPLOT Q PLOT, 0.25mm, 251
10m, and Molecular Sieve 5A PLOT, 0.25 mm, 20m) was used to measure CH4, CO2 and O2 in gas samples 252
with a detection limit of 0.1% for all gases. In the incubation tests at room temperature, 12 l steel drums 253
with airtight lids were used as reactors. Drums were filled with MBT waste samples at three different 254
water contents (26%, 34%, 43%) and flushed with nitrogen for 30 minutes before sealing them. Lids were 255
equipped with T‐shaped sampling ports and connected to 5 l SKC Tedlar Sampling Bags. More information 256
about tests conditions and experimental activities are reported in Table 3. 257
As shown in this table, the anaerobic gas generation tests were carried out in three sequential stages. In 258
the first stage, no inoculum was used. During the second stage of experimental activity, a low amount of 259
mesophilic or thermophilic inoculum (20 g of inoculum, i.e. approximately 5 %w/w of the waste dry matter 260
used in the test) was introduced into the incubation bottles with lower water contents (T1, T2, T5, T6) to 261
enhance the microbial activity. In the following stage III, due to the unexpected very low biogas production, 262
some reactors were opened (R2, T2A, T3A/B, T4B, T6A, T7A/B) in order to partially remove the material, 263
which was then analysed with regard to pH, VFA, TKN and ammonia content. In this stage, inoculum (30 264
%w/w of waste dry matter in reactor) and water (230 %w/w of waste dry matter, to obtain a final moisture 265
content of 75 %w/w) were introduced within these reactors that were successively purged with nitrogen 266
and incubated again. A triplicate measurement of the biogas production from the added inoculum was 267
performed on blank experiments and deduced from the biogas yield of waste samples. 268
Table 3 269
The gas volume produced by each reactor was computed timing the emptying of gas bags using a Fluid 270
Metering Inc. laboratory pump (QG, Fluid Metering Inc., Syosset, NY, US). The flow rate of the pump was 271
tested several times during the experiment and an average flow of 0.5 l/min was measured. 272
2.4 First-order gas generation model 273
To compute the biogas kinetic constants under different operating conditions, the widely adopted first‐274
order kinetic model (Gunaseelan 1997; De Gioannis et al., 2009; Lo et al., 2010; Mou et al., 2015) was used 275
for the interpolation of experimental data. The generic formulation, which accounts for the lag‐time 276
observed in the test, is the following: 277
lagttkLtL exp10 (2) 278
where L is the biogas accumulation (Nl/kgTS) at the time t (d), L0 the potential biogas production (Nl/kgTS) 279
for the tested conditions (at optimal conditions, L0 approaches the potential gas generation capacity 280
measured in the BMP experiments), t the time over the digestion period, tlag the lag‐phase (d) and k the 281
first‐order kinetic constant (d‐1). 282
3 Results and discussions 283
3.1 MBT waste characterization 284
Results of the characterization analysis performed on the MBT waste are reported in Table 4. Moisture 285
content (W), as well as water field capacity, were slightly lower than the values usually measured for this 286
type of waste (Di Lonardo et al., 2014; Pantini et al., 2015; Zach et al., 2000). Despite the waste underwent 287
an aerobic treatment process in the MBT plant, the organic matter of waste is still quite high, as confirmed 288
by VS, TOC and COD contents. As shown in Table 4, the pH was almost neutral and in the optimal range for 289
the anaerobic process. It is also interesting to point out that values of TKN and NH4‐N were quite high, close 290
to the range usually observed for untreated waste or poorly treated waste (Modin 2007; Pognani et al., 291
2010). 292
Table 4 293
3.2 Biochemical Methane Potentials 294
Figure 1 shows the cumulative CH4 generation curve measured in control (red dots) and in MBT waste tests 295
(green dots) as a function of the incubation time. The results reported in this figure, expressed as 296
cumulative volume of methane per gTS at standard temperature and pressure (STP) conditions (0 °C, 1 297
atm), represent the average values measured in the different replicates obtained after subtracting the CH4 298
measured in the blank experiments. The solid red line and the dotted green line depict the theoretical 299
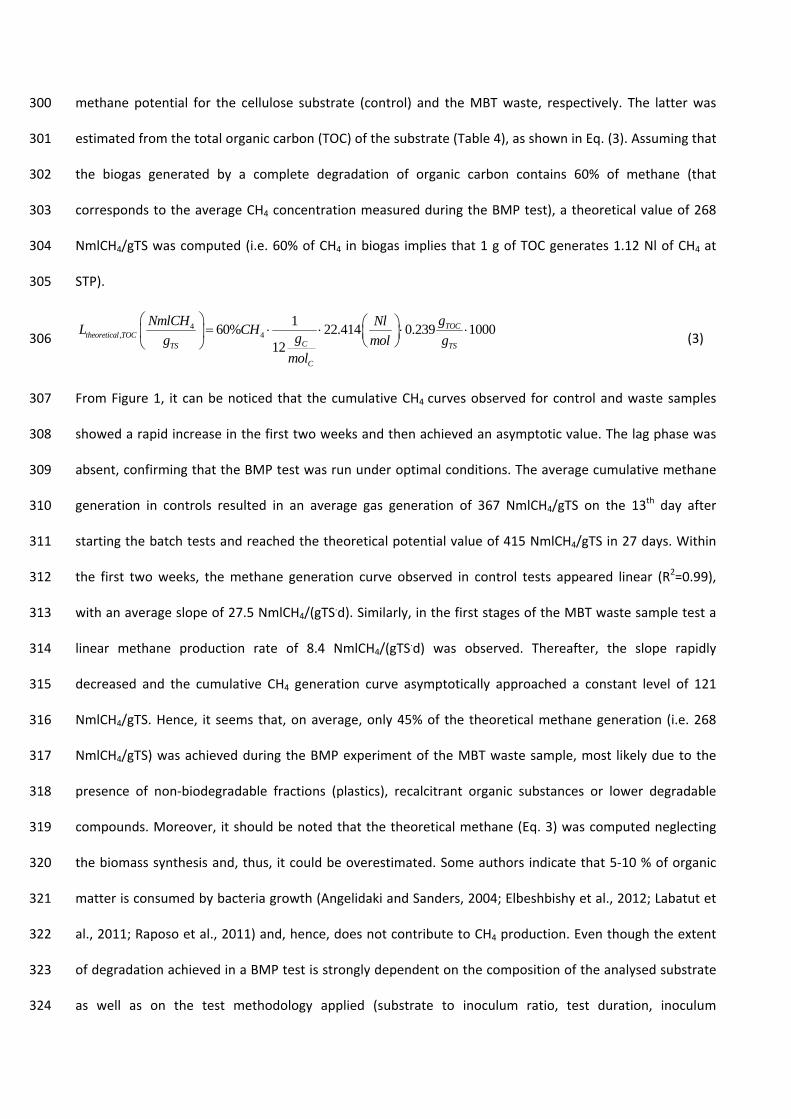
methane potential for the cellulose substrate (control) and the MBT waste, respectively. The latter was 300
estimated from the total organic carbon (TOC) of the substrate (Table 4), as shown in Eq. (3). Assuming that 301
the biogas generated by a complete degradation of organic carbon contains 60% of methane (that 302
corresponds to the average CH4 concentration measured during the BMP test), a theoretical value of 268 303
NmlCH4/gTS was computed (i.e. 60% of CH4 in biogas implies that 1 g of TOC generates 1.12 Nl of CH4 at 304
STP). 305
4, 4
160% 22.414 0.239 1000
12
TOCtheoretical TOC
CTS TS
C
gNmlCH NlL CH
gg mol gmol
(3) 306
From Figure 1, it can be noticed that the cumulative CH4 curves observed for control and waste samples 307
showed a rapid increase in the first two weeks and then achieved an asymptotic value. The lag phase was 308
absent, confirming that the BMP test was run under optimal conditions. The average cumulative methane 309
generation in controls resulted in an average gas generation of 367 NmlCH4/gTS on the 13th day after 310
starting the batch tests and reached the theoretical potential value of 415 NmlCH4/gTS in 27 days. Within 311
the first two weeks, the methane generation curve observed in control tests appeared linear (R2=0.99), 312
with an average slope of 27.5 NmlCH4/(gTS.d). Similarly, in the first stages of the MBT waste sample test a 313
linear methane production rate of 8.4 NmlCH4/(gTS.d) was observed. Thereafter, the slope rapidly 314
decreased and the cumulative CH4 generation curve asymptotically approached a constant level of 121 315
NmlCH4/gTS. Hence, it seems that, on average, only 45% of the theoretical methane generation (i.e. 268 316
NmlCH4/gTS) was achieved during the BMP experiment of the MBT waste sample, most likely due to the 317
presence of non‐biodegradable fractions (plastics), recalcitrant organic substances or lower degradable 318
compounds. Moreover, it should be noted that the theoretical methane (Eq. 3) was computed neglecting 319
the biomass synthesis and, thus, it could be overestimated. Some authors indicate that 5‐10 % of organic 320
matter is consumed by bacteria growth (Angelidaki and Sanders, 2004; Elbeshbishy et al., 2012; Labatut et 321
al., 2011; Raposo et al., 2011) and, hence, does not contribute to CH4 production. Even though the extent 322
of degradation achieved in a BMP test is strongly dependent on the composition of the analysed substrate 323
as well as on the test methodology applied (substrate to inoculum ratio, test duration, inoculum 324

characteristics), the 45% degradability estimated for the analysed MBT waste based on TOC content is 325
consistent with other previous studies on similar MBT materials. For instance, using experimental results 326
(TOC, BMP, % CH4 in biogas) presented by Bayard et al. (2010) for different MBT wastes, the degradability 327
of MBT waste was estimated within the range 10% ‐ 36% in 90‐days BMP tests. An organic carbon 328
degradability of 42.4% was computed from results reported in Barrena et al. (2008) for aerobically treated 329
MBT waste. 330
Making reference to Figure 1, some variation of accumulated CH4 volume was observed between the 331
replicate of MBT waste tests (coefficient of variation in the range of 12.4‐23.3 %), probably due to its 332
relatively high heterogeneity and to the low amount of material tested in the BMP experiment. On the 333
contrary, both substrate (control) and inoculum (blank) showed a good internal homogeneity with 334
coefficients of variation in the range of 0.5‐7.0% and 1.9‐4.9%, respectively. 335
From the qualitative analyses of gas composition, an average value of 60.8 ± 1.1 % and 62.4 ± 1.4 % of 336
methane concentration in biogas was detected for sample and control, respectively. Assuming this 337
percentage, a potential CO2 yield of 78 ± 25 NmlCO2/gTS for MBT waste was computed. Hence, a maximum 338
potential gas production of 199.2±63 Nml/gTS was estimated for the analysed MBT waste. This result is 339
consistent with some previous BMP studies performed on aerobically treated MBT wastes. For instance, 340
Barrena et al. (2008) measured a total gas production of 187±16 Nl/kgTS, with an average methane content 341
of 57 %v/v, from MBT wastes after 32 days of aerobic treatment. Bayard et al. (2010) analysed the gas 342
generation potential of different flows in a French MBT plant; they observed that the intermediate fraction 343
(< 50 mm), after 6 weeks forced‐aerobic treatment, still exhibited high gas generation potential (232±23 344
Nl/kgTS). Lornage et al. (2007) measured a gas potential of about 160 Nl/kgTS from MBT wastes subjected 345
to 4‐weeks aerobic treatment process. 346
Fig. 1 347
3.3 Anaerobic gas generation tests 348
Figs. 2‐4 show the cumulative generation curve of methane (red circles) and carbon dioxide (black squares 349
dots) obtained for the MBT waste samples at room temperature (Fig. 2), 37 °C (Fig. 3) and 55 °C (Fig. 4), and 350
for different initial water contents of waste, as a function of the incubation time. Results are expressed as 351
cumulative volume of gas per kg of total solids (TS) at STP. For comparison purposes only, the potential CH4 352
and CO2 values computed in BMP test have also been reported in Figs. 2‐4 as dotted lines. From Figs. 2‐4 it 353
can be noticed that in the first stage of experimental activities that were carried out at low water contents 354
and without inoculum addition, a long lag‐phase was detected for all operating conditions. During this 355
stage, the microbial population needed to get adapted to the micro‐environment and to be acclimatized to 356
the organic substrate in order to be able to grow until a sufficient active population established and the 357
anaerobic degradation could stably evolve. Results shown in Figs. 2‐4 suggested that the duration of the 358
lag‐phase was strongly affected by both the water content of waste and the process temperature. 359
Regarding the former parameter, it widely documented that water enhances nutrients and substrates 360
solubilisation in the liquid phase as well as supports bacteria movement and facilitates substrate and 361
products diffusion through the porous medium (Donovan et al., 2010; Khalid et al., 2011; Liotta et al., 362
2014). However, the water content of waste in a landfill disposal scenario could be quite far from the 363
optimum value for degradation (60% ‐90%) and, thus, may become limiting for the anaerobic process due 364
to the accumulation of inhibitors with adverse effects on bacteria population (Donovan et al., 2010). 365
Indeed, experimental results confirmed that the water content of waste could be considered as one of the 366
most important factors limiting methane generation and, the probability of achieving a stable 367
methanogenic stage is significantly reduced for water contents below 32 %w/w (wet weight) at any 368
temperature for this type of waste. 369
Fig. 2 370
371
Fig. 3 372
373
Fig. 4 374
375
Increasing the operative temperature would enhance both the substrate solubilisation and the microbial 376
activity (Raposo et al., 2011). It is likely that higher temperature allowed moving from non‐equilibrium state 377
towards more suitable conditions for methanogenic bacteria growth, thus favouring a more rapid 378
establishment of the methanogenic phase (Lesteur et al., 2010; Li et al., 2011; Mata‐Alvarez et al., 2000). 379
Indeed, as shown in Fig. 2 in all the experiments at room temperature methane was not detected within 380
the first three months but only CO2 was generated at high levels (80 %v/v, see Fig. S1 in the Supplementary 381
information). A similar behaviour was observed by Adani et al. (2004) during 90 days incubation tests 382
carried out on fresh and partially treated wastes (10 days of aerobic treatment). The high CO2 383
concentration without CH4 generation suggested that the biological process was completely inhibited at 384
every water content in tests at room temperature, probably due to acidification effects, and revealed the 385
poor stability degree of the analysed MBT waste. Furthermore, even though the methanogenic activity was 386
observed in tests at higher temperature and water content, a clear instability associated with the anaerobic 387
process was still detected. 388
In fact, as reported in Fig. 3, reactors at 37 °C and water content of 38% (T3) ‐ 43% (T4) started producing 389
methane after 27 days, even though CH4 concentrations were low (below 20%). A similar trend was 390
observed for batch tests at 55 °C (Fig. 4) where methane generation started after 22 days and 13 days for 391
tests at moisture content of 38% (T7) and 43% (T8), respectively. However, in all these reactors (except T8) 392
just after few days, biogas generation slowed down. Only the experiment at higher water content and 393
temperature (T8) managed to reach the stable methanogenic phase during the experiment (without 394
inoculum addition), as confirmed by the CH4 concentration measured in biogas, which was in the range 45‐395
60 %v/v (see Fig. S3 in the Supplementary information). Even if a lag phase of 40 days was observed in 396
these tests, the cumulative gas generation approached an asymptotic value of 29.1±2.2 Nl CH4/kgTS and 397
32.6±2.1 Nl CO2/kgTS within 100 days (Fig. 4). These values are in line with previous studies on treated MBT 398
waste wetted to water holding capacity in which no inoculum was added (Adani et al., 2004; De Gioannis et 399
al., 2009). However, compared to the measured BMP value, in this test condition, a very low conversion 400
degree was achieved (30% of BMP value). 401
Overall, the results obtained during the initial experimental activity indicated that, in most of test 402
conditions, the anaerobic process was slowed down either due to high levels of inhibiting factors or to a 403
limited amount of active biomass inside the reactors. Hence, during stage II, a small amount of inoculum 404
(20 g) was introduced into reactors at lower water contents (T1, T2, T5, T6) and the evolvement of 405
degradation was monitored for 20 days. After the inoculum addition, methane started to be produced in all 406
reactors but its concentration still remained very low (below 10 %v/v) and then decreased again (see Tests 407
T2B and T6B of Fig. S2 in the Supplementary information). Thus, it seems that the microorganism 408
population inside the MBT waste was not sufficient to sustain the anaerobic degradation process. For that 409
reason, during stage III, in reactor T4B (W=43%, T=37 °C) a greater amount of inoculum was introduced (70 410
g) and, in two weeks, methane concentration achieved the range typical of a stable methanogenic phase 411
(50‐70 %v/v, see Fig. S2 in the Supplementary information). 412
Results shown in Figs. 3‐4 also highlight the different behaviour of tests with water content at field capacity 413
(w=43% at 37 °C and 55 °C, see T4 vs. T8). In fact, even if the water content was the same in these reactors, 414
only tests at 55 °C (see T8 in Fig. 4) managed to achieve the stable methanogenic phase without the 415
inoculum addition. Instead, at 37 °C, a very low methane volume was measured in test where no inoculum 416
was used (see T4A in Fig. 3), whereas methane was stably produced only after the addition of a significant 417
amount (70 ml) of mesophilic inoculum (T4B). This may be ascribed, on the one hand, to a lower active 418
mass of mesophilic bacteria in the MBT waste compared to the thermophilic ones, presumably due to the 419
type of biological process performed in the MBT facility. Indeed, temperatures up to 70 °C were achieved in 420
the biostabilization basin of the MBT plant during the aerobic treatment. This sanitation process may have 421
significantly reduced the microorganism population inside the waste mass, especially the mesophilic 422
bacteria, which are more sensitive to high temperatures than the thermophilic ones. On the other hand, 423
the lower gas generation measured in test T4A compared to T8 may be explained considering that the 424
methanogenic mesophilic bacteria could be more vulnerable to unfavourable environmental conditions 425
(higher toxic effects exerted by VFA and ammonia) and have lower growth rates (van Lier et al., 1997; 426
Amani et al., 2011) compared to the thermophilic bacteria, that implies the adapting period could last 427
longer. In conclusion, results obtained during stage I and II suggested that the capability of the MBT waste 428
to generate methane is drastically limited due to inhibition effects, which are emphasized at lower water 429
contents, also because the initial bacteria population inside the waste mass could not contain a sufficient 430
level of methanogens to sustain the anaerobic process under the specific test conditions (high organic 431

load). For a better understanding of these results, during stage III of the experimental activity, reactors 432
were opened and waste was partially removed in order to measure pH, VFA and NH4‐N. Then, inoculum 433
(30% of final TS) and water (up to a final moisture content of 75 %w/w) were added in reactors R2, T2A, T3, 434
T6A, T7 and incubated again. The beneficial effects of water and inoculum supply were evident, resulting in 435
an immediate growth of the biogas yield, with increasing gas generation rates at higher temperature. On 436
the one hand, the supplemental water addition may have reduced the inhibitory effect by diluting potential 437
toxic substances such as heavy metals (copper, chromium or zinc), ammonia and VFAs. (Chen et al., 2008; 438
Yenigun and Demirel, 2013; Poggi‐Varaldo et al., 1997). On the other hand, a proper balance between 439
acidogens and methanogens could have been achieved by lowering the organic load (through waste 440
removal) and increasing the active bacteria mass within the anaerobic reactors (through inoculum 441
addition). Indeed, tests at 55 °C achieved the asymptotical value of 66.7 ± 6.3 Nl CH4/kgTS and 50.0 ± 2.3 Nl 442
CO2/kgTS within 30‐40 days after the inoculum and water addition. In tests performed at 37 °C, a 443
cumulative volume of 73.1 ± 2.1 Nl CH4/kgTS and 54.9 ±1.8 Nl CO2/kgTS was measured after 60‐70 days 444
from inoculum and water supply. These results showed that the biodegradability of the MBT waste in terms 445
of methane and carbon dioxide yields did not vary significantly between 37 °C and 55 °C when moisture 446
conditions were not limiting, as also observed by other authors (Hejnfelt and Angelidaki, 2009; Liu et al., 447
2009; Veeken and Hamelers 1999). In fact, in both cases, the total biogas yield at the end of these tests was 448
in the range of 55–60 % of the methane potential value (66.7 and 73.1 against 121 Nl CH4/kgTS). However, 449
from the results obtained at room temperature, it is evident that the temperature surely affects the gas 450
generation rate but also seems to influence the gas generation capacity. Indeed, in test with water and 451
inoculum addition (see R2 test in Fig. 2), the gas production achieved a value of 8.5 ± 1.0 Nl CH4/kgTS and 452
19.3 ±0.3 Nl CO2/kgTS after 70 days from inoculum addition but was still increasing, indicating that the 453
stable methanogenic phase has not been reached yet (see Fig. S1 in the Supplementary information). 454
3.4 Estimation of biogas kinetic constants 455
Fig. 5 shows, for the tests that achieved the stable methanogenic phase, the cumulative biogas production 456
simulated with the first‐order kinetic model (lines) fitted to the measured data (dots). The best‐fit 457
parameters used in the model are reported in Table 5. Making reference to Fig. 5, it can be noticed that, in 458
all cases, the first‐order kinetic model accurately reproduces the different shapes of accumulated gas 459
volume curves, as confirmed by the R2 values reported in Table 5. Modelling the experimental results 460
revealed that the biodegradability of the MBT waste, which is expressed as ratio of cumulative gas volume 461
to potential gas ( %L0/BMP), ranged between 56% to 75% in tests at 75 %w/w water content and decreased 462
to 34% in tests with water content at field capacity and without inoculum addition. This range is slightly 463
lower than the typical values for solid state incubation tests of MBT residues, presumably due to the poor 464
stability degree of the MBT waste analysed in this study. For example, Binner and Zach (1999) found that 465
the gas generated within 90 days was about 75% to 90% of the potential gas generation capacity (e.g. gas 466
volume measured after 240 days) for well treated wastes (duration of pre‐treatment >10weeks). 467
Fig. 5 468
As already discussed above, higher operative temperature leads to a faster gas generation since 469
temperature enhances both microbial growth and activity (Bouallagui et al., 2005; Gavala et al., 2003; Kim 470
et al., 2002). Specifically, k‐values vary from 0.007 d‐1 at room temperature, 0.03‐0.05 d‐1 at 37 °C and 0.04‐471
0.11 d‐1 at 55 °C. Moreover, a linear correlation of k‐values with the operative temperature was observed 472
for tests at 75 %w/w water content. 473
These k‐values were also used to estimate the time required to reach the 99% of the maximum biogas 474
generation L0, as follows: 475
99%
ln 1 0.99T
k
(4) 476
Due to quite high k‐values, a relatively short time period T99% (Table 5), ranging from few months up to 2 477
years, was computed. 478
Table 5 479
Table 6 reports a brief literature review of the kinetic constants and gas yields experimentally determined 480
for different types of organic substrates. As shown in Table 6, these parameters vary substantially between 481
different substrates, experimental procedures and tests conditions. Even if a direct comparison is not 482
possible, the k‐values obtained in this work are in line with most of these studies. For instance, the k‐value 483
of 0.007 d‐1 determined at T=20‐25 °C and water content of 75 %w/w, is consistent with the results 484
obtained by Vavilin et al. (2004) for MSW waste at 65% of water content and T=30 °C (k=0.007‐0.08 d‐1). 485
Similarly, the k‐values range (0.028‐0.054 d‐1) observed at 37 °C appears close to the one reported by Neves 486
et al. (2006), which refer to a co‐digestion of organic waste and sewage sludge (0.035‐0.063 d‐1). On the 487
contrary, significant differences can be observed referring to the results presented by De Gioannis et al. 488
(2009) and Mou et al. (2015). Indeed, the k‐values reported by those authors are up to one‐two orders of 489
magnitude lower than the ones obtained in this work. This difference can be due to the higher content of 490
readily degradable organic matter in the analysed MBT waste compared to the low‐organic wastes of Mou 491
et al. (2015) and De Gioannis et al. (2009). 492
Nevertheless, it should be kept in mind that the high water content (75 %w/w) as well as the inoculum 493
addition had accelerated the biodegradation process during the anaerobic experiments. Hence, the gas 494
generation rate and yield listed in Table 5 may be overestimated in comparison to real landfill conditions 495
where the emplaced MBT wastes will not be able to retain the high water content (75 %w/w) simulated in 496
lab scale tests. For example, Heyer et al. (2013) stated that the biological conversion process within 497
lysimeters filled with MBT waste could be accelerated by a factor 3‐10 compared to MBT landfills due to 498
water addition or leachate recirculation. 499
Table 6 500
3.5 Inhibition of anaerobic digestion process 501
Analysis carried out on the MBT waste samples removed from the reactors at the different stages of the 502
tests revealed that pH was still suitable for the anaerobic digestion (6.6‐7.0). Hence, in this specific case, pH 503
alone did not give a clear indication of process inhibition. However, it should be considered that pH 504
changes may be very small in highly buffered system even when the process is severely stressed (Ahring et 505
al., 1995). Thus, it is likely that pH was buffered due to contrasting effects of VFAs accumulation, which 506
could have led to acidic conditions, and proteins degradation that could have favoured an increase of waste 507
buffer capacity through the ammonia release (Veeken et al., 2000). In fact, as shown in Table 7, high VFAs 508
and ammonia concentrations were measured in all MBT samples. Specifically, Table 7 reports the average 509
values of total TKN and soluble nitrogen NH4‐N, the ratio between NH4‐N and TKN, and the total VFAs 510
concentration measured in the fresh MBT sample and in the MBT samples removed from the anaerobic 511
batch experiments carried out at room temperature (R2), at 37 °C (T2A and T3) and 55 °C (T6A and T7). As 512
shown in this table, the ratio of NH4‐N/TKN exhibited a twofold increase compared to what measured in 513
the fresh waste. Moreover, VFAs concentrations in all samples were more than one order of magnitude 514
higher than the ones measured in the fresh sample. These results indicate that the analysed MBT waste still 515
contains a certain amount of readily and medium‐degradable organic matter, which was not expected, 516
since the easily degradable fraction was supposed to be mineralised during the stabilization process in the 517
MBT plant. The high biological reactivity of this MBT waste may be in part due to a limited efficiency, during 518
the waste sampling campaign, of the aerobic decomposition process employed in this specific MBT plant. 519
However, as also highlighted in previous researches, this poor stabilisation can be mainly ascribed to the 520
fact that the wastes coming out from this plant are not subjected to a further ripening treatment that might 521
be necessary in order to obtain a well stabilized waste with lower impacts in landfills (Di Lonardo et al., 522
2014). Referring to Table 7, it can also be noticed that total VFAs content, as well as ammonia, exhibited an 523
increasing trend with temperature (T7,T6 > T3, T2 > R2) reflecting the different extent of the biological 524
process reached at different operating conditions. Namely, a total VFAs content ranging from 5.4 to 7.9 g/l 525
was measured and the acetate was found as the predominant compound (see Table S1 in supplementary 526
information). Hence, it seems that the hydrolytic‐acidogenic bacteria did not limit the substrate 527
degradation and the process was held at the acetogenic and methanogenic stage (a similar result was 528
obtained by Palatsi et al., 2011). Therefore, the inhibition was likely due to an imbalance in the growth rate 529
of acidogenic bacteria, which led to an accumulation of degradation by‐products in reactors, as also 530
observed by Adani et al. (2004). On the other hand, the inhibition of methanogenic bacteria may be also 531
due to the high TKN and ammonia content observed in the MBT samples (see Table 7). Thus, it is likely that 532
the interaction between ammonia, VFA and pH could have led to an “inhibited steady state” condition in 533
which the process was running stably but a very low methane yield (Chen et al., 2008). 534
Table 7 535
3.6 Experimental findings and practical implications 536
The BMP experiments, performed under optimal operating conditions, highlighted that for the analysed 537
MBT waste, only 45 % of the theoretical gas generation potential can be achieved within 30 days. This may 538
be due to the presence of less soluble/degradable or more recalcitrant organic substances in the solid 539
matrix, which cannot be mineralized during the limited duration of the BMP experiment. Hence, BMP tests, 540
with respect to a simple stoichiometric estimation from the organic carbon measured in the solid matrix, 541
can provide useful indications on the expected potential gas generation capacity of landfilled waste under 542
optimal conditions. On the contrary, the results obtained in this study highlighted that particular caution 543
should be paid when the anaerobic batch tests are carried out under limiting operational conditions, e.g. 544
low water content and temperature, high organic load, no inoculum addition. This is particularly true when 545
the material of concern is, as in the present case, a waste with high organic matter content and a poor 546
stability degree. In fact, although the tests performed under these limiting conditions may better resemble 547
the environmental conditions expected in the field, the presence of inhibitory substances at high level (such 548
as ammonia, VFA, heavy metals) may slow down or stop the anaerobic microbial process leading to an 549
underestimation of the gas yield and generation rate. Indeed, as already shown in Table 7, in all 550
experiments which exhibited very low gas generation rate and methane content, high concentrations of 551
VFA and ammonia were measured within the systems, revealing an imbalanced kinetic between acid 552
forming and acid consuming bacteria. Nevertheless, small pH changes were detected due to high protein 553
degradation, which have increased buffer capacity of the analysed waste sample as a result of ammonia 554
release. Hence, it is likely that the interaction between ammonia, VFA and pH lead to an “inhibited steady 555
state” condition in which the anaerobic process may run stably but at a very low gas yield. In particular, the 556
experimental results suggested that the microbial activity could be completely inhibited when the water 557
content of MBT waste was less than 32% (on wet weight) and severely reduced for higher water content 558
(up to the field capacity of approximately 43%) depending on the operating temperature. These findings 559
suggest that a stable gas generation process could be delayed for a long time until the environmental 560
conditions within MBT waste landfills become favourable to the establishment of a stable methanogenic 561
activity. Thus, it is not possible to predict how long the lag‐phase can last in a landfill disposal scenario, 562
where the boundary conditions significantly vary depending on the climate, the landfill geometry (surface, 563
height), the operative management strategies in place (e.g. leachate recirculation, waste disposal 564
methods), the presence and type of temporary and final cover systems. Indeed, the experimental results 565
reported in this study revealed that, as soon as the anaerobic process starts, a relative short time period, 566
ranging from few months up to two years depending on the water content and temperature, is required to 567
deplete the gas generation capacity. However, small scale experiments performed under controlled 568
conditions may not provide a gas generation trend that is completely representative of full‐scale landfill 569
sites. Here, higher heterogeneous and variable conditions are expected due to greater amounts of waste 570
mass, miscellaneous nature of emplaced waste as well as the heterogeneity of water flow patterns inside 571
the landfill body that are also affected by operational strategies (such as waste emplacement density, 572
permeability and thickness of daily cover). Moreover, landfilled waste are subjected to increasing 573
overloading pressure due to the emplacement of new waste layers. This condition surely influences the 574
water retention capacity of landfilled MBT waste so that the water content will be surely lower than the 575
ones simulated in the lab scale tests (e.g. 75 %w/w). This implies that the gas generation, in terms of both 576
gas yield and rate, measured in anaerobic experiments at high water contents may be significantly higher 577
than what expected in real scale MBT waste landfills. 578
4 Conclusions and perspectives 579
The gas production from MBT wastes was analysed by performing anaerobic batch tests under different 580
operating conditions. In order to characterize the MBT material regarding its long‐term gas emission in 581
different landfill disposal scenarios, a wide range of water contents (26‐43 %w/w up to 75 %w/w) and 582
temperatures (20‐25 °C, 37 °C and 55 °C) were investigated. The obtained results suggest that the analysed 583
MBT material still contains a large amount of readily degradable organic matter, as confirmed by the long 584
duration of the lag‐phase (several months), the high values of gas production potential (199.2±63 Nml/gTS), 585
the gas generation rates (ranging from 0.007 d‐1 at room temperature, 0.03‐0.05 d‐1 at 37°C and 0.04‐0.11 586
d‐1 at 55°C), as well as by the strong inhibition effects observed due to high concentrations of VFAs and 587
soluble ammonia. 588
Based on the results presented in this paper, the following conclusions and perspectives can be drawn: 589
- it is very difficult to predict how long the lag‐phase can last in MBT waste landfills where the 590
boundary conditions change continuously and vary significantly depending on the climate, the 591
landfill geometry (surface, height), the operative management strategies in place (e.g. leachate 592
recirculation, waste disposal methods) and the presence and type of temporary and final cover 593
systems. 594
- The water content of emplaced MBT waste is the most important factor limiting the anaerobic 595
biological process. Experimental results showed that when the moisture was lower than 32 %w/w, 596
the methanogenic microbial activity was completely inhibited whereas for higher values (43% w/w) 597
only a limited amount of the degradable organic matter was converted to biogas (34% of the 598
potential gas generation capacity). 599
- As soon as the environmental conditions inside the waste mass become favourable to the 600
establishment of the stable methanogenic phase, a relatively short time period, ranging from few 601
months up to two years is required to deplete the MBT waste gas generation. However, this result 602
provides just an indication of the actual lifetime of biogas production from MBT wastes disposed of 603
in landfills, where much higher amount of waste are emplaced and the environmental conditions 604
may be quite far from the experimental ones. 605
- The benefits of using the MBT technology within a sustainable waste management system strongly 606
depends on the efficiency of the biostabilization process in reducing the gas generation capacity of 607
the residual MBT waste. In this specific case, experimental data suggest that the aerobic biological 608
treatment carried out in this specific MBT facility was not properly managed and did not guarantee 609
a sufficient degree of stability for the produced MBT waste. Therefore, a further treatment of this 610
MBT waste might be desirable before landfilling it. 611
Acknowledgements 612
The authors wish to thank Hector Garcia and Hector Diaz, laboratory of Technical University of Denmark, 613
for the valuable cooperation to the chemical‐physical analysis. 614
References 615
Adani, F., Tambone, F., Gotti, A., 2004. Biostabilization of municipal solid waste. Waste Manage. 24, 775‐616
783. 617
Ahring, B.K., Sandberg, M., Angelidaki, I., 1995. Volatile fatty acid as indicators of process imbalance in 618
anaerobic digestors. Appl. Microbiol. Biotechnol. 43, 559‐565. 619
Angelidaki, I., Sanders, W., 2004. Assessment of the anaerobic biodegradability of macropollutants. Rev. 620
Environ. Sci. and BioTechnol. 3, 117‐129. 621
Angelidaki, I., Alves, M., Bolzonella, L., Borzacconi, L., Campos, J.L., Guwy, A.J., Kalyuzhnyi, S., Jenicek, P., 622
van Lier, J.B., 2009. Defining the biomethane potential (BMP) of solid organic wastes and energy crops: a 623
proposed protocol for batch assays. Water Sci. Technol. 59, 927‐934. 624
Amani, T., Nosrati, M., Sreekrishnan, T.R., 2011. A precise experimental study on key dissimilarities 625
between mesophilic and thermophilic anaerobic digestion of waste activated sludge. Int. J. Environ. Res. 5, 626
333‐342. 627
Argun, H., Kargi, F., Kapdan, I.K., 2008. Light fermentation of dark fermentation effluent for bio‐hydrogen 628
production by different Rhodobacter species at different initial volatile fatty acid (VFA) concentrations. Int. 629
J. Hydrogen Energ. 33, 7405‐7412. 630
Barrena, R., D’Imporzano, G., Ponsá, S., Gea, T., Artola, A., Vázquez, F., Sánchez, A., Adani, F., 2008. In 631
search of a reliable technique for the determination of the biological stability of the organic matter in the 632
mechanical‐biological treated waste. J. Hazard. Mater. 162, 1065‐1072. 633
Bayard, R., de Araújo Morais, J., Ducom, G., Achour, F., Rouez, M., Gourdon, R., 2010. Assessment of the 634
effectiveness of an industrial unit of mechanical‐biological treatment of municipal solid waste. J. Hazard. 635
Mater. 175, 23‐32. 636
Bilgili, M.S., Demir, A., Varank, G., 2009. Evaluation and modeling of biochemical methane potential (BMP) 637
of landfilled solid waste: a pilot scale study. Bioresource Technol. 100, 4976‐4980. 638
Binner, E., Zach, A., 1999. Laboratory tests describing the biological reactivity of pretreated residual wastes. 639
In: ORBIT Symposium, Weimar, 1999. 640
Bogner, J., Pipatti, R., Hashimoto, S., Diaz, C., Mareckova, K., Diaz, L., Kjeldsen, P., Monni, S., Faaij, A., Gao, 641
Q., Zhang, T., Ahmed, M.A., Sutamihardja, R.T., Gregory, R., 2008. Mitigation of global greenhouse gas 642
emissions from waste: conclusions and strategies from the Intergovernmental Panel on Climate Change 643
(IPCC) Fourth Assessment Report. Working Group III (Mitigation). Waste Manage. Res. 26, 11–32. 644
Boldrin, A., Neidel, T.,L., Damgaard, A., Bhander, G.S., Møller, J., Christensen, T.H., 2011. Modelling of 645
environmental impacts from biological treatment of organic municipal waste in EASEWASTE. Waste 646
Manage. 31, 619‐630. 647
Borzacconi, L., Lápez, I., Anido, C., 1997. Hydrolysis constant and VFA inhibition in acidogenic phase of MSW 648
anaerobic degradation. Water Sci. Technol. 36, 479‐484. 649
Bouallagui, H., Touhami, Y., Ben Cheick, R., Hamdi, M., 2005. Bioreactor performance in anaerobic digestion 650
of fruit and vegetables wastes. Process Biochem. 40, 989‐995. 651
Braber, K., 1995. Anaerobic digestion of municipal solid waste: a modern waste disposal option on the 652
verge of breakthrough. Biomass Bioenerg. 9, 365‐376. 653
Cabbai, V., Ballico, M., Aneggi, E., Goi, D., 2013. BMP tests of source selected OFMSW to evaluate anaerobic 654
codigestion with sewage sludge. Waste Manage. 33, 1626‐1632. 655
Chen, Y., Cheng, J.J., Creamer, K.S., 2008. Inhibition of anaerobic digestion process: a review. Bioresource 656
Technol. 99, 4044‐4064. 657
De Araujo‐Morais, J., Ducom, G., Achour, F., Rouez, M., Bayard, R., 2008. Mass balance to assess the 658
efficiency of a mechanical‐biological treatment. Waste Manage. 28, 1791‐1800. 659
De Gioannis, G., Muntoni, A., Cappai, G., Milia, S., 2009. Landfill gas generation after mechanical biological 660
treatment of municipal solid waste. Estimation of gas generation rate constants. Waste Manage. 29, 1026‐661
1034. 662
Di Lonardo, MC, Binner, E., Lombardi, F., 2014. Investigation on biological stability degree of mechanically‐663
biologically pre‐treated MSW produced in Rome. In: Eurasia Waste Management Symposium. 664
Di Maria, F., Sordi, A., Micale, C., 2013. Experimental and life cycle assessment analysis of gas emission 665
from mechanically‐biologically pretreated waste in a landfill with energy recovery. Waste Manage. 33, 666
2557‐2567. 667
Donovan, S.M., Bateson, T., Gronow, J.R., Voulvoulis, N., 2010. Modelling the behaviour of mechanical 668
biological treatment outputs in landfills using the GasSim model. Sci. Total Environ. 408, 1979‐1984. 669
Elbeshbishy, E., Nakhla, G., Hafez, H., 2012. Biochemical methane potential (BMP) of food waste and 670
primary sludge: influence of inoculum pre‐incubation and inoculum source. Bioresource Technol. 110, 18‐671
25. 672
Esposito, G., Frunzo, L., Liotta, F., Panico, A., Pirozzi, F., 2012. Bio‐methane potential tests to measure the 673
biogas production from the digestion and co‐digestion of complex organic substrates. The Open 674
Environmental Engineering Journal 5, 1‐8. 675
Farrell, M., Jones, D.L., 2009. Critical evaluation of municipal solid waste composting and potential compost 676
markets. Bioresource Technol. 100, 4301‐4310. 677
Gavala, H.N., Yenal, U., Skiadas, V., Westermann, P., Ahring, B.K., 2003. Mesophilic and thermophilic 678
anaerobic digestion of primary and secondary sludge. Effect of pre‐treatment at elevated temperature. 679
Water Res. 37, 4561‐4572. 680
Ghatak, M.D., Mahanta, P., 2014. Effect of temperature on biogas production from lignocellulosic 681
biomasses. In: International Conference on Non Conventional Energy (ICONCE 2014). 682
Gunaseelan, V.N., 1997. Anaerobic digestion of biomass for methane production: a review. Biomass 683
Bioenerg. 13, 83‐114. 684
Hansen, T.,L., Schmidt, J.E., Angelidaki, I., Marca, E., Jansen, J.C., Mosbæk, H., Christensen, T.H., 2004. 685
Method for determination of methane potentials of solid organic waste. Waste Manage. 24, 393‐400. 686
Harborth, P., Fuß, R., Münnich, K., Flessa, H., Fricke, K., 2013. Spatial variability of nitrous oxide and 687
methane emissions from an MBT landfill in operation: strong N2O hotspots at working face. Waste Manage. 688
33, 2099‐2107. 689
Hejnfelt, A., Angelidaki, I., 2009. Anaerobic digestion of slaughterhouse by‐products. Biomass Bioenerg. 33, 690
1046‐1054. 691
Heyer, K.U., Hupe, K., Stegmann, R., 2013. Methane emissions from MBT landfills. Waste Manage. 33, 1853‐692
1860. 693
Khalid, A., Arshad, M., Anjum, M., Mahmood, T., Dawson, L., 2011. The anaerobic digestion of solid organic 694
waste. Waste Manage. 31, 1737‐1744. 695
Kim, M., Ahn,Y‐H. Speece, R.E., 2002. Comparative process stability and efficiency of anaerobic digestion; 696
mesophilic vs thermophilic. Water Res. 36, 4369‐4385. 697
Labatut, R.A., Angenent, L.T., Scott, N.R., 2011. Biochemical methane potential and biodegradability of 698
complex organic substrates. Bioresource Tehnol. 102, 2255‐2264. 699
Laner, D., Crest, M., Scharff, H., Morris, J.W.F., Barlaz, M.A., 2012. A review of approaches for the long‐term 700
management of municipal solid waste landfills. Waste Manage. 32, 498‐512. 701
Lesteur, M., Bellon‐Maurel, V., Gonzalez, C., Latrille, E., Roger, J.M., Junqua, G., Steyer, J.P., 2010. 702
Alternative methods for determining anaerobic biodegradability: a review. Process Biochem. 45, 431‐440. 703
Li, Y., Park, S.Y., Zhu, J., 2011. Solid‐state anaerobic digestion for methane production from organic waste. 704
Renew. Sust. Energ. Rev. 15, 821‐826. 705
Liotta, F., d’Antonio, G., Esposito, G., Fabbricino, M., Frunzo, L., van Hullebusch, E.,D., Lens, P.N.L., Pirozzi, 706
F., 2014. Effect of moisture on disintegration kinetics during anaerobic digestion of complex organc 707
substrates. Waste Manage. Res. 32, 40‐48. 708
Liu, G., Zhang, R., El‐Mashad, H.M., Dong, R., 2009. Effect of feed to inoculum ratios on biogas yields of food 709
and green wastes. Bioresource Tehnol. 100, 5103‐ 5108. 710
Lo, H.M., Kurniawan, T.A., Sillanpää, M.E.T., Pai, T.Y., Chiang, C.F., Chao, K.P., Liu, M.H., Chuang, S.H., Banks, 711
C.J., Wang, S.C., Lin, C.Y., Liu, W.F., Cheng, P.H., Chen, C.K., Chiu, H.Y., Wu, H.Y., 2010. Modeling biogas 712
production from organic fraction of MSW co‐digested with MSWI ashes in anaerobic bioreactors. 713
Bioresource Tehnol. 101, 6329‐6335. 714
Lornage, R., Redon, E., Lagier, T., Hébé, I., Carré, J., 2007. Performance of a low cost MBT prior to landfilling: 715
study of the biological treatment of size reduced MSW without mechanical sorting. Waste Manage. 27, 716
1755‐1764. 717
Mata‐Alvarez, J., Cecchi, F., Pavan, P., Llabres, P., 1990. The performances of digesters treating the organic 718
fraction of municipal solid wastes differently sorted. Biol. Waste. 33, 181‐199. 719
Mata‐Alvarez, J., Macé, S., Llabrés, P., 2000. Anaerobic digestion of solid organic wastes. An overview of 720
research achievements and perspectives. Bioresource Tehnol. 74, 3‐16. 721
Modin, H., 2007. Impact of pre‐treatment on the stability and leachability of three different wastes. PhD 722
dissertation. Lund University. 723
Mohajer, A., Trémier, A., Barrington, S., Téglia, C., 2010. Compost mixture influence of interactive physical 724
parameters on microbial kinetics and substrate fractionation. Waste Manage. 30, 1464‐1471. 725
Montejo, C., Tonini, D., Márquez, M.C., Astrup, T.F., 2013. Mechanical‐biological treatment: performance 726
and potentials. An LCA of 8 MBT plants including waste characterization. J. Environ. Manage. 128, 661‐673. 727
Mor, S., Ravindra, K., De Visscher, A., Dahiya, R.P., Chandra, A., 2006. Municipal solid waste characterization 728
and its assessment for potential methane generation: a case study. Sci. Total Environ. 371, 1‐10. 729
Mora‐Naranjo, N., Meima, J.A., Haarstrick, A., Hempel, D.C., 2004. Modelling and experimental 730
investigation of environmental influences on the acetate and methane formation in solid waste. Waste 731
Manage. 24, 763‐773. 732
Mou, Z., Scheutz, C., Kjeldsen, P., 2015. Evaluating the methane generation rate constant (k value) of low 733
organic waste at Danish landfills. Waste Manage. 35, 170‐176. 734
Mshandete, A., Björnsson, L., Kivasi, A.K., Rubindamayugi, M.S.T., Mattiasson, B., 2006. Effect of particle 735
size on biogas yield from sisal fibre waste. Renew. Energ. 31, 2385‐2392. 736
Neves, L., Oliveira, R., Alves, M.M., 2006. Anaerobic co‐digestion of coffee waste and sewage sludge. Waste 737
Manage. 26, 176‐181. 738
Nopharatana, A., Pullammanappallil, P.C., Clarke, W., 2007. Kinetics and dynamic modelling of batch 739
anaerobic digestion of municipal solid waste in a stirred reactor. Waste Manage. 27, 595‐603. 740
Palatsi, J., Viñas, M., Guivernau, M., Fernandez, B., Flotats, X., 2011. Anaerobic digestion of slaughterhouse 741
waste: main process limitations and microbial community interactions. Bioresource Tehnol. 102, 2219‐742
2227. 743
Pan, J., Voulvoulis, N., 2007. The role of mechanical and biological treatment in reducing methane 744
emissions from landfill disposal of municipal solid waste in the United Kingdom. J. Air Waste Manage. 57, 745
155‐163. 746
Pantini, S., Verginelli, I., Lombardi, F., 2014. A new screening model for leachate production assessment at 747
landfill sites. Int. J. Environ. Sci. Technol. 11, 1503‐1516. 748
Pantini, S., Verginelli, I., Lombardi, F., 2015. Analysis and modeling of metals release from MBT wastes 749
through batch and up‐flow column tests. Waste Manage. 38, 22‐32. 750
Poggi‐Varaldo, H.M., Rodríguez‐Vázquez, R., Fernández‐Villagómez, G., Esparza‐García, F., 1997. Inhibition 751
of mesophilic solid‐substrate anaerobic digestion by ammonia nitrogen. Appl. Microbiol. Biotechnol. 47, 752
284‐291. 753
Pognani, M., Barrena, R., Font, X., Scaglia, B., Adani, F., Sánchez, A., 2010. Monitoring the organic matter 754
properties in a combined anaerobic/aerobic full‐scale municipal source separated waste treatment plant. 755
Bioresource Tehnol. 101, 6873‐6877. 756
Raposo, F., de la Rubia, M.A., Borja, R., Alaiz, M., 2008. Assessment of a modified and optimised method for 757
determining chemical oxygen demand of solid substrates and solutions with high suspended solid content. 758
Talanta 76, 448‐453. 759
Raposo, F., De la Rubia, M.A., Fernández‐Cegrí, V., Borja, R., 2011. Anaerobic digestion of solid organic 760
substrates in batch mode: an overview relating to methane yields and experimental procedures. Renew. 761
Sust. Energ. Rev. 16, 861‐877. 762
Scaglia, B., Confalonieri, R., D’Imporzano, G., Adani, F., 2010. Estimating biogas production of biologically 763
treated municipal solid waste. Bioresource Tehnol. 101, 945‐952. 764
Schievano, A., D’Imporzano, G., Malagutti, L., Fragali, E., Ruboni, G., Adani, F., 2010. Evaluating inhibition 765
conditions in high‐solids anaerobic digestion of organic fraction of municipal solid waste. Bioresource 766
Technol. 101, 5728‐5732. 767
Siddiqui, A.A., Richards, D.J., Powrie, W., 2013. Biodegradation and flushing of MBT wastes. Waste Manage. 768
33, 2257‐2266. 769
Sormunen, K., Einola, J., Ettala, M., Rintala, J., 2008. Leachate and gaseous emissions from initial phase of 770
landfilling mechanically and mechanically‐biologically treated municipal solid waste residuals. Bioresource 771
Tehnol. 99, 2399‐2409. 772
Thomsen, N.I., Milosevic, N., Bjerg, P.L., 2012. Application of a contaminant mass balance method at an old 773
landfill to assess the impact on water resources. Waste Manage. 32, 2406‐2417. 774
Tremier, A., de Guardia, A., Massiani, C., Paul, E., Martel, J.L., 2005. A respirometric method for 775
characterising the organic composition and biodegradation kinetics, for a mixture of sludge and bulking 776
agent to be co‐composted. Bioresource Technol. 96, 169‐180. 777
UNI EN 12457‐2, (2004). Characterization of waste – Leaching ‐ Compliance test for leaching of granular 778
waste materials and sludges. Part 4: One stage batch test at a liquid to solid ratio of 10 l/kg for materials 779
with particle size below 4 mm (without or with size reduction). 780
UNI EN 13137, (2001). Characterization of waste ‐ Determination of total organic carbon (TOC) in waste, 781
sludges and sediments. 782
UNI 10802, (2013). Rifiuti ‐ Campionamento manuale, preparazione del campione ed analisi degli eluati. 783
Wastes‐ Manual sampling and preparation of sample and analysis of eluates. 784
UNI/TS 11184, (2006). Rifiuti e combustibili ricavati da rifiuti ‐ Determinazione della stabilità biologica 785
mediante l'Indice di Respirazione Dinamico (IRD). Waste and refuse derived fuel ‐ Determination of 786
biological stability by dynamic respirometric index. 787
UNI EN 14346 (2006). Characterization of waste ‐ Calculation of dry matter by determination of dry residue 788
or water content. 789
van Lier, J.B., Rebac, S., Lettinga, G., 1997. High‐rate anaerobic wastewater treatment under psychrophilic 790
and thermophilic conditions. Wat. Sci. Tech. 35, 199‐206. 791
Vavilin, V.A., Lokshina, L.Y., Jokela, J.P.Y., Rintala, J.A., 2004. Modeling solid waste decomposition. 792
Bioresource Tehnol. 94, 69‐81. 793
Vavilin, V.A., Fernandez, B., Palatsi, J., Flotats, X., 2008. Hydrolysis kinetics in anaerobic degradation of 794
particulate organic material: an overview. Waste Manage. 28, 939‐951. 795
Veeken, A., Hamelers, B., 1999. Effect of temperature on hydrolysis rates of selected biowaste components. 796
Bioresource Tehnol. 69, 249‐254. 797
Veeken, A., Kalyuzhnyi, S., Scharff, H., Hamelers, B., 2000. Effect of pH and VFA on hydrolysis of organic 798
solid waste. J. Environ. Eng. 126, 1076‐1081. 799
Vigneron, V., Bureau, C., Bernet, N., Bouchez, T., 2007. Effect of ammonia on the methanogenic diversity 800
and activity in simulated MSW bioreactor landfills. In: Proceedings Sardinia 2007, Cagliari, Italy. 801
White, J.K., Beaven, R.P., 2013. Developments to a landfill processes model following its application to two 802
landfill modelling challenges. Waste Manage. 33, 1969‐1981. 803
Yenigün, O., Demirel, B., 2013. Ammonia inhibition in anaerobic digestion: a review. Process Biochem. 48, 804
901‐911. 805
Zach, A., Binner, E., Latif, M., 2000. Improvement of municipal solid waste quality for landfilling by means of 806
mechanically‐biological pretreatment. Waste Manage. Res. 18, 25‐32. 807

LIST OF FIGURES 808
Fig. 1. BMP cumulative methane production measured in control (red dots) and MBT waste (green dots) tests, 809
expressed as Nml CH4 per g of total solids. Solid red line: theoretical methane generation of control. Dotted green line: 810
theoretical methane generation of MBT waste, computed according to Eq. (3). Bars: standard deviation. The results is 811
the average of 6 and 3 bottles for MBT waste and controls, respectively. 812
Fig. 2. Cumulative methane (red circles) and carbon dioxide (black square dots) curves as a function of the incubation 813
time, obtained during anaerobic batch tests carried out on MBT waste samples at room temperature (20‐25 °C) and 814
different values of initial water content (26%, 34‐75% and 43% w/w). Solid red line: CH4 potential obtained from BMP 815
tests. Dotted black line: CO2 potential obtained from BMP tests. Dotted grey line: starting point of stage III. 816
Fig. 3. Cumulative methane (red circles) and carbon dioxide (black square dots) curves as a function of the incubation 817
time, obtained during anaerobic batch tests carried out on MBT waste samples at 37 °C and different values of the 818
initial water content (26%, 32%, 32‐75%, 38‐75%, 43% and 43‐48% w/w). Solid red line: CH4 potential from BMP. 819
Dotted black line: CO2 potential from BMP. Solid grey line: starting point of stage II. Dotted grey line: starting point of 820
stage III. 821
Fig. 4. Cumulative methane (red circles) and carbon dioxide (black square dots) curves as a function of the incubation 822
time, obtained during anaerobic batch tests carried out on MBT waste samples at 55 °C and different values of the 823
initial water content (26%, 32%, 32‐75%, 38‐75%,43% w/w). 824
Fig. 5. Cumulative biogas volume (Nl/kgTS) as a function of the incubation time: comparison between measured data 825
(dots) and modelling results obtained with a first‐order kinetic model (lines). 826
LIST OF TABLES 827
Table 1. Literature overview on the anaerobic digestion experiments performed on MBT wastes. 828
Table 2. Average composition of residual MSW (% wet weight) feeding the MBT plant. 829
Table 3. Summary of the test conditions and activity stage of the anaerobic batch experiments performed on the MBT 830
waste samples. 831
Table 4. Characterization of the MBT waste. Mean value ± standard deviation. 832
Table 5. First‐order kinetic model parameters derived by interpolating experimental data for different test conditions. 833
L0: maximum biogas production (Nl/kgTS). tlag: lag time (d). k: first‐order kinetic constant (d‐1). R2: correlation factor. 834
%L0/BMP: percentage of gas generated compared to the potential value measured in BMP test. T99%: time to reach 835
99% of maximum gas generation. 836
Table 6. Literature values of gas yield and first‐order kinetic constant (k) for different types of organic substrates. 837
Table 7. Average value and (±) standard deviation of total nitrogen, TKN (g/kgTS), soluble nitrogen, NH4‐N(g/kgTS), 838
%NH4‐N/TKN and total VFAs concentration (g/l) measured in fresh MBT waste and in samples removed from 839
anaerobic batch reactors. 840
841
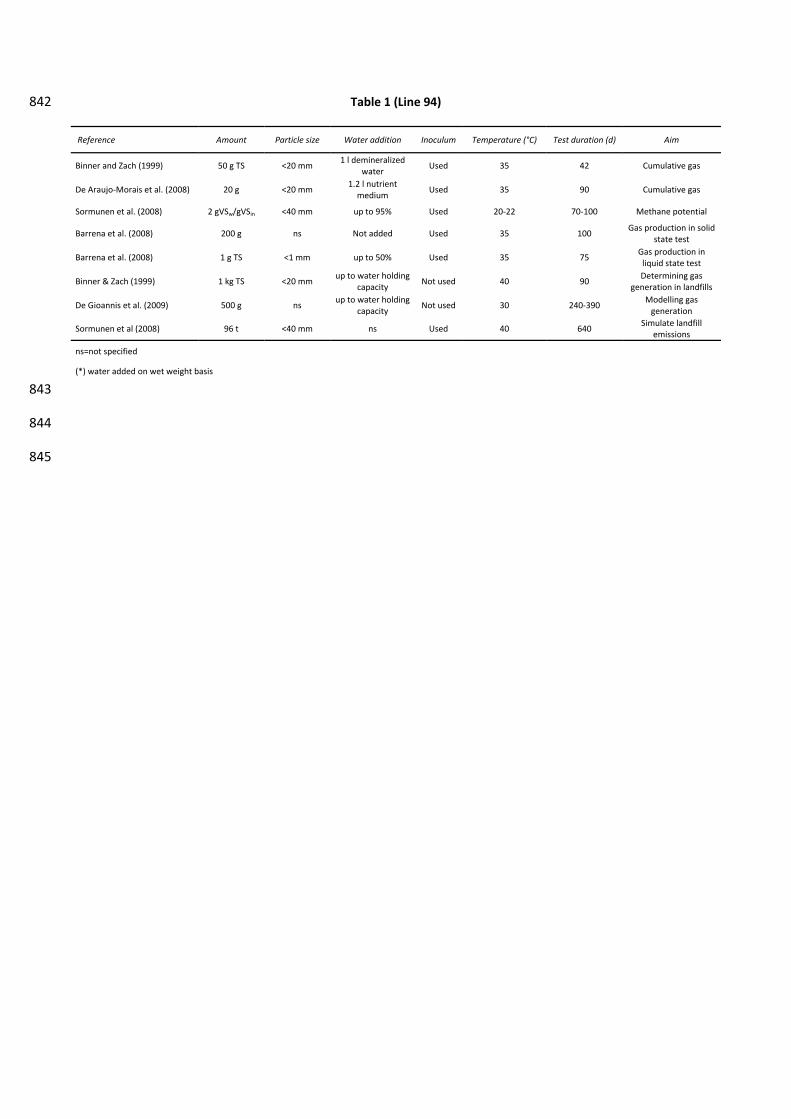
Table 1 (Line 94) 842
Reference Amount Particle size Water addition Inoculum Temperature (°C) Test duration (d) Aim
Binner and Zach (1999) 50 g TS <20 mm 1 l demineralized
water Used 35 42 Cumulative gas
De Araujo‐Morais et al. (2008) 20 g <20 mm 1.2 l nutrient medium
Used 35 90 Cumulative gas
Sormunen et al. (2008) 2 gVSw/gVSin <40 mm up to 95% Used 20‐22 70‐100 Methane potential
Barrena et al. (2008) 200 g ns Not added Used 35 100 Gas production in solid
state test
Barrena et al. (2008) 1 g TS <1 mm up to 50% Used 35 75 Gas production in liquid state test
Binner & Zach (1999) 1 kg TS <20 mm up to water holding
capacity Not used 40 90
Determining gas generation in landfills
De Gioannis et al. (2009) 500 g ns up to water holding
capacity Not used 30 240‐390
Modelling gas generation
Sormunen et al (2008) 96 t <40 mm ns Used 40 640 Simulate landfill
emissions
ns=not specified
(*) water added on wet weight basis
843
844
845
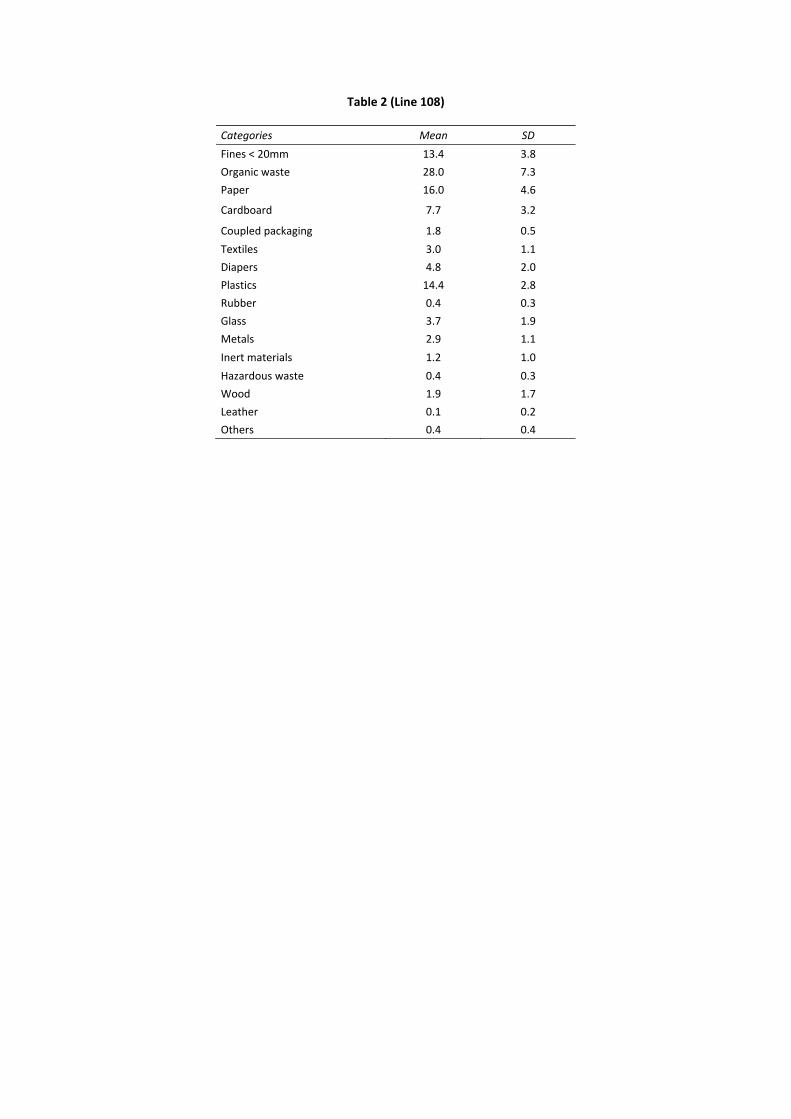
Table 2 (Line 108)
Categories Mean SD
Fines < 20mm 13.4 3.8
Organic waste 28.0 7.3
Paper 16.0 4.6
Cardboard 7.7 3.2
Coupled packaging 1.8 0.5
Textiles 3.0 1.1
Diapers 4.8 2.0
Plastics 14.4 2.8
Rubber 0.4 0.3
Glass 3.7 1.9
Metals 2.9 1.1
Inert materials 1.2 1.0
Hazardous waste 0.4 0.3
Wood 1.9 1.7
Leather 0.1 0.2
Others 0.4 0.4
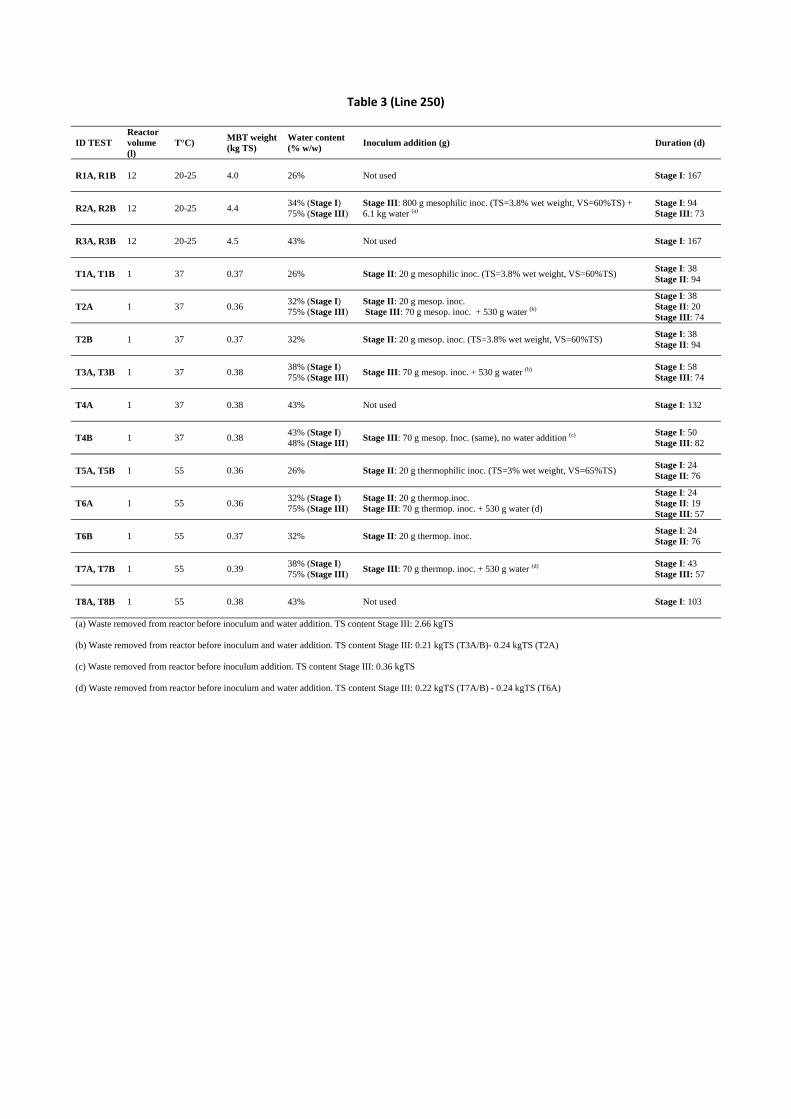
Table 3 (Line 250)
ID TEST Reactor volume (l)
T°C) MBT weight (kg TS)
Water content (% w/w)
Inoculum addition (g) Duration (d)
R1A, R1B 12 20-25 4.0 26% Not used Stage I: 167
R2A, R2B 12 20-25 4.4 34% (Stage I) 75% (Stage III)
Stage III: 800 g mesophilic inoc. (TS=3.8% wet weight, VS=60%TS) + 6.1 kg water (a)
Stage I: 94 Stage III: 73
R3A, R3B 12 20-25 4.5 43% Not used Stage I: 167
T1A, T1B 1 37 0.37 26% Stage II: 20 g mesophilic inoc. (TS=3.8% wet weight, VS=60%TS) Stage I: 38 Stage II: 94
T2A 1 37 0.36 32% (Stage I) 75% (Stage III)
Stage II: 20 g mesop. inoc. Stage III: 70 g mesop. inoc. + 530 g water (b)
Stage I: 38 Stage II: 20 Stage III: 74
T2B 1 37 0.37 32% Stage II: 20 g mesop. inoc. (TS=3.8% wet weight, VS=60%TS) Stage I: 38 Stage II: 94
T3A, T3B 1 37 0.38 38% (Stage I) 75% (Stage III)
Stage III: 70 g mesop. inoc. + 530 g water (b) Stage I: 58 Stage III: 74
T4A 1 37 0.38 43% Not used Stage I: 132
T4B 1 37 0.38 43% (Stage I) 48% (Stage III)
Stage III: 70 g mesop. Inoc. (same), no water addition (c) Stage I: 50 Stage III: 82
T5A, T5B 1 55 0.36 26% Stage II: 20 g thermophilic inoc. (TS=3% wet weight, VS=65%TS) Stage I: 24 Stage II: 76
T6A 1 55 0.36 32% (Stage I) 75% (Stage III)
Stage II: 20 g thermop.inoc. Stage III: 70 g thermop. inoc. + 530 g water (d)
Stage I: 24 Stage II: 19 Stage III: 57
T6B 1 55 0.37 32% Stage II: 20 g thermop. inoc. Stage I: 24 Stage II: 76
T7A, T7B 1 55 0.39 38% (Stage I) 75% (Stage III)
Stage III: 70 g thermop. inoc. + 530 g water (d) Stage I: 43 Stage III: 57
T8A, T8B 1 55 0.38 43% Not used Stage I: 103
(a) Waste removed from reactor before inoculum and water addition. TS content Stage III: 2.66 kgTS
(b) Waste removed from reactor before inoculum and water addition. TS content Stage III: 0.21 kgTS (T3A/B)- 0.24 kgTS (T2A)
(c) Waste removed from reactor before inoculum addition. TS content Stage III: 0.36 kgTS
(d) Waste removed from reactor before inoculum and water addition. TS content Stage III: 0.22 kgTS (T7A/B) - 0.24 kgTS (T6A)

Table 4 (Line 273)
Mean Unit
Initial water content, W (*) 19.4 ± 1.1 (%w/w)
Water content at field capacity, FC (*) 41 ± 5 (%w/w)
Total solids, TS (*) 80.6 ± 1.0 (%w/w)
Volatile solids, VS 47.3 ± 1.0 (%TS)
Organic carbon, TOC 23.9 ± 0.3 (%TS)
pH 6.7 ‐‐
TKN 14.1± 2.0 g/kgTS
NH4‐N 2.0 ± 0.2 g/kgTS
COD 520 ± 40 g/kgTS
Total VFA 0.18 ± 0.05 g/l
(*) expressed on wet weight basis
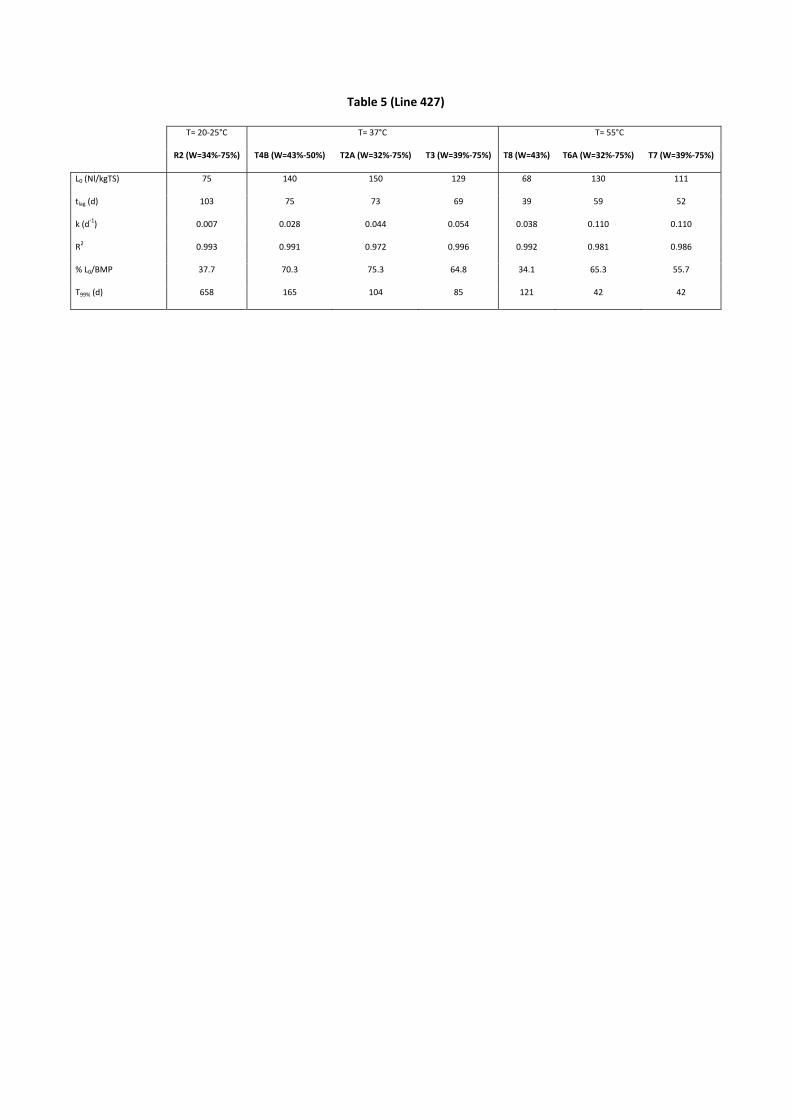
Table 5 (Line 427)
T= 20‐25°C T= 37°C T= 55°C
R2 (W=34%‐75%) T4B (W=43%‐50%) T2A (W=32%‐75%) T3 (W=39%‐75%) T8 (W=43%) T6A (W=32%‐75%) T7 (W=39%‐75%)
L0 (Nl/kgTS) 75 140 150 129 68 130 111
tlag (d) 103 75 73 69 39 59 52
k (d‐1) 0.007 0.028 0.044 0.054 0.038 0.110 0.110
R2 0.993 0.991 0.972 0.996 0.992 0.981 0.986
% L0/BMP 37.7 70.3 75.3 64.8 34.1 65.3 55.7
T99% (d) 658 165 104 85 121 42 42
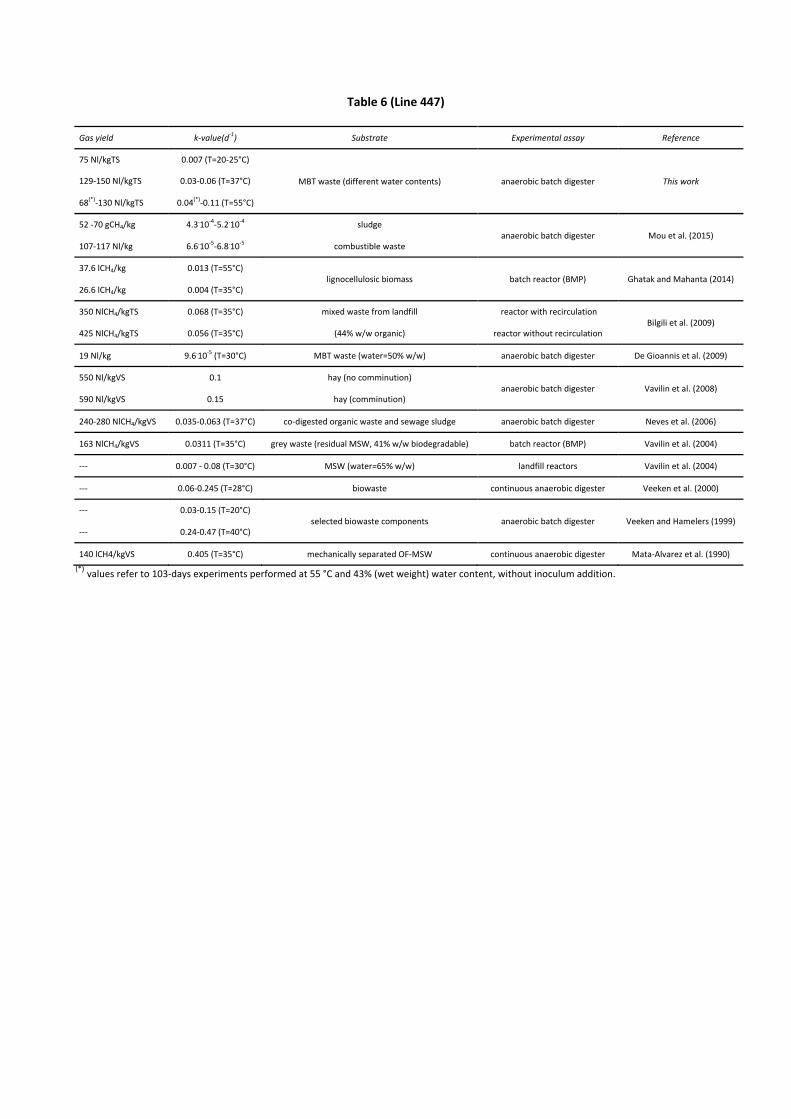
Table 6 (Line 447)
Gas yield k‐value(d‐1) Substrate Experimental assay Reference
75 Nl/kgTS 0.007 (T=20‐25°C)
MBT waste (different water contents) anaerobic batch digester This work 129‐150 Nl/kgTS 0.03‐0.06 (T=37°C)
68(*)‐130 Nl/kgTS 0.04(*)‐0.11 (T=55°C)
52 ‐70 gCH4/kg 4.3.10‐4‐5.2.10‐4 sludge anaerobic batch digester Mou et al. (2015)
107‐117 Nl/kg 6.6.10‐5‐6.8.10‐5 combustible waste
37.6 lCH4/kg 0.013 (T=55°C) lignocellulosic biomass batch reactor (BMP) Ghatak and Mahanta (2014)
26.6 lCH4/kg 0.004 (T=35°C)
350 NlCH4/kgTS 0.068 (T=35°C) mixed waste from landfill reactor with recirculation Bilgili et al. (2009)
425 NlCH4/kgTS 0.056 (T=35°C) (44% w/w organic) reactor without recirculation
19 Nl/kg 9.6.10‐5 (T=30°C) MBT waste (water=50% w/w) anaerobic batch digester De Gioannis et al. (2009)
550 Nl/kgVS 0.1 hay (no comminution) anaerobic batch digester Vavilin et al. (2008)
590 Nl/kgVS 0.15 hay (comminution)
240‐280 NlCH4/kgVS 0.035‐0.063 (T=37°C) co‐digested organic waste and sewage sludge anaerobic batch digester Neves et al. (2006)
163 NlCH4/kgVS 0.0311 (T=35°C) grey waste (residual MSW, 41% w/w biodegradable) batch reactor (BMP) Vavilin et al. (2004)
‐‐‐ 0.007 ‐ 0.08 (T=30°C) MSW (water=65% w/w) landfill reactors Vavilin et al. (2004)
‐‐‐ 0.06‐0.245 (T=28°C) biowaste continuous anaerobic digester Veeken et al. (2000)
‐‐‐ 0.03‐0.15 (T=20°C) selected biowaste components anaerobic batch digester Veeken and Hamelers (1999)
‐‐‐ 0.24‐0.47 (T=40°C)
140 lCH4/kgVS 0.405 (T=35°C) mechanically separated OF‐MSW continuous anaerobic digester Mata‐Alvarez et al. (1990)
(*) values refer to 103‐days experiments performed at 55 °C and 43% (wet weight) water content, without inoculum addition.
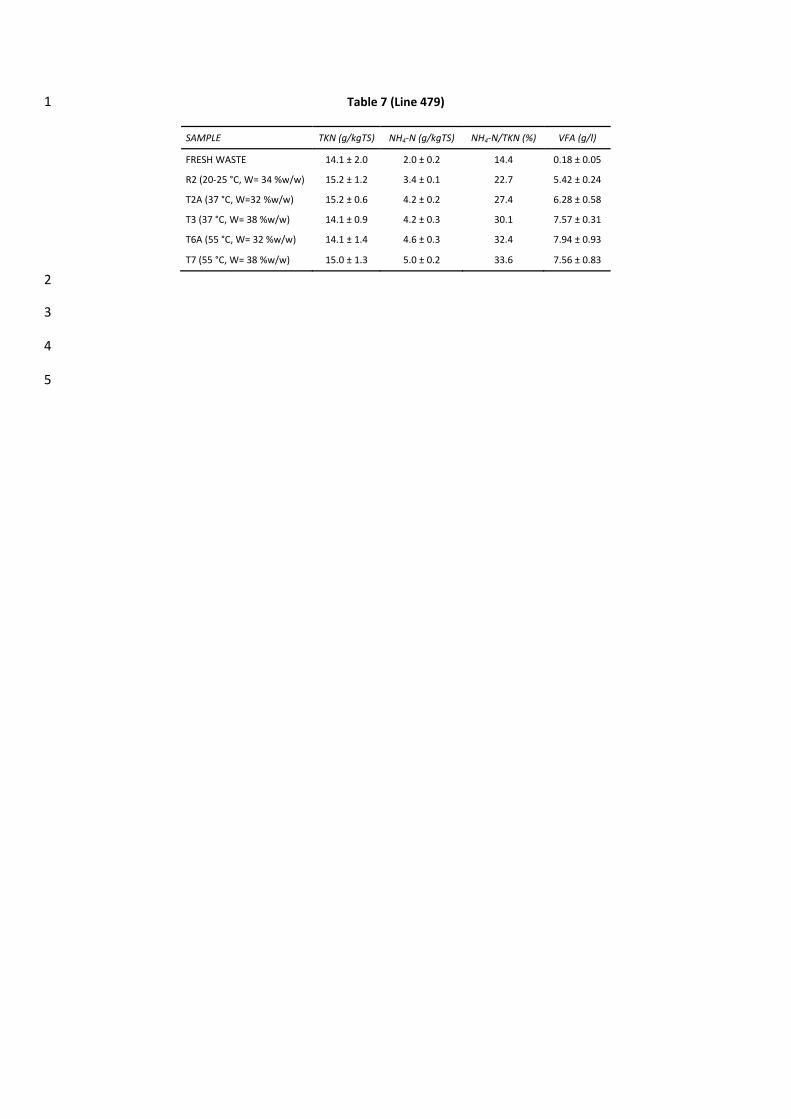
Table 7 (Line 479) 1
SAMPLE TKN (g/kgTS) NH4‐N (g/kgTS) NH4‐N/TKN (%) VFA (g/l)
FRESH WASTE 14.1 ± 2.0 2.0 ± 0.2 14.4 0.18 ± 0.05
R2 (20‐25 °C, W= 34 %w/w) 15.2 ± 1.2 3.4 ± 0.1 22.7 5.42 ± 0.24
T2A (37 °C, W=32 %w/w) 15.2 ± 0.6 4.2 ± 0.2 27.4 6.28 ± 0.58
T3 (37 °C, W= 38 %w/w) 14.1 ± 0.9 4.2 ± 0.3 30.1 7.57 ± 0.31
T6A (55 °C, W= 32 %w/w) 14.1 ± 1.4 4.6 ± 0.3 32.4 7.94 ± 0.93
T7 (55 °C, W= 38 %w/w) 15.0 ± 1.3 5.0 ± 0.2 33.6 7.56 ± 0.83
2
3
4
5
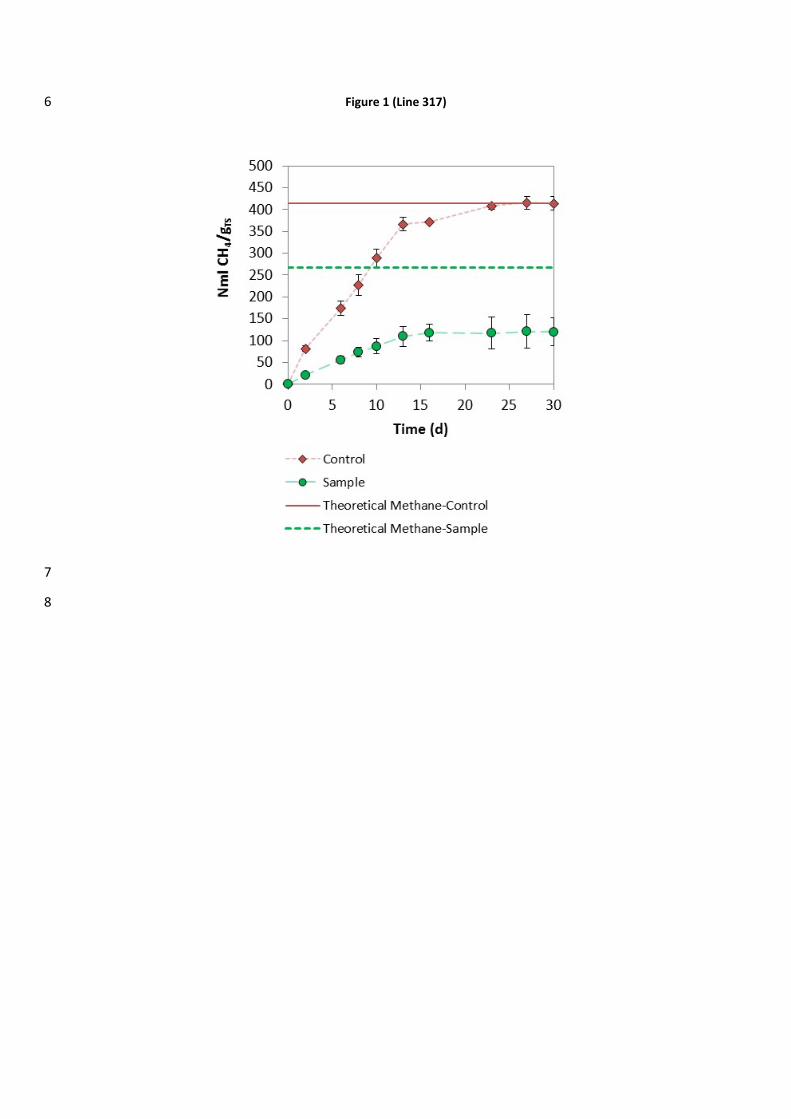
Figure 1 (Line 317) 6
7
8
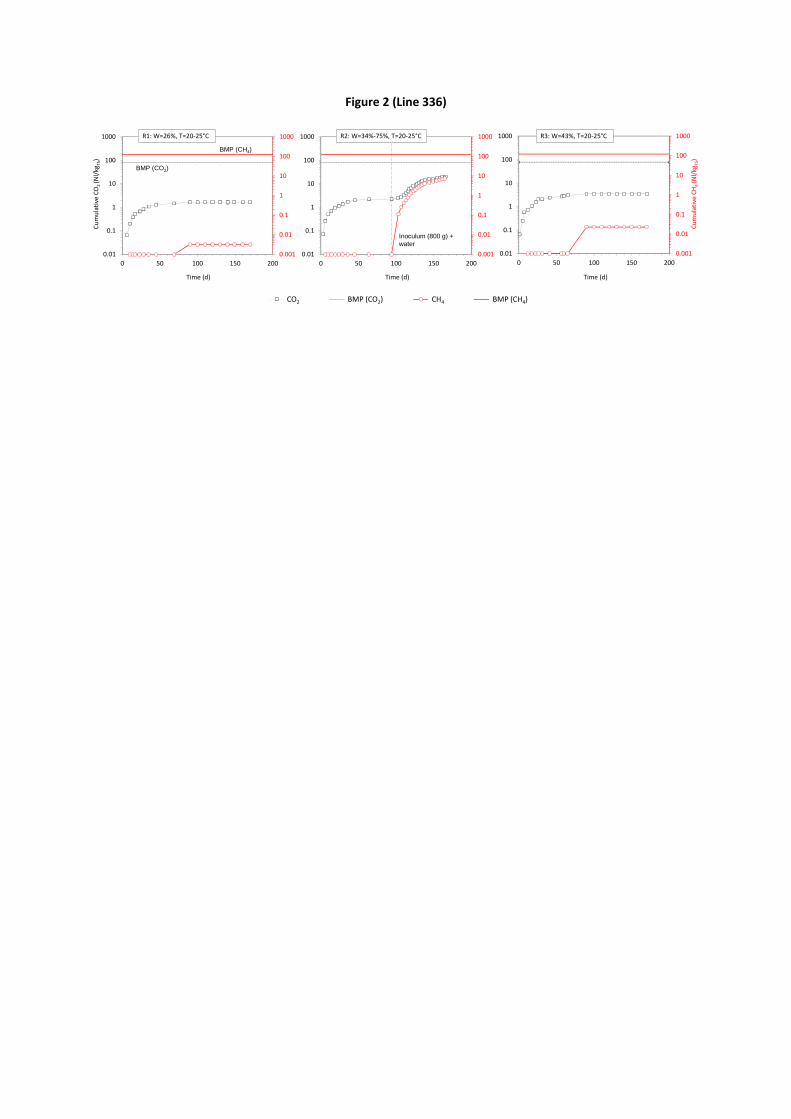
Figure 2 (Line 336)
0.001
0.01
0.1
1
10
100
1000
0.01
0.1
1
10
100
1000
0 50 100 150 200
Time (d)
Inoculum (800 g) + water
R2: W=34%‐75%, T=20‐25°C
0.001
0.01
0.1
1
10
100
1000
0.01
0.1
1
10
100
1000
0 50 100 150 200
BMP (CH4)
BMP (CO2)
Time (d)
R1: W=26%, T=20‐25°C
Cumulative CO2 (N
l/kg
TS)
0.001
0.01
0.1
1
10
100
1000
0.01
0.1
1
10
100
1000
0 50 100 150 200
Time (d)
R3: W=43%, T=20‐25°C
Cumulative CH4(Nl/kg
TS)
CO2 BMP (CO2) CH4 BMP(CH4)CO2 BMP (CO2) CH4 BMP (CH4)
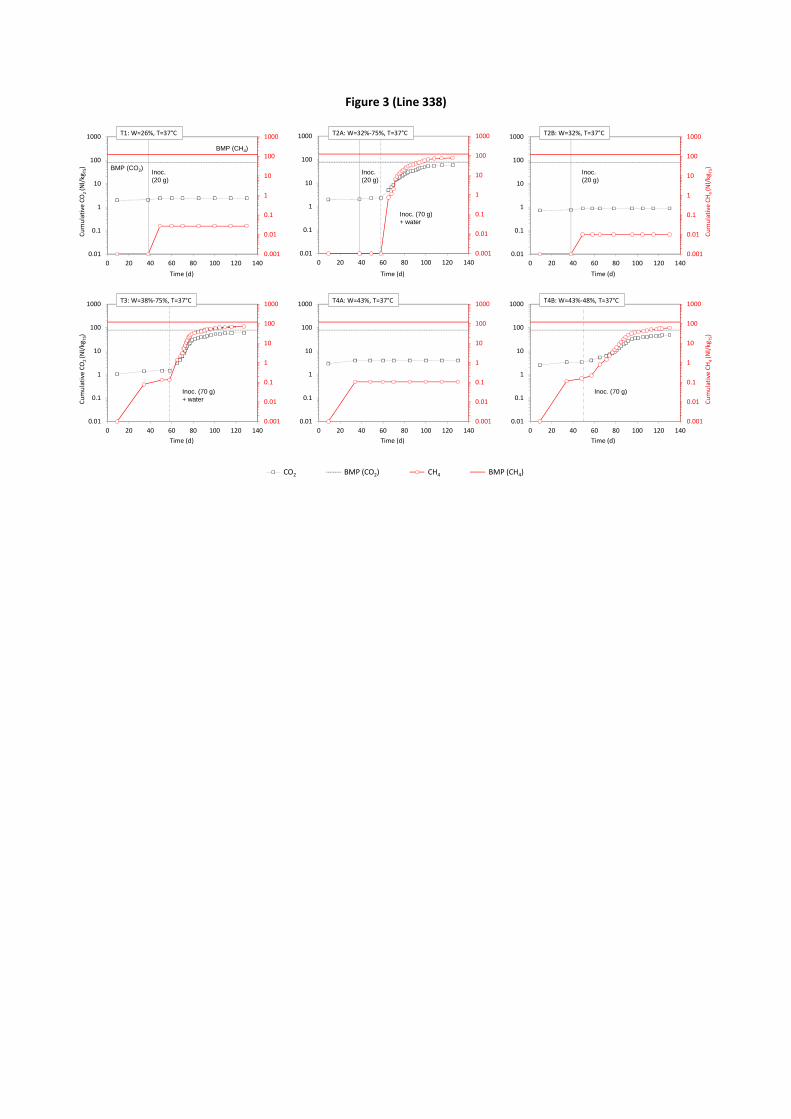
Figure 3 (Line 338)
0.001
0.01
0.1
1
10
100
1000
0.01
0.1
1
10
100
1000
0 20 40 60 80 100 120 140
Inoc. (20 g)
Inoc. (70 g) + water
Time (d)
T2A: W=32%‐75%, T=37°C
0.001
0.01
0.1
1
10
100
1000
0.01
0.1
1
10
100
1000
0 20 40 60 80 100 120 140
Time (d)
T4A: W=43%, T=37°C
0.001
0.01
0.1
1
10
100
1000
0.01
0.1
1
10
100
1000
0 20 40 60 80 100 120 140
Inoc. (20 g)
BMP (CH4)
BMP (CO2)
Time (d)
T1: W=26%, T=37°C
Cumulative CO2 (N
l/kg
TS)
0.001
0.01
0.1
1
10
100
1000
0.01
0.1
1
10
100
1000
0 20 40 60 80 100 120 140
Time (d)
T2B: W=32%, T=37°C
Inoc.(20 g)
Cumulative CH4(Nl/kg
TS)
0.001
0.01
0.1
1
10
100
1000
0.01
0.1
1
10
100
1000
0 20 40 60 80 100 120 140
Time (d)
T3: W=38%‐75%, T=37°C
Inoc. (70 g) + waterC
umulative CO2 (N
l/kg
TS)
0.001
0.01
0.1
1
10
100
1000
0.01
0.1
1
10
100
1000
0 20 40 60 80 100 120 140
Time (d)
T4B: W=43%‐48%, T=37°C
Inoc. (70 g)
Cumulative CH4(Nl/kg
TS)
CO2 BMP (CO2) CH4 BMP(CH4)CO2 BMP (CO2) CH4 BMP (CH4)
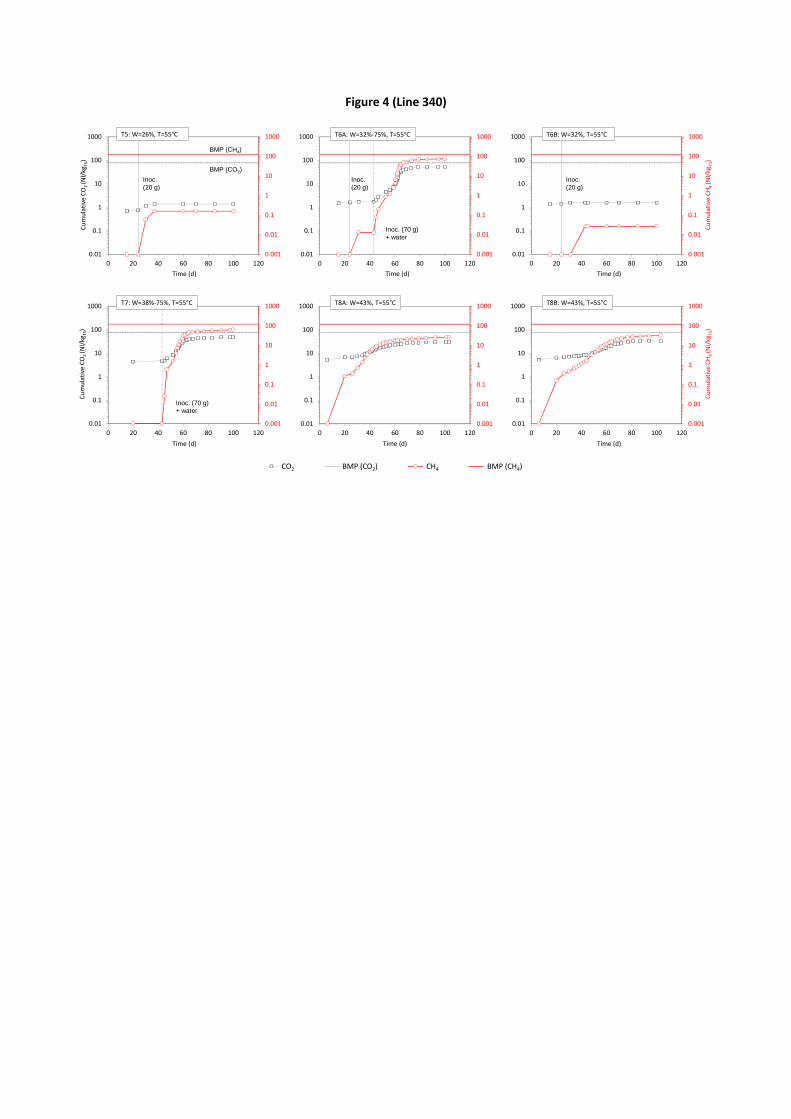
Figure 4 (Line 340)
0.001
0.01
0.1
1
10
100
1000
0.01
0.1
1
10
100
1000
0 20 40 60 80 100 120
Time (d)
T6A: W=32%‐75%, T=55°C
Inoc. (20 g)
Inoc. (70 g) + water
0.001
0.01
0.1
1
10
100
1000
0.01
0.1
1
10
100
1000
0 20 40 60 80 100 120
Time (d)
T8A: W=43%, T=55°C
0.001
0.01
0.1
1
10
100
1000
0.01
0.1
1
10
100
1000
0 20 40 60 80 100 120
BMP (CH4)
BMP (CO2)
Time (d)
T5: W=26%, T=55°C
Inoc. (20 g)
Cumulative CO2 (N
l/kg
TS)
0.001
0.01
0.1
1
10
100
1000
0.01
0.1
1
10
100
1000
0 20 40 60 80 100 120
Time (d)
Inoc. (20 g)
T6B: W=32%, T=55°C
Cumulative CH4(Nl/kg
TS)
0.001
0.01
0.1
1
10
100
1000
0.01
0.1
1
10
100
1000
0 20 40 60 80 100 120
Time (d)
Inoc. (70 g) + water
T7: W=38%‐75%, T=55°C
Cumulative CO2 (N
l/kg
TS)
0.001
0.01
0.1
1
10
100
1000
0.01
0.1
1
10
100
1000
0 20 40 60 80 100 120
Time (d)
T8B: W=43%, T=55°C
Cumulative CH4(Nl/kg
TS)
CO2 BMP (CO2) CH4 BMP(CH4)CO2 BMP (CO2) CH4 BMP (CH4)
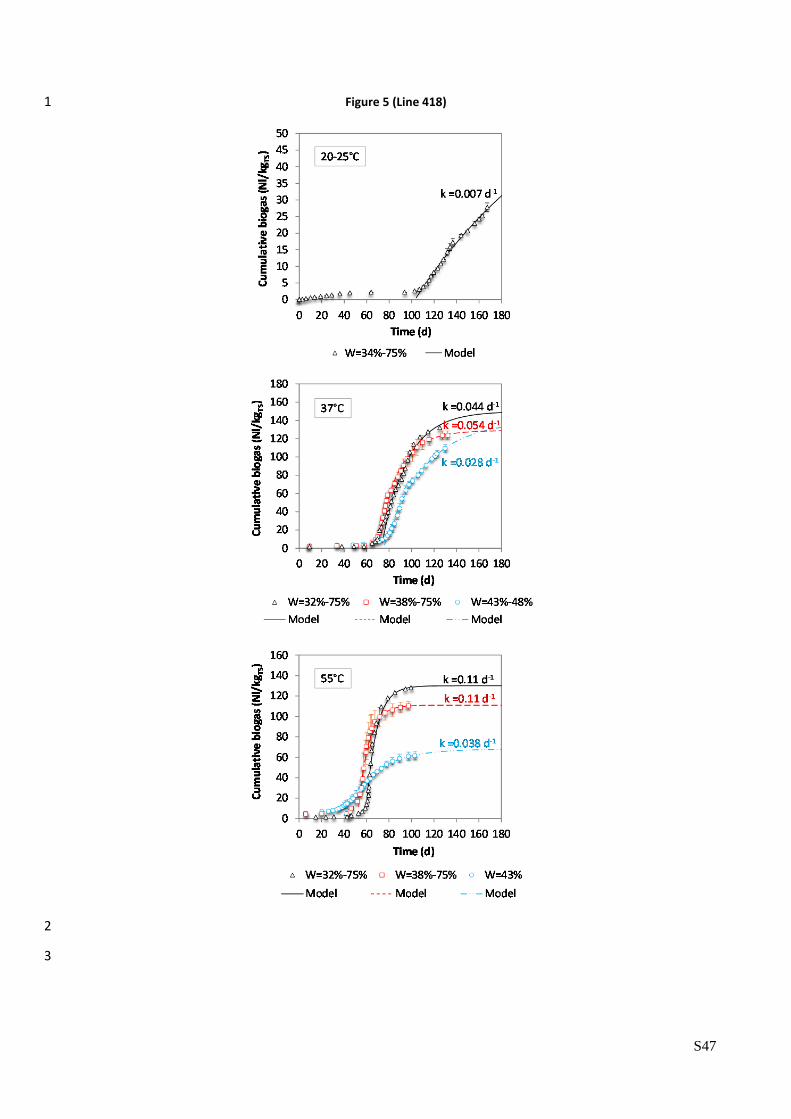
S47
Figure 5 (Line 418) 1
2
3
S48
5 4
5
6
7
Supplementary Material for: 8
Assessment of biogas production from MBT waste under different operating conditions 9
Sara Pantini 1*, Iason Verginelli 1, Francesco Lombardi 1, Charlotte Scheutz 2, Peter Kjeldsen 2 10
11
1 Department of Civil Engineering and Computer Science Engineering, University of Rome “Tor Vergata” 12
Via del Politecnico, 1, 00133 Rome (Italy) 13
Tel.: +39 06 72597497; fax: +39 06 72597021 14
*E‐mail address: [email protected] 15
16
2 Department of Environmental Engineering, Technical University of Denmark 17
Miljoevej, Building 113, DK‐2800 Kgs. Lyngby (Denmark) 18
Tel.: +45 45251561; fax: +45 45932850 19
20
21
6 Table of contents 22
Figure S1. Gas composition (percentage by volume) measured in tests at room temperature (20‐25°C) and 23
initial water content of 32%‐75% (R2) and 43% (R3). Solid grey line: starting point of stage III. ................... 50 24
Figure S2. Gas composition (percentage by volume) measured in tests at 37°C and initial water content of 25
32%‐75% (T2A), 32% (T2B), 38%‐75% (T3A/B), 43% (T4A) and 43%‐48% (T4B). Dotted grey line: starting 26
point of stage II. Solid grey line: starting point of stage III. ............................................................................. 51 27
Figure S3. Gas composition (percentage by volume) measured in tests at 55°C and initial water content of 28
32%‐75% (T6A), 32% (T6B), 38%‐75% (T7A/B), 43% (T8A/B). Dotted grey line: starting point of stage II. Solid 29
grey line: starting point of stage III. ................................................................................................................. 52 30
31

S49
32
33
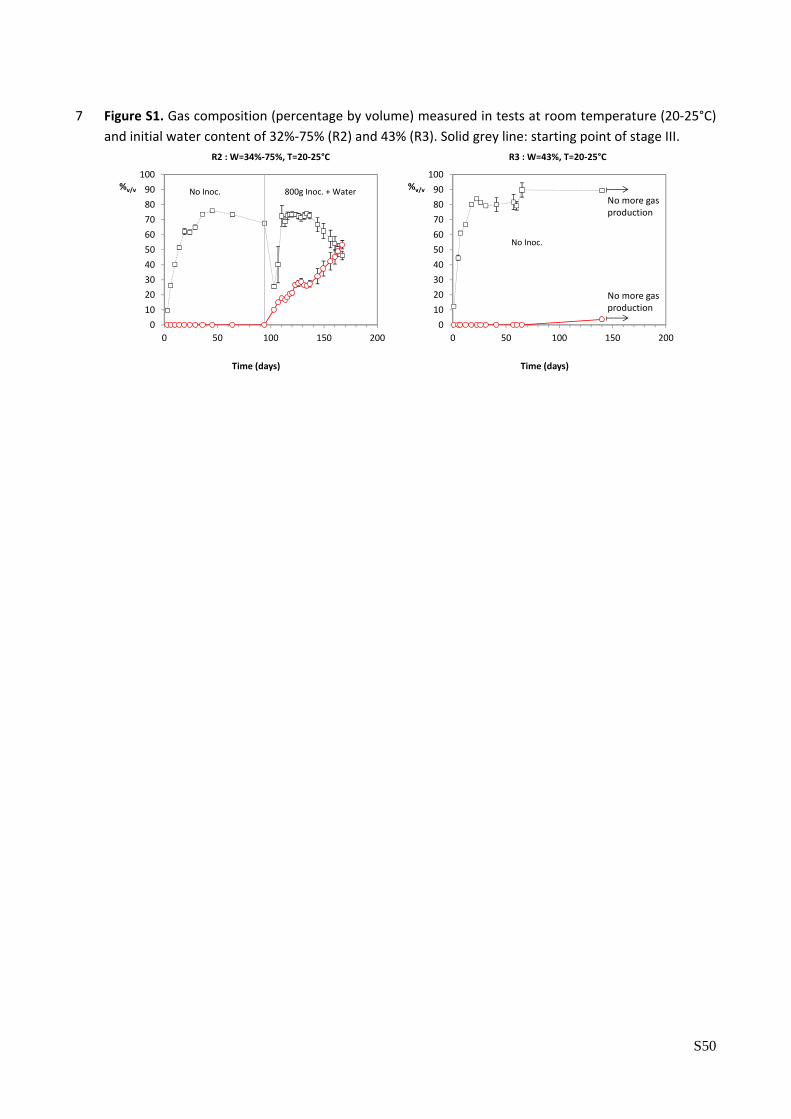
S50
7 Figure S1. Gas composition (percentage by volume) measured in tests at room temperature (20‐25°C)
and initial water content of 32%‐75% (R2) and 43% (R3). Solid grey line: starting point of stage III.
R2 : W=34%‐75%, T=20‐25°C
%v/v
0
10
20
30
40
50
60
70
80
90
100
0 50 100 150 200
Time (days)
No Inoc. 800g Inoc. + Water
0
10
20
30
40
50
60
70
80
90
100
0 50 100 150 200
Time (days)
%v/v
No Inoc.
R3 : W=43%, T=20‐25°C
No more gas production
No more gas production

51
8 Figure S2. Gas composition (percentage by volume) measured in tests at 37°C and initial water content 1
of 32%‐75% (T2A), 32% (T2B), 38%‐75% (T3A/B), 43% (T4A) and 43%‐48% (T4B). Dotted grey line: 2
starting point of stage II. Solid grey line: starting point of stage III. 3
4 5 6
7
0
10
20
30
40
50
60
70
80
90
100
0 50 100 150
T2B : W=32%, T=37°C
No Inoc. 20g Inoc.%v/v
No more gas production
No more gas production
%CO2
%CH4
Time (days)
0
10
20
30
40
50
60
70
80
90
100
0 50 100 150
T2A : W=32%‐75%, T=37°C
%v/v No Inoc. 20g Inoc.
70g Inoc. + Water
Time (days)
0
10
20
30
40
50
60
70
80
90
100
0 50 100 150
T3B : W=38%‐75%, T=37°C
No Inoc. 70g Inoc. + Water%v/v
Time (days)
0
10
20
30
40
50
60
70
80
90
100
0 50 100 150
T3A : W=38%‐75%, T=37°C
No Inoc. 70g Inoc. + Water%v/v
Time (days)
0
10
20
30
40
50
60
70
80
90
100
0 50 100 150
T4B : W=43%‐48%, T=37°C
No Inoc. 70g Inoc.%v/v
Time (days)
0
10
20
30
40
50
60
70
80
90
100
0 50 100 150
T4A : W=43%, T=37°C
No more gas production
No more gas production
%v/v
Time (days)
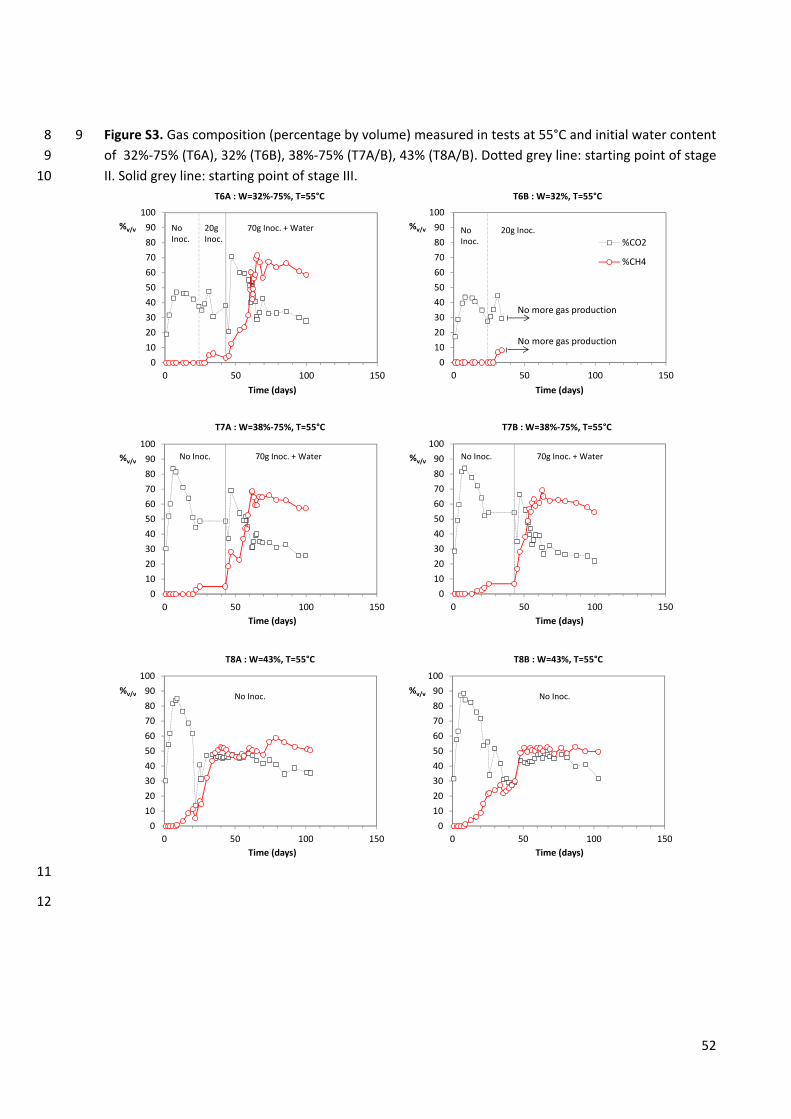
52
9 Figure S3. Gas composition (percentage by volume) measured in tests at 55°C and initial water content 8
of 32%‐75% (T6A), 32% (T6B), 38%‐75% (T7A/B), 43% (T8A/B). Dotted grey line: starting point of stage 9
II. Solid grey line: starting point of stage III. 10
11
12
0
10
20
30
40
50
60
70
80
90
100
0 50 100 150
T7B : W=38%‐75%, T=55°C
No Inoc. 70g Inoc. + Water%v/v
Time (days)
0
10
20
30
40
50
60
70
80
90
100
0 50 100 150
T7A : W=38%‐75%, T=55°C
No Inoc. 70g Inoc. + Water%v/v
Time (days)
0
10
20
30
40
50
60
70
80
90
100
0 50 100 150
T6B : W=32%, T=55°C
No Inoc.
20g Inoc.%v/v
No more gas production
No more gas production
%CO2
%CH4
Time (days)
0
10
20
30
40
50
60
70
80
90
100
0 50 100 150
T6A : W=32%‐75%, T=55°C
%v/v No Inoc.
20g Inoc.
70g Inoc. + Water
Time (days)
0
10
20
30
40
50
60
70
80
90
100
0 50 100 150
T8B : W=43%, T=55°C
No Inoc.%v/v
Time (days)
0
10
20
30
40
50
60
70
80
90
100
0 50 100 150
T8A : W=43%, T=55°C
No Inoc.%v/v
Time (days)