assessment of a diagnostic procedure for the monitoring and control of industrial processes
TRANSCRIPT

Available online at www.sciencedirect.com
Energy Procedia 00 (2015) 000–000
www.elsevier.com/locate/procedia
The 7th International Conference on Applied Energy – ICAE2015
Assessment of a diagnostic procedure for the monitoring and control of industrial processes
Alessandro Corsinia,c, Luciano De Proprisa, Sara Feudob*, Manuel Stefanatoc a Dipartimento di Meccanica e Aeronautica, Sapienza Università di Roma, Via Eudossiana 18, I00184 Roma, Italy.
b Facoltà di Ingegneria Civile e Industriale, Sapienza Università di Roma, sede di Latina,, Via Andrea Doria 3, I04100, Latina, Italy c SED srl, Soluzioni per l'Energia e la Diagnostica Via ASI Consortile 7, 03013 Ferentino (FR)Italia
Abstract
The definition of "energy efficiency" entails programming, planning and implementation of operational tools and strategies leading to the reduction of energy demand for the same offered services. Among the typical industrial energy uses, the production of compressed air represents certainly an important segment of potential saving. The present work studies the monitoring of the compressed air used for blow moulding of a packaging solution company. The study addresses the monitoring of compressed air line in term of operational and energy variables. The available measured data are used to evaluate the energy performance evolution during a year time. The work tackles the problem with two different approaches based on univariate and multivariate methods. The first method aims at finding a key performance index and a new univariate control chart related to energy/operational parameters to better monitor the performance of the compressed air plant. Besides, the multivariate analysis of the production process is applied in order to analyse the energy efficiency by also considering the multiple variables influencing the whole process itself. Final purposes are identify a new methodology for the production process analysis and evaluate flaws and strengths of these models. © 2015 The Authors. Published by Elsevier Ltd. Selection and/or peer-review under responsibility of ICAE Keywords: Energy Efficiency, EnPI, Cusum Chart, EnMS, ISO50001.
1. Introduction
The current rise of fossil energy price, along with an increased awareness of the environmental issues and the current energy policies demonstrate that taking into account energy efficiency in any activity has become an imperative, not just an alternative. Energy efficiency (EE) policies entaila series of actions of programming, planning and implementation of operational tools and strategies that allow to consume the least amount of primary energy [1,2]. A special emphasis in the 2012/27/EU Directive is placed on the role of energy audits and Energy Management Systems (SME), with the obligation for high-energy consumption companies to be audited, encouraging SMEs implementation.
Among the different industrial energy uses, the Compressed Air (CA) production is certainly an important segment due to its widespread use and its potential of saving [3,4], in spite of considerable operational costs [3]. The air operating pressure for state-of-the-art industrial end uses is 6-7 bar, although
* Corresponding author. Tel.:+39-0773-476521 E-mail address:[email protected]

2 A. Corsini et al./ Energy Procedia 00 (2015) 000–000
higher or lower pressure can occur according to the demand profile. The share of electricity demand for the production of CA is about 10% of the total energy consumption in a typical industrial plant. $0% of this energy share could be attributed to losses [5,6]. Although a lot of studies have been carried on EE technologies, still little is known about the functional and operational aspects [7-9]. The correct interpretation of a process, necessarily invokes the definition of an Energy Performance Index (EnPI) to help performance monitoring in energy management systems [10]. Several studies demonstrate the EnPI pertinence to any kind of energy use [7, 11]. Focusing on CA, the typical and the simplest index measured to verify the performance of the system is the SER (Service Energy Rate) or SEC (Specific Energy Consumption), expressed as kWh/m3 of supplied air. The state of the art EnPI derivation [8] is coupled to Simple Regression Model (SRM) to promote reliable functional indices [9].
The objective of the present work is to apply the use of monitoring data analysis, customary of industrial product quality control, manufacturing process control and fault detection, to the energy analysis. In this regard, two methodologies are applied advocating univariate and multivariate analysis in control chart deviation. Open literature illustrates several methodologies to build control charts. Typically Shewhart, EWMA, CUSUM techniques are used in the construction of univariate and multivariate charts [12-15].
Concerning the univariate analysis, instead of SER, a functional key performance index (KPI) was proposed to correlate the production process metrics, and deduct information hidden in the variables accounting for energy fluxes. The analysis of the time variation of the index was carried out first using the univariate control chart (CUSUM chart) [12,13]. Concerning the multivariate approach (generally used in industrial control systems) it was applied to the data set, evaluating mutual interaction of the process variables with the aim to extract information about the energy consumption. Specifically, we have defined the ensuing control chart, based on principal component analysis (PCA): T2 chart, residual chart and bi-plot of PCA scores and loadings [16]. Notably, the analysis focused on the energy/operational audit of a real industrial plant, data are collected from state of the art process oriented monitoring system.
In the following sections the case study is described. The models applied in the energy efficiency analysis are discussed. Then, the results obtained through the use of the univariate and the multivariate methodologies are shown, drawing attention to their flaws and strengths.
2. Methodology
2.1 CUSUM Control chart In contrast to SEC or SER definitions, the proposed key performance index (KPI) links a dependent
variable e.g. air volume, with an independent one from the productive process. Notably, it was decided to use the supplied air volume per unit of mass of raw material (HDPE). This index (m3/kg HDPE) has been selected because variables have the greatest correlation between them. The analyses were carried out on a daily basis.
The KPI monitoring analysis was performed by creating a CUSUM chart with the variation of its standard deviation [12, 14]. The CUSUM chart is a so-called card "with memory", also known as "exact design card". Data time history is interrogated to define a target value. This value serves to verify the process is "in control", and in the absence of external inefficiencies should be constant [12, 14]. As soon as the standard deviation σ is calculated, by comparing actual m3/kg HDPE to the target value, two control limits are determined equal to ±4σ (namely upper UCL and lower control limit LCL). In order to be considered "in control", the process must remain within the range identified by the UCL and LCL. The construction of the control chart implies the definition of an auxiliary constant k equal to half of the standard deviation. Finally, two cards were built as:
C+ card = max (0; m3/kg HDPE index – ( Target value + k ) + C+n-1 (1)
C- card = min (0; m3/kg HDPE index – ( Target value - k ) + C-n-1 (2)
The process is in "negative drift" when the C+ chart shows an increasing trend that can also get out of upper control limit, a "positive drift" when the chart C- stands at values lower than the expected target.
2.2 Principal component based control charts Principal Component Analysis (PCA) is a multivariate analysis technique first proposed for data
compression and classification [16]. The goal is to reduce the dimension of a data set by finding a new set
A. Corsini et al./ Energy Procedia 00 (2015) 000–0003
of variables, smaller than the original one, highlighting the information contained in the data. Information is meant as the variation present in the sample, given by the correlations between the original variables. The extracted variables, called Principal Components (PCs), are linear combinations of the original variables in which the coefficients of the linear combination can be obtained from the eigenvectors of the covariance (or correlation) matrix of the original data. PCs are uncorrelated with each other and ordered by decreasing variance. The bi-plot of PCA scores and loadings is the method of representation that displays the data formed by transforming the original ones into the space of the PCs (scores).The loading provides a measure of the contribution of each variable to the principal components [15,16].
To further explore the multivariate approach, the T2 chart based on PCA was considered. T2 chart allows the control of a vector of means for multiple characteristics, the variance/covariance matrix of the control variables. When an "out-of-control" condition occurs, typically a follow-up chart can be created to indicate which variables are most likely responsible for the alarm. The T2 statistics gives a measure of the distance of a sample from the process mean within the plane defined by PC1 and PC2, and the squared PCA residuals give a measure of the distance of a sample perpendicular to that plane. A high T2 statistic thus indicates that a sample is exhibiting an extreme variation, but well-accounted for by the PCA model. A high residual indicates that the sample is exhibiting a variation not well-accounted for by the PCA model.
3. Case Study data The analysis was carried out at an international packaging company producing plastic bottles (HDPE,
extrusion blow moulding process) [17] at a rate of about one million bottles a day, distinguished by size, colour and type. The global CA power capacity amounts to 2000 kW.
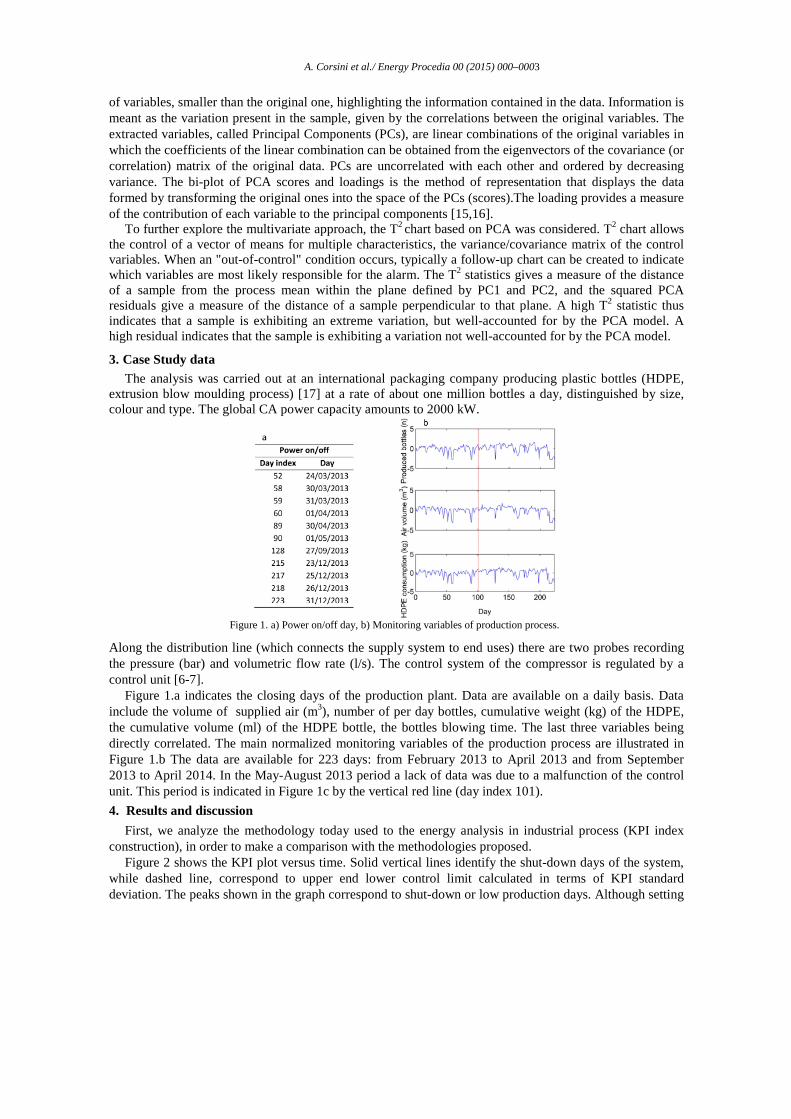
Figure 1. a) Power on/off day, b) Monitoring variables of production process.
Along the distribution line (which connects the supply system to end uses) there are two probes recording the pressure (bar) and volumetric flow rate (l/s). The control system of the compressor is regulated by a control unit [6-7].
Figure 1.a indicates the closing days of the production plant. Data are available on a daily basis. Data include the volume of supplied air (m3), number of per day bottles, cumulative weight (kg) of the HDPE, the cumulative volume (ml) of the HDPE bottle, the bottles blowing time. The last three variables being directly correlated. The main normalized monitoring variables of the production process are illustrated in Figure 1.b The data are available for 223 days: from February 2013 to April 2013 and from September 2013 to April 2014. In the May-August 2013 period a lack of data was due to a malfunction of the control unit. This period is indicated in Figure 1c by the vertical red line (day index 101).
4. Results and discussion
First, we analyze the methodology today used to the energy analysis in industrial process (KPI index construction), in order to make a comparison with the methodologies proposed.
Figure 2 shows the KPI plot versus time. Solid vertical lines identify the shut-down days of the system, while dashed line, correspond to upper end lower control limit calculated in terms of KPI standard deviation. The peaks shown in the graph correspond to shut-down or low production days. Although setting

4 A. Corsini et al./ Energy Procedia 00 (2015) 000–000
an appropriate index admissibility range is possible to identify the days with high or low efficiency. This approach is limited by the definition of our KPI depends upon a two variable correlation.
Figure 2. EnPI index on time
The next step is the comparison with a univariate cumulative control chart based on the KPI under scrutiny. In figure 3 shows the CUSUM Chart computed using the method of the standard deviation explained in the previous paragraph. This second control chart provides more detailed information about the energy performance of the system. In this case there the indication of a trend for the use of energy and as such it is not able to display the individual piece of information. However, it is evident by vertical lines that the days identified (by vertical lines) have a strong influence on the progress of the curve.
Figure 3. CUSUM chart with standard deviations (between the index m3/kg HDPE value and the m3/kg HDPE target value)
The performance of the CUSUM chart based on deviation is shown in Figure 3, together with the limit values. The process is in "negative drift" (solid graph) when the C+ paper shows an increasing trend that can also get out of control limits, a "positive drift" (dotted graph) when the paper C- stands at values lower than the expected target. One of the limits of this type of technique is its inertia, i.e. the inability to detect punctual events under rapid modification of the operating regimes. As shown in the plot, in shut down days, the solid drift curve grows rapidly and slowly returns to regular operation days. Similarly the dotted curve, during high energy efficiency days, decrease and then grow again slowly. This weaken the "readability of the chart" on a daily time step, demanding for remedial approaches such as the application of opportune filters to isolate outliers tied to specific operating conditions of the system.
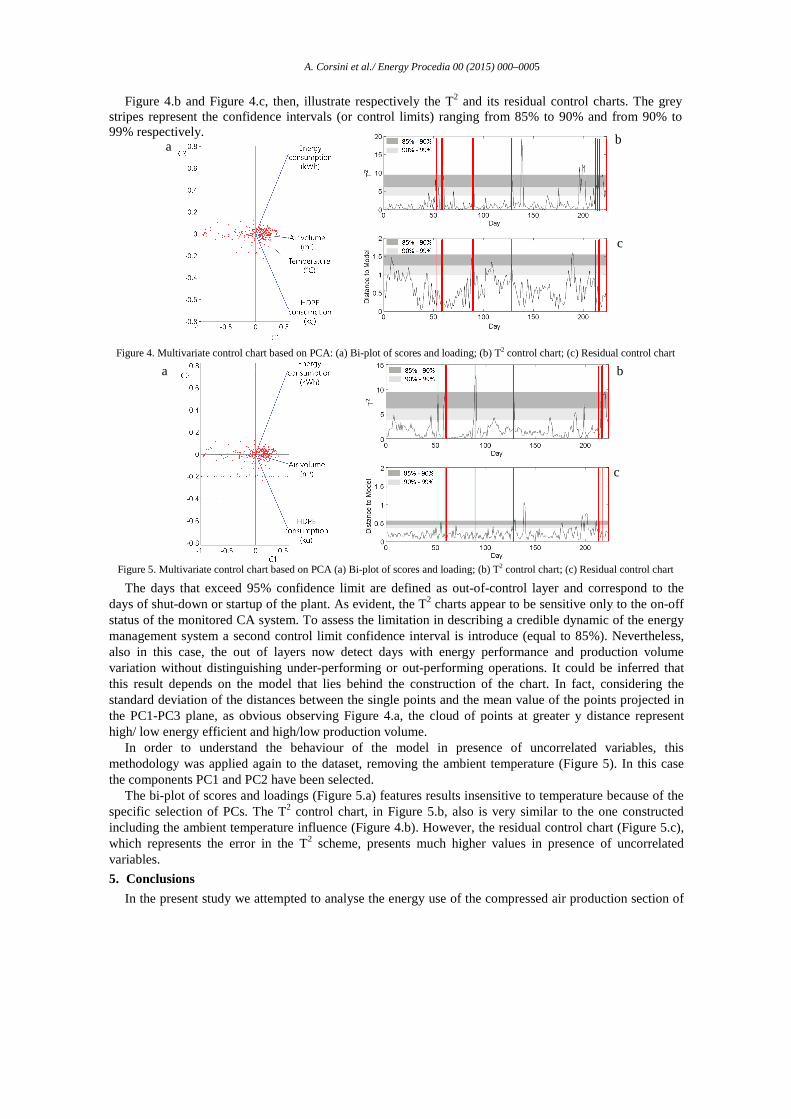
A last multivariate monitoring technique, customary of quality control, was applied to the CA energy management. This technique includes the construction of three different control charts based on PCA: i. the bi-plot of scores and loadings, ii. T2 control chart, and iii. its residual control chart. Daily data available from the monitoring of compressed air flow (m3/d), mass of HDPE (kg/d), energy consumption (kWh/d) and temperature (°C) were analysed. The selected PCs were the first and the third (PC1, PC3) because mostly correlated to the CA energy demand. Results are shown in Figure 4.
Figure 4.a represents the bi-plot of scores an loadings. This representation is able to show the relationships between the analysed variables and to identify which monitoring variable is responsible for deviation of the data from the optimum energetic behaviour of the system. As such linking back to the cause of the malfunction. In Figure 4.a, the points lying in the x-range (-0.5 - 0) are the days of low production and those in the x-range (0 – 0.5) correspond to the days of high production. Moreover, the positive y region of the graph is populated by the events with low energy efficiency, in fact they show high power consumption and reduced use of HDPE. Finally, the lower part the chart is populated by event representing days with high energy efficiency. The group of points located far left, near (-1,0), correspond to the shut-down days of the system.
A. Corsini et al./ Energy Procedia 00 (2015) 000–0005
Figure 4.b and Figure 4.c, then, illustrate respectively the T2 and its residual control charts. The grey stripes represent the confidence intervals (or control limits) ranging from 85% to 90% and from 90% to 99% respectively.
Figure 4. Multivariate control chart based on PCA: (a) Bi-plot of scores and loading; (b) T2 control chart; (c) Residual control chart
Figure 5. Multivariate control chart based on PCA (a) Bi-plot of scores and loading; (b) T2 control chart; (c) Residual control chart
The days that exceed 95% confidence limit are defined as out-of-control layer and correspond to the days of shut-down or startup of the plant. As evident, the T2 charts appear to be sensitive only to the on-off status of the monitored CA system. To assess the limitation in describing a credible dynamic of the energy management system a second control limit confidence interval is introduce (equal to 85%). Nevertheless, also in this case, the out of layers now detect days with energy performance and production volume variation without distinguishing under-performing or out-performing operations. It could be inferred that this result depends on the model that lies behind the construction of the chart. In fact, considering the standard deviation of the distances between the single points and the mean value of the points projected in the PC1-PC3 plane, as obvious observing Figure 4.a, the cloud of points at greater y distance represent high/ low energy efficient and high/low production volume.
In order to understand the behaviour of the model in presence of uncorrelated variables, this methodology was applied again to the dataset, removing the ambient temperature (Figure 5). In this case the components PC1 and PC2 have been selected.
The bi-plot of scores and loadings (Figure 5.a) features results insensitive to temperature because of the specific selection of PCs. The T2 control chart, in Figure 5.b, also is very similar to the one constructed including the ambient temperature influence (Figure 4.b). However, the residual control chart (Figure 5.c), which represents the error in the T2 scheme, presents much higher values in presence of uncorrelated variables.
5. Conclusions
In the present study we attempted to analyse the energy use of the compressed air production section of
a b
c
a b
c

6 A. Corsini et al./ Energy Procedia 00 (2015) 000–000
an industrial plant using three different methods in order to identify their critical issues and strengths. The novelty of the work lies in the application of methods that are usually used in the industrial filed, but not in the energetic field. First was found and calculated an ENPI, this index was used to build a usual CUSUM control chart, based on the difference between the actual data and that provided by a linear regression. Hence, a new CUSUM control chart (univariate) based on the standard deviation compared with the mean value was built. Finally multivariate models were applied creating: a T2 control chart, a residual control chart and a biplot of loadings and scores.
The findings indicate that the available sampling frequency of the data (daily) is too large for a proper analysis of the energy system. The limit of the univariate control charts consists in the possibility of analysing only one or a few monitoring variables at a time, thwarting the capture of all the process aspects influencing the energy field. Also being cumulated cards, describe the system variation and not daily data thus is unable to return quickly to the starting value.
The multivariate methods turn out to be the best response to the energetic analysis, however, the use of PCA also shows different limitations in the analysis. The T2 control chart is not able to distinguish between data that indicate high and low energy efficiency. Nevertheless, the bi-plot of loadings and scores highlights the contribution of additional information which is obtained in the system. In fact, this chart is able to detect the distribution of the data set between variables and identify any variable generating problems. However, it is necessary to adequately analyze the influence of the variables that are not energy-use-related in order to avoid analysis errors generation.
In conclusion, besides the improvements obtained in the industrial processes energy analysis field, still, none of these models appears to be completely adequate, leading to the necessity of further methodologies screening or ad hoc methodology development.
Copyright
Authors keep full copyright over papers published in Energy Procedia.
Acknowledgements
The authors are indebted with Ing. Eileen Tortora for fruitful discussion.
References
[1] Pareshkumar VA., Purnanad BV., Energy Procedia 54 ( 2014 ) 199–210.
[2] Abdelaziz E.A., Saidur R., Mekhilef S., Renewable and Sustainable Energy Reviews 15 (2011) 150–168
[3] Kaya D., Phelan P. Chau D.,Sarac HI., Int. J. Energy Res. 2002; 26:837–849 (DOI: 10.1002/er.823)
[4] Joshi A., Bansal K., Tyagi AK., Biswas S., Energy Conservation Handbook, 2013
[5] Saidur R., Rahim N.A, Hasanuzzaman M., Renewable and Sustainable Energy Reviews 14 (2010) 1135–1153
[6] Mousavi S., Kara S., Kornfeld B., Procedia CIRP 15 ( 2014 ) 313 – 318.
[7] Dongellini M., Marinosci C., Morini G.L, Energy Procedia 45 ( 2014 ) 424 – 433
[8] Dindorf R., Procedia Engineering 39 ( 2012 ) 204 – 211
[9] Vesma V., Energy Performance Indicators a robust methodology, 2012
[10] ISO 50001:2011(E): Energy Management System
[11] Bureau of Energy Efficiency (BEE), Agency of the Government of India, Energy managers auditors, guide books Ch3, 2011
[12]. Haridy S., Wu Z., Industrial Engineering and Management, 2009 – 2(3): 464-498
[13] Page ES., Technometrics, Vol. 5, No. 3 (Aug., 1963), pp. 307-315
[14] Roberts SW., Technometrics Vol. 8, No. 3 (Aug., 1966), pp. 411-430
[15]. Yeh1 AB, Lin DK.J., McGrath R.N., Quality Technology & Quantitative Management, Vol. 3, No. 4, pp. 415-436, 2006
[16] K.Esbensen, P. Geladi, Principal Component Analysis, Umei University
[17] Society of manufacturing engineers, Tool and Manufactoring Engineers Handbook Knowledge Base Ch 7, pp 1-38, 2008.
Biography
Sara Feudo is an Environmental Engineer and PhD fellow in “Industrial production engineering”at Sapienza,
Univerity of Rome. She deals with energy efficiency and mathematical models for energy analysis of industrial
systems.

A. Corsini et al./ Energy Procedia 00 (2015) 000–0007
ADDITIONAL INFORMATION FOR ADMINSTRATION USE BY THE ORGANIZATION COMMITTEE
(* ICAE2015 organization committee reserves the right to decide the paper type in the final program)
PLEASE SELECT (CLICK) ONE OF THE FOLLOWING OPTIONS: I PREFER TO PRESENTING MY PAPER AS X ORAL � POSTER ALL PAPERS PRESENTED AT ICAE2015 WILL BE PUBLISHED IN ENERGY PROCEDIA, IF YOU DO NOT WANT TO INCLUDE YOUR PAPER IN THE ENERGY PROCEDIA, PLEASE CLICK � NO, I DO NOT WANT TO INCLUDE MY PAPER IN THE ENERGY PROCEDIA.