assessingerrorsinherentinoct-derivedmacular … · assessingerrorsinherentinoct-derivedmacular ......
TRANSCRIPT

Hindawi Publishing CorporationJournal of OphthalmologyVolume 2011, Article ID 692574, 9 pagesdoi:10.1155/2011/692574
Research Article
Assessing Errors Inherent in OCT-Derived MacularThickness Maps
Daniel Odell,1 Adam M. Dubis,2 Jackson F. Lever,3
Kimberly E. Stepien,1 and Joseph Carroll1, 2, 4
1 Department of Ophthalmology, Medical College of Wisconsin, Milwaukee, WI 53226, USA2 Department of Cell Biology, Neurobiology, & Anatomy, Medical College of Wisconsin, Milwaukee, WI 53226, USA3 Department of Ophthalmology, William Beaumont Hospital, Royal Oak, MI 48073, USA4 Department of Biophysics, Medical College of Wisconsin, Milwaukee, WI 53226, USA
Correspondence should be addressed to Joseph Carroll, [email protected]
Received 27 January 2011; Accepted 24 June 2011
Academic Editor: Eduardo Buchele Rodrigues
Copyright © 2011 Daniel Odell et al. This is an open access article distributed under the Creative Commons Attribution License,which permits unrestricted use, distribution, and reproduction in any medium, provided the original work is properly cited.
SD-OCT has become an essential tool for evaluating macular pathology; however several aspects of data collection and analysisaffect the accuracy of retinal thickness measurements. Here we evaluated sampling density, scan centering, and axial lengthcompensation as factors affecting the accuracy of macular thickness maps. Forty-three patients with various retinal pathologiesand 113 normal subjects were imaged using Cirrus HD-OCT. Reduced B-scan density was associated with increased interpolationerror in ETDRS macular thickness plots. Correcting for individual differences in axial length revealed modest errors in retinalthickness maps, while more pronounced errors were observed when the ETDRS plot was not positioned at the center of the fovea(which can occur as a result of errant fixation). Cumulative error can exceed hundreds of microns, even under “ideal observer”conditions. This preventable error is particularly relevant when attempting to compare macular thickness maps to normativedatabases or measuring the area or volume of retinal features.
1. Introduction
Optical coherence tomography (OCT) provides high-resolution, cross-sectional tomographic images of thehuman retina and permits direct evaluation of retinalthickness [1]. In recent years the development of spectral-domain OCT (SD-OCT) technology has greatly increasedimaging speed and resolution relative to earlier time-domaintechnology. SD-OCT has become invaluable in the manage-ment of a variety of retinal diseases including neovascularage-related macular degeneration (AMD) [2–5] and diabeticmacular edema [6, 7]. This utility is due primarily to theability to extract estimates of retinal thickness across themacula (to aid in clinical diagnosis and treatment decisions).
Previous studies on the application of SD-OCT to retinalpathology have uncovered multiple sources of error thatdramatically decrease the accuracy of these macular thicknessmeasurements [8, 9]. Perhaps the most obvious source oferror is imprecise retinal layer segmentation, which can
result from poor signal quality of the SD-OCT image orthe outright failure in the segmentation algorithm itselfin otherwise high-quality images [8, 10, 11]. Additionalerrors inherent to the system can be elucidated by evaluatingthe reproducibility of SD-OCT systems [9, 12–17]. Thesereproducibility studies capture all errors inherent to the basicoperation of the SD-OCT system and represent a baselinelevel of error that could reasonably be expected even underthe best circumstances.
However, there are additional sources of inaccuracythat have received considerably less attention and are inde-pendent of segmentation and operator errors. Rather theypertain to instrument sampling and processing protocols.For example, Sadda et al. compared central subfield thicknessvalues from volumes containing 128 B-scans to less denselysampled volumes [18]. As B-scan density is reduced, lessretinal area is sampled, leading to less data being includedin the retinal thickness calculation. The reduction in data ledto differences, or errors, in retinal thickness measurements,

2 Journal of Ophthalmology
the magnitude of which increased as sampling density wasdecreased [18]. Here, we further examined B-scan densityas well as factors that are related to assumptions about thepatient being imaged, such as errant fixation and variation inaxial length among patients. Taken together, these variablescompromise the accuracy of macular thickness maps. Whilethe degree of inaccuracy depends on the patient, thesignificance of the inaccuracy depends on the application ofthe retinal thickness data.
2. Materials and Methods
2.1. Subjects. One hundred thirteen normal subjects (55male, 58 female) age 18 years and older were recruited forSD-OCT imaging (mean ± standard deviation = 27.3 ± 8.3years). Normal subjects had normal color vision assessedwith the Neitz Test of Color Vision [19] and no history ofrefractive surgery or any vision-limiting ocular pathology.Forty-three patients (18 male, 25 female) with various retinalpathologies were also recruited (mean ± standard deviation= 40.7 ± 20.1 years). Pathology included macular dystrophy(n = 9), blue cone monochromacy (n = 3), X-linked highmyopia (n = 4), basal laminar drusen (n = 5), retinitispigmentosa (n = 2), AMD (n = 3), plaquenil toxicity (n =3), diabetic macular edema (n = 3), macular telangectasia(n = 2), central artery occlusion (n = 2), and one eachof oligocone trichromacy, posterior epithelial detachment,oculocutaneous albinism, punctate inner choroidopathy,achromatopsia, cystoid macular edema, and acute zonaloccult outer retinopathy. Informed consent was obtainedfrom all subjects after explanation of the nature and possibleconsequences of the study. All research on human subjectsfollowed the tenets of the Declaration of Helsinki and wasapproved by the Institutional Review Board at Children’sHospital of Wisconsin.
2.2. SD-OCT Retinal Imaging. Volumetric SD-OCT imagesof the macula were obtained using the Cirrus HD-OCT (CarlZeiss Meditec, Dublin, Calif, USA). Volumes were nominally6 mm × 6 mm and consisted of 128 B-scans (512 A-scans/B-scan). The internal fixation target of the system was used,which consists of a large green asterisk on a red background,and focus of the LSO fundus image was optimized usingbuilt-in focus correction. In addition, the polarization settingwas optimized using the built-in function for each eye.Retinal thickness was calculated using the built-in MacularAnalysis software on the Cirrus (software version 5.0), whichis automatically determined by taking the difference betweenthe ILM and RPE boundaries [20]. The positions of the fovealcenter and retinal thickness data from each volume scan wereexported for offline analysis using the Zeiss Cirrus ResearchBrowser (version 5.0). All volumes were manually examinedfor accuracy of the ILM and RPE segmentation and relativeaccuracy of the Autofovea function.
2.3. Manipulation of Macular Thickness Maps. In order toevaluate the acquisition and analysis parameters of interest,we needed to be able to manipulate these macular thickness
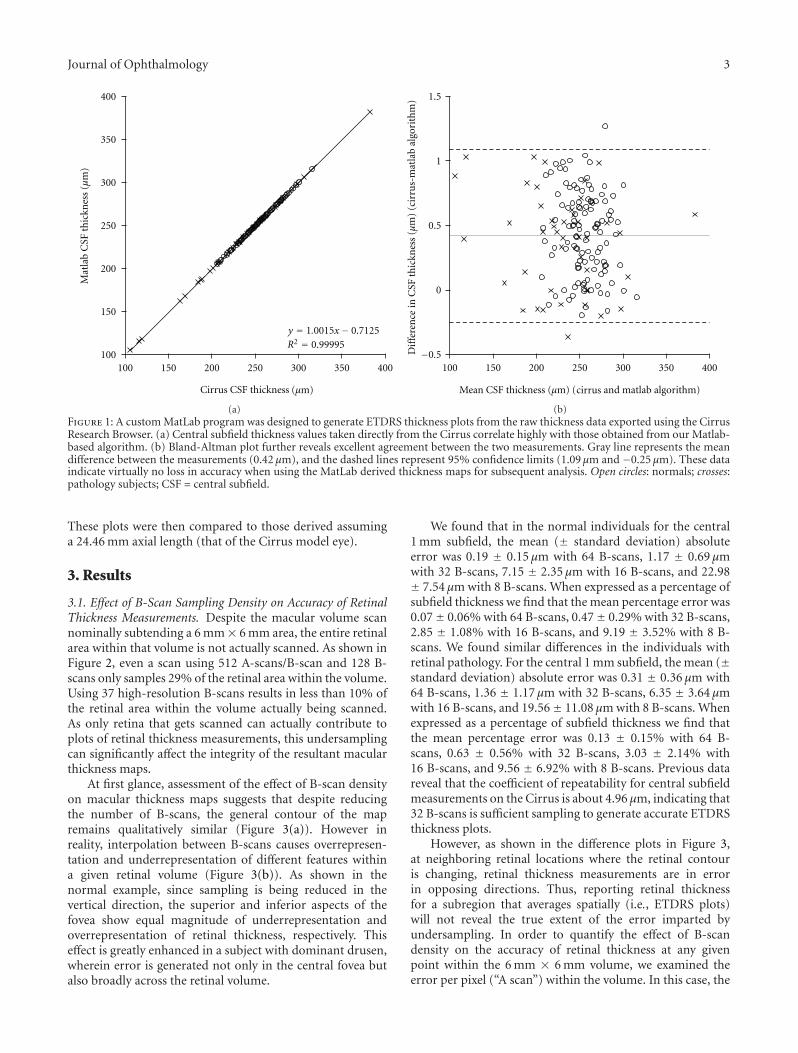
maps off line. Custom Matlab (Mathworks, Natick, Mass,USA) software was used to generate early treatment diabeticretinopathy study (ETDRS) thickness maps from the .datfiles exported from the Zeiss Cirrus Research Browser. Asshown in Figure 1, there is good agreement between ETDRSsegment thicknesses derived from the on-board Cirrus soft-ware and our offline Matlab program, thus demonstratingthe fidelity of the data export and validating our use of theseMatlab-derived ETDRS maps for subsequent analysis.
To assess the interpolation error in volumetric retinalthickness maps due to decreased B-scan sampling, we createdundersampled versions of the retinal thickness volumesexported from the Cirrus system. These maps used thicknessvalues from 8 (every 16th B-scan), 16 (every 8th B-scan), 32(every 4th B-scan), or 64 (every other B-scan) of the 128B-scans initially collected. Complete thickness maps werethen created by interpolating between these evenly spacedB-scans (using a Matlab spline interpolation function).This enabled point-by-point comparison between the nativemacular thickness map and the undersampled ones, as well ascomparison between the corresponding ETDRS plots. In allETDRS comparisons, mean differences were computed usingabsolute differences.
Most SD-OCT systems assume foveal fixation; howeverthere is frequently significant discrepancy between thelocation of the fovea and the preferred retinal locus offixation. Even among individuals with no retinal pathology,there is modest variation in fixation and there is evidencethat suggests that the foveal center is not always used forfixation [21–24]. We used the Autofovea function of theCirrus HD-OCT to identify the location of the foveal pitand generated an ETDRS plot centered at this location and asecond plot centered at the middle of the volume (the defaultsetting on most other SD-OCT systems). Manual inspectionof each volume confirmed that the fovea was identified bythe Autofovea function (though in more severe macularpathology we have seen the algorithm fail). Comparing thesetwo ETDRS plots provides an estimate of the potentialerror due to improper anchoring of the plot to the scancenter. Moreover, as we had access to the (x, y) coordinateof the fovea within each nominal 6 mm × 6 mm volume,we examined error as a function of the displacement of eachsubject’s fixation from the center of his or her foveal pit.
The scan length reported by SD-OCT systems (whenreported in mm) is relative, not absolute. This is becausethe scanning mirrors are calibrated to a model eye, whichassumes a fixed axial length (typically around 24 mm).However there exist significant individual differences inretinal magnification (primarily caused by differences inaxial length); thus the actual scan length will vary fromperson to person. In fact, using normative axial length data[25] to correct for ocular magnification [26], we estimatethat approximately one-third of individuals would havea scan length that deviates by more than 0.3 mm fromthe expected length (with a maximum deviation of nearly1 mm). We obtained axial length measurements using theZeiss IOL Master (Carl Zeiss Meditec, Dublin, Calif, USA)and subsequently calibrated the lateral scale of each subject’sSD-OCT scans in order to generate revised ETDRS plots.
Journal of Ophthalmology 3
y = 1.001 x−
100
150
200
250
300
350
400
100 150 200 250 300 350 400
Mat
lab
CSF
thic
knes
s(µ
m)
R2 =
(µm)Cirrus CSF thickness
0.999950.71255
(a)
−0.5
0
0.5
1
1.5
100 150 200 250 300 350 400
inC
SFth
ickn
ess
(µm
)(c
irru
s-m
atla
bal
gori
thm
)D
iffe
ren
ce
cirrusMean CSF thickness (µm) ( and matlab algorithm)
(b)Figure 1: A custom MatLab program was designed to generate ETDRS thickness plots from the raw thickness data exported using the CirrusResearch Browser. (a) Central subfield thickness values taken directly from the Cirrus correlate highly with those obtained from our Matlab-based algorithm. (b) Bland-Altman plot further reveals excellent agreement between the two measurements. Gray line represents the meandifference between the measurements (0.42 µm), and the dashed lines represent 95% confidence limits (1.09 µm and −0.25 µm). These dataindicate virtually no loss in accuracy when using the MatLab derived thickness maps for subsequent analysis. Open circles: normals; crosses:pathology subjects; CSF = central subfield.
These plots were then compared to those derived assuminga 24.46 mm axial length (that of the Cirrus model eye).
3. Results
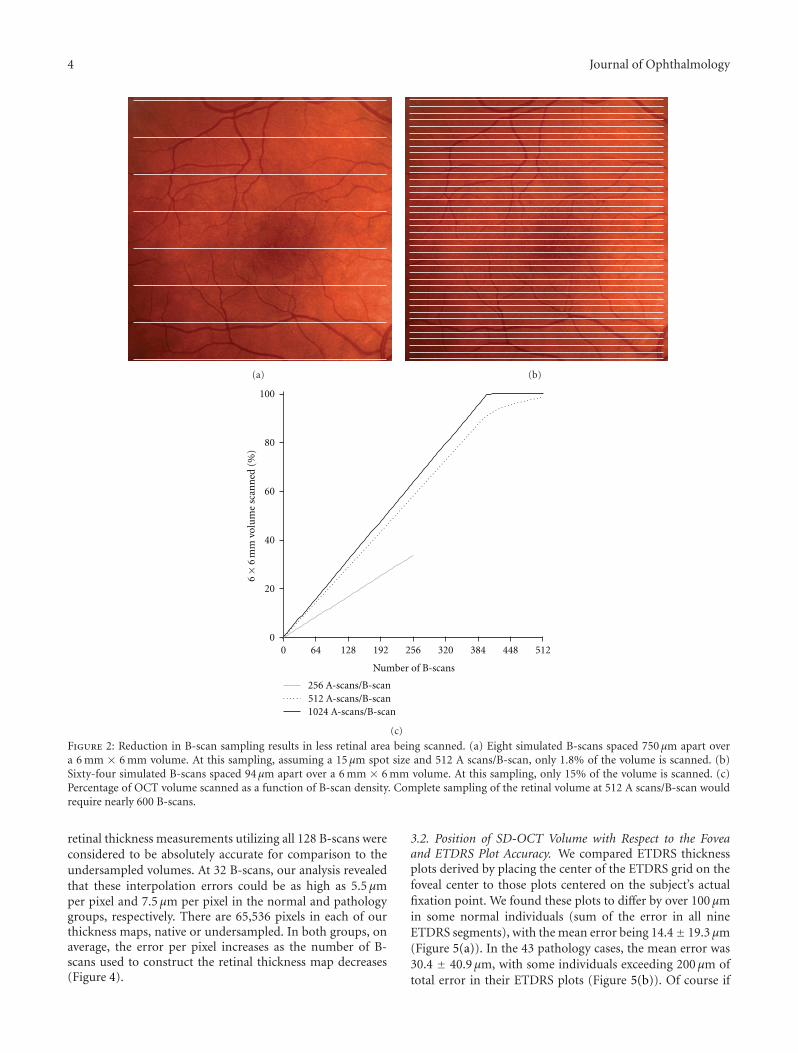
3.1. Effect of B-Scan Sampling Density on Accuracy of RetinalThickness Measurements. Despite the macular volume scannominally subtending a 6 mm× 6 mm area, the entire retinalarea within that volume is not actually scanned. As shown inFigure 2, even a scan using 512 A-scans/B-scan and 128 B-scans only samples 29% of the retinal area within the volume.Using 37 high-resolution B-scans results in less than 10% ofthe retinal area within the volume actually being scanned.As only retina that gets scanned can actually contribute toplots of retinal thickness measurements, this undersamplingcan significantly affect the integrity of the resultant macularthickness maps.
At first glance, assessment of the effect of B-scan densityon macular thickness maps suggests that despite reducingthe number of B-scans, the general contour of the mapremains qualitatively similar (Figure 3(a)). However inreality, interpolation between B-scans causes overrepresen-tation and underrepresentation of different features withina given retinal volume (Figure 3(b)). As shown in thenormal example, since sampling is being reduced in thevertical direction, the superior and inferior aspects of thefovea show equal magnitude of underrepresentation andoverrepresentation of retinal thickness, respectively. Thiseffect is greatly enhanced in a subject with dominant drusen,wherein error is generated not only in the central fovea butalso broadly across the retinal volume.
We found that in the normal individuals for the central1 mm subfield, the mean (± standard deviation) absoluteerror was 0.19 ± 0.15 µm with 64 B-scans, 1.17 ± 0.69 µmwith 32 B-scans, 7.15 ± 2.35 µm with 16 B-scans, and 22.98± 7.54 µm with 8 B-scans. When expressed as a percentage ofsubfield thickness we find that the mean percentage error was0.07± 0.06% with 64 B-scans, 0.47± 0.29% with 32 B-scans,2.85 ± 1.08% with 16 B-scans, and 9.19 ± 3.52% with 8 B-scans. We found similar differences in the individuals withretinal pathology. For the central 1 mm subfield, the mean (±standard deviation) absolute error was 0.31 ± 0.36 µm with64 B-scans, 1.36 ± 1.17 µm with 32 B-scans, 6.35 ± 3.64 µmwith 16 B-scans, and 19.56± 11.08 µm with 8 B-scans. Whenexpressed as a percentage of subfield thickness we find thatthe mean percentage error was 0.13 ± 0.15% with 64 B-scans, 0.63 ± 0.56% with 32 B-scans, 3.03 ± 2.14% with16 B-scans, and 9.56 ± 6.92% with 8 B-scans. Previous datareveal that the coefficient of repeatability for central subfieldmeasurements on the Cirrus is about 4.96 µm, indicating that32 B-scans is sufficient sampling to generate accurate ETDRSthickness plots.
However, as shown in the difference plots in Figure 3,at neighboring retinal locations where the retinal contouris changing, retinal thickness measurements are in errorin opposing directions. Thus, reporting retinal thicknessfor a subregion that averages spatially (i.e., ETDRS plots)will not reveal the true extent of the error imparted byundersampling. In order to quantify the effect of B-scandensity on the accuracy of retinal thickness at any givenpoint within the 6 mm × 6 mm volume, we examined theerror per pixel (“A scan”) within the volume. In this case, the
4 Journal of Ophthalmology
(a) (b)
100
0 64 128 192 256 320 384 448 512
6×
6m
mvo
lum
esc
ann
ed(%
)
80
60
40
20
0
Number of B-scans
256 A-scans/B-scan512 A-scans/B-scan1024 A-scans/B-scan
(c)
Figure 2: Reduction in B-scan sampling results in less retinal area being scanned. (a) Eight simulated B-scans spaced 750 µm apart overa 6 mm × 6 mm volume. At this sampling, assuming a 15 µm spot size and 512 A scans/B-scan, only 1.8% of the volume is scanned. (b)Sixty-four simulated B-scans spaced 94 µm apart over a 6 mm × 6 mm volume. At this sampling, only 15% of the volume is scanned. (c)Percentage of OCT volume scanned as a function of B-scan density. Complete sampling of the retinal volume at 512 A scans/B-scan wouldrequire nearly 600 B-scans.
retinal thickness measurements utilizing all 128 B-scans wereconsidered to be absolutely accurate for comparison to theundersampled volumes. At 32 B-scans, our analysis revealedthat these interpolation errors could be as high as 5.5 µmper pixel and 7.5 µm per pixel in the normal and pathologygroups, respectively. There are 65,536 pixels in each of ourthickness maps, native or undersampled. In both groups, onaverage, the error per pixel increases as the number of B-scans used to construct the retinal thickness map decreases(Figure 4).
3.2. Position of SD-OCT Volume with Respect to the Foveaand ETDRS Plot Accuracy. We compared ETDRS thicknessplots derived by placing the center of the ETDRS grid on thefoveal center to those plots centered on the subject’s actualfixation point. We found these plots to differ by over 100 µmin some normal individuals (sum of the error in all nineETDRS segments), with the mean error being 14.4± 19.3 µm(Figure 5(a)). In the 43 pathology cases, the mean error was30.4 ± 40.9 µm, with some individuals exceeding 200 µm oftotal error in their ETDRS plots (Figure 5(b)). Of course if

Journal of Ophthalmology 5
8
16
32
64
128
180 240 300 360
Retinal thickness (µm)
B scansused
Interpolated map
Normal Pathology
(a)
B scansused Normal Pathology
Difference map
80− −40 0 40 80
Thickness error (µm)
8
16
32
64
128
(b)
Figure 3: Two examples of how interpolation between B-scansresults in inaccurate macular thickness maps. (a) Undersampledthickness maps from a single normal subject and one withdominant drusen retain relatively similar qualitative appearanceto that of their respective 128 B-scan maps. (b) The thicknessdifferences between the standard of 128 scans and each sequentiallevel of B-scan density show the areas of the macula most effectedby undersampling in a normal subject and a subject with dominantdrusen. Even with 32 B-scans significant error is generated throughthe central fovea (where the contour is changing most rapidly) in anormal subject. This effect is greatly enhanced in the subject withdrusen wherein error is generated not only in the central fovea butalso broadly across the entire scanning area.
eccentric fixation is identified by the OCT operator, the scanlocation can be repositioned prior to image acquisition tohelp reduce this error. For two pathology cases, we acquiredone scan at their normal eccentric fixation location and asecond after moving the scan to be visually centered onthe fovea. At their normal fixation position, these subjectshad ETDRS plots that deviated by 74.5 µm and 101.9 µmfrom an ETDRS plot precisely positioned at the fovealcenter (using our offline MatLab program). Even after theoperator acquired a second scan intentionally centered onthe fovea to the best of their ability, ETDRS errors persistedof 16.3 µm and 17.8 µm. Regardless, for both normal subjectsand subjects with retinal pathology, the greater the distancebetween the fovea and the center of the SD-OCT volume, theless accurate the ETDRS thickness map. In just the centralsubfield thickness, not correcting for scan position results ina mean error of 3.18 ± 6.09 µm in the normal subjects (witha maximum error of 32 µm) and 10.50 ± 19.43 µm in thepatients with retinal pathology (with a maximum error of104 µm). On average, the central subfield error accounts for14% and 22% of the total ETDRS error in the normal andpathology patients, respectively.
0
2
4
6
8
10
12
14
8 16 32 64 128
Ave
rage
erro
rpe
rA
scan
(µm
)
Number of B scans
Figure 4: The impact of undersampling for retinal thicknessmeasurements. As fewer B-scans are used, the average error per pixel(A scan) increases. This value was obtained by first subtracting eachundersampled macular thickness map from the native 128 B-scanthickness map and then dividing the difference by the number ofpixels (A scans).
3.3. The Effect of Ocular Magnification on ETDRS PlotAccuracy. Axial length varied in our normal subjects from21.56 to 28.36 mm and in pathology patients from 21.87to 30.13 mm. Using each subject axial length to correctthe lateral scale of the nominal 6 mm SD-OCT scan, wedetermined that actual scan sizes range from about 5.29 to6.96 mm for our normal population and 5.36 to 7.4 mmfor our pathological population. We used these correctedscan dimensions to derive corrected ETDRS plots, where therings were actually 1 mm, 3 mm, and 6 mm in diameter. Incomparing these plots to the uncorrected ones, we found thatthe summed error for the nine ETDRS segments was as muchas 44.9 µm, with 37 out of 113 (32%) subjects having morethan 20 µm of total error. For subjects with retinal pathologythe summed error for the nine ETDRS segments was asmuch as 77.3 µm, and 13 out of 43 (30%) showed more than20 µm of total error (Figure 6). In just the central subfieldalone, the error was as much as 7.86 µm (with an average of2.56 ± 1.85 µm) for the normals and as much as 12.33 µm(with an average of 2.84 ± 2.46 µm) in the individuals withretinal pathology. In both groups, the error increased withincreasing difference in axial length from that of the modeleye (24.46 mm).
3.4. The Combined Error due to Ocular Magnification andScan Positioning. As illustrated above, not correcting foraxial length and not positioning the scan at the center ofthe fovea introduces significant error in the correspondingETDRS thickness plots. Taken together, these artifacts tendto have a cumulative negative effect on the accuracy of the

6 Journal of Ophthalmology
500
400
300
200
100
00 20 40 60 80 100 120
Sum of ETDRS retinal thickness difference (µm)
Dis
tan
cebe
twee
nfo
vea
and
cen
ter
ofsc
an(µ
m)
(a)
0
1000
800
600
400
200
0 50 100 150 200 250
Sum of ETDRS retinal thickness difference (µm)D
ista
nce
betw
een
fove
aan
dce
nte
rof
scan
(µm
)
(b)
Figure 5: Measuring the effect of scan position on accuracy of ETDRS thickness plots. For each subject, we estimated this error by comparingthe raw ETDRS thickness plot to one that has been repositioned to be centered on their fovea. In the normal individuals (a), the summederror across the nine ETDRS segments could be as much as 100 µm, while in individuals with pathology (b) the error could exceed 200 µm.For some pathology cases, nonfoveal fixation can be compensated for by moving the location of the OCT scan. For 2 individuals, we acquiredscans at their eccentric fixation location (filled triangle and diamond) and a second scan after the operator manually moved the scan to becentered on the fovea (open triangle and diamond, connected by thin gray lines). Even when using the repositioned scan, residual errorremains, though it is on the order of that observed for the other patients.
ETDRS plots. For example, in considering just the centralsubfield thickness, not correcting for axial length or scanposition results in a mean error of 4.53 ± 5.77 µm in thenormal subjects (with a maximum combined error of 33 µm)and 11.29 ± 19.18 µm in the patients with retinal pathology(with a maximum combined error of 105 µm).
4. Discussion
This study examined the effects of preventable operationaland analytic aspects of the SD-OCT on the overall accuracyof ETDRS retinal thickness plots. Scan density, position ofthe scan with respect to the foveal center, and magnitude ofsubject axial length differential all contribute to significanterror in computing retinal thickness from SD-OCT volumes.An important point to consider is the cumulative natureof the errors reported here; these parameters should allbe accounted for when developing normative databases oranalyzing specific retinal features within individual patientdata. While the errors were estimated using a single SD-OCT device (Cirrus HD-OCT), they are generic to SD-OCT imaging in general. The issue of scan positioning istypically something that can be addressed by the operator byrepositioning the ETDRS grid (either manually or using anautomatic function like Autofovea). Currently, correcting thelateral scale of OCT data/images requires offline correctionby the user.
In comparing our results to previously published data,we find similarities and differences. In an examination ofB-scan density, Sadda et al. concluded that 32 B-scansresult in only a minimal change in retinal thickness [18].Our data also show that when examining maps of retinalthickness that are based on spatially integrating individualthickness values (i.e., ETDRS), reduced B-scan sampling hasminimal impact. However, if interested in deriving absolutemeasures of retinal thickness at any given point, reductionto 32 B-scans (a value suggested to provide accurate retinalthickness maps), results in an average error of around 3 µmper pixel. While this average error is within the systemresolution on commercial SD-OCT systems, it is worthkeeping in mind that the error at any one pixel can bemuch larger, since not all pixels will contribute equally tothe total error (which is implicit in computing an averageerror). We feel this more accurately reflects the “real” costof undersampling, and this would significantly limit theability to make precise measurements of retinal features (e.g.,drusen). This highlights the importance of considering howthe SD-OCT data is going to be used when deciding howdensely to sample the retina.
It is well documented that differences in axial lengthresult in different ocular magnification of retinal imagesand thus can affect the accuracy of measurements of retinalfeatures [27]. With respect to OCT, axial length has beenshown to influence measurements of retinal nerve fiber

Journal of Ophthalmology 7
0
10
20
30
40
50
60
70
80
90
−6 −4 −2 0 2 4 6
24.46 mm-subject’s axial length
Sum
ofE
TD
RS
reti
nal
thic
knes
sdi
ffer
ence
(µm
)
Figure 6: The effect of axial length on the accuracy of ETDRSthickness plots. For each subject, we compared the raw ETDRSthickness plot assuming a 6 mm scan size to an ETDRS thicknessplot using a scan length corrected for their axial length. As thedeviation in axial length increases, the error in ETDRS thicknessplots (sum of all nine ETDRS segments) becomes greater, bothfor the normal subjects (open circles) and the pathology subjects(crosses).
layer (RNFL) thickness [28–31]. This of course is basedon the fact that RNFL measures are presumed to be takenat a fixed distance from the optic nerve; thus individualdifferences in ocular magnificent would result in the RNFLbeing measured at the wrong location. Here we demonstratethat individual differences in ocular magnification also affectthe accuracy of macular thickness maps. If the distributionof axial lengths in a normative database does not match thatof the subject population being studied, misinterpretationcan occur. Perhaps more important than retinal thicknessmaps is the fact that not correcting the nominal scan lengthfor differences in axial length will obviate making reliablemeasurements in the lateral dimension within a given OCTdataset. This could include measuring the area of geographicatrophy, the size of a macular hole, or the size of a druse.Despite this, some SD-OCT systems still output lateralscale bars on their images that are given in µm or providecalipers with which to make lateral measurements in µm,despite no correction for axial length having been made. Oneshould avoid using such scale bars to report absolute lengthmeasurements, as they are simply not accurate without firsttaking into account ocular magnification.
There have also been previous examinations of the effectof fixation on the accuracy of OCT thickness measurements.In glaucoma, it has been shown that if the circular scan is notcentered on the ONH, the RNFL thickness measurementsare inaccurate [32]. Campbell et al. [33] examined howintentionally shifting the center of macular volume OCT
scans (Stratus time-domain) affected central subfield thick-ness measurements for 10 normal subjects. They found thatscan decentration of 0.50 mm resulted in foveal thicknessmeasurements that were in error by about 45%. For ournormal subjects, the average decentration of the SD-OCTvolume with respect to the foveal center was 0.09 mm andthe average error of foveal thickness measurements was about35%. While this is roughly consistent with the finding ofCampbell et al. [33], some discrepancy would be expectedgiven our use of SD-OCT (instead of time domain) andour ability to precisely determine the exact misalignmentbetween the two scans being compared (whereas the previousstudy would have be confounded by errors due to normalfixational instability). Currently, the Cirrus HD-OCT willautomatically position the ETDRS grid over the center ofthe fovea (after the scan is taken). While this results in amore accurate ETDRS map, it may not be valid to comparethese maps to a database in which the ETDRS maps werenot centered on the fovea, though in the case of the Cirrusdatabase, good centration of the volume on the fovea was aninclusion criterion. It is generally important to ensure thatthe scan parameters used to develop the normative databasematch that of the on-board scan protocol. Moreover, thesubject composition (race and gender) may also need to beconsidered when comparing a specific patient to a particularnormative database [12].
There are several limitations to the present study. First,in our examination of B-scan sampling, we used 128 B-scans as the “truth”. This was simply due to a limitationof the specific SD-OCT device being used. However, as weshowed in Figure 2, 128 B-scans (at 512 A scans/B-scan) onlysample 29% of the nominal 6 m × 6 mm volume. Thus thesevolumes are likely already in error compared to an isotropicvolume of 512 B-scans. With the expected availability of evenfaster OCT systems, it will be important to quantify the levelof inaccuracy systematically across more densely sampledvolumes. In addition, we likely underestimate the real effectof undersampling, as we used simulated thickness maps. Ifone were to really only acquire 32 B-scans, this could affectthe accuracy of segmentation as many OCT devices use 3Dapproaches to make correct assignment of layers. A secondlimitation is that we corrected for ocular magnificationusing a linear scaling based on axial length. There are othermethods to correct for ocular magnification [26], and theexact method used for the correction would influence themeasured differences in retinal image magnification. Finally,we did not subanalyze different pathologies. It seems likelythat different retinal pathology would suffer more (or less)than others. Intuitively, one can conclude that the moreuniform the retinal thickness contoured (as might occur inretinitis pigmentosa, where the retina is uniformly thin),the less impact the B-scan sampling, axial length, andscan position would have. Likewise, retinal pathology thatresults in significant peaks and troughs in retinal thickness(macular holes, AMD, diabetic macular edema) might bemore significantly influenced by these parameters. A moredetailed, disease-specific analysis is required to clarify thisissue.

8 Journal of Ophthalmology
It is important to keep in mind that the relevance of theseerrors of course ultimately depends on the clinical applica-tion. For monitoring patients over time, relative differencesin retinal thickness would be generally unaffected by axiallength, though comparing populations of patients (such asin a clinical trial) where there may be differences in axiallength between the groups could result in significant error.If one uses the same sampling density, then the accuracy ofthese longitudinal measurements of retinal thickness will beon the order of that reported for previous repeatability andreproducibility studies. However, in instances where one isinterested in correlating a measure of retinal thickness overa specific retinal area (e.g., central subfield thickness) withsome other measure of vision (such as treatment response)these errors could reveal correlations that do not exist orhide ones that do exist. Moreover, where one is interestedin making absolute measurements in the lateral dimension,such as foveal pit morphology [12, 34] or drusen volume[35], it is critical that these sources of error be removed.
Acknowledgments
J. Carroll is the recipient of a Career Development Awardfrom the Research to Prevent Blindness. This study wassupported by NIH Grants R01EY017607, P30EY001931, andT32EY014537, the Gene and Ruth Posner Foundation, theThomas M. Aaberg, Sr., Retina Research Fund, and anunrestricted departmental grant from Research to PreventBlindness. This investigation was conducted in a facility con-structed with support from Research Facilities ImprovementProgram Grant no. C06 RR-RR016511 from the NationalCenter for Research Resources, National Institutes of Health.The authors thank P. M. Summerfelt for technical assistance.Both D. Odell and A. M. Dubis contributed equally to thiswork.
References
[1] D. Huang, E. A. Swanson, C. P. Lin et al., “Optical coherencetomography,” Science, vol. 254, no. 5035, pp. 1178–1181, 1991.
[2] G. A. Lalwani, P. J. Rosenfeld, A. E. Fung et al., “A variable-dosing regimen with intravitreal ranibizumab for neovascularage-related macular degeneration: year 2 of the PrONTOstudy,” American Journal of Ophthalmology, vol. 148, no. 1, pp.43–58, 2009.
[3] M. Ritter, J. Elledge, C. Simader et al., “Evaluation ofoptical coherence tomography findings in age-related maculardegeneration: a reproducibility study of two independentreading centres,” British Journal of Ophthalmology, vol. 95, no.3, pp. 381–385, 2011.
[4] A. E. Fung, G. A. Lalwani, P. J. Rosenfeld et al., “An opti-cal coherence tomography-guided, variable dosing regimenwith intravitreal ranibizumab (Lucentis) for neovascular age-related macular degeneration,” American Journal of Ophthal-mology, vol. 143, no. 4, pp. 566–583, 2007.
[5] S. Schmitz-Valckenberg, M. Fleckenstein, A. P. Gobel, T. C.Hohman, and F. G. Holz, “Optical coherence tomography andautofluorescence findings in areas with geographic atrophydue to age-related macular degeneration,” Investigative Oph-thalmology & Visual Science, vol. 52, no. 1, pp. 1–6, 2011.
[6] D. E. Baskin, “Optical coherence tomography in diabeticmacular edema,” Current Opinion in Ophthalmology, vol. 21,no. 3, pp. 172–177, 2010.
[7] B. Y. Kim, S. D. Smith, and P. K. Kaiser, “Optical coherencetomographic patterns of diabetic macular edema,” AmericanJournal of Ophthalmology, vol. 142, no. 3, pp. 405–412, 2006.
[8] I. Krebs, S. Hagen, W. Brannath et al., “Repeatability andreproducibility of retinal thickness measurements by opticalcoherence tomography in age-related macular degeneration,”Ophthalmology, vol. 117, no. 8, pp. 1577–1584, 2010.
[9] U. E. K. Wolf-Schnurrbusch, L. Ceklic, C. K. Brinkmann etal., “Macular thickness measurements in healthy eyes usingsix different optical coherence tomography instruments,”Investigative Ophthalmology & Visual Science, vol. 50, no. 7,pp. 3432–3437, 2009.
[10] N. G. Ghazi, T. Kirk, S. Allam, and G. Yan, “Quantification oferror in optical coherence tomography central macular thick-ness measurement in wet age-related macular degeneration,”American Journal of Ophthalmology, vol. 148, no. 1, pp. 90–96,2009.
[11] P. A. Keane, P. S. Mand, S. Liakopoulos, A. C. Walsh, and S. R.Sadda, “Accuracy of retinal thickness measurements obtainedwith Cirrus optical coherence tomography,” British Journal ofOphthalmology, vol. 93, no. 11, pp. 1461–1467, 2009.
[12] M. Wagner-Schuman, A. M. Dubis, R. N. Nordgren et al.,“Race- and sex-related differences in retinal thickness andfoveal pit morphology,” Investigative Ophthalmology & VisualScience, vol. 52, no. 1, pp. 625–634, 2011.
[13] M. Parravano, F. Oddone, B. Boccassini et al., “Reproducibilityof macular thickness measurements using Cirrus SD-OCT inneovascular age-related macular degeneration,” InvestigativeOphthalmology & Visual Science, vol. 51, no. 9, pp. 4788–4791,2010.
[14] F. Forooghian, P. F. Stetson, S. A. Meyer et al., “Relationshipbetween photoreceptor outer segment length and visual acuityin diabetic macular edema,” Retina, vol. 30, no. 1, pp. 63–70,2010.
[15] C. K. S. Leung, C. Y. L. Cheung, R. N. Weinreb et al., “Com-parison of macular thickness measurements between timedomain and spectral domain optical coherence tomography,”Investigative Ophthalmology & Visual Science, vol. 49, no. 11,pp. 4893–4897, 2008.
[16] M. N. Menke, S. Dabov, and V. Sturm, “Comparison ofthree different optical coherence tomography models fortotal macular thickness measurements in healthy controls,”Ophthalmologica, vol. 223, no. 6, pp. 352–356, 2009.
[17] A. C. Sull, L. N. Vuong, L. L. Price et al., “Comparisonof spectral/Fourier domain optical coherence tomographyinstruments for assessment of normal macular thickness,”Retina, vol. 30, no. 2, pp. 235–245, 2010.
[18] S. R. Sadda, P. A. Keane, Y. Ouyang, J. F. Updike, and A. C.Walsh, “Impact of scanning density on measurements fromspectral domain optical coherence tomography,” InvestigativeOphthalmology & Visual Science, vol. 51, no. 2, pp. 1071–1078,2010.
[19] M. Neitz and J. Neitz, “A new mass screening test for color-vision deficiencies in children,” Color Research and Application,vol. 26, pp. S239–S249, 2001.
[20] J. E. Legarreta, G. Gregori, O. S. Punjabi, R. W. Knighton, G.A. Lalwani, and C. A. Puliafito, “Macular thickness measure-ments in normal eyes using spectral domain optical coherencetomography,” Ophthalmic Surgery Lasers and Imaging, vol. 39,no. 4, pp. S43–S49, 2008.
Journal of Ophthalmology 9
[21] H. E. Bedell, “A functional test of foveal fixation based upondifferential cone directional sensitivity,” Vision Research, vol.20, no. 6, pp. 557–560, 1980.
[22] B. S. Zeffren, R. A. Applegate, A. Bradley, and W. A. J. VanHeuven, “Retinal fixation point location in the foveal avascularzone,” Investigative Ophthalmology & Visual Science, vol. 31,no. 10, pp. 2099–2105, 1990.
[23] N. M. Putnam, H. J. Hofer, N. Doble, L. Chen, J. Carroll, andD. R. Williams, “The locus of fixation and the foveal conemosaic,” Journal of Vision, vol. 5, no. 7, pp. 632–939, 2005.
[24] K. Y. Li, P. Tiruveedhula, and A. Roorda, “Intersubjectvariability of foveal cone photoreceptor density in relation toeye length,” Investigative Ophthalmology & Visual Science, vol.51, no. 12, pp. 6858–6867, 2010.
[25] S. Stenstrom, “Investigation of the variation and the correla-tion of the optical elements of human eyes,” American Journalof Optometry & Archives of American Academy of Optometry,vol. 25, no. 7, pp. 340–350, 1948, translated by D. Woolf.
[26] D. F. Garway-Heath, A. R. Rudnicka, T. Lowe, P. J. Foster, F. W.Fitzke, and R. A. Hitchings, “Measurement of optic disc size:equivalence of methods to correct for ocular magnification,”British Journal of Ophthalmology, vol. 82, no. 6, pp. 643–649,1998.
[27] A. G. Bennett, A. R. Rudnicka, and D. F. Edgar, “Improve-ments on Littmann’s method of determining the size of retinalfeatures by fundus photography,” Graefe’s Archive for Clinicaland Experimental Ophthalmology, vol. 232, no. 6, pp. 361–367,1994.
[28] S. Bayraktar, Z. Bayraktar, and O. F. Yilmaz, “Influence of scanradius correction for ocular magnification and relationshipbetween scan radius with retinal nerve fiber layer thicknessmeasured by optical coherence tomography,” Journal of Glau-coma, vol. 10, no. 3, pp. 163–169, 2001.
[29] C. K. S. Leung, S. Mohamed, K. S. Leung et al., “Retinal nervefiber layer measurements in myopia: an optical coherencetomography study,” Investigative Ophthalmology & VisualScience, vol. 47, no. 12, pp. 5171–5176, 2006.
[30] F. M. Rauscher, N. Sekhon, W. J. Feuer, and D. L. Budenz,“Myopia affects retinal nerve fiber layer measurements asdetermined by optical coherence tomography,” Journal ofGlaucoma, vol. 18, no. 7, pp. 501–505, 2009.
[31] C. K. S. Leung, A. C. K. Cheng, K. K. L. Chong et al.,“Optic disc measurements in myopia with optical coherencetomography and confocal scanning laser ophthalmoscopy,”Investigative Ophthalmology & Visual Science, vol. 48, no. 7,pp. 3178–3183, 2007.
[32] S. Asrani, B. Edghill, Y. Gupta, and G. Meerhoff, “Opticalcoherence tomography errors in glaucoma,” Journal of Glau-coma, vol. 19, no. 4, pp. 237–242, 2010.
[33] R. J. Campbell, S. G. Coupland, R. R. Buhrmann, and P.J. Kertes, “Effect of eccentric and inconsistent fixation onretinal optical coherence tomography measures,” Archives ofOphthalmology, vol. 125, no. 5, pp. 624–627, 2007.
[34] A. M. Dubis, J. T. McAllister, and J. Carroll, “Reconstructingfoveal pit morphology from optical coherence tomographyimaging,” British Journal of Ophthalmology, vol. 93, no. 9, pp.1223–1227, 2009.
[35] S. R. Freeman, I. Kozak, L. Cheng et al., “Optical coherencetomography-raster scanning and manual segmentation indetermining drusen volume in age-related macular degener-ation,” Retina, vol. 30, no. 3, pp. 431–435, 2010.