assessing the validity of a language arts instruction log ... · assessing the validity of a...
TRANSCRIPT
1
Assessing the Validity of A Language Arts Instruction Log through
Triangulation
Eric Camburn
Carol A. Barnes
University of Michigan
2
Abstract
In this study we attempted to illuminate why measures of instruction sometimes
fail to meet discrete tests of validity. We used a triangulation strategy—multiple
methods, data sources, and researchers—to investigate teachers' and observers'
reports on a daily language arts log. Data came from a pilot study of the log
conducted in 8 urban public elementary schools. Statistical results increased our
confidence in the log's ability to measure: a) instruction at grosser levels of
detail, b) instructional activities that occurred more frequently, and c) word
analysis instruction. Some qualitative evidence gave us greater confidence in the
instrument-for example, when teachers differed from observers because they
possessed background knowledge not available to observers. Other qualitative
evidence illustrated dilemmas inherent in measuring instruction. Overall, we
believe triangulation strategies provided a more holistic understanding of the
validity of teachers' reports of instruction than past validity studies.
3
Efforts to gauge the validity of measures of instruction have a long history in
educational research. During the 1970s and 1980s for example, many studies
conducted within the process-product tradition assessed the validity of
observation-based measures of instruction by examining agreement among third-
party classroom observers (Shavelson, Webb, & Burstein, 1986). By the 1980s,
researchers studying instruction had begun to move away from an exclusive
reliance on classroom observations towards the use of teachers’ self-reports of
their instruction, either obtained from single-administration questionnaires or
from more frequently filled out logs. Since that time a number of studies have
assessed the validity of instructional measures based on teacher self-reports
(Burstein et al., 1995; Mullens & Graylor 1999; Mullens & Kasprzyk, 1996,
1999; Porter, Kirst, Osthoff, Smithson, & Schneider, 1993). In these studies,
teachers’ self-reports were compared to data from classroom observations,
instructional “artifacts” such as textbooks, or teachers’ reports on other
instruments, and the differences examined.
Studies of the validity of instruction measures have typically followed a
common analytical sequence—a measure is compared to discrete criteria, and if
the criteria is not met, the validity of the measure is called into question. The
criteria employed have varied from study to study. In the earlier process-product
research, the criteria was interobserver agreement, with greater agreement among
third-party observers taken to indicate greater validity. Burstein et. al. (1995)
4
used multiple criteria to examine the correspondence between teachers’
questionnaire responses, their responses to an instruction log, and curricular
topics in textbook chapters teachers claimed to have covered during the
questionnaire’s reporting period. Again, teachers’ responses to the questionnaire
were considered more valid when they agreed with the other two sources of data.
In our opinion, basing judgments about the validity of instructional
measures solely on their agreement with criteria has fostered a faulty impression
that such judgments are straightforward either/or propositions. The logic seems
to be that, as long as the criteria have been met, one can be confident that the
measure is valid. A major outcome of this either/or focus has been that studies in
this area have primarily documented the degree to which measures of instruction
do or do not agree with the criteria. Beyond this kind of evidence, however,
validity studies have yielded little information about why measures of instruction
fail to meet criteria. In the case of measures based on self-reports, little is known
about how teachers formulate self-reports of their instruction or about the factors
that lead teachers to provide self-reports that diverge from validity criteria. In
this article, we build on research on the validity of instruction measures and
address a void in this literature by investigating factors associated with
convergence and divergence in teachers’ and observers’ reports on a daily
language arts log. This investigation is intended to not only shed light on the
5
validity of the log but also on the process of assessing the validity of measures of
instruction more generally.
In the first section we discuss ideas about instruction and triangulation
that guided and framed this research. In the second section we describe the
design of our study, including data sources and analytic methods. In the third
and fourth sections we present quantitative and qualitative evidence on the
validity of teachers’ log responses. In the final section we summarize what we
learned about the validity of the log and discuss implications of this research for
assessing the validity of self-reports of instruction.
Conceptual Frame: Triangulation and Assessing Self-reports of Instruction
A conception of instruction as the connected work of students and teachers
around academic content lies at the center of our inquiry. Ours is a dynamic
view in which instruction resides in social interaction between teachers and
students involving particular academic content. Importantly, content must be
used by teachers and students during these interactions to be important for
instruction (Cohen, Raudenbush & Ball, 2002). Of the three interacting elements
of instruction, teachers hold a uniquely central position because their knowledge,
beliefs, and intent are not only constituents of instruction but can also affect
learning (Cohen & Ball, 1999; Dunkin & Biddle, 1974; Hawkins, 1974; Rowan,
Correnti & Miller, 2002). The language arts log used for this study is designed
to capture the complex, dynamic, and multifaceted nature of instruction with
6
questions such as: What content did the teacher work on with the student? What
did the student do in particular content areas? What material did the student use?
How did the teacher interact with the student?
To generate and understand the validity evidence for measures of such
complex phenomena, researchers must employ correspondingly complex
research designs and analytic strategies. We used a triangulation strategy—
multiple methods, data sources, and researchers—to obtain our data and to
analyze the validity of the language arts log. The conceptual and methodological
territory involved in evaluating the validity or reliability of educational measures
is vast (see for example, American Psychological Association, American
Educational Research Association, National Council on Measurement in
Education, 1999; Burstein et al., 1995; Cronbach, 1989; Messick, 1988, 1989;
Moss, 1992, 1994, 1995; Mullens & Kasprzyk, 1996, 1999; Newman & Benz,
1998; Porter et al., 1993; Tashakkori & Teddlie, 1998). In this article we do not
deal with a comprehensive set of validity issues but rather limit our attention to
triangulation as a strategy for evaluating the construct validity of self-reports of
instruction.
The idea of triangulation has a long tradition in the social sciences
beginning at least as far back as 1959 when Campbell and Fiske argued for a
multimethod research strategy—“mult-operationism”—as a way to validate
measures of social phenomena (Jick, 1979; Mathison, 1988; Newman &
7
Benz,1998). They and others (Denizen, 1978, 1989; Webb, Campbell, Schwartz,
& Sechrest, 1966) argued that multiple methods enhance the validity of research
findings by overcoming the weaknesses or bias in each method. In 1978, Denzin
called for an expansion of the triangulation metaphor, arguing that good research
should go beyond multiple methods to include triangulation of data sources and
investigators as well.
The argument for triangulation has often carried with it alternative
metaphors and caveats about expecting data to converge on one point
(Tashakkori & Teddlie, 1998). For example, while Denzin was a central figure
in elaborating the triangulation metaphor, he also introduced an alternative
metaphor of a kaleidoscope, to illustrate that “…each method…will reveal
different aspects of it [reality], much as a kaleidoscope, depending on the angle
at which it is held, will reveal different colors and configurations of the object to
the viewer” (p. 235). Miles and Huberman (1994) have likewise offered an
alternative to the idea the triangulation metaphor evokes, convergence on one
point, and argued for the importance of researchers’ sensemaking. They offered
the image of a mechanic, or detective, as an accompaniment to methodological
triangulation, suggesting that researchers must ultimately make sense of their
data. Patton (1980) argued that comparing multiple data sources will “seldom
lead to a single, totally consistent picture” (cited in Denzin, 1989, p. 245).
Rather, the point of triangulation is “to attempt to understand and interpret” the
8
differences revealed by different kinds of data. Mathison (1988) pointed out that
in practice researchers must use and construct plausible explanations for data that
“frequently are inconsistent and even contradictory”(p. 17).
Despite these cautions, most social scientists who have written on the
subject remain advocates of triangulation as a method for infusing rigor into
research (Newman & Benz, 1998; Tashakkori & Teddlie, 1998). We adopted
our triangulation strategy to, as Denzin (1989) put it: “partially overcome the
deficiencies that flow from one investigator or method” (1989, page 236). But
we did so anticipating that data generated by different sources or investigators
would be unlikely to cohere into a nicely integrated whole (Jick, 1979; Mathison,
1988; Patton, 1980). In using this triangulation strategy we felt that investigating
why data diverge could shed as much light on the validity of the log as simply
documenting whether or not they converge.
Method
The research reported here was based on the log validation study conducted as
part of a pilot test of the language arts log, which itself was part of a larger
longitudinal study of instructional improvement in the context of comprehensive
school reform programs. The language arts log used for the pilot study is a four-
page self-administered questionnaire on which teachers report the instructional
experiences of a target student for a single school day (see Appendix A). The log
consists of over 150 items and measures instruction in great detail, including
9
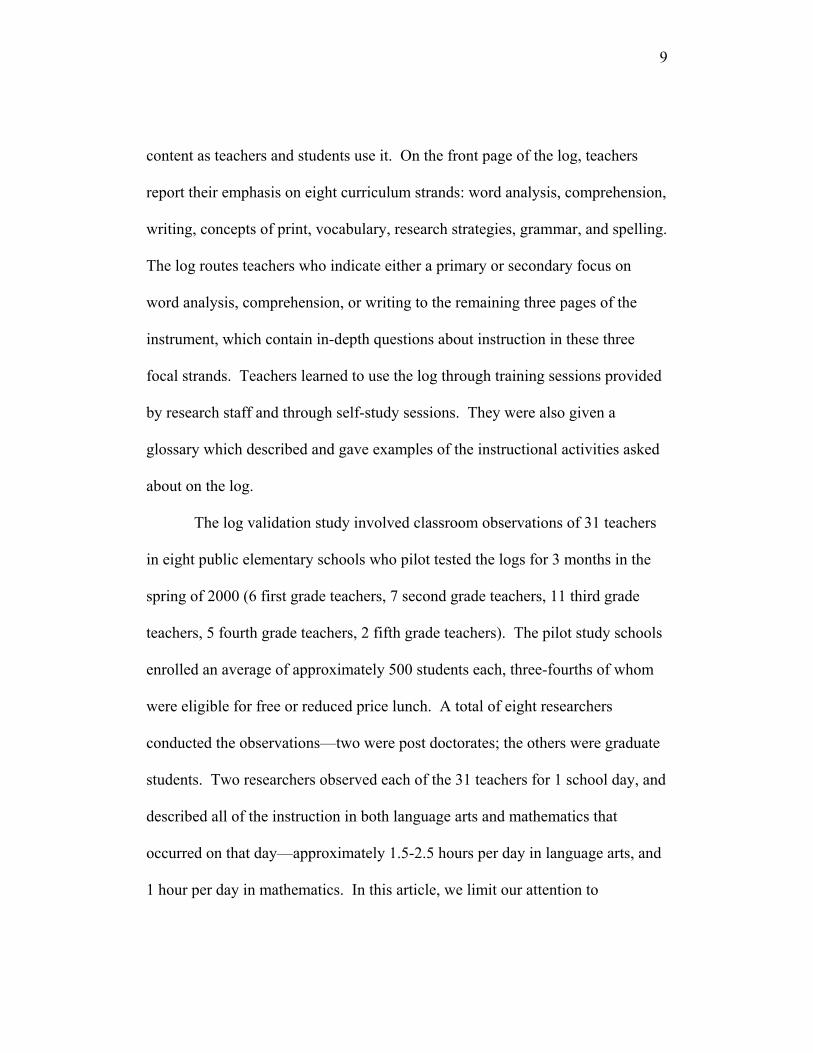
content as teachers and students use it. On the front page of the log, teachers
report their emphasis on eight curriculum strands: word analysis, comprehension,
writing, concepts of print, vocabulary, research strategies, grammar, and spelling.
The log routes teachers who indicate either a primary or secondary focus on
word analysis, comprehension, or writing to the remaining three pages of the
instrument, which contain in-depth questions about instruction in these three
focal strands. Teachers learned to use the log through training sessions provided
by research staff and through self-study sessions. They were also given a
glossary which described and gave examples of the instructional activities asked
about on the log.
The log validation study involved classroom observations of 31 teachers
in eight public elementary schools who pilot tested the logs for 3 months in the
spring of 2000 (6 first grade teachers, 7 second grade teachers, 11 third grade
teachers, 5 fourth grade teachers, 2 fifth grade teachers). The pilot study schools
enrolled an average of approximately 500 students each, three-fourths of whom
were eligible for free or reduced price lunch. A total of eight researchers
conducted the observations—two were post doctorates; the others were graduate
students. Two researchers observed each of the 31 teachers for 1 school day, and
described all of the instruction in both language arts and mathematics that
occurred on that day—approximately 1.5-2.5 hours per day in language arts, and
1 hour per day in mathematics. In this article, we limit our attention to
10
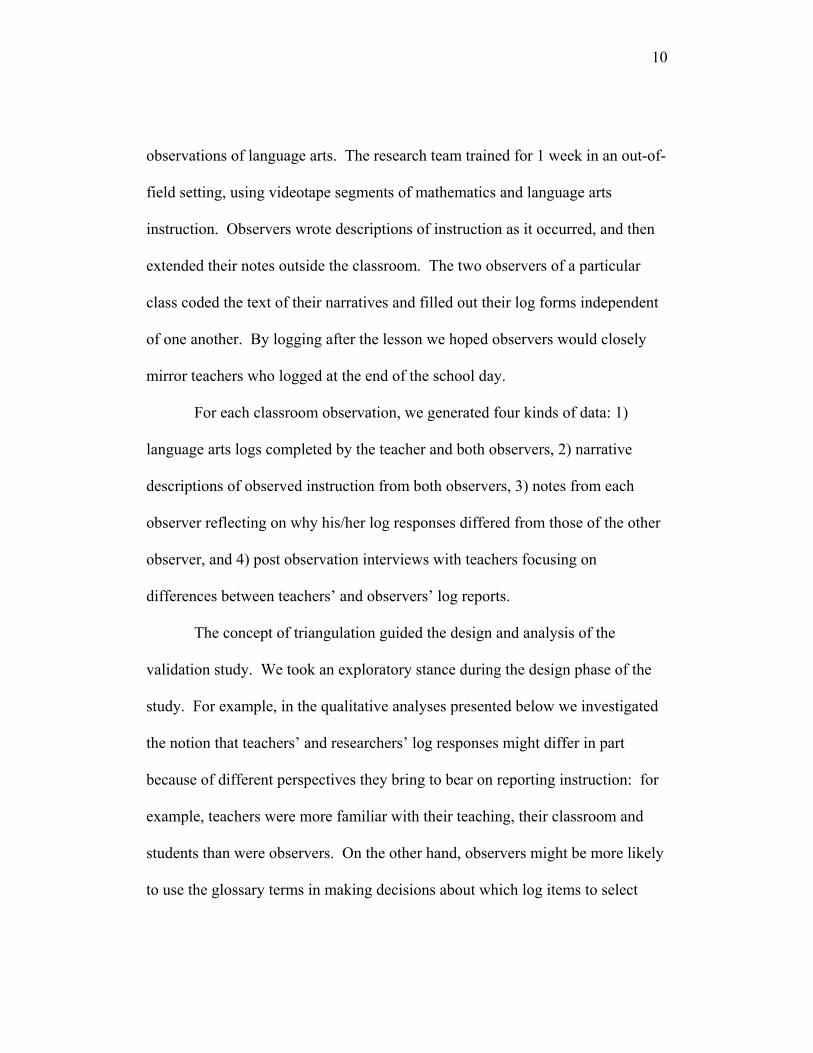
observations of language arts. The research team trained for 1 week in an out-of-
field setting, using videotape segments of mathematics and language arts
instruction. Observers wrote descriptions of instruction as it occurred, and then
extended their notes outside the classroom. The two observers of a particular
class coded the text of their narratives and filled out their log forms independent
of one another. By logging after the lesson we hoped observers would closely
mirror teachers who logged at the end of the school day.
For each classroom observation, we generated four kinds of data: 1)
language arts logs completed by the teacher and both observers, 2) narrative
descriptions of observed instruction from both observers, 3) notes from each
observer reflecting on why his/her log responses differed from those of the other
observer, and 4) post observation interviews with teachers focusing on
differences between teachers’ and observers’ log reports.
The concept of triangulation guided the design and analysis of the
validation study. We took an exploratory stance during the design phase of the
study. For example, in the qualitative analyses presented below we investigated
the notion that teachers’ and researchers’ log responses might differ in part
because of different perspectives they bring to bear on reporting instruction: for
example, teachers were more familiar with their teaching, their classroom and
students than were observers. On the other hand, observers might be more likely
to use the glossary terms in making decisions about which log items to select
11
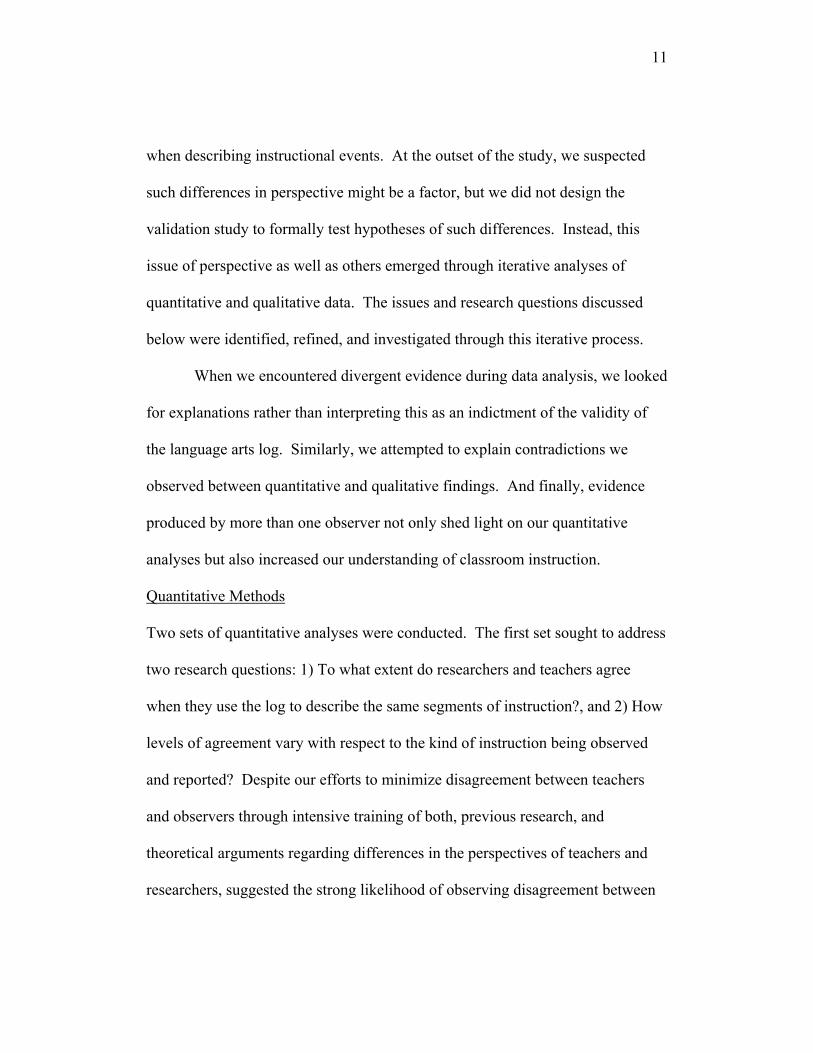
when describing instructional events. At the outset of the study, we suspected
such differences in perspective might be a factor, but we did not design the
validation study to formally test hypotheses of such differences. Instead, this
issue of perspective as well as others emerged through iterative analyses of
quantitative and qualitative data. The issues and research questions discussed
below were identified, refined, and investigated through this iterative process.
When we encountered divergent evidence during data analysis, we looked
for explanations rather than interpreting this as an indictment of the validity of
the language arts log. Similarly, we attempted to explain contradictions we
observed between quantitative and qualitative findings. And finally, evidence
produced by more than one observer not only shed light on our quantitative
analyses but also increased our understanding of classroom instruction.
Quantitative Methods
Two sets of quantitative analyses were conducted. The first set sought to address
two research questions: 1) To what extent do researchers and teachers agree
when they use the log to describe the same segments of instruction?, and 2) How
levels of agreement vary with respect to the kind of instruction being observed
and reported? Despite our efforts to minimize disagreement between teachers
and observers through intensive training of both, previous research, and
theoretical arguments regarding differences in the perspectives of teachers and
researchers, suggested the strong likelihood of observing disagreement between
12
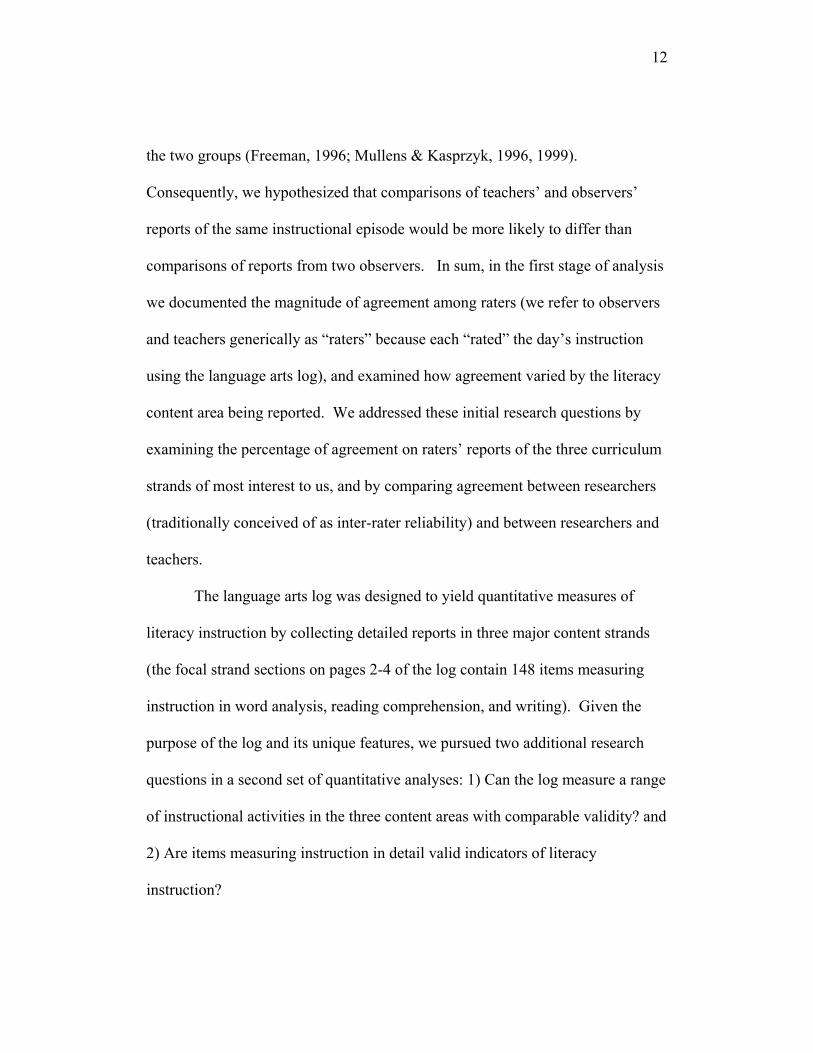
the two groups (Freeman, 1996; Mullens & Kasprzyk, 1996, 1999).
Consequently, we hypothesized that comparisons of teachers’ and observers’
reports of the same instructional episode would be more likely to differ than
comparisons of reports from two observers. In sum, in the first stage of analysis
we documented the magnitude of agreement among raters (we refer to observers
and teachers generically as “raters” because each “rated” the day’s instruction
using the language arts log), and examined how agreement varied by the literacy
content area being reported. We addressed these initial research questions by
examining the percentage of agreement on raters’ reports of the three curriculum
strands of most interest to us, and by comparing agreement between researchers
(traditionally conceived of as inter-rater reliability) and between researchers and
teachers.
The language arts log was designed to yield quantitative measures of
literacy instruction by collecting detailed reports in three major content strands
(the focal strand sections on pages 2-4 of the log contain 148 items measuring
instruction in word analysis, reading comprehension, and writing). Given the
purpose of the log and its unique features, we pursued two additional research
questions in a second set of quantitative analyses: 1) Can the log measure a range
of instructional activities in the three content areas with comparable validity? and
2) Are items measuring instruction in detail valid indicators of literacy
instruction?
13
We addressed these two research questions by fitting a series of
hierarchical generalized linear models (HGLM) that predict how inter-rater
agreement varies with respect to characteristics of log items such as the
curriculum strand being measured and the detail with which an instructional
activity was measured. The models, which nest raters’ matches on log items
within the item themselves, indicate the validity of the log by assessing whether
inter-rater agreement varies with respect to item characteristics about which we
had validity concerns. It was necessary to analyze matches between the two
observers and those between observers and teachers separately because our three-
rater design yielded a systematic dependence among the three ratings associated
with a particular classroom observation. Specifically, if the ratings between any
two pairs of raters are known, the ratings of the third pair are determined. For
example, if raters a and b agree and raters b and c agree, then raters a and c have
to agree. Technical details about the models can be found in Appendix B.
It is important to point out that many previous validity studies of
instructional measures stop at this point, after gauging the degree of
disagreement among raters. But, as noted earlier, the log validation study was
intended to generate detailed evidence that could be used to improve the
language arts log. Thus, we sought to go beyond assessment of the degree of
inter-rater agreement and ask, Why do raters disagree or agree?
Qualitative Methods
14
We used both inductive and deductive approaches in analyzing
qualitative data. We analyzed observation narratives, observers’ reflections
about their disagreements, and followup interviews with teachers to address the
following research questions: In what ways does rater perspective influence
responses on the log? In what ways does the nature of instruction being reported
affect responses? How do insights about raters’ responses on the log inform our
understanding of its validity? Although the first two questions were suggested
by the quantitative results and formed a priori categories for our analysis,
additional themes emerged later through multiple readings of the qualitative data.
In the first step of qualitative data analysis, trained field researchers
coded observation narratives, observers’ reflective notes, and teacher interview
transcripts such that text passages were indexed to specific language arts log
items. The project's data management team entered text from each data source
and the corresponding codes into QSR NUD*IST, a software program for
analyzing qualitative data. They also entered the match results for each set of
teacher and observer pairs into the NUD*IST database.
The NUD*IST program and data base supported our mixed-method,
triangulation strategy. NUD*IST allowed us to retrieve and compare evidence
from multiple qualitative data sources and from multiple researchers, all indexed
to specific log items. In addition, we were able to retrieve and compare data
generated by different methods—quantitative and qualitative. For example, we
15
constructed written descriptions of rater matches or mismatches on specific log
items and groups of items. NUD*IST generated reports that included the match
results of three raters (e.g., observer 1 and observer 2 matched, observer 1 and
the teacher did not match, observer 2 and the teacher did not match) displayed
with coded text units describing the instructional segment, as well as raters’
comments about why they coded the text as they did. To the extent possible, as
themes emerged from the data we clustered them into larger a priori categories
(or created new categories) that allowed us to consider them in light of the
quantitative findings.
Finally, though we did not conduct classroom observations ourselves, as
analysts, we were another set of researchers apart from the original coders, who
were able to read and make judgments about the log codes as they were applied
to instructional segments, providing a kind of referential or confirmation check
of the validity of interpretations in the qualitative tradition (Eisner 1991; Lincoln
& Guba, 1985). This too was a form of triangulation in that we used our
interpretations of instructional segments based on readings of two different
descriptions of the same phenomenon to check the original interpretations and to
discuss why we judged some disagreements to be more of a threat to the validity
of log measures than others.
Results and Discussion
Quantitative Results
16
Levels of agreement on curriculum strand items. We first sought to understand
agreement among raters on the log and whether agreement varied with different
literacy content. Table 1 displays the percentage of observations where raters
provided “identical answers” to a curriculum strand item and where raters
provided “comparable answers” that classified the emphasis on the topic in a
generally equivalent manner. For this second criterion, raters who reported
either a “primary focus” or “secondary focus” on a topic were coded as agreeing,
as were raters who reported a topic was only “touched on briefly” or “not a
focus.” As mentioned earlier, we examined agreement between researchers
separately from that among researchers and teachers because of dependencies in
the data.
Recall that we hypothesized that agreement between teachers and
researchers would be lower than that between researchers. The results in Table 1
support this hypothesis, indicating that, on average, teachers and observers gave
identical answers to curriculum strand items a little over half the time, whereas
observers gave identical answers about two-thirds of the time (a difference-in-
proportion test indicated this difference was statistically significant at the .001
level). The results displayed in Table 1 also suggest that agreement varied
considerably from topic to topic.
Further inspection of Table 1 suggests that teacher/observer pairs were
more likely to give the same answers as observer pairs on some topics and less
17
likely to give the same answers on others. In particular, there was greater
agreement among teacher/observer pairs on the three curriculum strands of
primary interest to us—word analysis, comprehension, and writing—than among
observer pairs. In contrast, teachers and observers were considerably less likely
to give identical reports of grammar and spelling instruction. The relatively high
agreement between teachers and observers on the three curriculum strands of
greatest substantive interest to us is heartening, whereas the relatively lower
agreement between observers on these topics raises a question about the use of
observers as a “gold standard” of comparison. However, looking at the relaxed
standard of “comparable answers,” both teacher/observer and observer/observer
pairs seemed capable of providing equivalent reports of the emphasis on a
literacy strand. The difference between “identical” and “comparable” answers
among observer pairs hints at a pattern discussed later in the qualitative
findings—that researchers often report the same kinds of instructional activity
but differ on their assessment of the magnitude of the activity. As Table 1
shows, when distinctions regarding the emphasis on an instructional activity
were relaxed, observer pairs were more likely to agree on the three curriculum
strand items of most interest to us than were teacher/observer pairs.
Agreement on Items in Focal Strand Sections. We next turn to the second set of
quantitative analyses in which we used HGLM models to assess how much inter-
rater agreement was affected by attributes of the instruction being reported on
18
such as the content involved and its prevalence in the classrooms studied (see
Appendix B for model details). The second set of analyses examined data from
the focal strand sections (pages 2-4) of the log that ask detailed questions about
teachers’ instruction in word analysis, reading comprehension, and writing. To
gauge agreement on items in the focal strand sections, we first fit unconditional
models (i.e. no predictors in the equation) that estimated the likelihood that two
raters answered an item in the same way, either by marking it or by not marking
it. Because a match could be achieved through omission of an answer, we
termed these “implicit” matches. The overall log-odds of an implicit match for a
teacher and an observer were .990, which translates into a predicted probability
of matching of .729. In other words, when filling out items in the focal strand
sections, teachers’ and observers’ answers implicitly matched about 73% of the
time.
In fitting these models we discovered that this high level of agreement
was affected by the idiosyncratic way in which the language arts log tends to be
completed. As mentioned earlier, the three focal strand sections contain 148
items that ask teachers to report on instruction in detail. We found that teachers’
responses tended to be spread thinly over these items. This resulted in most
items in these sections being checked with low incidence—on average, items in
these sections were checked on about 7% of the reporting occasions throughout
the 3-month period of the larger pilot study. The items that were checked with
19
the greatest frequency were only checked about 25% of the time. These kinds of
response patterns meant that high implicit match rates were largely due to raters’
omission of items rather than their marking of items. To get a more accurate
picture of inter-rater agreement, we focused the analysis on raters’ answers rather
than their omissions by examining the probability that two raters would give
“identical answers” when at least one of them answered the item. We refer to
these as “exact matches.”
The overall log odds of an exact match among teachers and observers was
-1.285, which corresponds with a predicted probability of .217, indicating that
teachers and observers gave the same answers on focal strand items about 22%
of the time. Recall that the corresponding average agreement rate for curriculum
strand items was 52%, more than twice the level of the focal strand section.
These results indicate that raters were more likely to report on instruction in a
similar fashion when instruction was measured at a grosser level of detail as it
was with the curriculum strand items. The chi-square statistic associated with
the variance component for this unconditional model was statistically significant
at the .001 level, indicating that agreement varied substantially from item to item.
As with the curriculum strand items, observers were considerably more likely to
agree with each other than with teachers, giving the same answers on items in the
focal strand sections about 35% of the time.
20
We next fit conditional models that examined how exact matches in the
focal strand sections varied as a function of three factors: 1) the nature of the
instruction being reported (as measured by the grade level of the instruction, the
content area, and the kind of instructional activity and materials being reported
on), 2) the detail with which instruction was measured, (indicated by the number
of items used to measure an aspect of instruction), and 3) the overall incidence of
the instructional activity being reported (as measured across all logs in the larger
pilot study). Regarding the third factor, when more items were used to measure
an aspect of instruction, that typically meant we were measuring it in more detail.
One outgrowth of measuring instruction in this way is that one is more likely to
be measuring instructional activities that occur infrequently. Thus, with respect
to the third factor, we were interested in understanding whether rater agreement
varied in relation to the overall incidence of the instructional activity being
measured as represented by the item mean calculated from the larger log pilot
study. Again, we were primarily interested in agreement among teacher/observer
pairs, but the models were also run separately for observer/observer pairs as a
point of comparison. Table 2 describes all variables used in the HGLM analyses,
Table 3 contains descriptive statistics for variables contained in the models, and
Table 4 displays the results of conditional models predicting exact rater
agreement on items in the focal strand sections.
21
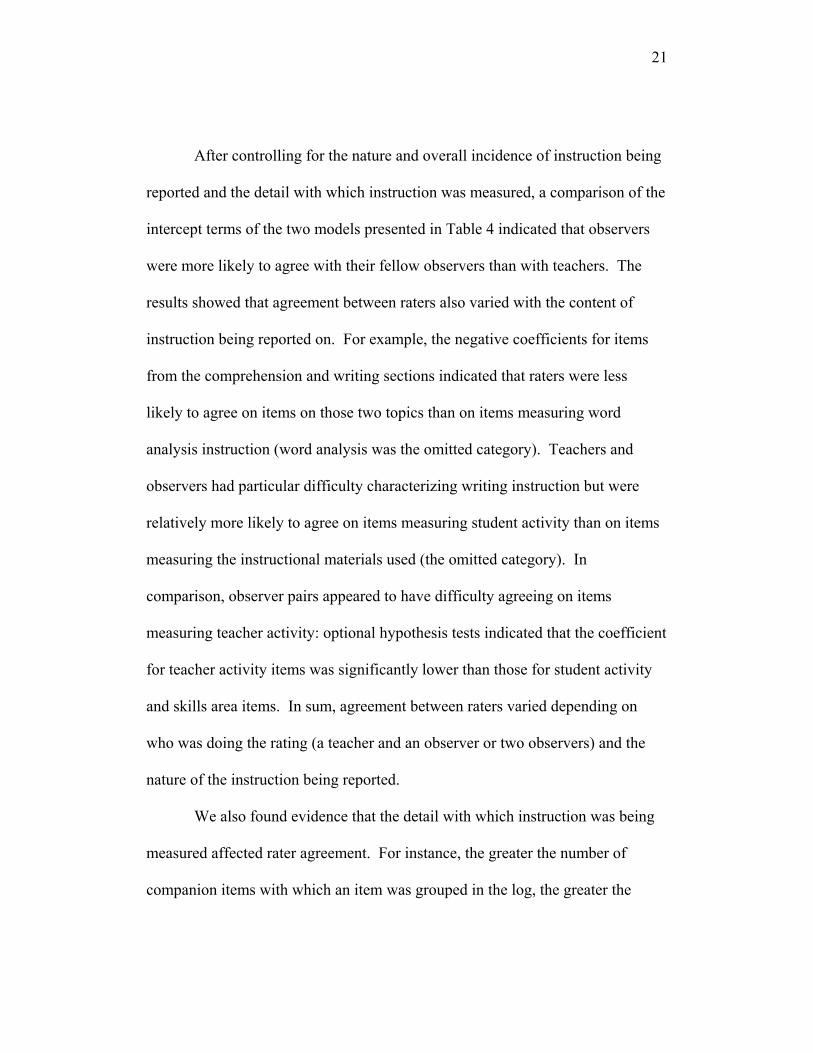
After controlling for the nature and overall incidence of instruction being
reported and the detail with which instruction was measured, a comparison of the
intercept terms of the two models presented in Table 4 indicated that observers
were more likely to agree with their fellow observers than with teachers. The
results showed that agreement between raters also varied with the content of
instruction being reported on. For example, the negative coefficients for items
from the comprehension and writing sections indicated that raters were less
likely to agree on items on those two topics than on items measuring word
analysis instruction (word analysis was the omitted category). Teachers and
observers had particular difficulty characterizing writing instruction but were
relatively more likely to agree on items measuring student activity than on items
measuring the instructional materials used (the omitted category). In
comparison, observer pairs appeared to have difficulty agreeing on items
measuring teacher activity: optional hypothesis tests indicated that the coefficient
for teacher activity items was significantly lower than those for student activity
and skills area items. In sum, agreement between raters varied depending on
who was doing the rating (a teacher and an observer or two observers) and the
nature of the instruction being reported.
We also found evidence that the detail with which instruction was being
measured affected rater agreement. For instance, the greater the number of
companion items with which an item was grouped in the log, the greater the
22
likelihood that teachers and observers would give different answers to the item
(as evidenced by the negative coefficient for the “number of items in cluster”
predictor). This suggests that the more detailed the measurement, the greater the
disagreement among teachers and observers. This pattern also held for observer
pairs, though the effect was not statistically significant.
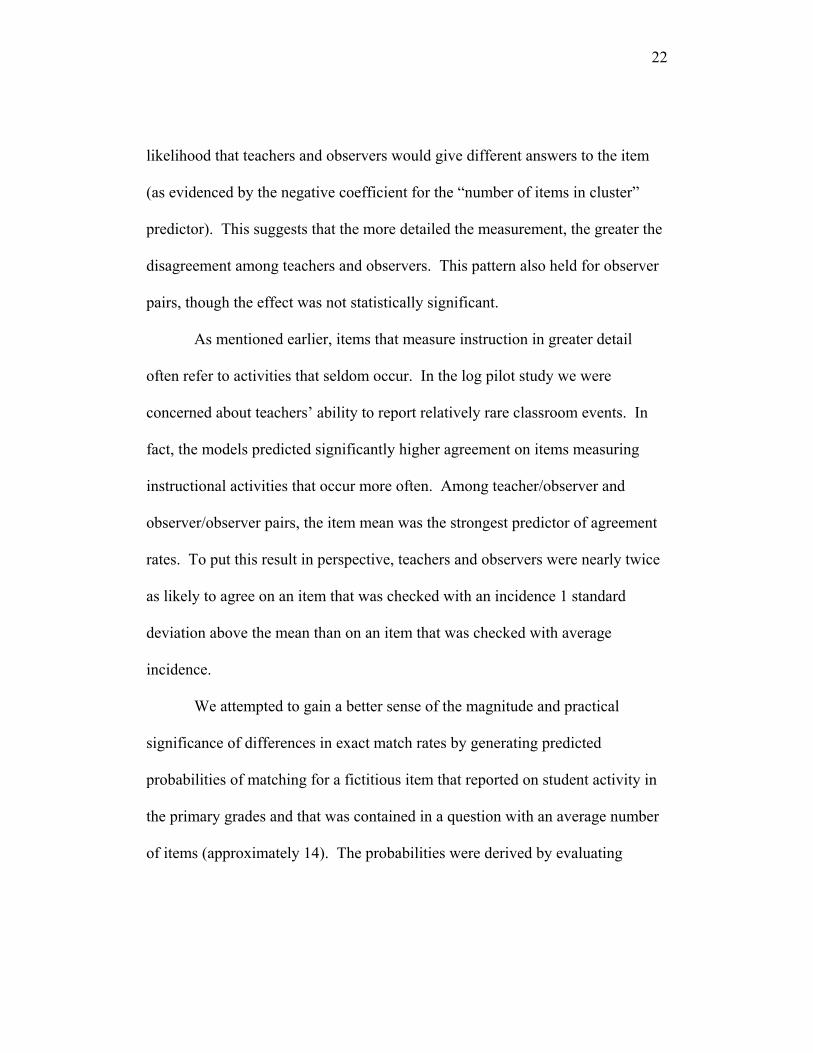
As mentioned earlier, items that measure instruction in greater detail
often refer to activities that seldom occur. In the log pilot study we were
concerned about teachers’ ability to report relatively rare classroom events. In
fact, the models predicted significantly higher agreement on items measuring
instructional activities that occur more often. Among teacher/observer and
observer/observer pairs, the item mean was the strongest predictor of agreement
rates. To put this result in perspective, teachers and observers were nearly twice
as likely to agree on an item that was checked with an incidence 1 standard
deviation above the mean than on an item that was checked with average
incidence.
We attempted to gain a better sense of the magnitude and practical
significance of differences in exact match rates by generating predicted
probabilities of matching for a fictitious item that reported on student activity in
the primary grades and that was contained in a question with an average number
of items (approximately 14). The probabilities were derived by evaluating
23
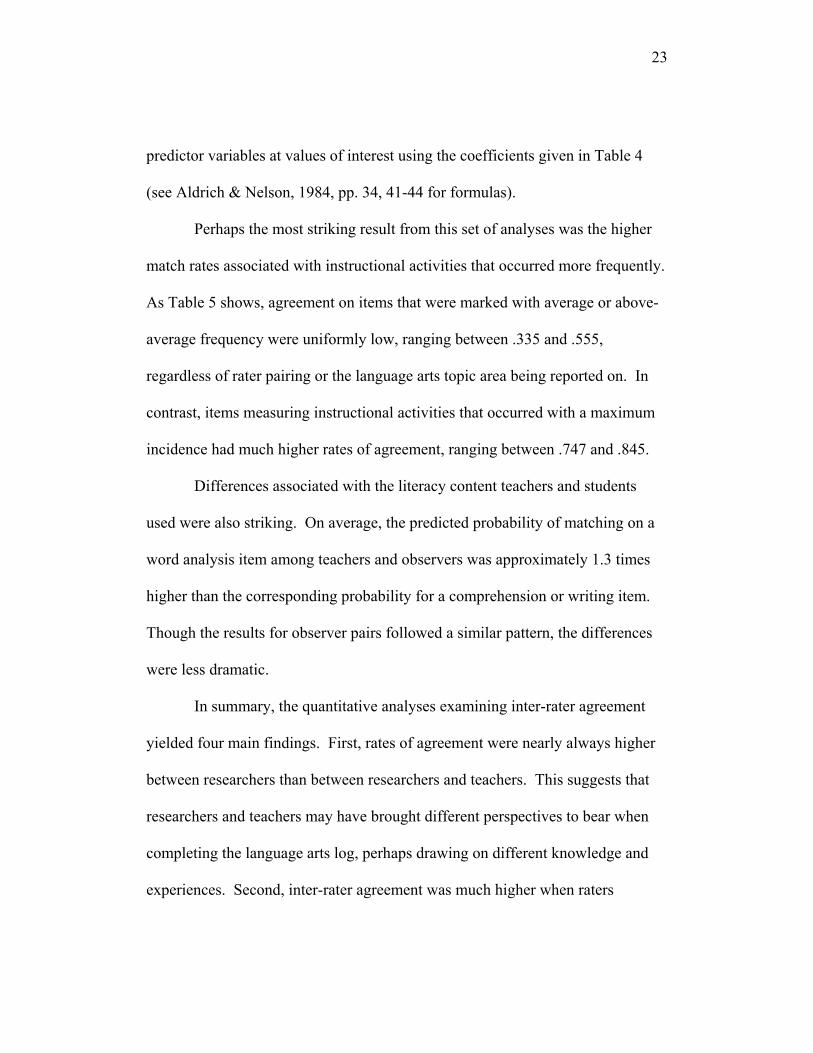
predictor variables at values of interest using the coefficients given in Table 4
(see Aldrich & Nelson, 1984, pp. 34, 41-44 for formulas).
Perhaps the most striking result from this set of analyses was the higher
match rates associated with instructional activities that occurred more frequently.
As Table 5 shows, agreement on items that were marked with average or above-
average frequency were uniformly low, ranging between .335 and .555,
regardless of rater pairing or the language arts topic area being reported on. In
contrast, items measuring instructional activities that occurred with a maximum
incidence had much higher rates of agreement, ranging between .747 and .845.
Differences associated with the literacy content teachers and students
used were also striking. On average, the predicted probability of matching on a
word analysis item among teachers and observers was approximately 1.3 times
higher than the corresponding probability for a comprehension or writing item.
Though the results for observer pairs followed a similar pattern, the differences
were less dramatic.
In summary, the quantitative analyses examining inter-rater agreement
yielded four main findings. First, rates of agreement were nearly always higher
between researchers than between researchers and teachers. This suggests that
researchers and teachers may have brought different perspectives to bear when
completing the language arts log, perhaps drawing on different knowledge and
experiences. Second, inter-rater agreement was much higher when raters

24
reported on instruction in less detail, as evidenced by substantially higher
agreement on curricular strand items than on items in the focal strand sections,
and by lower agreement on focal topic section items when a larger number of
items was used to measure a construct. Third, the likelihood of raters marking
the same item rose as the overall frequency of the instructional activity measured
by the item increased. In other words, raters were more likely to recognize and
then co-report more frequently-occurring instructional activities. Finally, inter-
rater agreement was dependent partly on the nature of the instruction being
reported on. For example, within the focal strand sections, raters were generally
more likely to agree on their reports of word analysis than on reading
comprehension and writing.
Qualitative Results
In this section we examine the three sources of qualitative data
described earlier—narrative reports of classroom observations, follow-up
interviews with teachers, and reflective notes on discrepancies between
researchers. We limit our analysis to items measuring instruction in
word analysis and reading comprehension. Through multiple readings of
the text documents, and from the quantitative results, we identified four
factors that appeared to affect inter-rater agreement: 1) rater perspective,
2) the duration and frequency of instructional segments being reported
25
on, 3) the detail with which items measured instruction, and 4) the
content being measured. Each is discussed below.
Rater perspective and inter-rater agreement By perspective we mean the
background knowledge, beliefs, and experience of the rater. But we also include
here raters’ physical view and attention to the classroom, that is, what each rater
(including the teacher) attended to and could see or hear in the dynamic flow of
classroom interaction. Recall that our quantitative analyses showed a greater
agreement between observers than between observers and teachers. The
qualitative analyses revealed three ways in which rater perspective might have
affected disagreement among raters: a) observers sometimes lacked crucial
contextual information that teachers possessed; b) observers sometimes used the
glossary much more literally and faithfully than teachers, who sometimes
adopted a more intuitive sense of meaning; and, c) raters, including teachers,
viewed the classroom interaction from different locations in the room. Given
that our conceptual frame assumed a unique role for the teacher in instruction—
teachers’ contextual knowledge, experience, intent, long-range goals, and so on
are part of the interactive process—these insights related to rater perspective
were not surprising. However, they helped us move beyond measures of
convergence used in the statistical analyses, to begin to understand divergent
results, as Mathison (1988) and others have advocated.
26
Teachers’ crucial contextual information: In a number of cases, teachers'
knowledge of their students, of the curriculum they were teaching, or of the
instructional events that preceded the observed lesson shaped their choice of log
items. Observers' lack of this knowledge often led them to choose different
items than the teachers. Although the quantitative results showed that teachers
and observers were more likely to agree on “student activity” than on what
materials were “in use” during an instructional segment, the qualitative data
showed that differences in raters’ perspectives occurred for all kinds of
instructional activities.
One example is the case of Ms. Booth (all names are pseudonyms). She
and the observers disagreed on a log item describing what the target student was
doing, because, as she explained “…I didn't mark it [B1d, making person
connection to the story] because according to what I saw in the glossary . . .
they [students] use the connection so they understand the story. That's not what
they [students] were doing… They understand the story. They are making
personal connections because they just think at a different level.” In another
typical example, both observers and a teacher—Ms. Karsten—agreed that word
analysis was the focus of instruction but disagreed on the topics covered within
word analysis. The teacher reported that the target student worked with
individual sentences without picture cues (A3d) and with connected text that was
literature based (A3h) whereas the two observers did not. When recounting her
27
reasons for her log responses, Ms. Karsten said: “I guess I'm going back and
thinking of what they've [her students] been taught and why they can do it. If it
wasn't this late in the year, it would be different.” In formulating their responses,
both of these teachers drew upon a rich store of contextual knowledge about the
students they teach, recurring interactions they have with those students, and
their long and short term instructional goals.
Little of the information the teachers drew on to code their instruction
was available to the observers. A lack of this contextual knowledge appeared to
have led raters to check different items. Ms. Booth, seemed to imply that their
responses to certain log items may have been affected by the student on whom
they were reporting. On one hand, this possibility is troubling for a survey
instrument that is designed to capture instructional practice in a standardized
fashion. On the other hand, such variation can be integral to the work of
instruction, which often involves using knowledge about individual students.
But both these examples, and others we saw, highlighted limitations of
observation as a method for understanding the validity of self-reports about
instruction. The examples also illustrated the value of respondent interviews and
observer reflections for understanding mismatches between observers and
teachers. Probing disagreements such as these actually gave us greater
confidence in teachers’ log reports while causing us to regard observers’ log
responses with slightly more skepticism.
28
Perspective on log terminology: Teachers sometimes marked items more
intuitively than did observers, whose responses tended to conform more
stringently with glossary definitions. This was especially so in reading
comprehension. Again, we believe these differences in interpretation were in
part related to differences in the raters’ perspectives—in this instance, their
experiences, and motivation. Though we attempted to promote a shared
understanding of log terminology by providing a glossary and thorough training,
observers received more extensive training than teachers. It is also likely that
observers were more motivated to use the glossary.
The case of Ms. Carroll illustrates our general point. She marked B2l
“Thinkaloud” to describe an instructional segment, but neither observer marked
that item. The teacher offered the following descriptions of the activity: "For the
thinkaloud, that was discussing, like, after they read something, what they
thought it meant. Why they thought it meant that. That's where they get into
making connections…and talking about their connections.” The glossary
definition indicates that thinkalouds are metacognitive exercises in which
students verbalize how they are attempting to make sense of a text during
reading. But the observation notes and Ms. Carroll’s interview suggested that
her students were discussing details of a text, through brief question-and answer
exchanges, after they had read it. Ms. Caroll's interpretation of a thinkaloud was
not unique. Ms. Booth described her students' use of thinkalouds as follows:
29
"They were thinking out loud. They were talking to each other and telling them
what they thought about the story or what the story was about."
In the case of Ms. Jaeger one observer differed from the other two raters
because he interpreted the item B1k “comparing, contrasting” more narrowly
than they did. Ms. Jaeger's follow-up interview, and observation notes from
both observers, referenced a lesson segment in which students were asked to
compare and contrast three houses. In explaining his response, the dissenting
observer made a fine distinction based on the glossary definition—a finer
distinction than was warranted by the definition. Though he generally agreed
with the other raters that comparing and contrasting occurred in this lesson
segment, his response contributed to inter-rater disagreement.
Log developers used the results of the log validity study to revise the log
and glossary to remedy some problems of this type. Still, the problem of
developing a clear, shared understanding of instructional terminology remains a
challenge, especially in cases where fine or complex distinctions in instruction
are involved.
Physical perspective and attention when viewing classroom interaction: Like
problems associated with differences among raters’ contextual information, this
variation on the theme of rater perspective also points out the limits of
observation as a method for capturing classroom interaction. Just as observers
cannot fully discern teachers’ intentions, there are times when multiple observers
30
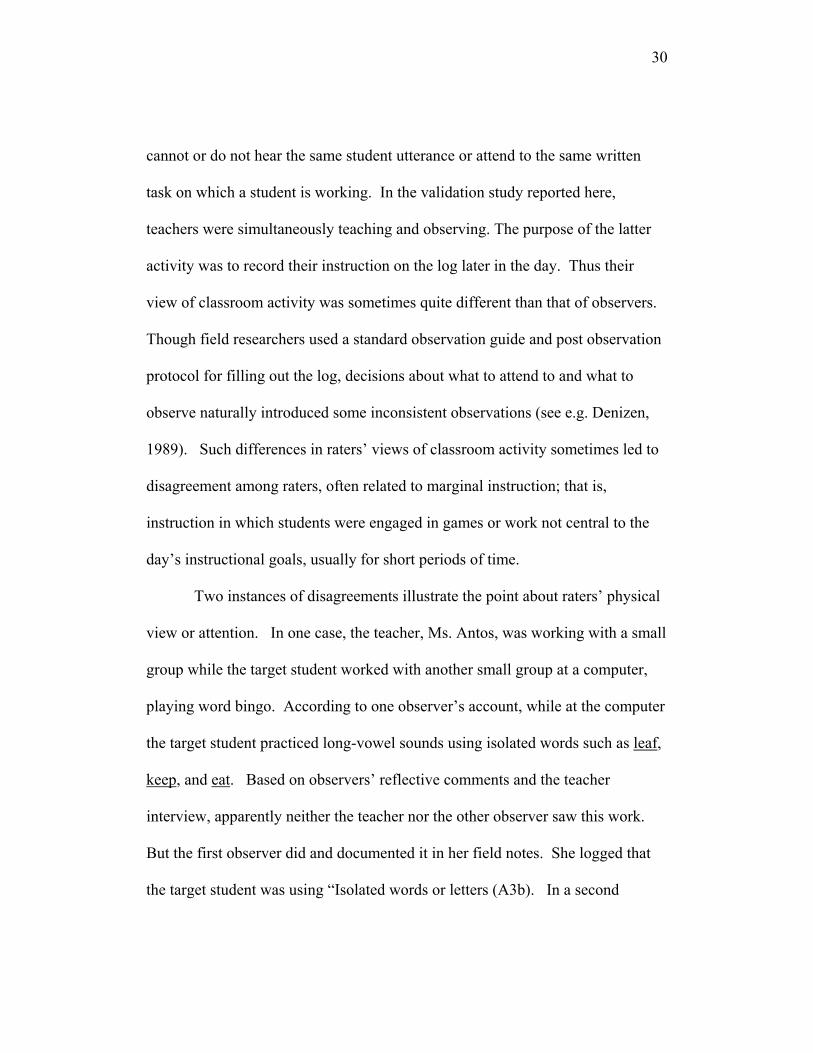
cannot or do not hear the same student utterance or attend to the same written
task on which a student is working. In the validation study reported here,
teachers were simultaneously teaching and observing. The purpose of the latter
activity was to record their instruction on the log later in the day. Thus their
view of classroom activity was sometimes quite different than that of observers.
Though field researchers used a standard observation guide and post observation
protocol for filling out the log, decisions about what to attend to and what to
observe naturally introduced some inconsistent observations (see e.g. Denizen,
1989). Such differences in raters’ views of classroom activity sometimes led to
disagreement among raters, often related to marginal instruction; that is,
instruction in which students were engaged in games or work not central to the
day’s instructional goals, usually for short periods of time.
Two instances of disagreements illustrate the point about raters’ physical
view or attention. In one case, the teacher, Ms. Antos, was working with a small
group while the target student worked with another small group at a computer,
playing word bingo. According to one observer’s account, while at the computer
the target student practiced long-vowel sounds using isolated words such as leaf,
keep, and eat. Based on observers’ reflective comments and the teacher
interview, apparently neither the teacher nor the other observer saw this work.
But the first observer did and documented it in her field notes. She logged that
the target student was using “Isolated words or letters (A3b). In a second
31
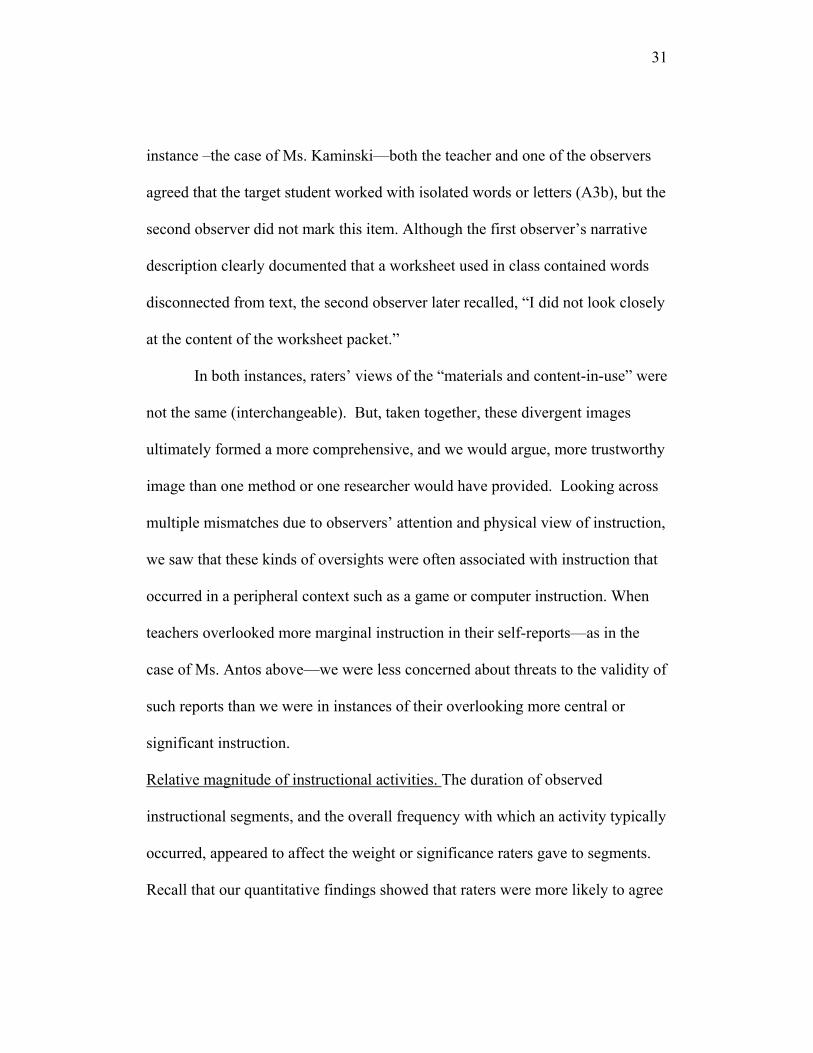
instance –the case of Ms. Kaminski—both the teacher and one of the observers
agreed that the target student worked with isolated words or letters (A3b), but the
second observer did not mark this item. Although the first observer’s narrative
description clearly documented that a worksheet used in class contained words
disconnected from text, the second observer later recalled, “I did not look closely
at the content of the worksheet packet.”
In both instances, raters’ views of the “materials and content-in-use” were
not the same (interchangeable). But, taken together, these divergent images
ultimately formed a more comprehensive, and we would argue, more trustworthy
image than one method or one researcher would have provided. Looking across
multiple mismatches due to observers’ attention and physical view of instruction,
we saw that these kinds of oversights were often associated with instruction that
occurred in a peripheral context such as a game or computer instruction. When
teachers overlooked more marginal instruction in their self-reports—as in the
case of Ms. Antos above—we were less concerned about threats to the validity of
such reports than we were in instances of their overlooking more central or
significant instruction.
Relative magnitude of instructional activities. The duration of observed
instructional segments, and the overall frequency with which an activity typically
occurred, appeared to affect the weight or significance raters gave to segments.
Recall that our quantitative findings showed that raters were more likely to agree
32
on instructional activities that occurred more frequently (across all teachers in the
pilot study). Other validation studies (e.g. Mullens & Kasprzyk, 1999) have
yielded similar results, where teachers’ time estimates were most accurate for
activities they used most frequently. Although some of our qualitative evidence
seemed at first to contradict these quantitative findings, in the end, this
contradiction between the two kinds of data was more informative than it was
unsettling.
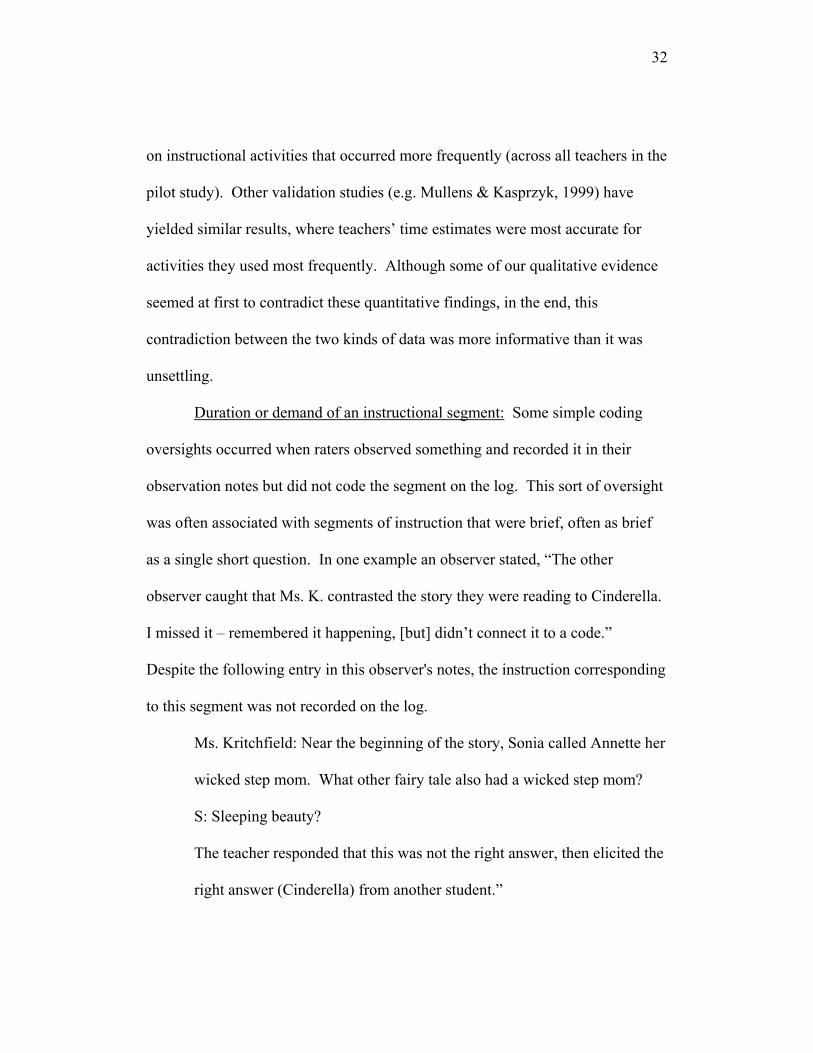
Duration or demand of an instructional segment: Some simple coding
oversights occurred when raters observed something and recorded it in their
observation notes but did not code the segment on the log. This sort of oversight
was often associated with segments of instruction that were brief, often as brief
as a single short question. In one example an observer stated, “The other
observer caught that Ms. K. contrasted the story they were reading to Cinderella.
I missed it – remembered it happening, [but] didn’t connect it to a code.”
Despite the following entry in this observer's notes, the instruction corresponding
to this segment was not recorded on the log.
Ms. Kritchfield: Near the beginning of the story, Sonia called Annette her
wicked step mom. What other fairy tale also had a wicked step mom?
S: Sleeping beauty?
The teacher responded that this was not the right answer, then elicited the
right answer (Cinderella) from another student.”
33
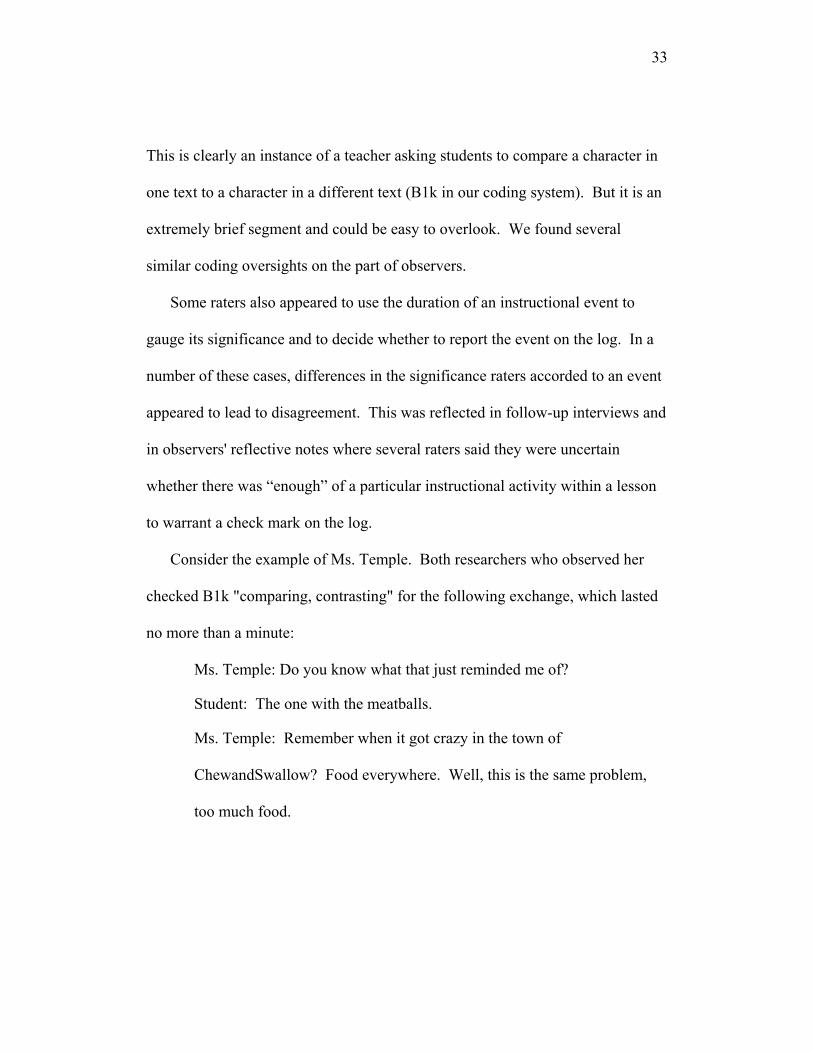
This is clearly an instance of a teacher asking students to compare a character in
one text to a character in a different text (B1k in our coding system). But it is an
extremely brief segment and could be easy to overlook. We found several
similar coding oversights on the part of observers.
Some raters also appeared to use the duration of an instructional event to
gauge its significance and to decide whether to report the event on the log. In a
number of these cases, differences in the significance raters accorded to an event
appeared to lead to disagreement. This was reflected in follow-up interviews and
in observers' reflective notes where several raters said they were uncertain
whether there was “enough” of a particular instructional activity within a lesson
to warrant a check mark on the log.
Consider the example of Ms. Temple. Both researchers who observed her
checked B1k "comparing, contrasting" for the following exchange, which lasted
no more than a minute:
Ms. Temple: Do you know what that just reminded me of?
Student: The one with the meatballs.
Ms. Temple: Remember when it got crazy in the town of
ChewandSwallow? Food everywhere. Well, this is the same problem,
too much food.
34
Unlike the observers, Ms. Temple did not mark B1k, perhaps because she
thought that this was not a significant focus of the reading comprehension lesson,
or perhaps because she simply forgot she had asked the question.
Rather than using the duration of an instructional segment to assign
significance, some observers considered the cognitive demand on students during
a segment. For example, some raters had difficulty distinguishing between
“brief” (B2c) and “extended”(B2e) writing within a comprehension lesson. Even
though distinctions between these two kinds of writing in the glossary definitions
appeared clear, raters in Ms. Stenkl’s class and other classes had difficulty
deciding which of these codes to choose. For example, in Ms. Stenkl’s class the
target student wrote the following sentences:
Kevin is made.
Kevin dus not like baby-sitters.
Kevin does not whant his mom to leav.
Kevin does not like kissy kissy books.
Kevin likes baseball.
One observer viewed these as single sentences and subsequently coded this
segment as involving "brief written comments or answers" (B2c). The observer
wrote: “I called this brief since they were less than a [paragraph]…I don’t think
35
that the teacher asked the target student for extended responses as defined in the
glossary. However, the boundary between brief and extended is a fuzzy one,
especially when students are not writing a great deal – that is, young writers such
as first grade students.” The other observer coded these sentences as "extended
written answers" (B2e) and justified his choices as follows: “Because the target
student wrote several sentences which consisted, really, almost of a paragraph.”
As the first observer indicated, deciding whether a written exercise is
extended or brief according to the glossary is not simply a matter of considering
the amount a student has written, nor is it only a function of the amount of time
the student spent on the exercise. Rather, such judgments are also colored by the
age of the student, the nature of the task the student is asked to perform, and the
way in which the student responds to the task. On one hand, the sentences the
target student wrote are related, and one might construe those sentences as a
paragraph about a boy named Kevin. On the other hand, the student’s writing
might also be considered separate, brief sentences. This case informed us that
log developers might need to create even more specific coding definitions for
some items. But it also cast doubt on whether revisions can ever translate into
completely inter-changeable reporting among raters in instances like these.
Frequency of an instructional activity and gauging significance: Like
duration, the frequency with which an instructional activity typically occurred
seemed to color raters’ assessment of the significance of instructional segments
36
and subsequently, their log reports. In thinking through this issue, Mathison’s
(1988) argument for considering multiple kinds of data, even if such data are
sometimes contradictory, seemed salient. We puzzled over evidence that
initially appeared contradictory: though more frequent instructional activities
were associated with higher convergence in the quantitative data, we observed
cases in the qualitative data where more ubiquitous instructional activities were
associated with divergence between raters. We believe that the routine nature of
some instructional segments may have led teachers to overlook or dismiss such
segments as unimportant.
For example, Ms. Becker explained why she disagreed with observers
about an instructional segment involving word analysis—a frequently occurring
topic in lower elementary grades: “I think it's [word analysis] one of those things
where you could mark it every day. [but]…. I see word analysis as more of a
chunk of time that you're going to use for that specific skill, which is why I did
not consider checking it yesterday.” Like word analysis, having students listen to
a text read to them is something that occurs frequently in primary-grade
classrooms. Thus, reading aloud to students also struck us as an activity that
might be prone to dismissal by teachers. Curiously, six teachers omitted the fact
that students were read to during their comprehension work. These teachers
failed to mark B2a “listen to text read to them,” although both observers marked
that item.
37
One such case was Ms. Getty. The classroom narratives of both
observers clearly indicated that students listened to her read from The Secret
Garden (Burnett, 1910-11).
Observer 1: Teacher reading – The Secret Garden.., beginning at 8:20…
[Ms. Getty] gets through a significant portion of the eleventh chapter of
the book. [The target student] is fairly engaged in listening to the story as
Ms. Getty reads.
Observer 2: Ms. G … grabs her copy of The Secret Garden… About five
or six students contribute their ideas about what took place in the chapter
that was read to them yesterday…Ms. G then begins to read the text,
asking a couple of questions as she reads.
It is not clear whether the teacher's omission was due to an oversight, or whether
she thought this aspect of the lesson was not significant enough to code. If the
former is true, her responses may be considered random measurement error, an
inherent part of any survey. If the latter is true, her answers may signal a
different kind of problem. Here, brevity is not the issue so much as how Ms.
Getty attached significance to what was likely a daily routine for this
classroom—students listening to text read to them and providing brief comments
or answers.
A plausible though counterintuitive explanation for this and other coding
omissions is that teachers sometimes overlooked routine work or judged it to be
38
unimportant precisely because it occurred so often. Thus, the ubiquity of some
elements of word analysis or comprehension made them seem less important to
teachers. Though we would rather not see inter-rater disagreement and teacher
omissions such as these, we believe the effect on item validity is not significant
because the items that are affected are generally ones checked most frequently.
If teachers could somehow be trained not to omit such items, these items would
still be the most frequently checked, just more so. This sort of change would
likely have only a modest effect on quantitative measures derived from log items.
Complexity of content distinctions made in items. Because the log measures
many aspects of instruction, there is built-in redundancy in the instrument. In
conducting the log validation study we discovered that this characteristic of the
log meant raters had to be attuned to fine distinctions in language arts content. In
many cases, raters marked different but conceptually similar items for the same
segment of instruction. The potential for this kind of mismatch increased with
the complexity of the log question.
Consider the example of Ms. Becker who, as part of a unit on weather,
had her students read a photocopied article on tornadoes and the story Tornado
Alert (Branley, 1990) from their reading books. Students took turns reading
these two texts out loud, and the teacher periodically stopped the reading to pose
questions. In characterizing this segment of instruction, Ms. Becker used B1a
“Activating prior knowledge,” and one observer used B1d “Making personal
39
connections to story or text.” The glossary definitions of the two items show that
both deal with students’ use of prior knowledge in making sense of a text. A key
distinction in the glossary definitions is that activating prior knowledge is an
exclusively pre-reading activity whereas making personal connections is not.
Here are Ms. Becker’s and the observer’s explanations of why they
marked the items they did.
Ms. Becker: … I think we talked about [the storms] as we went, or
beforehand. To activate their knowledge… I did my log strictly on the
Tornado Alert.… I know we had talked about the storms in Nebraska the
day before.
Observer: Ms. Becker marked… (B1a) and I didn’t. I believe she
marked this because of the newspaper article she handed out to the
students to read before they read Tornado Alert. They talked a little bit
about things they had already learned about tornadoes… I marked B1d
instead of B1a because I considered the newspaper article to be text in
itself, and the questions the teacher asked followed the Ss reading of the
article.
Ms. Becker and the observer clearly had the same instructional segment in mind
when they marked different, yet conceptually similar items. Moreover, these
excerpts indicated that they agreed on a fundamental distinguishing feature of the
segment—that students used their prior knowledge of tornadoes in making sense
40
of Tornado Alert. The issues on which they appeared to differ were when
students drew upon this knowledge and what represented “the text.” The teacher
completed the log as though the story in students’ books—Tornado Alert—was
the text, and thus that some of her questions preceded students’ reading of it.
The observer assumed the photocopied handout was also “text,” and thus some
of Ms. Becker’s questions followed students’ reading of it.
Differences in interpretation such as this were based on complex and fine
distinctions and often resulted in a mismatch. Raters disagreed on other items
besides (B1a) and (B1d) that were redundant because they were logically linked
to one another. However, when one rater checked one of a logically connected
pair of items and another rater did not, mismatches occurred.
The cases discussed in this section helped us understand the need for
clearer glossary definitions and highlighted problems we would face with items
that make fine distinctions in language arts content. These cases further
emphasized a tradeoff faced by researchers interested in measuring instruction:
either try to measure subtle differences in “content-in use” by teachers and
students that theory and research suggest might affect students’ opportunities to
learn, or use items that measure grosser aspects of instruction. The former
approach, which parses instruction more finely, makes inter-rater agreement
more difficult to obtain and poses a threat to the validity of measures. The latter
41
approach may miss nuances in instruction that are theoretically and empirically
important but may yield more valid measurement.
“Content-in-use” by students and teachers. In this section we develop ideas
about why agreement varied across literacy topics. The statistical results
indicated that inter-rater agreement tended to be highest for items measuring
instruction in word analysis and lower for items measuring writing and reading
comprehension. Our approach to this problem was less inductive and less
closely tied to the data than the earlier analyses in this section. Thus, we
emphasize the tentative nature of our conclusions here. Based on our reading of
the qualitative data, we conjecture that word analysis content is easier to discern
than writing or comprehension content in part because student work in this area
tends to be more aural and to include performance rather than to be primarily
cognitive.
Many of the word-analysis items in the log refer to activities in which
students and teachers are working with sound—either making letter sounds alone
or in combination, reading words aloud or saying words that rhyme, pointing to
letters that make particular sounds, saying words on flash cards or word walls,
and so on. Student work involving sound is easier for an observer to recognize
and thus less likely to be a source of disagreement between raters. Likewise, an
observer can readily see and hear a student using a “picture or object to identify
sounds.” Noticing when a student is using “isolated words or letters” is not
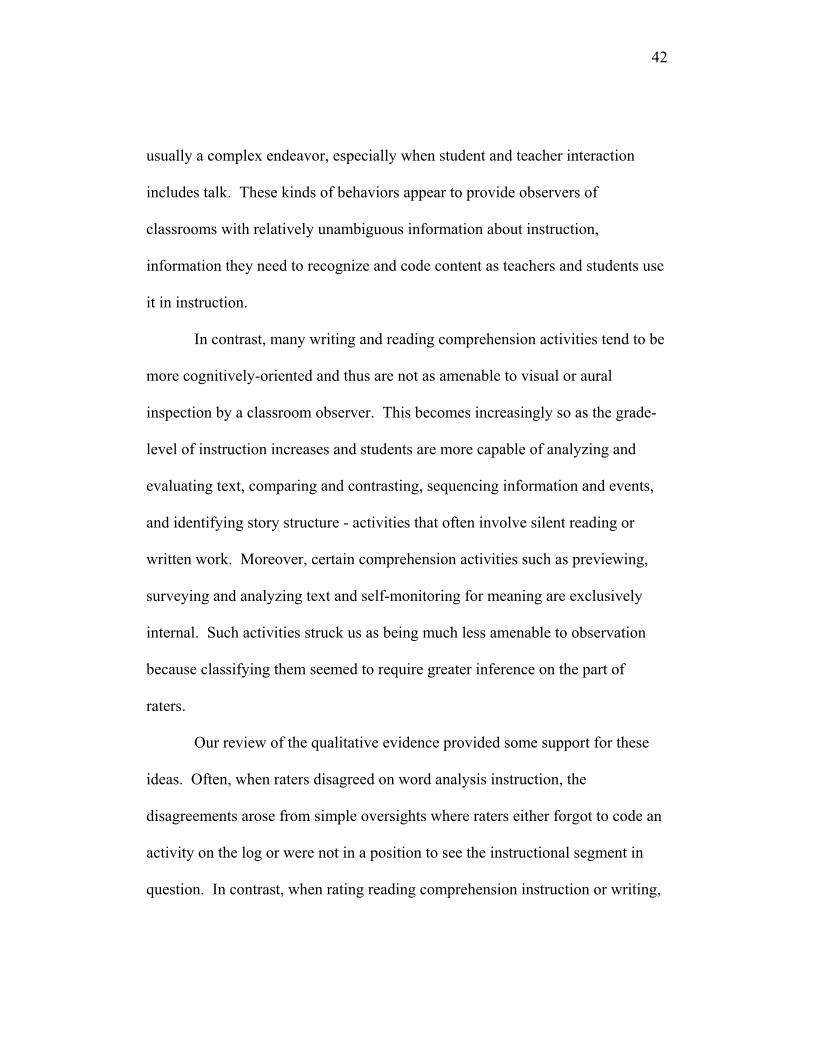
42
usually a complex endeavor, especially when student and teacher interaction
includes talk. These kinds of behaviors appear to provide observers of
classrooms with relatively unambiguous information about instruction,
information they need to recognize and code content as teachers and students use
it in instruction.
In contrast, many writing and reading comprehension activities tend to be
more cognitively-oriented and thus are not as amenable to visual or aural
inspection by a classroom observer. This becomes increasingly so as the grade-
level of instruction increases and students are more capable of analyzing and
evaluating text, comparing and contrasting, sequencing information and events,
and identifying story structure - activities that often involve silent reading or
written work. Moreover, certain comprehension activities such as previewing,
surveying and analyzing text and self-monitoring for meaning are exclusively
internal. Such activities struck us as being much less amenable to observation
because classifying them seemed to require greater inference on the part of
raters.
Our review of the qualitative evidence provided some support for these
ideas. Often, when raters disagreed on word analysis instruction, the
disagreements arose from simple oversights where raters either forgot to code an
activity on the log or were not in a position to see the instructional segment in
question. In contrast, when rating reading comprehension instruction or writing,
43
raters appeared to struggle more often with the interpretation of instructional
segments. Thus, we saw evidence that part of the difficulty of classifying
instruction arises from differences in the nature of student work in different
content areas.
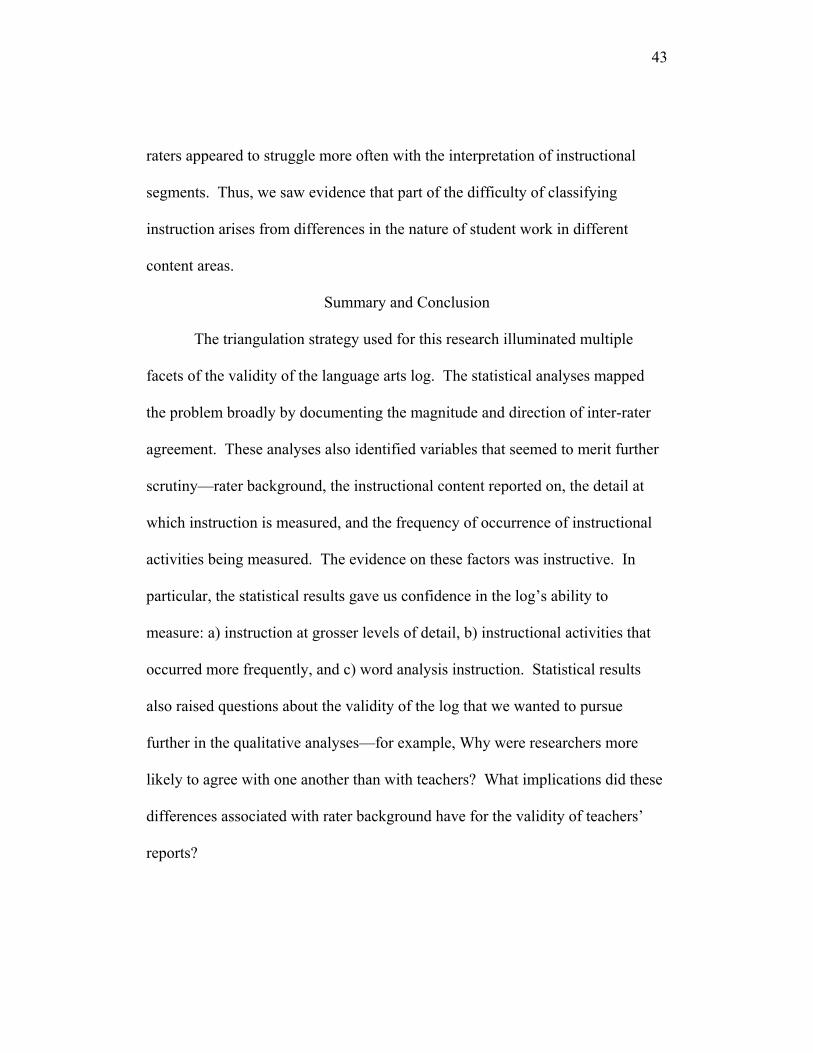
Summary and Conclusion
The triangulation strategy used for this research illuminated multiple
facets of the validity of the language arts log. The statistical analyses mapped
the problem broadly by documenting the magnitude and direction of inter-rater
agreement. These analyses also identified variables that seemed to merit further
scrutiny—rater background, the instructional content reported on, the detail at
which instruction is measured, and the frequency of occurrence of instructional
activities being measured. The evidence on these factors was instructive. In
particular, the statistical results gave us confidence in the log’s ability to
measure: a) instruction at grosser levels of detail, b) instructional activities that
occurred more frequently, and c) word analysis instruction. Statistical results
also raised questions about the validity of the log that we wanted to pursue
further in the qualitative analyses—for example, Why were researchers more
likely to agree with one another than with teachers? What implications did these
differences associated with rater background have for the validity of teachers’
reports?
44
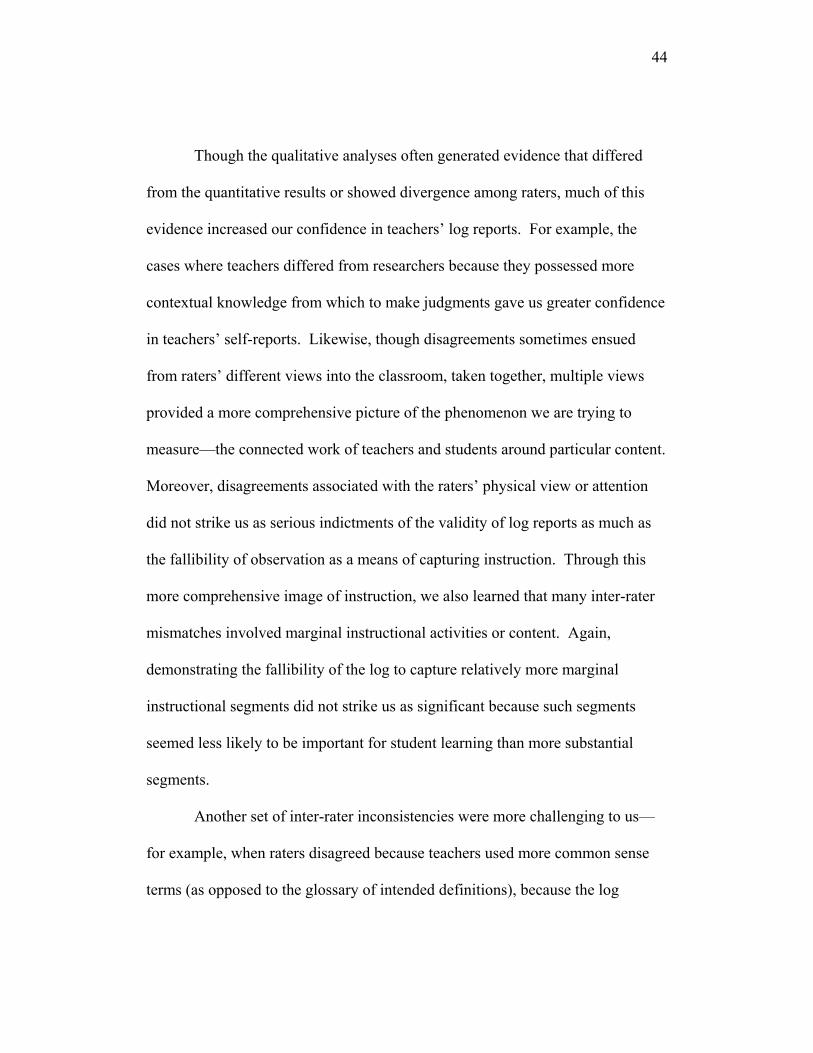
Though the qualitative analyses often generated evidence that differed
from the quantitative results or showed divergence among raters, much of this
evidence increased our confidence in teachers’ log reports. For example, the
cases where teachers differed from researchers because they possessed more
contextual knowledge from which to make judgments gave us greater confidence
in teachers’ self-reports. Likewise, though disagreements sometimes ensued
from raters’ different views into the classroom, taken together, multiple views
provided a more comprehensive picture of the phenomenon we are trying to
measure—the connected work of teachers and students around particular content.
Moreover, disagreements associated with the raters’ physical view or attention
did not strike us as serious indictments of the validity of log reports as much as
the fallibility of observation as a means of capturing instruction. Through this
more comprehensive image of instruction, we also learned that many inter-rater
mismatches involved marginal instructional activities or content. Again,
demonstrating the fallibility of the log to capture relatively more marginal
instructional segments did not strike us as significant because such segments
seemed less likely to be important for student learning than more substantial
segments.
Another set of inter-rater inconsistencies were more challenging to us—
for example, when raters disagreed because teachers used more common sense
terms (as opposed to the glossary of intended definitions), because the log
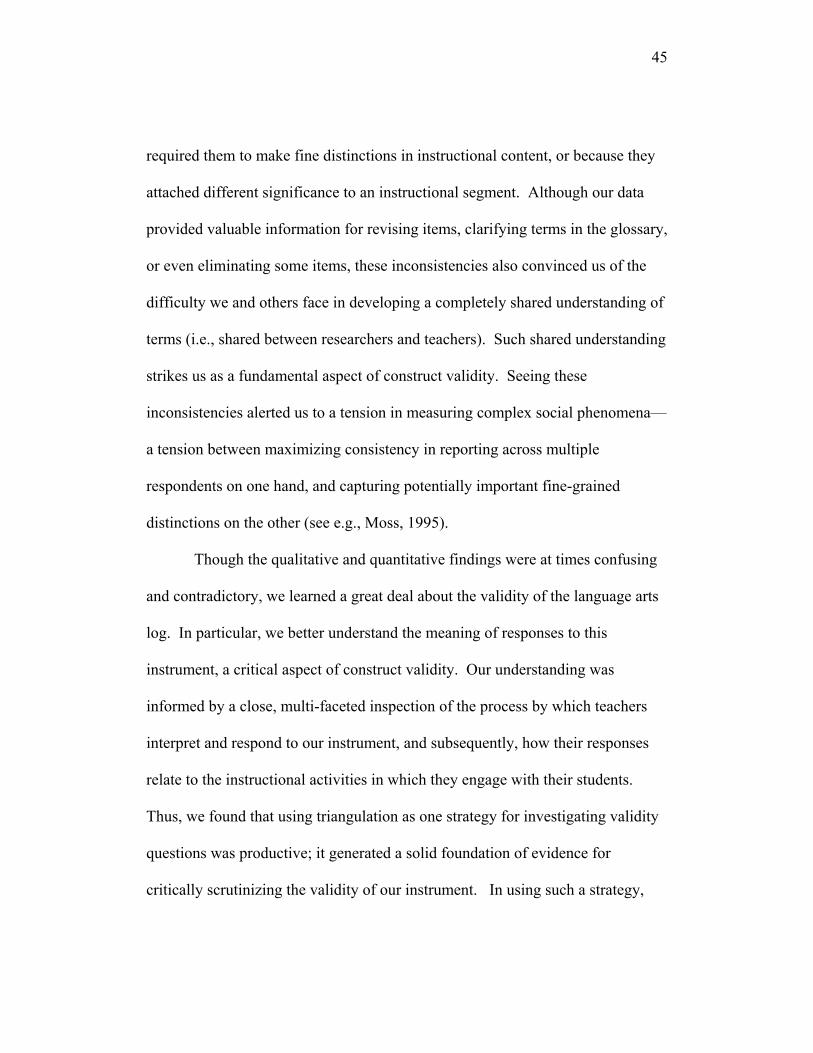
45
required them to make fine distinctions in instructional content, or because they
attached different significance to an instructional segment. Although our data
provided valuable information for revising items, clarifying terms in the glossary,
or even eliminating some items, these inconsistencies also convinced us of the
difficulty we and others face in developing a completely shared understanding of
terms (i.e., shared between researchers and teachers). Such shared understanding
strikes us as a fundamental aspect of construct validity. Seeing these
inconsistencies alerted us to a tension in measuring complex social phenomena—
a tension between maximizing consistency in reporting across multiple
respondents on one hand, and capturing potentially important fine-grained
distinctions on the other (see e.g., Moss, 1995).
Though the qualitative and quantitative findings were at times confusing
and contradictory, we learned a great deal about the validity of the language arts
log. In particular, we better understand the meaning of responses to this
instrument, a critical aspect of construct validity. Our understanding was
informed by a close, multi-faceted inspection of the process by which teachers
interpret and respond to our instrument, and subsequently, how their responses
relate to the instructional activities in which they engage with their students.
Thus, we found that using triangulation as one strategy for investigating validity
questions was productive; it generated a solid foundation of evidence for
critically scrutinizing the validity of our instrument. In using such a strategy,
46
however, we find we are no closer to demonstrating that multiple methods, data
sources, and researchers eliminate the weaknesses or bias in different methods,
thereby producing one convergent picture of instruction. To the contrary, some
of our evidence cast reasonable doubt on whether observers of classroom
instruction can provide judgments that are completely inter-changeable with
those of teachers. The combination of views and methods, however, did hold us
to a kind of rigor that required constant questioning of assumptions that
ultimately yielded a richer, more holistic picture of the phenomenon. In
summary, we do not believe such a picture would have been possible had we
undertaken the kind of simpler assessment that has been typical of past efforts to
assess the validity of teachers’ self-reports of instruction. Moreover, given the
richer characterization of instruction our triangulation strategy produced, we
believe that such strategies are useful not only as a means of checking validity
but as measurement and analysis strategies in their own right.
47
References
Aldrich, J. H., & Nelson, D. (1984). Logit and probit models. Beverly
Hills, CA: Sage.
American Psychological Association, American Educational Research
Association, National Council on Measurement in Education. (1999). Standards
for educational and psychological testing. Washington, DC: American Educational
Research Association.
Branley, Franklyn M. (1990). Tornado alert. NY: HarperTrophy.
Burnett, Frances Hodgson (1910-11). The secret garden. NY: Phillips.
Burstein, L., McDonnell, L. M., VanWinkle, J., Ormseth, T., Mirocha, J.,
& Guiton, G. (1995). Validating national curriculum indicators. Santa Monica,
CA: RAND.
Camburn, E., Correnti, R., & Taylor, J. (2000, April). Using qualitative
techniques to assess the validity of teachers' responses to survey items. Paper
presented at the annual meeting of the American Educational Research
Association, New Orleans, LA.
Campbell, D. T., & Fiske, D. W. (1959). Convergent and discriminant
validation by the multitrait-multimethod matrix. Psychological Bulletin, 56, 81-
105.
Cohen, D. K., & Ball, D. L. (1999). Instruction, capacity and
improvement (CPRE Research Report RR-43). Philadelphia, PA: Consortium for
48
Policy Research in Education.
Cohen, D. K., Raudenbush, S., & Ball, D. L. (2002). Resources,
instruction and research. In R. F. Boruch & F. W. Mosteller (Eds.), Evidence
matters: Randomized trials in educational research (pp 80-119). Washington,
DC: Brookings Institute.
Cronbach, L. J. (1989). Construct validation after thirty years. In R. Linn
(Ed.), Intelligence: Measurement theory and public policy (pp. 147-171).
Urbana: University of Illinois Press.
Denzin, N. K. (1978). The research act: A theoretical introduction to
sociological methods (2d ed.). New York: McGraw-Hill.
Denzin, N. K. (1989). The research act: A theoretical introduction to
sociological methods (3d ed.). Englewood Cliffs, NJ: Prentice Hall.
Dunkin, M., & Biddle, B. (1974). The study of teaching. New York: Holt,
Rhinehart & Winston.
Eisner, E. W. (1991). The enlightened eye: Qualitative inquiry and the
enhancement of educational practice. New York: Macmillan.
Freeman, D. (1996). To take them at their word: Language data in the
study of teachers' knowledge. Harvard Educational Review, 66(4), 732-61.
Hawkins, D. (1974). The informed visions: Essays on learning and
human nature. New York: Agathon.
49
Jick, T. D. (1979). Mixing qualitative and quantitative methods:
Triangulation in action. Administrative Science Quarterly, 24(4), 602-611.
Lincoln, Y. S., & Guba, E. G. (1985). Naturalistic inquiry. Beverly Hills,
CA: Sage.
Mathison, S. (1988). Why triangulate? Educational Researcher 17,(2) 13-
17.
Messick, S. (Ed.). (1988). The once and future issues of validity:
Assessing the meaning and consequences of measurement. Mahwah, NJ:
Elbaum.
Messick, S. (1989). Validity. In R. L. Linn (Ed.), Educational
measurement (pp. 13-103). Washington DC: American Council on Education
and National Council on Measurement in Education.
Miles, M. B., & Huberman, M. (1994). Qualitative data analysis (2d ed.).
Thousand Oaks, CA, London, and New Delhi: Sage.
Moss, P. A. (1992). Shifting conceptions of validity in educational
measurement: Implications for performance assessment. Review of Educational
Research, 62(3), 229-258.
Moss, P. A. (1994). Can there be validity without reliability? Educational
Researcher, 23(2), 5-12.
Moss, P. A. (1995). Themes and variations in validity theory. Educational
Measurement: Issues and Pactice, 14(2), 5-13.
50
Mullens, J., & Gayler, K. (1999). Measuring classroom instructional
processes: Using survey and case study field test results to improve item
construction. Washington,DC: U.S. Department of Education. Office of
Educational Research and Improvement. National Center for Education
Statistics.
Mullens, J., & Kasprzyk, D. (1996). Using qualitative methods to validate
quantitative survey instruments. Proceedings of the section on survey research
methods. Paper presented at the annual meeting of the American Statistical
Association, Alexandria, VA.
Mullens, J., & Kasprzyk, D. (1999). Validating item responses on self-
report teacher surveys: NCES working paper. Washington, DC: U.S.
Department of Education.
Newman, I., & Benz, C. R. (1998). Qualitative-quantitative research
methodology: Exploring the interactive continuum. Carbondale and
Edwardsville: Southern Illinois University Press.
Patton, Michael Quinn (1980). Qualitative evaluation methods. Beverly
Hills: Sage.
Porter, A. G. (1993). Defining and measuring opportunity to learn. The
debate on opportunity-to-learn standards: Supporting works. Washington, DC:
National Governors' Association.
Porter, A. G., Kirst, M., Osthoff, E., Smithson, J., & Schneider, S. (1993).
51
Reform up close: An analysis of high school mathematics and science
classrooms. Madison: University of Wisconsin, Wisconsin Center for Education
Research.
QSR NUD*IST, [Qualitative data analysis software]. (1991-1997).
Melbourne, Australia: Qualitative Solutions and Research Pty Ltd.
Raudenbush, S. W., & Bryk, A. S. (2002). Hierarchical linear models:
Applications and data analysis methods. Thousand Oaks, CA: Sage.
Rowan, B., Correnti, R., & Miller, R. (2002). What large-scale survey
research tells us about teacher effects on student achievement: Insights from
"The Prospects Study of Elementary Schools." Teachers College Record, 104(8),
1525-1567.
Shavelson, R. J., Webb, N. M., & Burstein, L. (1986). Measurement of
teaching. In M. C. Wittrock (Ed.), Handbook of Research on Teaching. . NY:
Macmillan.
Tashakkori, A., & Teddlie, C. (1998). Mixed methodology: Combining
qualitative and quantitative approaches, 46. Thousand Oaks, CA, London, and
New Delhi: Sage.
Webb, E. J., Campbell, D. T., Schwartz, R. D., & Sechrest, L. (1966).
Unobtrusive measures. Chicago: Rand McNally.
52
Appendix A - Language Arts Log
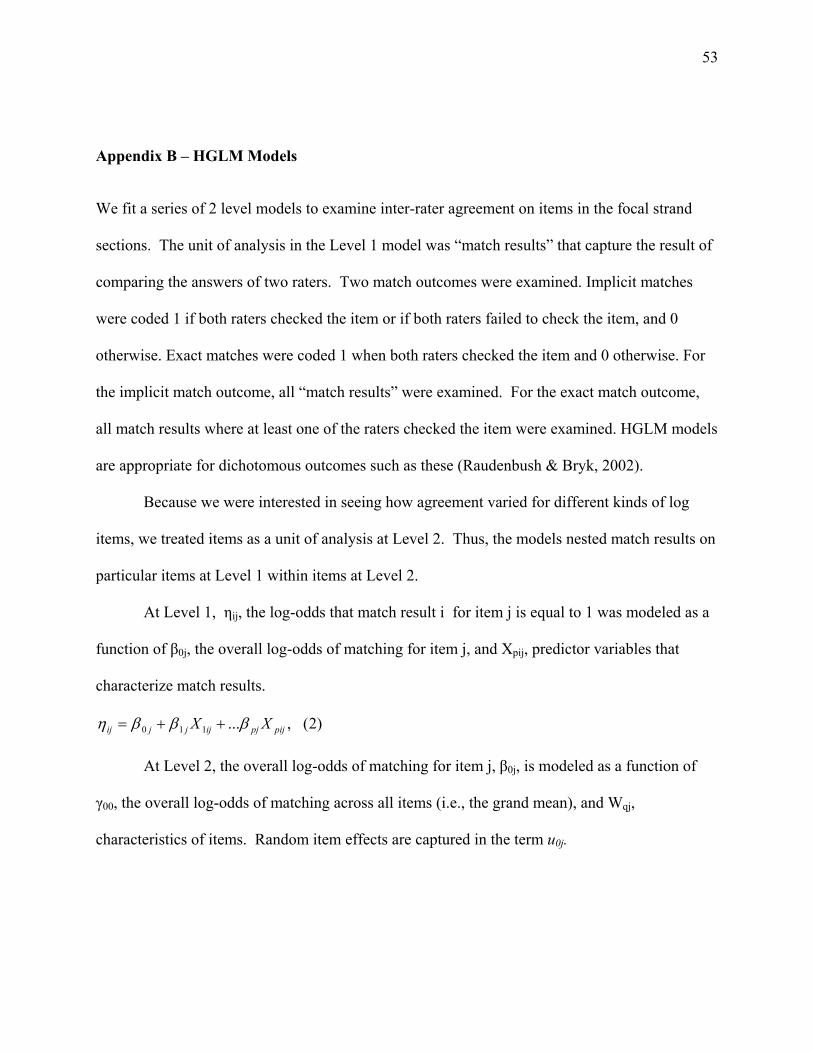
53
Appendix B – HGLM Models
We fit a series of 2 level models to examine inter-rater agreement on items in the focal strand
sections. The unit of analysis in the Level 1 model was “match results” that capture the result of
comparing the answers of two raters. Two match outcomes were examined. Implicit matches
were coded 1 if both raters checked the item or if both raters failed to check the item, and 0
otherwise. Exact matches were coded 1 when both raters checked the item and 0 otherwise. For
the implicit match outcome, all “match results” were examined. For the exact match outcome,
all match results where at least one of the raters checked the item were examined. HGLM models
are appropriate for dichotomous outcomes such as these (Raudenbush & Bryk, 2002).
Because we were interested in seeing how agreement varied for different kinds of log
items, we treated items as a unit of analysis at Level 2. Thus, the models nested match results on
particular items at Level 1 within items at Level 2.
At Level 1, ηij, the log-odds that match result i for item j is equal to 1 was modeled as a
function of β0j, the overall log-odds of matching for item j, and Xpij, predictor variables that
characterize match results.
)2(,...110 pijpjijjjij XX βββη ++=
At Level 2, the overall log-odds of matching for item j, β0j, is modeled as a function of
γ00, the overall log-odds of matching across all items (i.e., the grand mean), and Wqj,
characteristics of items. Random item effects are captured in the term u0j.
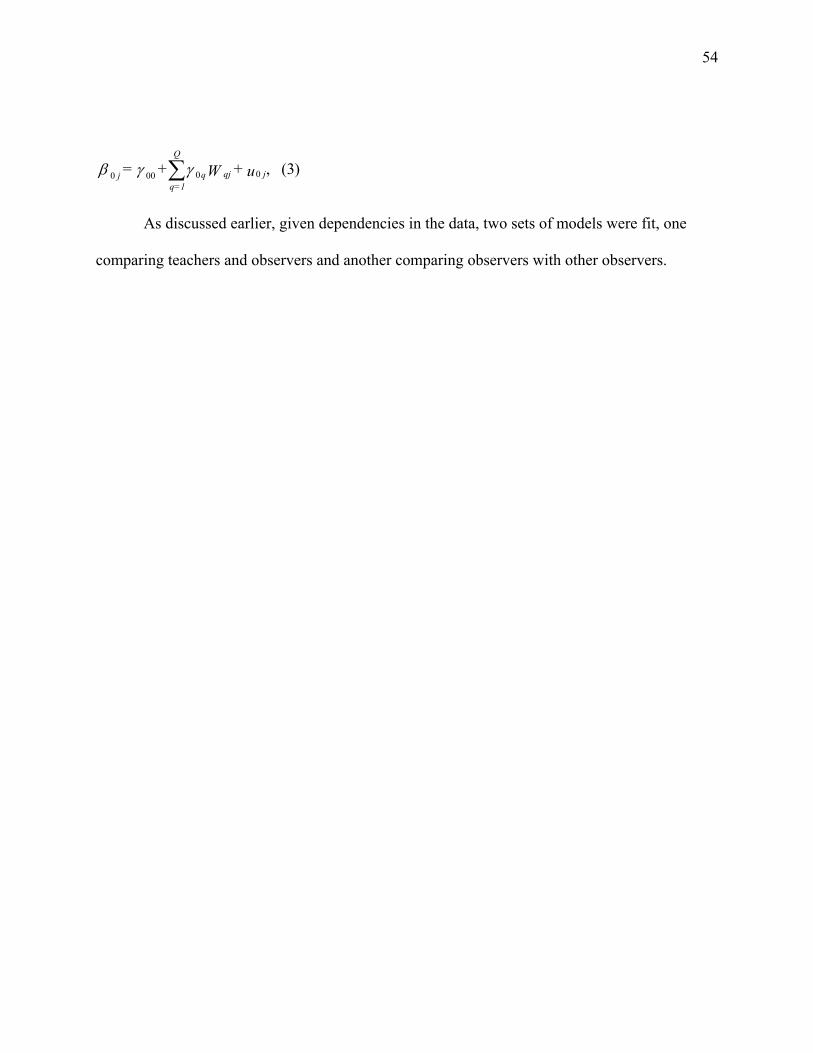
54
)3(,00000 u+W+ = jqjq
Q
=1qj γγβ ∑
As discussed earlier, given dependencies in the data, two sets of models were fit, one
comparing teachers and observers and another comparing observers with other observers.
55
Note
The research reported here was conducted by the Consortium for Policy Research in
Education as part of a large-scale study of instructional improvement within the context of
comprehensive school reform programs. We gratefully acknowledge funding from the Atlantic
Philanthropies, USA; the William and Flora Hewlett Foundation; the U.S. Department of
Education; and the National Science Foundation. We also express deep appreciation for the
advice and assistance of the following colleagues: Sally Atkins-Burnett, Richard Correnti,
Pamela Moss, Brian Rowan, and James Taylor. We also wish to thank two anonymous
reviewers whose feedback greatly improved the manuscript. Please address correspondence to:
Eric Camburn, University of Michigan, School of Education, 610 East University, Room
3112A, Ann Arbor, MI 48109.
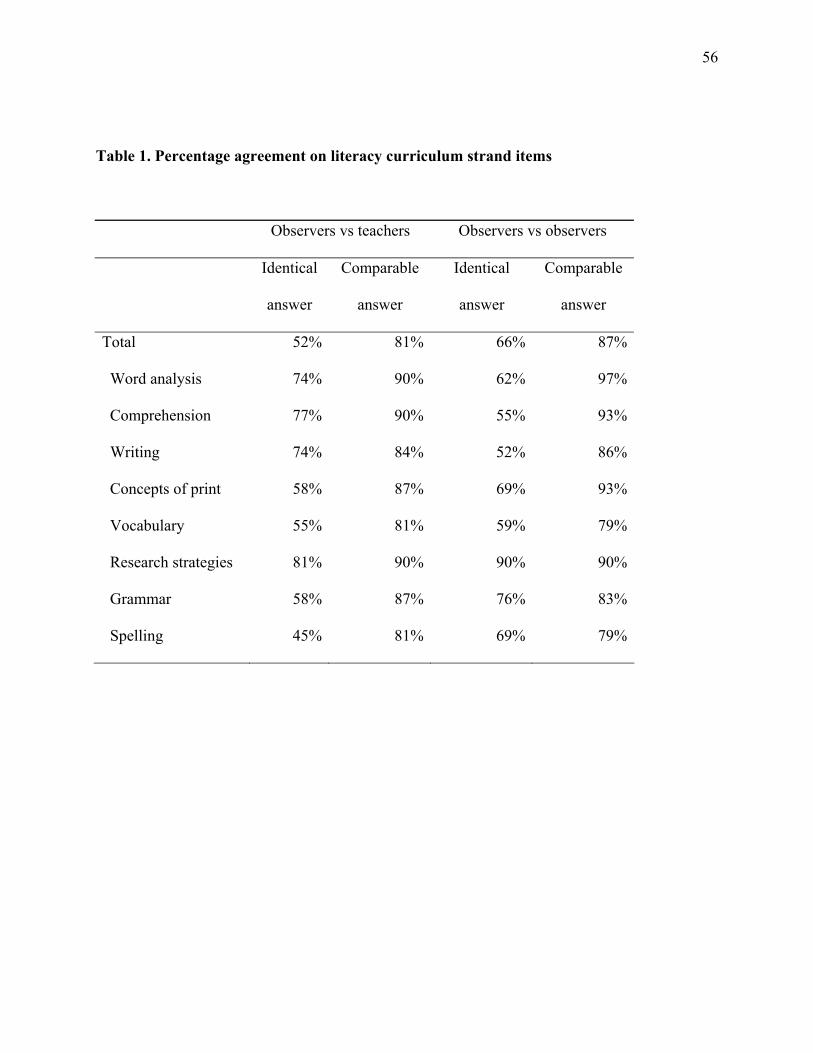
56
Table 1. Percentage agreement on literacy curriculum strand items
Observers vs teachers Observers vs observers
Identical
answer
Comparable
answer
Identical
answer
Comparable
answer
Total 52% 81% 66% 87%
Word analysis 74% 90% 62% 97%
Comprehension 77% 90% 55% 93%
Writing 74% 84% 52% 86%
Concepts of print 58% 87% 69% 93%
Vocabulary 55% 81% 59% 79%
Research strategies 81% 90% 90% 90%
Grammar 58% 87% 76% 83%
Spelling 45% 81% 69% 79%
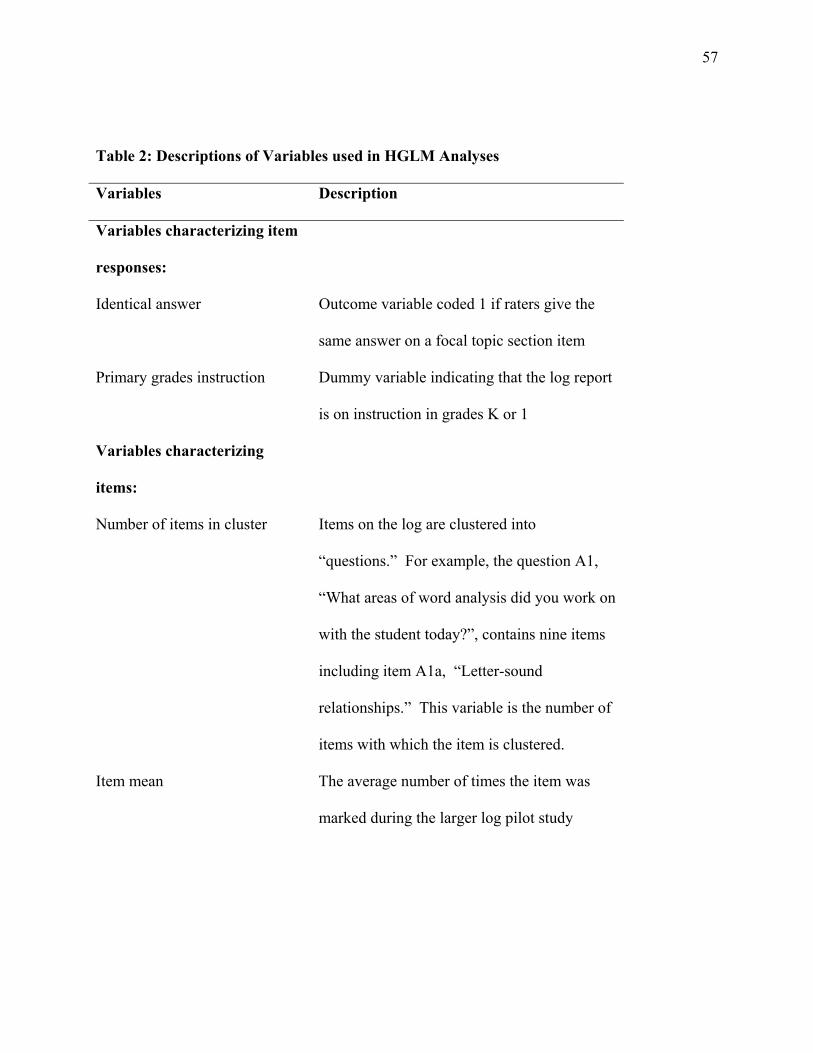
57
Table 2: Descriptions of Variables used in HGLM Analyses
Variables Description
Variables characterizing item
responses:
Identical answer Outcome variable coded 1 if raters give the
same answer on a focal topic section item
Primary grades instruction Dummy variable indicating that the log report
is on instruction in grades K or 1
Variables characterizing
items:
Number of items in cluster Items on the log are clustered into
“questions.” For example, the question A1,
“What areas of word analysis did you work on
with the student today?”, contains nine items
including item A1a, “Letter-sound
relationships.” This variable is the number of
items with which the item is clustered.
Item mean The average number of times the item was
marked during the larger log pilot study
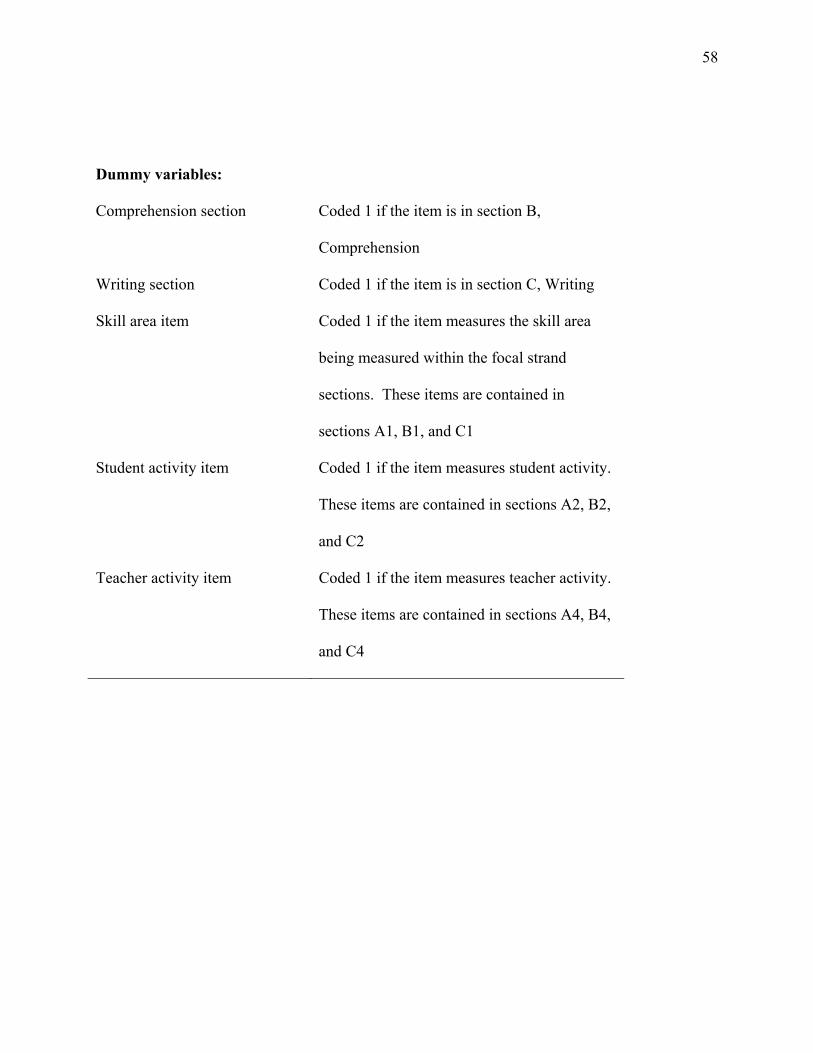
58
Dummy variables:
Comprehension section Coded 1 if the item is in section B,
Comprehension
Writing section Coded 1 if the item is in section C, Writing
Skill area item Coded 1 if the item measures the skill area
being measured within the focal strand
sections. These items are contained in
sections A1, B1, and C1
Student activity item Coded 1 if the item measures student activity.
These items are contained in sections A2, B2,
and C2
Teacher activity item Coded 1 if the item measures teacher activity.
These items are contained in sections A4, B4,
and C4
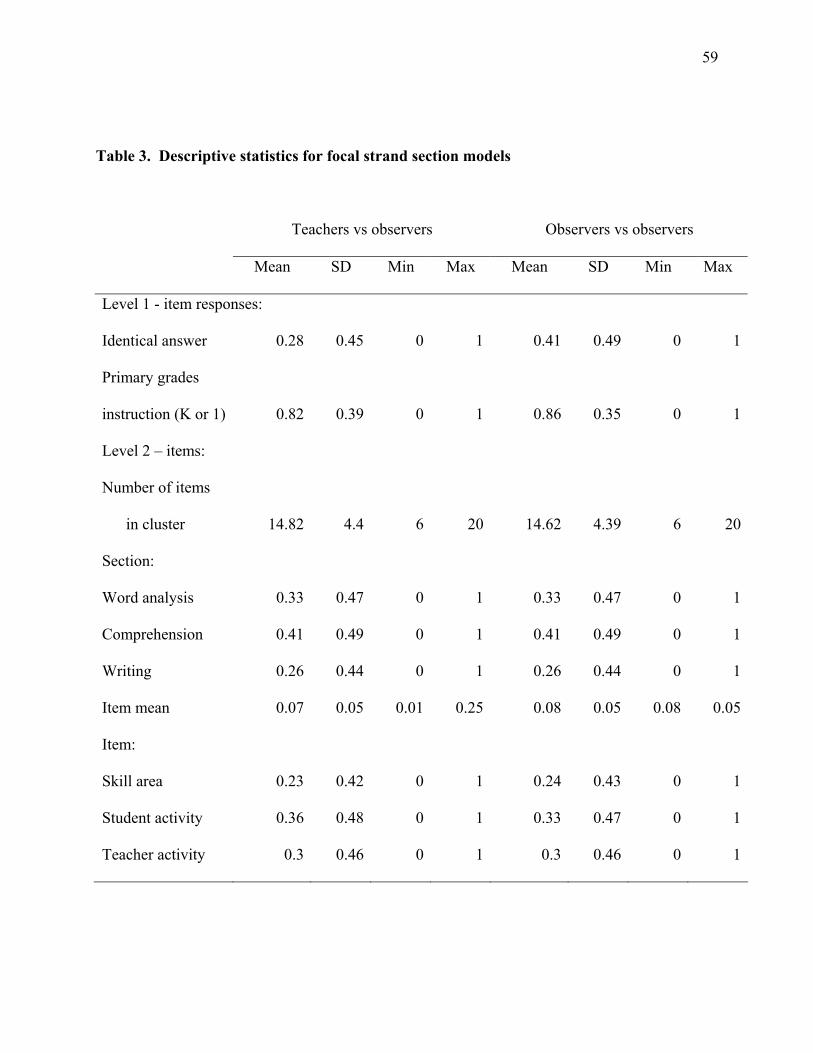
59
Table 3. Descriptive statistics for focal strand section models
Teachers vs observers Observers vs observers
Mean SD Min Max Mean SD Min Max
Level 1 - item responses:
Identical answer 0.28 0.45 0 1 0.41 0.49 0 1
Primary grades
instruction (K or 1) 0.82 0.39 0 1 0.86 0.35 0 1
Level 2 – items:
Number of items
in cluster 14.82 4.4 6 20 14.62 4.39 6 20
Section:
Word analysis 0.33 0.47 0 1 0.33 0.47 0 1
Comprehension 0.41 0.49 0 1 0.41 0.49 0 1
Writing 0.26 0.44 0 1 0.26 0.44 0 1
Item mean 0.07 0.05 0.01 0.25 0.08 0.05 0.08 0.05
Item:
Skill area 0.23 0.42 0 1 0.24 0.43 0 1
Student activity 0.36 0.48 0 1 0.33 0.47 0 1
Teacher activity 0.3 0.46 0 1 0.3 0.46 0 1

60
Table 4. Conditional Models for Exact Matches on Items in Focal Strand Sections
Teacher vs Observer Observer vs Observer
Coef Se Coef Se
Intercept -2.140 .416 *** -.946 .468 *
Level 1 – item responses:
Primary-grades instruction .627 .165 *** .145 .226
Level 2 – items:
Number of items in cluster -.080 .037 * -.029 .040
Item mean 13.243 1.888 *** 9.981 2.190 ***
Section:
Comprehension -.489 .258 -.437 .301
Writing -.602 .252 * -.182 .291
Item:
Skill area .693 .362 .112 .387
Student activity 1.086 .483 * .254 .509
Teacher activity .722 .407 -.495 .434
Residual Level 2 variance .398 *** .354 **
*** p≤.001, ** p≤.01, * p≤.05

61

62
Table 5. Predicted Probability Of Matching on Focal Strand Items, by Focal Strand
Section, Item Incidence, And Rater Pairing
Observer vs teacher Observer vs observer
Item/Incidence
Word analysis item:
Average incidence 0.335 0.431
Above-average incidence 0.494 0.555
Maximum incidence 0.845 0.820
Comprehension item:
Average incidence 0.236 0.328
Above-average incidence 0.375 0.446
Maximum incidence 0.770 0.747
Writing item:
Average incidence 0.216 0.387
Above average incidence 0.349 0.510
Maximum incidence 0.750 0.792
Note—Categories for item incidence were obtained by evaluating the predictor “item mean” at
the following cutoff points: “average incidence” (the overall mean across all items, or .07);
“above average incidence” (1 sd above the overall mean, 07+.05=.12); and “maximum
incidence” (the maximum item mean among all 148 items, or .25).