assessing the structural integrity and remaining life of ... · pdf fileassessing the...
TRANSCRIPT

Prepared by Stress Engineering Services, Inc.
ETCE 99 - Symposium on Plant and FacilitiesReliability and Mechanical Integrity
Assessing the structural integrity and remaining life of Coke Drums withAcoustic Emission Testing, Strain Gaging, and Finite Element Analysis
Claudio Allevato, ASNT AET LIII – Stress Engineering Services, Inc. – Houston, TxRichard S. Boswell, P.E. – Stress Engineering Services, Inc. – Houston, Tx
The ProcessThe three primary coking processes used worldwide to produce petroleum coke are : delayed,fluid, and flexicoker. The vast majority of the refineries utilize the delayed coking process.Delayed coking produces one of two types of coke: sponge or needle. Sponge coke is thepredominant type being produced nowadays.
Delayed coke drums are vertical pressure vessels (ASME Div.1), with a wide range ofdimensions, from 15 to 30 feet diameter, and 55 to 90 feet height. Their metallurgy also varieswith their vintage, going from Carbon Steel to Cr-Mo alloys, to more recent attempts using3%Cr material. Delayed coking is a cyclic operation with batch duration (cycles) from as low as10 hours to as long as 48 hours. In a conventional delayed coker unit, the feed is heated toapproximately 900 oF and is pumped into a vertical drum through the bottom inlet line.
The drum is normally filled to levels rarely exceeding 85% of its capacity. Upon filling the drumto its optimum level, the heated fluids are allowed to stand inside the drum for a few hours,during which time carbon dissociation happens. This dissociated carbon deposit itself over theinternal surface of the drum, forming a solid mass of coke. Steam and water are introduced intothe drum through the bottom feed line, quenching the solid coke and the drum itself to lowertemperatures.
Quench water is drained from the drum in a process finalized with the opening of the top andbottom covers of the drum so that a drill stem can be lowered into the drum. After the blade drillhas bored through the coke bed, high pressure water jets from the base of the stem are used to“cut” and dismantle the coke from the drum, allowing it to fall through the lower opening into apit, or rail car. The entire cycle is repeated once the drum is cleaned with steam, and bothopenings are closed again. Cycle times are an important variable in the process due to theirimpact on achieving maximum liquid yield from a coker. Maximizing coker throughput isnormally desirable in a typical refinery operation. This can maximize liquid yield with cleanerdistillates or even cracked distillates, and gas.
A typical coker cycle in terms of temperature and stress is illustrated in Figure 1. A uniquefeature observed globally throughout the drum is the short term increase in stress during quenchas the drum is cooled, followed by a release of the stress usually midway through the quench.This result will vary from cycle to cycle. Older vessels nearing end of useful life are oftendistorted with bulges and permanent growth of the shell. This geometry increases the problemthrough several mechanisms contributing to low cycle fatigue. In general, through wall crackingdevelops near the circumferential seams

1999 Engineering Sources Technology Conference & Exhibition Page 2
Prepared by Stress Engineering Services, Inc.
Vertical seams may have small craze cracking, but rarely if ever have through wall cracks. Theplate between seams may distort and have defect driven cracks, but rarely crack independently ofa circumference seam. Cracking typically happens during water quench.
Figure 1: An example coking cycle with stress measured near a bulge in 1994.
History of Problems
Historically, coke drums have presented very few significant integrity problems. The vastmajority of their structural and mechanical occurrences are related to bulging of the shell, andgeneral cracking. Cracking occurs in circumferential welds, conical bottom, skirt supports,nozzles, top semi-elliptical head, insulation supports, etc. Several cases of throughwall crackscan be reported in any one particular year. In most instances, these throughwall cracks causevapor and fluid leaks, with rare fires. It is unknown if human life has ever been exposed to riskof death, as a consequence of a failure of a coke drum. Human lives have been lost in coker unitsthough, but not due to a direct failure of a coke drum. Their relative low pressure (30 to 50 psig),associated with their high elevation off the ground level (low traffic areas), causes little concernswith the possibility of a rare catastrophic failure. Most of the consequences associated with acoke drum failure are economical, due to the disruption of the refining process, and down time ofthe coking operation itself. Typically, if a significant failure occurs, a coker unit can be out-of-service for a period of time ranging from a few days, to as much as a few months, depending onthe magnitude of the integrity problems encountered, and the complexity/extent of the repairprocedures.
-10000
-5000
0
5000
10000
15000
20000
25000
30000
35000
40000
45000
50000
55 57 59 61 63 65 67 69 71 73 75 77 79 81 83 85 87 89 91 93 95
Elapsed Time, hr.
Str
ess,
PS
I
0
100
200
300
400
500
600
700
800
900
Tem
per
atu
re, o
F
Hoop Stress Axial Stress Temp

1999 Engineering Sources Technology Conference & Exhibition Page 3
Prepared by Stress Engineering Services, Inc.
Traditional Inspection Methods
Coke drums have always been treated as regular pressure vessels, as far as inspection methodsand procedures. However, coke drums should be treated as vessels subjected to low cyclefatigue. The traditional approach to inspect coke drums include building of internal and/orexternal scaffolding and the application of 100% inspection with conventional methods such asVisual Testing (VT), Magnetic Particle Testing (MT), Dye Penetrant Testing (PT), andUltrasonic Testing (UT). This type of approach often resulted in long turnaround time, due to theextent of the inspection work, plus the elevated expenses for scaffolding building, in addition toinsulation removal and replacement. The results obtained were very inconclusive due to the factthat internal inspection could not always detect external (OD connected) cracking. Similarly,external inspection could not always detect internal (ID connected) cracking. Often, the drumsexperienced leaks soon after the completion of a turnaround. When cracking was detected,improper repairs were executed and sometimes cracking returned with faster propagation ratesshortly after the unit’s start-up. Additionally, the coke drum’s geometry/shape could not beproperly inspected for bulges. Old methodology included mechanical devices used to measurevariations on the drum’s diameter from top to bottom, often with inaccurate results. Theeconomical pressures on carrying out such extensive and crude methodology reached a pointwhere some refinery operators would flood the coke drum with water, and utilize boats to“navigate” around the the drums internal surface to conduct inspection, with potentially seriousconsequences in case of accidents.
New Inspection Methodology
In the mid 1980’s, it became clear that something else had to be done for assessing the structuralintegrity of coke drums. The cases of unplanned shutdowns and leaks were mounting. Oldercokers were reaching life limits well beyond their original design life. Market and strategicdemands forced operators to reduce even further the cycle time of most coker units in the U.S.and abroad. Replacement of old drums became an important factor in managing the refinery’soperations and future goals. A combination of fairly old and well-proven techniques was broughttogether to produce the data and the answers to most of the questions which arose from thesecircumstances.
These techniques are Acoustic Emission Testing (AET), High Temperature Strain Gaging(HTSG), and Finite Element Analysis (FEA).
The combined data and information that was obtained from the application of these threetechniques brought light into a dark environment were lack of documented data was causinginconsistent decisions, and errors.

1999 Engineering Sources Technology Conference & Exhibition Page 4
Prepared by Stress Engineering Services, Inc.
Acoustic Emission Testing
Acoustic emission testing has been successfully applied around the globe for the last 35 years toinspect pressure vessels, reactors, piping, and a wide range of metallic and FRP equipment. Theuse of AET to monitor coke drums in-service started in the mid 1980’s. AET has also been usedto monitor new coke drums when being subjected to the initial acceptance hydrostatic testrequired by ASME code. Figures 2 and 3 show new coke drums being fabricated and latermonitored with AE during the acceptance hydrotest. The primary objectives of the AETmonitoring are as follows:
• Detection of active cracking, both ID and OD connected, covering 100% of the drum’ssurface.
• Location and mapping of the areas with active cracking.• Prioritization of active discontinuities in order to support proper planning for scaffolding
building, inspection and repairs during upcoming shutdowns.• To determine the presence and approximate location of fabrication defects on new coke
drums (both acceptable and rejectable by the fabrication code), so proper repairs can beexecuted. This approach aim at avoiding the presence of small defects that can and will act as“nucleation sites” for future thermal fatigue crack growth.
Figure 16 at the end of this report illustrates the distribution of AE sensors over the surface of atypical coke drum. The application of the AET on in-service drums is often accompanied withskin weldable thermocouples. The thermocouples (TC) have an important role on this approach.The TC’s produce the temperature trends experienced by the drum’s outer surface, both duringheat-up and quench. These temperature fluctuations are sometimes very fast. Quench rates of3000 0F/hour have been documented in the industry. Although very fast, these quench rates lastfor only a few minutes. Nevertheless, their impact on the thermal stresses imposed on the drum’ssurface, and across their wall thickness, is significant. Values in excess of the yield strength oftypical coke drum materials have been often measured (strain gaging) in the field.
The presence of bulges will accelerate the crack growth because of their local curvature. Thiseffect of the axial temperature gradient and increased interaction with solid coke is much moresevere on a bulged and corrugated shell than it is on a new, almost cylindrical shell.

1999 Engineering Sources Technology Conference & Exhibition Page 5
Prepared by Stress Engineering Services, Inc.
Figure 2: New coke drums to be tested with Acoustic Emission during fabrication.
Figure 3: AE tests during special hydrotesting of new drums assured the client offabrication integrity.

1999 Engineering Sources Technology Conference & Exhibition Page 6
Prepared by Stress Engineering Services, Inc.
Strain Gages and Coke Drums
Strain Gages are uniaxial resistive element sensors attached to the outer wall of a coke drum. Asthey are stretched or shortened their resistance changes, and the Wheatstone Bridge circuitryconverts this to an output voltage which can be scaled as microstrain. A data logger records thesesignals, as well as associated temperature. Because of the hazardous conditions of coke drumservice, all sensor leads from the data logger must be protected with intrinsically safe electronicbarriers to prevent sparking at the vessel. If only a few cycles are to be recorded in conjunctionwith AE monitoring, the system is usually allowed to operate with Hot Work Permittingrequiring regular testing for combustible gas.
ASTM specification E 1319 for high temperature strain gages describes the operation andconstruction of sensors suitable for this application. There are several requirements for cokedrums:
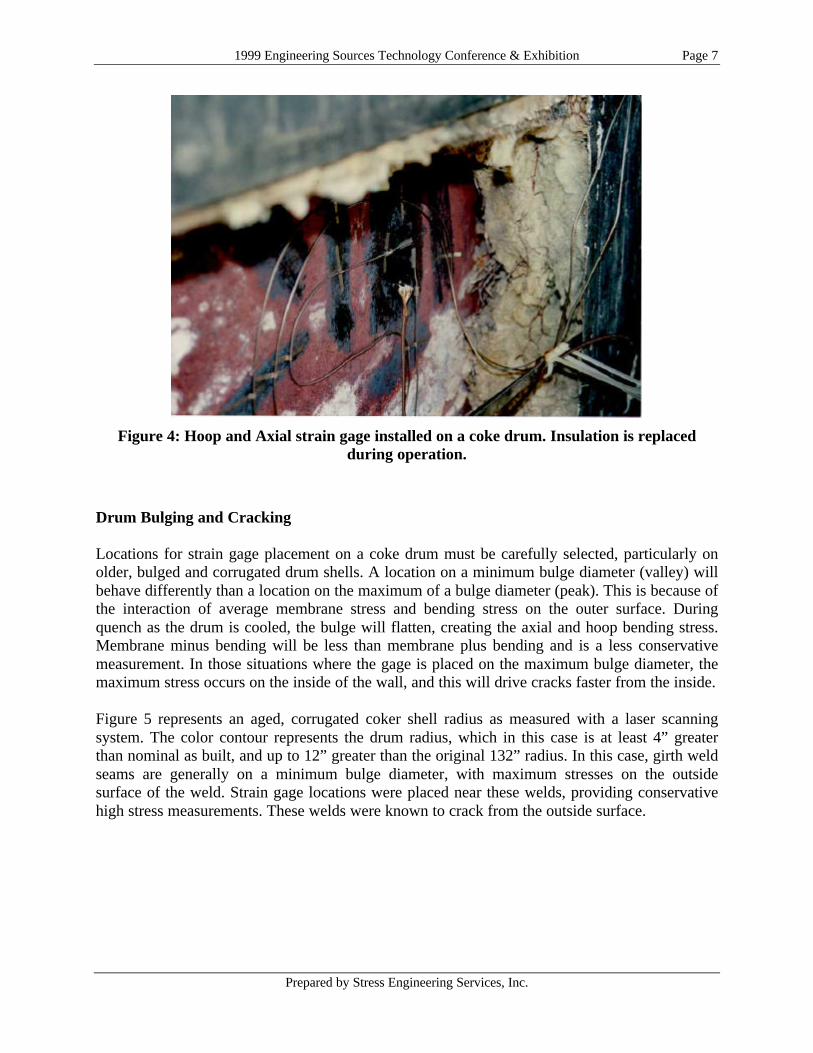
1) Reliable cyclic accuracy at high temperatures up to 900 oF .2) Rugged construction to resist water and oil damage at ambient and elevated temperatures.3) Manageable deployment and installation.4) Operable with intrinsic safety barriers. Figure 4 shows a typical installation of 2 strain gages on a drum (hoop & axial) with theircompanion thermocouple. A practical strain gage for the application is constructed of a Platinum Tungsten wire filamentcapable of 1100 oF . This material is very temperature sensitive, and the strain gage will includean active measurement element and a non-active bridge completing element. This creates onehalf of a Wheatstone bridge circuit. The wire filaments are packaged in a small tube with a non-conducting powder tightly surrounding the filaments. This tube is welded on a thin shim and thewires are contained in a small stainless steel tubing. The unit is installed with low powercapacitive discharge devices which provides a row of point welds along both sides of the shim.As the drum stretches, the strain gage stretches.
The gage is packaged with a small circuit board which has the resistive components to completethe circuit as a full bridge. This package eliminates most of the temperature induced error. Themanufacturer provides data for each sensor to calculate apparent strain error as a function oftemperature which must be measured at each location. This is performed during the processingof the recorded measurements.
Calibration is accomplished with resistive shunting across one leg of the Wheatstone bridgecircuit. By placing a known resistance across a specific resistance leg of the bridge, the outputvoltage of the circuit will change in a predictable manner to represent a specific microstrain.These calculations must also consider the temperature at which calibration is performed.
1999 Engineering Sources Technology Conference & Exhibition Page 7
Prepared by Stress Engineering Services, Inc.
Figure 4: Hoop and Axial strain gage installed on a coke drum. Insulation is replacedduring operation.
Drum Bulging and Cracking
Locations for strain gage placement on a coke drum must be carefully selected, particularly onolder, bulged and corrugated drum shells. A location on a minimum bulge diameter (valley) willbehave differently than a location on the maximum of a bulge diameter (peak). This is because ofthe interaction of average membrane stress and bending stress on the outer surface. Duringquench as the drum is cooled, the bulge will flatten, creating the axial and hoop bending stress.Membrane minus bending will be less than membrane plus bending and is a less conservativemeasurement. In those situations where the gage is placed on the maximum bulge diameter, themaximum stress occurs on the inside of the wall, and this will drive cracks faster from the inside.
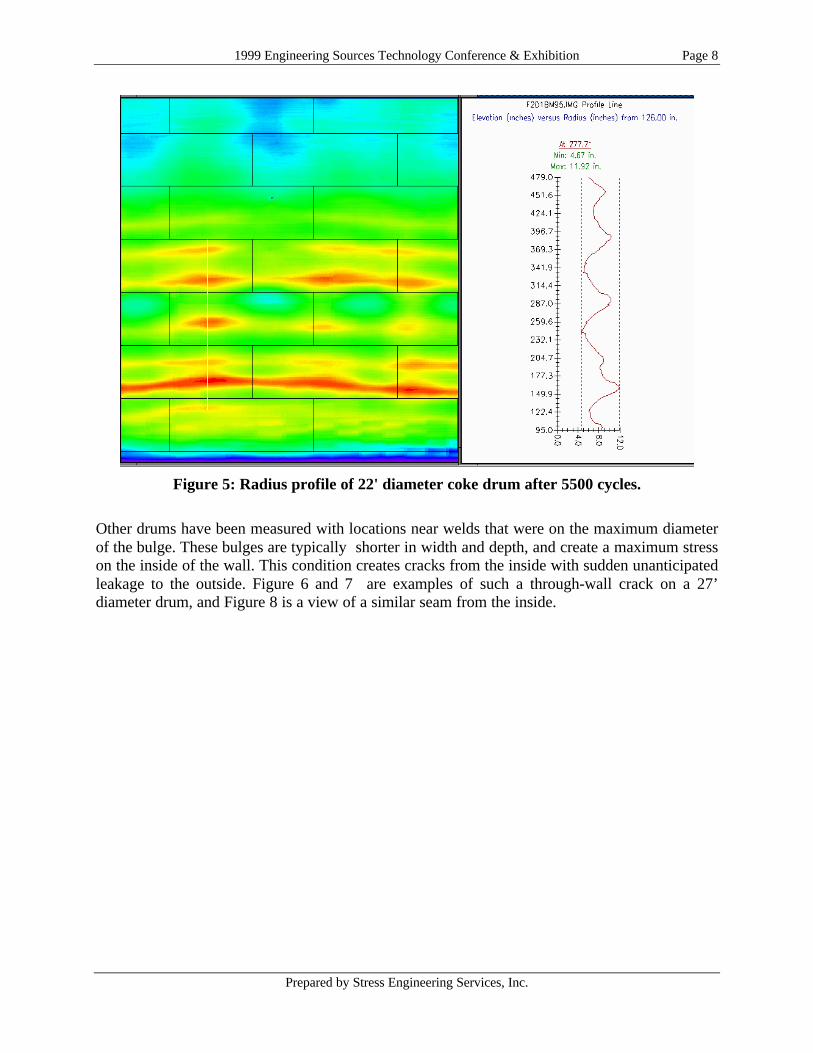
Figure 5 represents an aged, corrugated coker shell radius as measured with a laser scanningsystem. The color contour represents the drum radius, which in this case is at least 4” greaterthan nominal as built, and up to 12” greater than the original 132” radius. In this case, girth weldseams are generally on a minimum bulge diameter, with maximum stresses on the outsidesurface of the weld. Strain gage locations were placed near these welds, providing conservativehigh stress measurements. These welds were known to crack from the outside surface.
1999 Engineering Sources Technology Conference & Exhibition Page 8
Prepared by Stress Engineering Services, Inc.
Figure 5: Radius profile of 22' diameter coke drum after 5500 cycles.
Other drums have been measured with locations near welds that were on the maximum diameterof the bulge. These bulges are typically shorter in width and depth, and create a maximum stresson the inside of the wall. This condition creates cracks from the inside with sudden unanticipatedleakage to the outside. Figure 6 and 7 are examples of such a through-wall crack on a 27’diameter drum, and Figure 8 is a view of a similar seam from the inside.

1999 Engineering Sources Technology Conference & Exhibition Page 9
Prepared by Stress Engineering Services, Inc.
Figure 6: A crack detected during fill with hot oil in 27’ drum.
Figure 7: A larger crack developed in 27’ drum during quench after repair from outside.

1999 Engineering Sources Technology Conference & Exhibition Page 10
Prepared by Stress Engineering Services, Inc.
Figure 8: Typical cracking on all girth seams inside the 27’ diameter drum.
Although coke drums are designed with the rules of ASME Section VIII, Div 1 pressure vessels,they typically fail from low cycle fatigue at the skirt and at circumferential shell seams. Verticalseams rarely fail. Crack formation suggests very high axial stress acting across the weld. Straingage measurements on corrugated drums have shown that a high stress develops during quenchas cooling increases up the drum. The maximum stress is achieved midway during the coolingand then releases. This stress is generally large enough to create low cycle fatigue failure whichappears at the weakest points of the vessel, typically weld seams with defects and undercuts,combined with bi-metallic weld construction. A typical sample removed from a 22’ diameterdrum is shown in Figure 9. This sample shows small OD cracking on either side of the weld, anda very large defect on the ID.

1999 Engineering Sources Technology Conference & Exhibition Page 11
Prepared by Stress Engineering Services, Inc.
Figure 9: OD cracking is visible on either side of girth weld, and a large crack is present onthe ID through the cladding. Sample taken from 22’ diameter drum.
Measurements on Operating Coke Drum
Strain gage measurements at a single location will be influenced by local conditions as well asglobal conditions. Variations can create unusually large stress due to local hot or cold spot zonescreated by water channeling between the solidified coke mass and the vessel wall. This localactivity combined with local bulge geometry produces variations in Principal Stress associatedwith hoop and axial directions. Some cycles can produce tensions and others compression ofeither component. When one Principal Stress is tension and the other compression, bi-axial sheardevelops with a Stress Intensity greater than either Principal Stress.
Low cycle fatigue is a function of the cyclic range of the Stress Intensity. Consequently,measurement of only one component such as the axial strain, can mislead the interpretation ofthe cycle severity. Both hoop and axial strain measurements should be measured, corrected fortemperature, calculated as Principal Stress, and combined as Stress Intensity. When a significantnumber of cycles are recorded, the variation of stress at a location can be represented as ahistogram with high and low stress occurrences represented as the extremes of the histogram.This information can be useful in many different studies of the vessel.
Figures 10 and 11 show stress histograms extrapolated from 126 measured cycles. Also includedon these plots is the Usage Factor (as %) attributed to each stress range. The Usage Factor asused by the ASME Code is a Miner’s Rule summation of the damage accumulation. For eachstress range, the Usage Factor is a ratio of the number of occurrences per number allowed by thefatigue curve. This is also known as the Damage Accumulation Rule. For a vessel design, these

1999 Engineering Sources Technology Conference & Exhibition Page 12
Prepared by Stress Engineering Services, Inc.
ratios should sum to less than unity. This is traditionally evaluated with alternating stress ranges.However, better correlation with actual failures has been observed when the full stress range isused, removing some conservatism of the design curves.
In these examples a large axial damage accumulation is shown (1.55) as a result of bulgeinfluence. The hoop stress damage is less sensitive to bulge interaction and slightly exceedsunity. This demonstrates that once bulges begin to form, the increase in axial stress willencourage cracking of the circumferential seams.
The large stress ranges at the extreme right can be attributed to local channel flow creating localcooling which stretches circumference of the shell in local tension. For axial stress to be high,bulges are locally contracted to generate this stress direction. As demonstrated in these figures,the extreme stress generate a large percentage of the damage for only a few occurrences.Contributions from coke interaction will be discussed in greater detail in a subsequent paper bythe authors.
This concept is described in great detail in Patents awarded this year (US Patents 5,795,445 and5,827,403). These describe procedures which provide a high yield stress in the plate material ,and closely matching elastic properties of the welds and base plate to prevent and delay the onsetof bulging. Without the presence of bulges, the axial stress damage should be less than hoopdamage. Once bulging begins, it becomes self destructive with every cycle.
Bulged Drum Axial Stress Range
0
100
200
300
400
500
600
700
800
900
1000
1100
1200
10 15 20 25 30 35 40 45 50 55 60 65 70 75 80 85 90 100
110
115
Axial Stress Range, Ksi
Ext
rap
ola
ted
Cyc
le C
ou
nt
0%
1%
2%
3%
4%
5%
6%
7%
8%
9%
10%
11%
12%
13%
14%
15%
16%
17%
18%
19%
20%
Total Axial Usage at 5500 Cycles = 155%
% U
sag
e F
acto
r b
ased
on
Ran
ge
Axial Stress
% Usage
Figure 10: Histogram of axial stress range measured on 22' diameter drum.

1999 Engineering Sources Technology Conference & Exhibition Page 13
Prepared by Stress Engineering Services, Inc.
The necessity for bi-axial strain gages is shown in the typical but interesting measurementsrecorded on a 27’ diameter drum in Figure 12 and 13. Ideally a three gage rectangular rosettecould be used to account for actual direction of the Principal Stress. When Hoop and Axial gageplacement is used, the inherent assumption is that these are the Principal directions.
These gages were placed near a weld seam centered on a short length bulge associated withcracking from the inside out. Consequently, they are measuring Membrane minus Bending. Asthe bulge flattens, Axial stress is expected to be lower on the outside than on the inside. In Figure12 the hoop stress is compression while the axial stress is tension. This is known as bi-axial shearwith Stress Intensity equal to the difference in these two maximums, approximately 70 Ksi .Fatigue is usually estimated as a function of the Stress Intensity.
As observed in Figure 13, the quench is not only rapid at the beginning, but can be significantlydelayed only 90 degrees around the circumference.
Bulged Drum Hoop Stress Range
0
100
200
300
400
500
600
700
800
900
1000
1100
1200
10 15 20 25 30 35 40 45 50 55 60 65 70 75 80 85 90 100
105
115
Hoop Stress Range, Ksi
Ext
rap
ola
ted
Cyc
le C
ou
nt
0%
1%
2%
3%
4%
5%
6%
7%
8%
9%
10%
11%
12%
13%
14%
15%
16%
17%
18%
19%
20%
Total Hoop Usage at 5500 Cycles = 105%
% U
sag
e F
acto
r b
ased
on
Ran
ge
Hoop stress
% Usage
Figure 11: Histogram for Hoop Stress range measured on 22' diameter drum.

1999 Engineering Sources Technology Conference & Exhibition Page 14
Prepared by Stress Engineering Services, Inc.
Figure 12: Quench stress on 27' diameter drum shows bi-axial shear.
Figure 13: Quench stress on another 27' diameter drum shows delays in coolingat same elevation.

1999 Engineering Sources Technology Conference & Exhibition Page 15
Prepared by Stress Engineering Services, Inc.
Finite Element Analysis
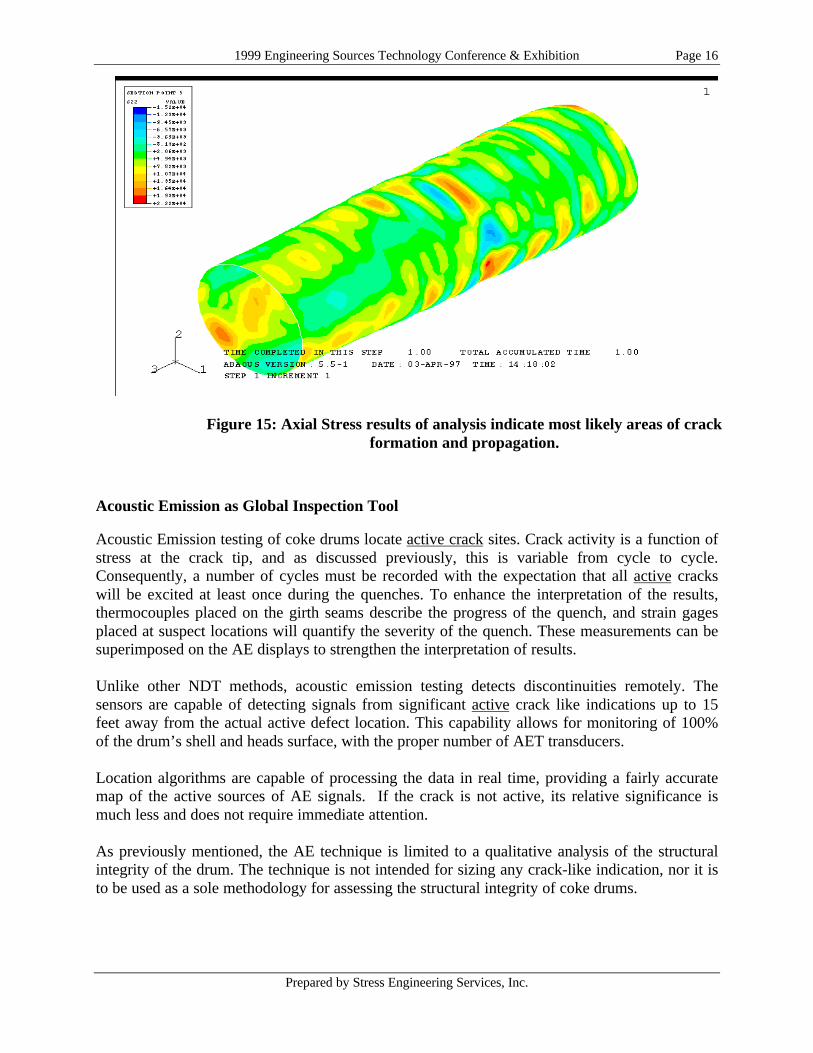
A simple and effective method of evaluating the influence of bulging in a corrugated vessel is tosolve a finite element model with internal pressure loading. The profile data displayed in Figure5 is easily exported in a format, which can be used for finite element geometry. Figure 6 displayssuch a model using 3-D shell elements capable of providing membrane and bending stress. Aninternal pressure load will create local stress gradients due to ring bending and an extension ofthe bulge. Stress contour results indicate locations with highest stress and these will be the mostlikely candidates for crack propagation. Figure 7 is an example of stress plots. Other loadingscan be applied to the model such as local and global thermal gradients, and coke crushing due toradial interference.
Figure 14: A finite element model created from laser scan contour data dramaticallyshows the extent of bulging..
1999 Engineering Sources Technology Conference & Exhibition Page 16
Prepared by Stress Engineering Services, Inc.
Acoustic Emission as Global Inspection Tool
Acoustic Emission testing of coke drums locate active crack sites. Crack activity is a function ofstress at the crack tip, and as discussed previously, this is variable from cycle to cycle.Consequently, a number of cycles must be recorded with the expectation that all active crackswill be excited at least once during the quenches. To enhance the interpretation of the results,thermocouples placed on the girth seams describe the progress of the quench, and strain gagesplaced at suspect locations will quantify the severity of the quench. These measurements can besuperimposed on the AE displays to strengthen the interpretation of results.
Unlike other NDT methods, acoustic emission testing detects discontinuities remotely. Thesensors are capable of detecting signals from significant active crack like indications up to 15feet away from the actual active defect location. This capability allows for monitoring of 100%of the drum’s shell and heads surface, with the proper number of AET transducers.
Location algorithms are capable of processing the data in real time, providing a fairly accuratemap of the active sources of AE signals. If the crack is not active, its relative significance ismuch less and does not require immediate attention.
As previously mentioned, the AE technique is limited to a qualitative analysis of the structuralintegrity of the drum. The technique is not intended for sizing any crack-like indication, nor it isto be used as a sole methodology for assessing the structural integrity of coke drums.
Figure 15: Axial Stress results of analysis indicate most likely areas of crackformation and propagation.

1999 Engineering Sources Technology Conference & Exhibition Page 17
Prepared by Stress Engineering Services, Inc.
When combined with other complementary engineering and analysis tools, AET can serve as avaluable management tool to estimate the extent of repairs, and optimize human and budgetaryresources to be used in maintaining or extending operations supporting a delayed coker unit.

1999 Engineering Sources Technology Conference & Exhibition Page 18
Prepared by Stress Engineering Services, Inc.
Figure 16: Location of Acoustic Emission sensors for global inspection of a coke drum.