assessing the role of cladogenesis in macroevolution by ... · assessing the role of cladogenesis...
TRANSCRIPT
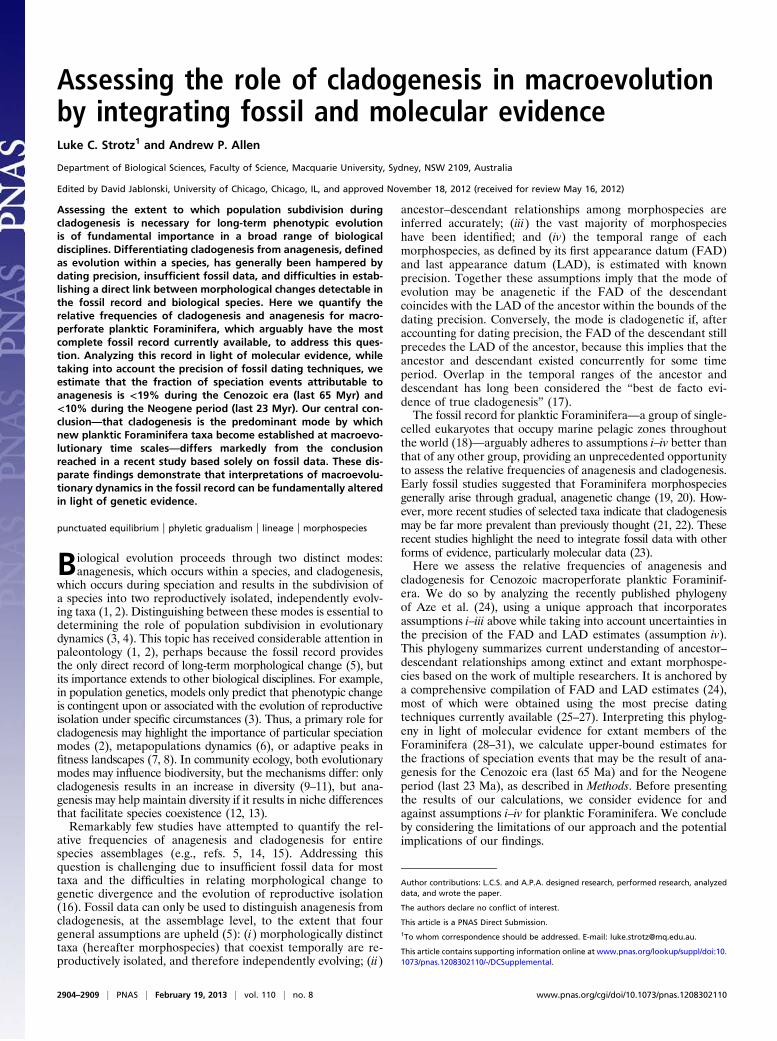
Assessing the role of cladogenesis in macroevolutionby integrating fossil and molecular evidenceLuke C. Strotz1 and Andrew P. Allen
Department of Biological Sciences, Faculty of Science, Macquarie University, Sydney, NSW 2109, Australia
Edited by David Jablonski, University of Chicago, Chicago, IL, and approved November 18, 2012 (received for review May 16, 2012)
Assessing the extent to which population subdivision duringcladogenesis is necessary for long-term phenotypic evolutionis of fundamental importance in a broad range of biologicaldisciplines. Differentiating cladogenesis from anagenesis, definedas evolution within a species, has generally been hampered bydating precision, insufficient fossil data, and difficulties in estab-lishing a direct link between morphological changes detectable inthe fossil record and biological species. Here we quantify therelative frequencies of cladogenesis and anagenesis for macro-perforate planktic Foraminifera, which arguably have the mostcomplete fossil record currently available, to address this ques-tion. Analyzing this record in light of molecular evidence, whiletaking into account the precision of fossil dating techniques, weestimate that the fraction of speciation events attributable toanagenesis is <19% during the Cenozoic era (last 65 Myr) and<10% during the Neogene period (last 23 Myr). Our central con-clusion—that cladogenesis is the predominant mode by whichnew planktic Foraminifera taxa become established at macroevo-lutionary time scales—differs markedly from the conclusionreached in a recent study based solely on fossil data. These dis-parate findings demonstrate that interpretations of macroevolu-tionary dynamics in the fossil record can be fundamentally alteredin light of genetic evidence.
punctuated equilibrium | phyletic gradualism | lineage | morphospecies
Biological evolution proceeds through two distinct modes:anagenesis, which occurs within a species, and cladogenesis,
which occurs during speciation and results in the subdivision ofa species into two reproductively isolated, independently evolv-ing taxa (1, 2). Distinguishing between these modes is essential todetermining the role of population subdivision in evolutionarydynamics (3, 4). This topic has received considerable attention inpaleontology (1, 2), perhaps because the fossil record providesthe only direct record of long-term morphological change (5), butits importance extends to other biological disciplines. For example,in population genetics, models only predict that phenotypic changeis contingent upon or associated with the evolution of reproductiveisolation under specific circumstances (3). Thus, a primary role forcladogenesis may highlight the importance of particular speciationmodes (2), metapopulations dynamics (6), or adaptive peaks infitness landscapes (7, 8). In community ecology, both evolutionarymodes may influence biodiversity, but the mechanisms differ: onlycladogenesis results in an increase in diversity (9–11), but ana-genesis may help maintain diversity if it results in niche differencesthat facilitate species coexistence (12, 13).Remarkably few studies have attempted to quantify the rel-
ative frequencies of anagenesis and cladogenesis for entirespecies assemblages (e.g., refs. 5, 14, 15). Addressing thisquestion is challenging due to insufficient fossil data for mosttaxa and the difficulties in relating morphological change togenetic divergence and the evolution of reproductive isolation(16). Fossil data can only be used to distinguish anagenesis fromcladogenesis, at the assemblage level, to the extent that fourgeneral assumptions are upheld (5): (i) morphologically distincttaxa (hereafter morphospecies) that coexist temporally are re-productively isolated, and therefore independently evolving; (ii)
ancestor–descendant relationships among morphospecies areinferred accurately; (iii) the vast majority of morphospecieshave been identified; and (iv) the temporal range of eachmorphospecies, as defined by its first appearance datum (FAD)and last appearance datum (LAD), is estimated with knownprecision. Together these assumptions imply that the mode ofevolution may be anagenetic if the FAD of the descendantcoincides with the LAD of the ancestor within the bounds of thedating precision. Conversely, the mode is cladogenetic if, afteraccounting for dating precision, the FAD of the descendant stillprecedes the LAD of the ancestor, because this implies that theancestor and descendant existed concurrently for some timeperiod. Overlap in the temporal ranges of the ancestor anddescendant has long been considered the “best de facto evi-dence of true cladogenesis” (17).The fossil record for planktic Foraminifera—a group of single-
celled eukaryotes that occupy marine pelagic zones throughoutthe world (18)—arguably adheres to assumptions i–iv better thanthat of any other group, providing an unprecedented opportunityto assess the relative frequencies of anagenesis and cladogenesis.Early fossil studies suggested that Foraminifera morphospeciesgenerally arise through gradual, anagenetic change (19, 20). How-ever, more recent studies of selected taxa indicate that cladogenesismay be far more prevalent than previously thought (21, 22). Theserecent studies highlight the need to integrate fossil data with otherforms of evidence, particularly molecular data (23).Here we assess the relative frequencies of anagenesis and
cladogenesis for Cenozoic macroperforate planktic Foraminif-era. We do so by analyzing the recently published phylogenyof Aze et al. (24), using a unique approach that incorporatesassumptions i–iii above while taking into account uncertainties inthe precision of the FAD and LAD estimates (assumption iv).This phylogeny summarizes current understanding of ancestor–descendant relationships among extinct and extant morphospe-cies based on the work of multiple researchers. It is anchored bya comprehensive compilation of FAD and LAD estimates (24),most of which were obtained using the most precise datingtechniques currently available (25–27). Interpreting this phylog-eny in light of molecular evidence for extant members of theForaminifera (28–31), we calculate upper-bound estimates forthe fractions of speciation events that may be the result of ana-genesis for the Cenozoic era (last 65 Ma) and for the Neogeneperiod (last 23 Ma), as described in Methods. Before presentingthe results of our calculations, we consider evidence for andagainst assumptions i–iv for planktic Foraminifera. We concludeby considering the limitations of our approach and the potentialimplications of our findings.
Author contributions: L.C.S. and A.P.A. designed research, performed research, analyzeddata, and wrote the paper.
The authors declare no conflict of interest.
This article is a PNAS Direct Submission.1To whom correspondence should be addressed. E-mail: [email protected].
This article contains supporting information online at www.pnas.org/lookup/suppl/doi:10.1073/pnas.1208302110/-/DCSupplemental.
2904–2909 | PNAS | February 19, 2013 | vol. 110 | no. 8 www.pnas.org/cgi/doi/10.1073/pnas.1208302110

Evaluating AssumptionsAdherence to assumptions i–iv above requires a largely completefossil record. The Cenozoic fossil record for planktic Forami-nifera is among the most well resolved for any group in terms ofboth taxonomic and temporal resolution owing to: high abun-dance and global ubiquity in marine pelagic zones (18), highpreservation potential of their calcium carbonate shells in marinesediments, extensive spatial and temporal coverage of sampling,and a consistent and well-established system of taxonomic clas-sification (24).Assumptions i and ii are generally consistent with molecular
studies, but exceptions have been observed. Analyses of smallsubunit ribosomal DNA (SSU rDNA) data for 19 extant mor-phospecies (of ∼50) indicate that morphospecies are gener-ally monophyletic, and that ancestor–descendant relationshipsamong morphospecies are accurately inferred from fossils atlower levels of the phylogeny (33, 34). One noted exception tomonophyly among extant morphospecies is Globigerinoidesruber, which is now recognized as comprising two distinct cladeson the basis of molecular evidence (35). Inconsistencies be-tween molecular and fossil data are largely confined to theplacement of higher-order clades, where SSU rDNA diver-gences are high and relationships are difficult to resolve (36).Although not all ancestor–descendant relationships are yet wellestablished (24), the general concordance of molecular- andfossil-based methods at lower taxonomic levels suggests that the“stratophenetic” method of delineating ancestor–descendantrelationship by tracing specimens of intermediate morphologyback through time (37) is quite robust. More generally, thisconcordance is consistent with data indicating that shell traitsoften have a genetic basis that is sufficiently strong and con-servative to allow discrimination among clades at macroevolu-tionary time scales (Table 1). Given that the shell characteristicsused for planktic Foraminifera identification are the same forextinct and extant taxa, the findings of molecular studies arerelevant for interpreting fossil assemblages (30). In particular,they suggest that assumptions i and ii are also upheld for extinctmorphospecies.Assumption iii is supported by compiled data (38) presented in
Fig. 1, which provides clear evidence of an asymptote in the rateof discovery of new morphospecies between 1826 and 2001 (Fig.1A). Analyzing these data using the method proposed by Bebberet al. (39), we estimate that ∼96% [95% confidence interval (CI)of 96–100%] of all planktic Foraminifera morphospecies (bothextinct and extant) have already been described (Fig. 1B).Consequently, it is unsurprising that recent taxonomic work hasfocused primarily on clarifying and refining phylogenetic rela-tionships among already described morphospecies (40, 41) and
subdividing morphospecies on the basis of finer-scale morpho-logical differences (28, 31, 42, 43) (Table 1).Assigning precision estimates (assumption iv) to the FAD and
LAD data, in part, entails consideration of three sources ofdating error: disturbance of the sediments in which the taxonoccurs after initial deposition or during collection, resulting ina mixing of sediments of varying age; regional diachroneity oftaxon occurrence due to expansion and contraction of a taxon’sgeographic range; and resolution of the chronostratigraphictechniques used to date the sediments (44). The first two sourcesaffect dating at particular locations, but are largely controlled forwhen estimating FAD and LAD because consensus estimates areobtained by selecting the data deemed to be most reliable fromamong multiple locations (24). Chronostratigraphic resolution istherefore the primary source of error and, importantly, varieswith sediment age. For the Neogene period (last 23 Ma), changesin sediment properties through time can be detected and cor-related with Milankovitch glacial–interglacial cycles, resulting ina dating resolution of ±0.005 Ma to ±0.046 Ma (45). By contrast,for the Paleogene period (65–23 Ma ago), the most accuratedating method makes use of cycles in geomagnetic polarity,resulting in a dating resolution of ±0.380 Ma (46). As thesedating methods have known levels of precision, they can be usedto assign maximum precision estimates to the FAD and LADdata, following assumption iv.Despite evidence in support of assumptions i–iv, there are two
limitations in using morphospecies-level FAD and LAD data todistinguishing anagenesis from cladogenesis. First, Foraminiferaspecimens are generally assigned to morphospecies based ontheir similarity to designated holotypes (47). Whereas the holo-type concept is inherently static and typological, a population isa dynamic entity composed of individuals of varying morphology(37). If individuals at the extremes of the morphotype distribu-tion of an evolving population, rather than the mean morpho-type, are used to estimate FAD and LAD, overlap in thetemporal ranges of the “ancestor” and “descendant” of a singlepopulation undergoing anagenesis may occur (Fig. 2A). Thisphenomenon, which we refer to as “typological error,” can beavoided by defining FAD and LAD on the basis of frequencydistributions of morphotypes, but detailed morphometric studiesof this type are rare (e.g., ref. 48). In the absence of data todirectly estimate the magnitude of typological error, we considera range of values for the total error, defined as the sum of thedating error and the typological error, as well as other forms ofevidence (Methods).The second challenge is that a number of studies have pre-
sented molecular evidence that morphospecies generally containmultiple “cryptic” genotypes that correspond to distinct bi-ological species (30, 35, 49). Whereas these findings lend further
Table 1. Foraminiferal morphological characters that have been demonstrated to reflect genetically distinct populations
Morphological character Independent evidence
Test outline Test outlines differ among genetically, ecologically, and biogeographically distinct populationswithin Globigerinella siphonifera (42) and Truncorotalia truncatulinoides (31, 54).
Chamber morphology Compression of the final two chambers can be used to discriminate among genetically distinctpopulations within Globigerinoides ruber (49).
Coiling direction Sinistral and dextral forms of the morphospecies Neogloboquadrina pachyderma correspond toecologically and genetically distinct species with different temperature tolerances and biogeographicdistributions (68, 69).
Relative frequencies of sinistral and dextral forms vary among genetically, ecologically,and biogeographically distinct populations of Truncorotalia truncatulinoides (31).
Porosity Populations of Orbulina universa that vary in porosity are genetically distinct and have differentbiogeographic distributions (28, 42, 43).
Test outline and chamber morphology have been used historically to differentiate morphospecies. Coiling direction has only recently been confirmed asa character of taxonomic significance (68). Porosity is not currently recognized as a diagnostic character.
Strotz and Allen PNAS | February 19, 2013 | vol. 110 | no. 8 | 2905
EVOLU
TION

support to the argument that Foraminifera morphospecies arereproductively isolated (assumption i), the existence of crypticbiological species limits what can be inferred from morphospe-cies-level data. In particular, it implies the following: (i) a singleanagenetic event at the morphospecies-level may correspond tomultiple cladogenetic events at the biological species level (13);(ii) a cladogenetic event at the biological species level may occurat the time of morphospecies-level divergence or may precede it(Fig. 2C), as has been proposed for the Fohsella lineage on thebasis of isotopic evidence (22); and (iii) there are many instancesof cladogenesis at the biological species level that leave no tracein the fossil record at the morphospecies level. For all three ofthese reasons, morphospecies-level data cannot be used to assess
the relative frequencies of anagenesis and cladogenesis at thebiological species level if such species are cryptic, as is the casefor planktic Foraminifera.
MethodsGiven the central importance of temporal coexistence of the ancestor anddescendant in establishing cladogenesis, following assumption i, we con-servatively assume that an ancestor–descendant pair represents a potentialanagenetic event unless both taxa are extant, which implies temporal co-existence and hence cladogenesis, or evidence exists to establish temporalcoexistence at some time in the past. In our analysis, we consider threeforms of evidence, in sequence, that can be used to establish an event ascladogenetic: stratigraphic evidence that the FAD of the descendant isolder than the LAD of the ancestor; morphometric evidence that the an-cestor and descendant exhibit distinguishable peaks in morphospace duringthe time period of range overlap; and/or phylogenetic evidence that anancestor gave rise to several descendants over a short time period. Ininstances where detailed investigation of a particular speciation event failsto uncover evidence of cladogenesis, we identify that event as putativeanagenesis (e.g., ref. 50).
In the first stage of analysis, we assess whether there is stratigraphic ev-idence of temporal range overlap for each ancestor–descendant pair afteraccounting for dating and typological errors. We calculate overlap using theFAD and LAD data compiled by Aze et al. (24). This compilation comprisespredominantly recent studies, but also includes some older studies that usedating techniques that are less precise than those now available for Neo-gene events. For the Neogene, we therefore assume a dating error of ±0.1Ma, which is similar in magnitude to estimates reported for Neogene dia-toms (±0.08 Ma) (51). For the Paleogene, we assume a dating error of ±0.4Ma based on the chronostratigraphic resolution (46). For typological error,direct estimates are unavailable, so we instead assume total errors (= datingerrors + typological errors) of ±0.3 Ma for the Neogene and ±1.2 Ma for thePaleogene. We thus identify an event as cladogenetic at this stage of theanalysis if temporal range overlap exceeds a total-error margin of 0.6 Ma fora Neogene event or 2.4 Ma for a Paleogene event. These margins were se-lected based on the maximum reported range-overlap values for putativeanagenetic events during the Neogene (0.4 Ma for Globorotalia terminalis–Globorotalia sphericomiozea) (48) and Paleogene (1.5 Ma for Morozovellaangulata–Morozovella conicotruncata) (52). Our chosen total-error marginsexceed these values by 50% and are therefore expected to be conservative.
In the second stage, we consider morphometric evidence. We use thisevidence in two ways. First, for events where range overlap is less than thetotal-error margin, but exceeds the dating-error margin (i.e., 0.2 Ma and0.8 Ma for Neogene and Paleogene events, respectively), we can refutetypological error and thus identify an event as cladogenetic, if there existsempty morphospace between the ancestor and descendant (24). This isbecause typological error can only occur if the frequency distributions ofmorphotypes for the ancestor and descendant exhibit overlap in mor-phospace (Fig. 2).
Second, we can identify an event as cladogenetic where, in the samesediment sample, ancestor and descendant have frequency distributions inmorphospace that are statistically distinguishable, because this implies thatthe two taxa were contemporaneous (21, 48, 50). This morphometric ap-proach is supported by theory (20) and by detailed ecological and geneticstudies of extant planktic Foraminifera taxa (28, 31, 42, 43, 53, 54).
In the final stage, we consider phylogenetic evidence for cases wherea single ancestral morphotype produces two or more descendants within thebounds of our total-error margins. Given our assumption that ancestor–descendant relationships are accurate (assumption ii), for an ancestral taxonto have given rise to two descendants sequentially, it must have remainedextant after the emergence of the first descendant to give rise to the seconddescendant. Thus, the ancestor must have existed concurrently with its firstdescendant, implying that a cladogenetic event occurred.
Results and DiscussionOf 337 Cenozoic speciation events (24), 31.2% are identified aspotentially anagenetic (95% CI: 26.4–36.2%; 105 events) basedsolely on stratigraphic evidence (Table S1). Restricting consid-eration to the 122 Neogene events, which are dated at higherprecision, 18.9% are identified as potentially anagenetic basedonly on stratigraphic evidence (95% CI: 12.3–26.2%; 23 events).Incorporating morphological and phylogenetic evidence reducesthe Cenozoic estimate from 31.2 to 19.0% (95% CI: 14.8–23.1%;
1850 1900 1950 2000
10
20
30
40
50
600500400300200100
Calendar Year
Des
crib
ed M
orph
ospe
cies
600
0
A
B
Mor
phsp
ecie
s D
isco
very
Rat
e
Described Morphospecies
Fig. 1. Number of planktic foraminiferal taxa described from 1826 to 2001(data from ref. 38). (A) Cumulative number of described species is plotted asa function of time. The curve is asymptotic, indicating that there remainfew undescribed species as of 2001. (B) Statistical approach of Bebber et al.(39) is used to estimate the asymptotic number of species by fittinga function that describes how the annualized rate of discovery (y axis) variesin relation to the number of species already described (x axis). The esti-mated total number of species corresponds to the number of species atwhich the rate of species discovery is equal to 0. The line is a cubic functionthat was fitted to the data using ordinary-least-squares regression. Themodel predicts a total of 622 planktic Foraminifera taxa (95% CI: 598–625)with 598 taxa discovered as of 2001.
2906 | www.pnas.org/cgi/doi/10.1073/pnas.1208302110 Strotz and Allen
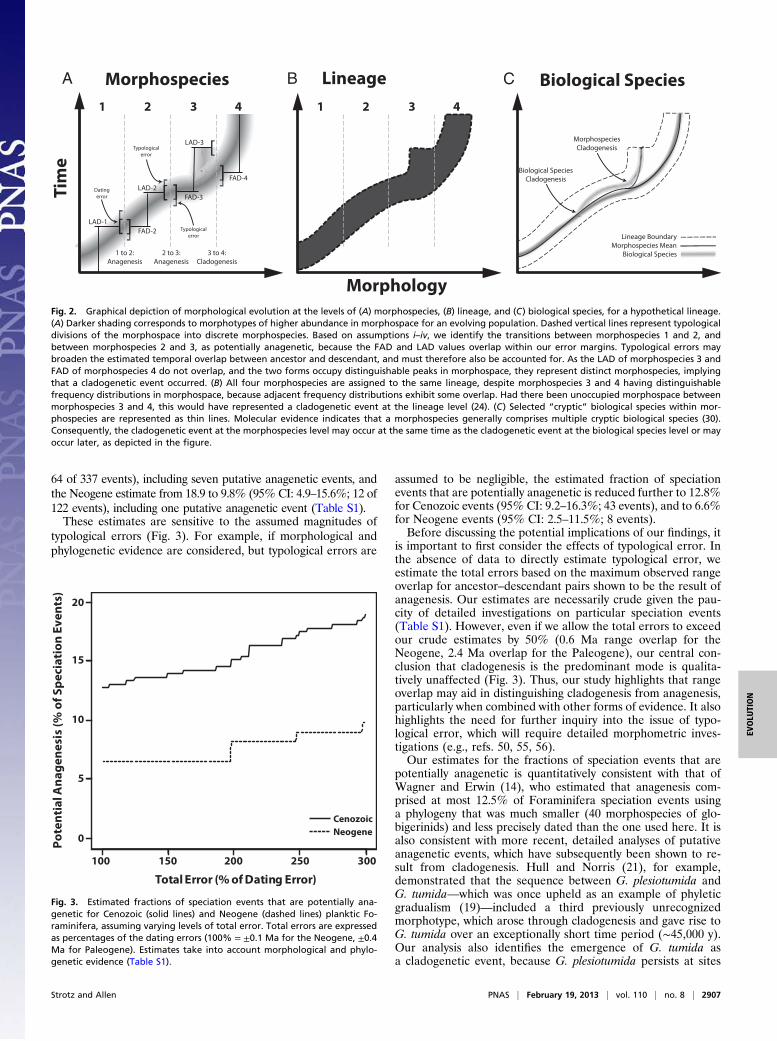
64 of 337 events), including seven putative anagenetic events, andthe Neogene estimate from 18.9 to 9.8% (95% CI: 4.9–15.6%; 12 of122 events), including one putative anagenetic event (Table S1).These estimates are sensitive to the assumed magnitudes of
typological errors (Fig. 3). For example, if morphological andphylogenetic evidence are considered, but typological errors are
assumed to be negligible, the estimated fraction of speciationevents that are potentially anagenetic is reduced further to 12.8%for Cenozoic events (95% CI: 9.2–16.3%; 43 events), and to 6.6%for Neogene events (95% CI: 2.5–11.5%; 8 events).Before discussing the potential implications of our findings, it
is important to first consider the effects of typological error. Inthe absence of data to directly estimate typological error, weestimate the total errors based on the maximum observed rangeoverlap for ancestor–descendant pairs shown to be the result ofanagenesis. Our estimates are necessarily crude given the pau-city of detailed investigations on particular speciation events(Table S1). However, even if we allow the total errors to exceedour crude estimates by 50% (0.6 Ma range overlap for theNeogene, 2.4 Ma overlap for the Paleogene), our central con-clusion that cladogenesis is the predominant mode is qualita-tively unaffected (Fig. 3). Thus, our study highlights that rangeoverlap may aid in distinguishing cladogenesis from anagenesis,particularly when combined with other forms of evidence. It alsohighlights the need for further inquiry into the issue of typo-logical error, which will require detailed morphometric inves-tigations (e.g., refs. 50, 55, 56).Our estimates for the fractions of speciation events that are
potentially anagenetic is quantitatively consistent with that ofWagner and Erwin (14), who estimated that anagenesis com-prised at most 12.5% of Foraminifera speciation events usinga phylogeny that was much smaller (40 morphospecies of glo-bigerinids) and less precisely dated than the one used here. It isalso consistent with more recent, detailed analyses of putativeanagenetic events, which have subsequently been shown to re-sult from cladogenesis. Hull and Norris (21), for example,demonstrated that the sequence between G. plesiotumida andG. tumida—which was once upheld as an example of phyleticgradualism (19)—included a third previously unrecognizedmorphotype, which arose through cladogenesis and gave rise toG. tumida over an exceptionally short time period (∼45,000 y).Our analysis also identifies the emergence of G. tumida asa cladogenetic event, because G. plesiotumida persists at sites
Tim
e
Morphology
1 2
Lineage3 4
LAD-2
1
LAD-1
2
FAD-3
FAD-2
Morphospecies3
LAD-3
4
]]FAD-4
[
3 to 4:
Cladogenesis
2 to 3:
Anagenesis
1 to 2:
Anagenesis
[[
Typological
error
Typological
error
Dating
error
Biological Species
Morphospecies
Cladogenesis
Lineage Boundary
Morphospecies MeanBiological Species
Biological SpeciesCladogenesis
[[ ]]
]]
A B C
Fig. 2. Graphical depiction of morphological evolution at the levels of (A) morphospecies, (B) lineage, and (C) biological species, for a hypothetical lineage.(A) Darker shading corresponds to morphotypes of higher abundance in morphospace for an evolving population. Dashed vertical lines represent typologicaldivisions of the morphospace into discrete morphospecies. Based on assumptions i–iv, we identify the transitions between morphospecies 1 and 2, andbetween morphospecies 2 and 3, as potentially anagenetic, because the FAD and LAD values overlap within our error margins. Typological errors maybroaden the estimated temporal overlap between ancestor and descendant, and must therefore also be accounted for. As the LAD of morphospecies 3 andFAD of morphospecies 4 do not overlap, and the two forms occupy distinguishable peaks in morphospace, they represent distinct morphospecies, implyingthat a cladogenetic event occurred. (B) All four morphospecies are assigned to the same lineage, despite morphospecies 3 and 4 having distinguishablefrequency distributions in morphospace, because adjacent frequency distributions exhibit some overlap. Had there been unoccupied morphospace betweenmorphospecies 3 and 4, this would have represented a cladogenetic event at the lineage level (24). (C) Selected “cryptic” biological species within mor-phospecies are represented as thin lines. Molecular evidence indicates that a morphospecies generally comprises multiple cryptic biological species (30).Consequently, the cladogenetic event at the morphospecies level may occur at the same time as the cladogenetic event at the biological species level or mayoccur later, as depicted in the figure.
Total Error (% of Dating Error)
Pote
ntia
l Ana
gene
sis
(% o
f Spe
ciat
ion
Even
ts)
0
5
10
15
20
100 150 200 250 300
CenozoicNeogene
Fig. 3. Estimated fractions of speciation events that are potentially ana-genetic for Cenozoic (solid lines) and Neogene (dashed lines) planktic Fo-raminifera, assuming varying levels of total error. Total errors are expressedas percentages of the dating errors (100% = ±0.1 Ma for the Neogene, ±0.4Ma for Paleogene). Estimates take into account morphological and phylo-genetic evidence (Table S1).
Strotz and Allen PNAS | February 19, 2013 | vol. 110 | no. 8 | 2907
EVOLU
TION
other than the one where G. tumida first appeared for a periodof 1.3 Ma (24). Another example is the evolution of late Neo-gene lineage Sphaeroidinella, which was once considered a primeexample of anagenesis (57). However, subsequent work has shownthat the emergence of the descendant taxon was restricted to
a portion of the ancestral taxon’s range (58), implying that theevent was cladogenetic.We do not mean to imply that phenotypic evolution occurs
only during cladogenesis; temporal changes in phenotype are welldocumented for morphospecies. Lazarus et al. (59), for example,showed that Truncorotalia crassaformis, Truncorotalia tosaensis,and Truncorotalia truncatulinoides all exhibited significant variationthrough time in test size and shape. However, these changesentailed random shifts in phenotype space about a mean, implyingquasistasis, rather than directional changes in morphology. Usinga random-walk model of phenotypic evolution, Hunt (60) wasable to define and test for stasis, and found good support for itbefore and after the transition fromG. plesiotumida toG. tumida.In light of such findings, our results could be viewed as supportiveof Futuyma’s (3) qualified version of punctuated equilibrium,which predicts that phenotypic changes through time are gen-erally ephemeral, owing to habitat changes and extinction andinterbreeding among local populations, unless accompanied bythe evolution of reproductive isolation, which allows phenotypicdifferences to persist over time scales long enough to be observedin the fossil record.Our estimate for the relative frequency of anagenesis is far
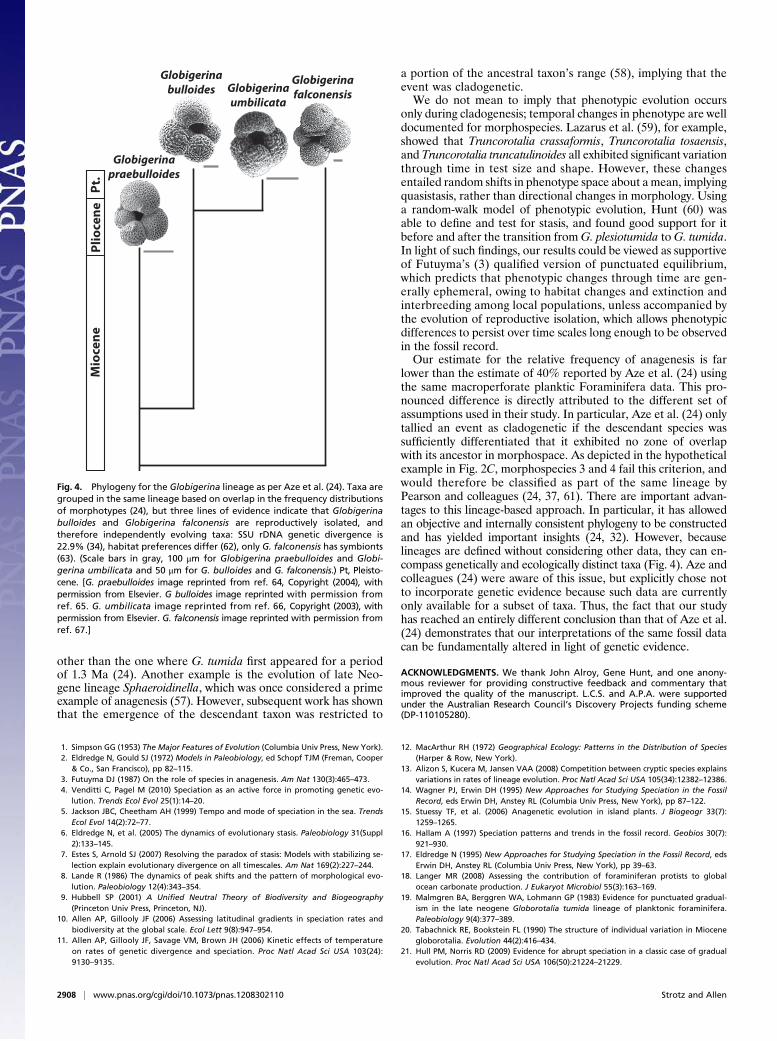
lower than the estimate of 40% reported by Aze et al. (24) usingthe same macroperforate planktic Foraminifera data. This pro-nounced difference is directly attributed to the different set ofassumptions used in their study. In particular, Aze et al. (24) onlytallied an event as cladogenetic if the descendant species wassufficiently differentiated that it exhibited no zone of overlapwith its ancestor in morphospace. As depicted in the hypotheticalexample in Fig. 2C, morphospecies 3 and 4 fail this criterion, andwould therefore be classified as part of the same lineage byPearson and colleagues (24, 37, 61). There are important advan-tages to this lineage-based approach. In particular, it has allowedan objective and internally consistent phylogeny to be constructedand has yielded important insights (24, 32). However, becauselineages are defined without considering other data, they can en-compass genetically and ecologically distinct taxa (Fig. 4). Aze andcolleagues (24) were aware of this issue, but explicitly chose notto incorporate genetic evidence because such data are currentlyonly available for a subset of taxa. Thus, the fact that our studyhas reached an entirely different conclusion than that of Aze et al.(24) demonstrates that our interpretations of the same fossil datacan be fundamentally altered in light of genetic evidence.
ACKNOWLEDGMENTS. We thank John Alroy, Gene Hunt, and one anony-mous reviewer for providing constructive feedback and commentary thatimproved the quality of the manuscript. L.C.S. and A.P.A. were supportedunder the Australian Research Council’s Discovery Projects funding scheme(DP-110105280).
1. Simpson GG (1953) The Major Features of Evolution (Columbia Univ Press, New York).2. Eldredge N, Gould SJ (1972) Models in Paleobiology, ed Schopf TJM (Freman, Cooper
& Co., San Francisco), pp 82–115.3. Futuyma DJ (1987) On the role of species in anagenesis. Am Nat 130(3):465–473.4. Venditti C, Pagel M (2010) Speciation as an active force in promoting genetic evo-
lution. Trends Ecol Evol 25(1):14–20.5. Jackson JBC, Cheetham AH (1999) Tempo and mode of speciation in the sea. Trends
Ecol Evol 14(2):72–77.6. Eldredge N, et al. (2005) The dynamics of evolutionary stasis. Paleobiology 31(Suppl
2):133–145.7. Estes S, Arnold SJ (2007) Resolving the paradox of stasis: Models with stabilizing se-
lection explain evolutionary divergence on all timescales. Am Nat 169(2):227–244.8. Lande R (1986) The dynamics of peak shifts and the pattern of morphological evo-
lution. Paleobiology 12(4):343–354.9. Hubbell SP (2001) A Unified Neutral Theory of Biodiversity and Biogeography
(Princeton Univ Press, Princeton, NJ).10. Allen AP, Gillooly JF (2006) Assessing latitudinal gradients in speciation rates and
biodiversity at the global scale. Ecol Lett 9(8):947–954.11. Allen AP, Gillooly JF, Savage VM, Brown JH (2006) Kinetic effects of temperature
on rates of genetic divergence and speciation. Proc Natl Acad Sci USA 103(24):9130–9135.
12. MacArthur RH (1972) Geographical Ecology: Patterns in the Distribution of Species(Harper & Row, New York).
13. Alizon S, Kucera M, Jansen VAA (2008) Competition between cryptic species explainsvariations in rates of lineage evolution. Proc Natl Acad Sci USA 105(34):12382–12386.
14. Wagner PJ, Erwin DH (1995) New Approaches for Studying Speciation in the FossilRecord, eds Erwin DH, Anstey RL (Columbia Univ Press, New York), pp 87–122.
15. Stuessy TF, et al. (2006) Anagenetic evolution in island plants. J Biogeogr 33(7):1259–1265.
16. Hallam A (1997) Speciation patterns and trends in the fossil record. Geobios 30(7):921–930.
17. Eldredge N (1995) New Approaches for Studying Speciation in the Fossil Record, edsErwin DH, Anstey RL (Columbia Univ Press, New York), pp 39–63.
18. Langer MR (2008) Assessing the contribution of foraminiferan protists to globalocean carbonate production. J Eukaryot Microbiol 55(3):163–169.
19. Malmgren BA, Berggren WA, Lohmann GP (1983) Evidence for punctuated gradual-ism in the late neogene Globorotalia tumida lineage of planktonic foraminifera.Paleobiology 9(4):377–389.
20. Tabachnick RE, Bookstein FL (1990) The structure of individual variation in Miocenegloborotalia. Evolution 44(2):416–434.
21. Hull PM, Norris RD (2009) Evidence for abrupt speciation in a classic case of gradualevolution. Proc Natl Acad Sci USA 106(50):21224–21229.
Globigerinabulloides
Globigerinafalconensis
Globigerinapraebulloides
Plio
cene
Pt.
Globigerinaumbilicata
Mio
cene
Fig. 4. Phylogeny for the Globigerina lineage as per Aze et al. (24). Taxa aregrouped in the same lineage based on overlap in the frequency distributionsof morphotypes (24), but three lines of evidence indicate that Globigerinabulloides and Globigerina falconensis are reproductively isolated, andtherefore independently evolving taxa: SSU rDNA genetic divergence is22.9% (34), habitat preferences differ (62), only G. falconensis has symbionts(63). (Scale bars in gray, 100 μm for Globigerina praebulloides and Globi-gerina umbilicata and 50 μm for G. bulloides and G. falconensis.) Pt, Pleisto-cene. [G. praebulloides image reprinted from ref. 64, Copyright (2004), withpermission from Elsevier. G bulloides image reprinted with permission fromref. 65. G. umbilicata image reprinted from ref. 66, Copyright (2003), withpermission from Elsevier. G. falconensis image reprinted with permission fromref. 67.]
2908 | www.pnas.org/cgi/doi/10.1073/pnas.1208302110 Strotz and Allen
22. Norris RD, Corfield RM, Cartlidge J (1996) What is gradualism? Cryptic speciation ingloborotaliid foraminifera. Paleobiology 22(3):386–405.
23. Norris RD (2000) Pelagic species diversity, biogeography, and evolution. Paleobiology26(4):236–258.
24. Aze T, et al. (2011) A phylogeny of Cenozoic macroperforate planktonic foraminiferafrom fossil data. Biol Rev Camb Philos Soc 86(4):900–927.
25. Berggren WA, Kent DV, Swisher CC III, Aubry MP (1995) A revised Cenozoic geo-chronology and chronostratigraphy. Society for Sedimentary Geology Special Publi-cation 54:129–212.
26. Berggren WA, Pearson PN (2005) A revised tropical to subtropical Paleogene plank-tonic foraminiferal zonation. J Foraminiferal Res 35(4):279–298.
27. Wade BS, Pearson PN, Berggren WA, Pälike H (2011) Review and revision of Cenozoictropical planktonic foraminiferal biostratigraphy and calibration to the geomagneticpolarity and astronomical time scale. Earth Sci Rev 104(1–3):111–142.
28. de Vargas C, Norris R, Zaninetti L, Gibb SW, Pawlowski J (1999) Molecular evidence ofcryptic speciation in planktonic foraminifers and their relation to oceanic provinces.Proc Natl Acad Sci USA 96(6):2864–2868.
29. Darling KF, et al. (2000) Molecular evidence for genetic mixing of Arctic and Antarcticsubpolar populations of planktonic foraminifers. Nature 405(6782):43–47.
30. Darling KF, Wade CM (2008) The genetic diversity of planktic foraminifera and theglobal distribution of ribosomal RNA genotypes. Mar Micropaleontol 67(3–4):216–238.
31. Quillévéré F, et al. (2012) Global scale same-specimen morpho-genetic analysis ofTruncorotalia truncatulinoides: A perspective on the morphological species conceptin planktonic foraminifera. Palaeogeogr Palaeoclimatol Palaeoecol, 10.1016/j.palaeo.2011.03.013.
32. Ezard THG, Pearson PN, Aze T, Purvis A (2012) The meaning of birth and death (inmacroevolutionary birth-death models). Biol Lett 8(1):139–142.
33. de Vargas C, Zaninetti L, Hilbrecht H, Pawlowski J (1997) Phylogeny and rates ofmolecular evolution of planktonic foraminifera: SSU rDNA sequences compared tothe fossil record. J Mol Evol 45(3):285–294.
34. Stewart IA, Darling KF, Kroon D, Wade CM, Troelstra SR (2001) Genotypic variabilityin subarctic Atlantic planktic foraminifera. Mar Micropaleontol 43(1–2):143–153.
35. Aurahs R, Grimm GW, Hemleben V, Hemleben C, Kucera M (2009) Geographicaldistribution of cryptic genetic types in the planktonic foraminifer Globigerinoidesruber. Mol Ecol 18(8):1692–1706.
36. Aurahs R, et al. (2009) Using the multiple analysis approach to reconstruct phyloge-netic relationships among planktonic foraminifera from highly divergent and length-polymorphic SSU rDNA sequences. Bioinform Biol Insights 3:155–177.
37. Pearson PN (1993) A lineage phylogeny for the Paleogene Planktonic Foraminifera.Micropaleontology 39(3):193–232.
38. Stewart DRM, Pearson PN (2000) PLANKRANGE: a database of planktonic forami-niferal ranges. Available at http://palaeoglybrisacuk/Data/plankrangehtml. (Last up-date: 12/1/2002). Accessed May 10, 2012.
39. Bebber DP, Marriott FHC, Gaston KJ, Harris SA, Scotland RW (2007) Predicting un-known species numbers using discovery curves. Proc Biol Sci 274(1618):1651–1658.
40. Olsson RK, Hemleben C, Berggren WA, Huber BT (1999) Atlas of Paleocene planktonicForaminifera. Smithsonian Contributions to Paleobiology (Smithsonian InstitutionPress, Washington).
41. Pearson PN, Olsson RK, Huber BT, Hemleben C, Berggren WA (2006) Atlas of Eoceneplanktonic foraminifera. Cushman Foundation for Foraminiferal Research SpecialPublication (Cushman Foundation for Foraminiferal Research, Washington, DC).
42. Huber BT, Bijma J, Darling K (1997) Cryptic speciation in the living planktonic fora-minifer Globigerinella siphonifera (d’Orbigny). Paleobiology 23(1):33–62.
43. Morard R, et al. (2009) Morphological recognition of cryptic species in the planktonicforaminifer Orbulina universa. Mar Micropaleontol 71(3–4):148–165.
44. Pol D, Norell MA (2006) Uncertainty in the age of fossils and the stratigraphic fit tophylogenies. Syst Biol 55(3):512–521.
45. Hilgen FJ, et al. (1995) Extending the astronomical (polarity) time scale into theMiocene. Earth Planet Sci Lett 136(3–4):495–510.
46. Raffi I, et al. (2006) A review of calcareous nannofossil astrobiochronology encom-passing the past 25 million years. Quat Sci Rev 25(23–24):3113–3137.
47. Scott GH (2011) Holotypes in the taxonomy of planktonic foraminiferal morphospe-cies. Mar Micropaleontol 78(3–4):96–100.
48. Wei K-Y (1987) Multivariate morphometric differentiation of chronospecies in thelate Neogene planktonic foraminiferal lineage Globoconella. Mar Micropaleontol 12:183–202.
49. Aurahs R, Treis Y, Darling K, Kucera M (2011) A revised taxonomic and phylogeneticconcept for the planktonic foraminifer species Globigerinoides ruber based on mo-lecular and morphometric evidence. Mar Micropaleontol 79(1–2):1–14.
50. Wei K-Y, Kennett JP (1988) Phyletic gradualism and punctuated equilibrium in theLate Neogene planktonic foraminiferal clade Globoconella. Paleobiology 14(4):345–363.
51. Cody RD, Levy RH, Harwood DM, Sadler PM (2008) Thinking outside the zone: High-resolution quantitative diatom biochronology for the Antarctic Neogene. Palae-ogeogr Palaeoclimatol Palaeoecol 260:92–121.
52. Corfield RM, Granlund AH (1988) Speciation and structural evolution in the Palae-ocene Morozovella lineage (planktonic Foraminiferida). J Micropalaeontology 7(1):59–72.
53. Healy-Williams N, Ehrlich R, Williams DF (1985) Morphometric and stable isotopicevidence for subpopulations of Globorotalia truncatulinoides. J Foraminiferal Res15(4):242–253.
54. de Vargas C, Renaud S, Hilbrecht H, Pawlowski J (2001) Pleistocene adaptive radiationin Globorotalia truncatulinoides: Genetic, morphologic, and environmental evidence.Paleobiology 27(1):104–125.
55. Quillévéré F, Norris RD, Berggren WA, Aubry M-P (2000) 59.2 Ma and 56.5 Ma: Twosignificant moments in the evolution of acarininids (planktonic foraminifera). GFF122(1):131–132.
56. Soldan DM, Petrizzo MR, Silva IP, Cau A (2011) Phylogenetic relationships and evo-lutionary history of the Paleogene genus Igorina through parsimony analysis. J Fo-raminiferal Res 41(3):260–284.
57. Malmgren BA, Ku�cera M, Ekman G (1996) Evolutionary changes in supplementaryapertural characteristics of the late Neogene Sphaeroidinella dehiscens lineage(planktonic foraminifera). Palaios 11(2):192–206.
58. Kucera M (1998) Biochronology of the mid-Pliocene Sphaeroidinella event. Mar Mi-cropaleontol 35(1):1–16.
59. Lazarus D, Hilbrecht H, Spencer-Cervato C, Thierstein H (1995) Sympatric speciationand phyletic change in Globorotalia truncatulinoides. Paleobiology 21(1):28–51.
60. Hunt G (2008) Gradual or pulsed evolution: When should punctuational explanationsbe preferred? Paleobiology 34(3):360–377.
61. Pearson PN (1996) Cladogenetic, extinction and survivorship patterns from a lineagephylogeny: The Paleogene planktonic foraminifera. Micropaleontology 42(2):179–188.
62. Malmgren BA, Kennett JP (1977) Biometric differentiation between recent Globi-gerina bulloides and Globigerina falconensis in the southern Indian Ocean. J Fora-miniferal Res 7(2):130–148.
63. Hemleben C, Spindler M, Andersen OR (1989) Modern Planktonic Foraminifera(Springer, New York).
64. Pearson PN, et al. (2004) Paleogene and Cretaceous sediment cores from the Kilwaand Lindi areas of coastal Tanzania: Tanzania Drilling Project Sites 1–-5. J Afr Earth Sci39:25–62.
65. Kemle-von Mücke S, Hemleben C (1999) South Atlantic Zooplankton, ed Boltovskoy D(Backhuys Publishers, Leiden, The Netherlands), pp 43–73.
66. Eguchi NO, Ujiie H, Kawahata H, Taira A (2003) Seasonal variations in planktonicforaminifera at three sediment traps in the subarctic, transition and subtropical zonesof the central North Pacific Ocean. Mar Micropaleontol 48(1–2):149–163.
67. Boltovskoy E, Watanabe S (1986) Quaternary stratigraphy of two cores off the coastof Peru. Quaternary of South America and Antarctic peninsula 4:27–44.
68. Darling KF, Kucera M, Kroon D, Wade CM (2006) A resolution for the coiling directionparadox in Neogloboquadrina pachyderma. Paleoceanography 21(2):PA2011.
69. Darling KF, Kucera M, Pudsey CJ, Wade CM (2004) Molecular evidence links crypticdiversification in polar planktonic protists to Quaternary climate dynamics. Proc NatlAcad Sci USA 101(20):7657–7662.
Strotz and Allen PNAS | February 19, 2013 | vol. 110 | no. 8 | 2909
EVOLU
TION