assessing the potential impact of a nationwide class-based
TRANSCRIPT

Statistical Science2015, Vol. 30, No. 3, 297–327DOI: 10.1214/15-STS514© Institute of Mathematical Statistics, 2015
Assessing the Potential Impactof a Nationwide Class-BasedAffirmative Action SystemAlice Xiang and Donald B. Rubin
Abstract. We examine the possible consequences of a change in law schooladmissions in the United States from an affirmative action system based onrace to one based on socioeconomic class. Using data from the 1991–1996Law School Admission Council Bar Passage Study, students were reassignedattendance by simulation to law school tiers by transferring the affirmativeaction advantage for black students to students from low socioeconomicbackgrounds. The hypothetical academic outcomes for the students were thenmultiply-imputed to quantify the uncertainty of the resulting estimates. Theanalysis predicts dramatic decreases in the numbers of black students in toplaw school tiers, suggesting that class-based affirmative action is insufficientto maintain racial diversity in prestigious law schools. Furthermore, thereappear to be no statistically significant changes in the graduation and barpassage rates of students in any demographic group. The results thus provideevidence that, other than increasing their representation in upper tiers, currentaffirmative action policies relative to a socioeconomic-based system neithersubstantially help nor harm minority academic outcomes, contradicting thepredictions of the “mismatch” hypothesis, which asserts otherwise.
Key words and phrases: Causal inference, multiple imputation, class-basedaffirmative action, racial affirmative action, law school admissions.
1. INTRODUCTION
Affirmative action in higher education is one of themost contentious social policies of recent decades inthe United States, with polarized views that intersectat the heart of modern American values of diversity,meritocracy, and social justice. In the wake of the USSupreme Court rulings on affirmative action in Fisherv. University of Texas (2013) and Schuette v. Coalitionto Defend Affirmative Action (2014), understanding theeffects of current affirmative action policies relativeto their possible alternatives is especially relevant to-day. Although an extensive literature discusses the roleof fairness and legal precedence in affirmative action,
Alice Xiang is J. D. Candidate at Yale Law School, 127 WallSt, New Haven, Connecticut 06511. Donald B. Rubin isProfessor of Statistics, Department of Statistics, HarvardUniversity, 1 Oxford Street, Cambridge, Massachusetts02138, USA (e-mail: [email protected];[email protected]).
there have been limited empirical studies examiningthe current system and its alternatives. In particular, af-firmative action in which students receive preferentialadmissions based on their socioeconomic status (SES)has been proposed as an alternative to racial affirma-tive action (Fallon, 1995; Kahlenberg, 1996; Malamud,1997), with some studies examining the implementa-tion of SES-based affirmative action (hereafter abbre-viated as SES AA) in a few US states, yet little hasbeen done to assess empirically what the nationwideimpact of such a change in policy would be. We use the1991–1996 Law School Admission Council Bar Pas-sage Study data to simulate the outcomes of an SESAA policy and evaluate its potential impact on the de-mographic composition, graduation rates, rates of at-tempting the bar, and bar passage rates.
1.1 Existing Empirical Literature
Most of the existing empirical literature on racial af-firmative action (racial AA) has suggested that it has a
297
298 A. XIANG AND D. B. RUBIN
positive impact on racial minorities, playing a vital rolein placing minorities into more selective schools andleading to better financial aid packages and other ad-vantages for minorities (Wightman, 1997; Wightmanand Ramsey, 1998; Epple, Romano and Sieg, 2008;Arcidiacono, 2005). In contrast, the “mismatch hy-pothesis” has gained traction since the publication ofSander (2004), which contends that students enrolledin schools where they have lower academic creden-tials than their peers due to admission via affirmativeaction tend to perform more poorly than they wouldhave performed in environments where they were bet-ter matched academically to their peers. Sander (2004)controversially concludes that due to this mismatch inacademic credentials, racial AA actually hurts blackstudents in terms of their academic performance andbar passage rates and thereby leads to fewer blacklawyers than there would be without racial AA.
Sander’s analysis has been challenged, however, bya number of scholars for its mistakes in causal infer-ence (Ho, 2005; Amicus Brief, 2012). Conclusions re-garding the mismatch hypothesis have been contradic-tory, with some, including Ayres and Brooks (2005),actually finding some evidence that affirmative actionimproves academic outcomes for black students dueto a “reverse mismatch effect,” whereby student per-formance improves due to help and inspiration fromtheir academically more advanced peers and profes-sors.
To assess the effects of racial AA, the studies dis-cussed above compare the current system with a hypo-thetical counterfactual system without any AA at all,which does not reflect the policy alternatives currentlybeing debated. Even if courts ruled against racial AA,it is likely that schools would continue to implementpolicies that promote some form of diversity in admis-sions. Some studies have examined this issue by lever-aging state data from Texas and California, which (inthe late 1990s) banned racial AA in their public univer-sity admissions and essentially implemented SES AA.These studies have generally found dramatic declinesof 30–50% in the enrollment of underrepresented racialminorities due to the bans on racial AA as well asevidence for the mismatch effect (Card and Krueger,2004). According to their analyses, the ban on racialAA led to improvements in graduation rates for minor-ity students, complicating the question whether racialminorities benefit from racial AA (Arcidiacono et al.,2012).
These studies have data from both racial and SESAA and consequently should lend insight into how
schools and students respond to bans on racial AA.Nevertheless, it is difficult to say whether their con-clusions should be generalizable to a nationwide banon racial AA. California and Texas both have largeminority populations and selective public universities.Moreover, considering that their admissions systemsstill showed strong racial preferences after the ban(Long and Tienda, 2008), it is questionable whethertheir post-1990s systems can truly be considered SES-based. Finally, although these studies find significantdecreases in the numbers of minorities enrolling inschools without racial AA, this result might not holdas strongly if all schools nationally adopted SES AA.With only a few states changing to SES AA systems,minorities can opt to apply to universities that retainracial AA in order to attend more selective schools.Card and Krueger (2004) find some evidence for thischange in application behavior among less qualifiedminority students but not among highly qualified mi-nority students. If a federal ban on racial AA were in-stituted, however, there would be no advantage to mi-norities applying to universities in other states.
1.2 Overview: Simulating SES AA
Given the lack of direct empirical evidence aboutthe possible nationwide impact of switching to SESAA, we simulate the changes in enrollment across lawschool tiers (levels of prestige) and in student aca-demic outcomes (graduation and bar passage attemptsand success rates) under SES AA using data from the1991–1996 Law School Admission Council (LSAC)National Longitudinal Bar Passage Study (BPS). Lawschool admissions are particularly appropriate for sucha simulation because they are more “numbers-driven”than admissions for most other programs in higher edu-cation, depending heavily on applicants’ LSAT scoresand undergraduate GPAs, thereby decreasing the roleof unobserved applicant factors, such as extracurricu-lar activities, personal statements, and letters of rec-ommendation. Also, because a standard goal of lawschool students is to pass the bar exam, the bar pas-sage rate provides a consistent metric for student suc-cess.
Here we focus on the impact of a switch from racialAA to SES AA. We take a potential outcomes, or RubinCausal Model (Holland, 1986), approach to this prob-lem. In particular, we consider two possible treatmentassignments being applied to admit students to lawschools: the first is the actual racial AA, and the secondis a counterfactual SES AA where the same numbers oflow SES students are admitted in each tier as there were
IMPACT OF CLASS-BASED AFFIRMATIVE ACTION 299
black students admitted under the racial AA. We havedata on background characteristics and outcomes suchas tier attended, graduation, and bar attempts and pas-sage under the actual racial AA; our task is to predictwhat those outcomes would have been under the al-ternative treatment, the counterfactual SES AA. Thesepredictions will combine explicit assumptions with re-lationships between outcomes and covariates estimatedfrom the racial AA data. Because only two treatmentassignments are being considered, all students get sub-jected either to racial AA or to SES AA, and, as a re-sult, some common assumptions like the Stable UnitTreatment Value Assumption (SUTVA, Rubin, 1980)are not relevant. All assumptions are embedded withinthe imputation model being used to predict the missingpotential outcomes under SES AA. In this sense, ourframework is fully Bayesian.
We model the current AA system by estimating sep-arate “tier enrollment functions” for black students andwhite students, where “tiers” capture the relative rank-ing of law schools. For the SES AA system, studentsare reassigned to tiers by applying the black and whitestudent enrollment functions in each tier to the low andhigh SES students, respectively, thus replacing racewith SES as the selection factor for AA. Based on thesenew tier assignments, the students’ graduation ratesand bar passage rates were imputed. This process wasrepeated forty times to multiply-impute the quantitiesof interest, as recommended by Graham, Olchowskiand Gilreath (2007) for multiple imputation of 50%missing data (we have all of the results for racial AAbut are missing the results for SES AA). Thus, we wereable to compare the actual results of the current race-based system with the counterfactual results of a hypo-thetical SES-based system to assess, first, whether thelatter would yield similar racial diversity across tiersand, second, whether it would impact the graduationand bar passage rates of students across demographicgroups.
Our analysis addresses the mismatch effect wherethe source of mismatch is discrepancies in relative en-tering academic credentials (due to racial AA), whichis consistent with the definition of mismatch as used inprevious academic studies, but it does not address stu-dents’ feelings of mismatch stemming from being partof underrepresented racial groups. Although there isreason to believe that diversity, in terms of the propor-tion of black or low SES students in each institution,would have an impact on minority performance, theavailable data do not allow us to capture such effects in
our model. The data only specify the tier, not the partic-ular institution, each student attended, so the only datapossibly relevant to diversity are the proportions of mi-norities in the tiers. With only five tiers, however, suchanalyses would be too crude to allow any meaningfulconclusions about the effects of diversity without mak-ing heroic and unwarranted assumptions.
2. THE DATA
The BPS data were collected by LSAC from 1991to 1996 from over 27,000 law school students, com-prising 70% of the entire incoming law school classof 1991 in the US. Although it would be ideal to usemore recent data, unfortunately the study only spannedthese years, and (as of this writing) no comparablenationwide study with individual-level data has beenconducted since. The BPS includes the students’ un-dergraduate GPA (UGPA) and LSAT scores and thestudents’ outcomes of law school tier attended, lawschool graduation status, and bar passage status, all ob-tained from the law schools and American Bar Associ-ation jurisdictions. Also, all participating students wereadministered an Entering Student Questionnaire thatincluded self-reported race and socioeconomic back-ground. Although the questionnaire featured five racialcategories (white, black, Hispanic, Asian, and other),we focused our analysis on white and black studentsbecause the data revealed ambiguities regarding the ex-tent to which the other racial groups received prefer-ential admissions under the current affirmative actionsystem (for further discussion, see Appendix A.1). Weused the version of this dataset prepared by Sander(2004).
2.1 SES Categories
The BPS does not include direct data on the familyincome of students, but it does contain questionnaireresponses from students about their parents’ occupa-tions, education levels, and general socioeconomic sta-tus, specifically, categories of occupation (from man-ual worker to professional) and educational attainment(from high school dropout to postgraduate degree) forboth parents. Also, students ranked their family incomerelative to American families in general with optionsranging from “far below average” to “far above aver-age.”
To assign students to SES categories, we first codedthe responses for parental characteristics and generalSES on a scale from 1 to 5, with larger numbers cor-responding to higher SES. In cases where some SES

300 A. XIANG AND D. B. RUBIN
data were missing for a student, we imputed the miss-ing values. We then used the first principal componentof the SES variable as our SES score (for details of themethods used for the SES score, see Appendix A.2).This principal component summarized 60% of the vari-ance of these SES variables. We also assessed the sen-sitivity of our results by using an alternative score.1
None of the results using the alternative score signif-icantly differed and thus are not reported here.
To establish an equivalence between the actual AAsystem and our counterfactual SES one, we made the“low SES” group the same size as the black studentpopulation and the “high SES” group the same sizeas the white student population by using the corre-sponding SES score percentiles and placing the stu-dents with lower SES scores into the “low SES” cat-egory. This mapping between racial groups and SEScategories ensures that the simulated SES AA systemtargets the same number of students as the current AAsystem.
2.2 Law School Tiers
The study clustered the 163 participating law schoolsinto six tiers, with Tier 1 being the most selective andTier 5 being the least selective; Tier 6 was uniquein that it consisted largely of historically black lawschools and had disproportionately large representa-tion from minorities. It is unclear how changes in AApolicies would impact Tier 6 schools. As shown in Ta-ble 1, although the LSAT quartiles for white students inTier 6 are slightly lower than those in Tier 5, the LSAT
TABLE 1LSAT score quartiles for Tiers 5 and 6
Tier 5 Tier 6 Tier 5 Tier 6Quartile white white black black
25% 30 27 21 2150% 33 30 24 2575% 35 35 27 30
Note: Black students in Tier 6, comprising most of the Tier 6 popu-lation, have higher scores than the black students in Tier 5, whereaswhite students in Tier 5 have higher scores than the white studentsin Tier 6. It is thus difficult to rank Tier 6 relative to the other tiers.
1SES_Score = fam_inc2 + occ_mom · ed_mom + occ_dad ·ed_dad, where occ is the parent’s occupation category, ed is theparent’s educational attainment, and fam_inc is the student’s re-sponse to the general SES question. The occ and ed for each parentwere multiplied to capture the fact that the two factors carry com-plementary information.
quartiles for black students in Tier 6 are higher thanthose in Tier 5, which suggests that Tier 6 is not lessselective than Tier 5 and actually attracts more quali-fied black students than Tier 5. Tier 6 students appearto value attending schools with larger minority pop-ulations, so changing to SES AA seems irrelevant toTier 6. Thus, we excluded Tier 6 and its students fromour analysis.
3. THE GENERAL MODEL FOR LAW SCHOOLATTENDANCE
In our simulation, we assume students will attendthe highest tier school to which they are admitted,and the number of students attending each tier un-der SES AA is the same under racial AA. The rele-vant student characteristics for admissions that are ob-served in the dataset are LSAT, UGPA, race, and SES.In our model predicting the results of SES AA, lawschools switch from valuing racial diversity to valu-ing socioeconomic diversity but do not change the ex-tent to which they value academic factors. To pro-vide more structure to the model, each law school tieris modeled as having a diversity quota, such that thenumber of low SES students attending each tier un-der SES AA is the same as the number of black stu-dents attending each tier under racial AA (see Appen-dices A.4 and A.5 for more details of the diversityquota model).
We assume that the change from racial to SES AAwould not lead to a change in the population of lawstudents nationwide. Although it is possible that somestudents would decide not to attend law school at allunder SES AA and that others who did not actuallyattend law school would under SES AA, we are unableto infer these results based on the BPS data.
3.1 Enrollment Probability Functions
Because the BPS only includes data on enrollmentand not on admissions, instead of estimating each stu-dent’s admissions probabilities to each tier, we esti-mated each student’s probability of enrollment intoeach tier. Specifically, we estimated the probability of astudent being in a given tier versus a lower ranked tierto obtain conditional tier enrollment probability func-tions. To the extent that students enroll in the best tierto which they are admitted, modeling affirmative ac-tion’s effects through the conditional enrollment prob-abilities is equivalent to modeling them through admis-sions probabilities.
Ten separate enrollment functions were estimated,one for each of the two racial groups in each of the five

IMPACT OF CLASS-BASED AFFIRMATIVE ACTION 301
tiers. Within a racial group, a student’s tier enrollmentprobability was modeled as only depending on the stu-dent’s LSAT and UGPA. The conditional probabilityof student i enrolling in tier t was estimated using a se-quence of logistic regressions by first comparing thoseenrolled in Tier 1 versus those in Tiers 2–5, followedby those in Tier 2 versus those in Tiers 3–5, and soon, where, for student i of race r (b for black or w forwhite),
pri,t = logit−1(
αrt,0 + αr
t,1 · LSATi + αrt,2 · UGPAi
).
We estimated the logistic regressions using thebayesglm function in R with the default recommendedprior distributions (Gelman et al., 2006).2
The results from these regressions are shown in Ta-ble 2. For more details about the algorithm used to es-timate these tier enrollment probability functions, see
TABLE 2Regression coefficients for probabilities of enrolling in given tier
versus lower tier
Black Whitecoefficients coefficients T-statistic
Tier (SE) (SE) of difference
1 Intercept −12.95 (0.97) −16.46 (0.33) 3.43LSAT 0.20 (0.02) 0.22 (0.006) 1.39UGPA 1.47 (0.23) 1.57 (0.07) 0.41
2 Intercept −7.51 (0.67) −8.17 (0.20) 0.95LSAT 0.12 (0.01) 0.12 (0.004) 0.14UGPA 0.91 (0.17) 0.73 (0.05) 1.02
3 Intercept −3.11 (0.58) −10.57 (0.21) 12.04LSAT 0.09 (0.01) 0.15 (0.004) 4.45UGPA 0.20 (0.15) 1.44 (0.04) 7.80
4 Intercept −4.12 (1.04) −4.72 (0.29) 0.56LSAT 0.14 (0.02) 0.14 (0.006) 0.01UGPA 0.71 (0.28) 0.48 (0.06) 0.83
Note: Coefficients from logistic regressions where the outcomevariable is whether the student was enrolled in the given tier ora lower tier. As expected, the coefficients for LSAT and UGPA arepositive and significant. Larger intercepts confirm uniform boostsin enrollment probabilities, whereas larger coefficients on LSATand UGPA imply greater increases in enrollment probability perincrease in academic qualifications. Given that LSAT scores are ona scale roughly 10 times that of UGPA (11–48 vs. 1.0–4.0), it ap-pears that LSAT generally contributes more to the tier enrollmentprobabilities than UGPA.
2We used Student-t prior distributions with mean 0 and scale 2.5for the coefficients. The prior distribution for the constant term wasset so it applied to the value when all predictors are set to theirmean values.
Appendix B.1. The admissions boost from racial AAis revealed for every tier by larger values for αb
t,0 thanfor αw
t,0 (intercepts) for all t , implying that black stu-dents have higher conditional enrollment probabilitiesin each tier than white students with equivalent aca-demic credentials. The values of the LSAT and UGPAcoefficients for black and white students are relativelysimilar across Tiers 1, 2, 4, and 5. All of the coef-ficients for Tier 3 significantly differ between blackand white students, though this seems to be drivenby the particularly large difference in intercept val-ues.
As shown in Figures 1 and 2, the model exhibitstrends following the basic mechanisms of the existingAA system: black students have boosted probabilitiesof being in higher tiers. For example, the probabilityof a black student with a 40 on the LSAT enrolling inTier 1 is around 35%, whereas it is only about 10%for white students with the same LSAT score. Figure 1shows that for Tiers 1 and 2, the enrollment lines for theblack students are generally higher than those for thewhite students, and for Tiers 3–5, the peak of their en-rollment functions are centered on lower LSAT values.To further check the model fit, we used the model tosimulate the current AA system and to impute the aca-demic outcomes. The results, displayed in Appendix D,show that the model accurately predicted all the quan-tities of interest.
3.2 Reassigning Tiers
To simulate SES AA, we assigned enrollment proba-bilities by considering low SES and high SES studentsseparately and applying, for each tier, the estimatedblack student function to low SES students and the es-timated white student function to high SES students,with SES indicators replacing the race indicators. Theresults are plotted in Figures 3 and 4, along with thefitted curves from the original data under racial AA.Comparing these curves shows the estimated impact ofchanging from racial to SES AA on the students’ prob-abilities of being enrolled in each tier. Starting withFigure 3, under SES AA, the curves for the black stu-dents now look similar to those for the white students.On the other hand, Figure 4 illustrates a significantboost for low SES students under SES AA, compara-ble to that given to black students, meaning that theshapes of the curves for black and low SES studentsessentially switched between the racial and SES AAsystems.

302 A. XIANG AND D. B. RUBIN
FIG. 1. Fit of model by race to current data. Empirical proportions of students of each race with a given LSAT score enrolled in a giventier (red dots), along with the fitted enrollment probabilities for those students (green lines). The size of each dot reflects the number ofstudents with the corresponding LSAT score in the tier. The fitted lines appear jagged because LSAT scores are not continuous and becausethe functions depend not only on LSAT but also on UGPA, a variable not displayed in these graphs.
The students were next assigned to tiers using thesecounterfactual SES AA conditional enrollment proba-bilities. Students were first assigned to Tier 1 by draw-ing from Bernoulli random variables with their prob-abilities of enrolling in Tier 1. Once Tier 1 was full,Tier 2 was next filled using the analogous procedurefor the remaining applicants, and so on until all stu-dents were assigned to tiers. The full algorithm forassigning students to new tiers is described in Ap-pendix B.2.
3.3 Changes in Demographic Composition
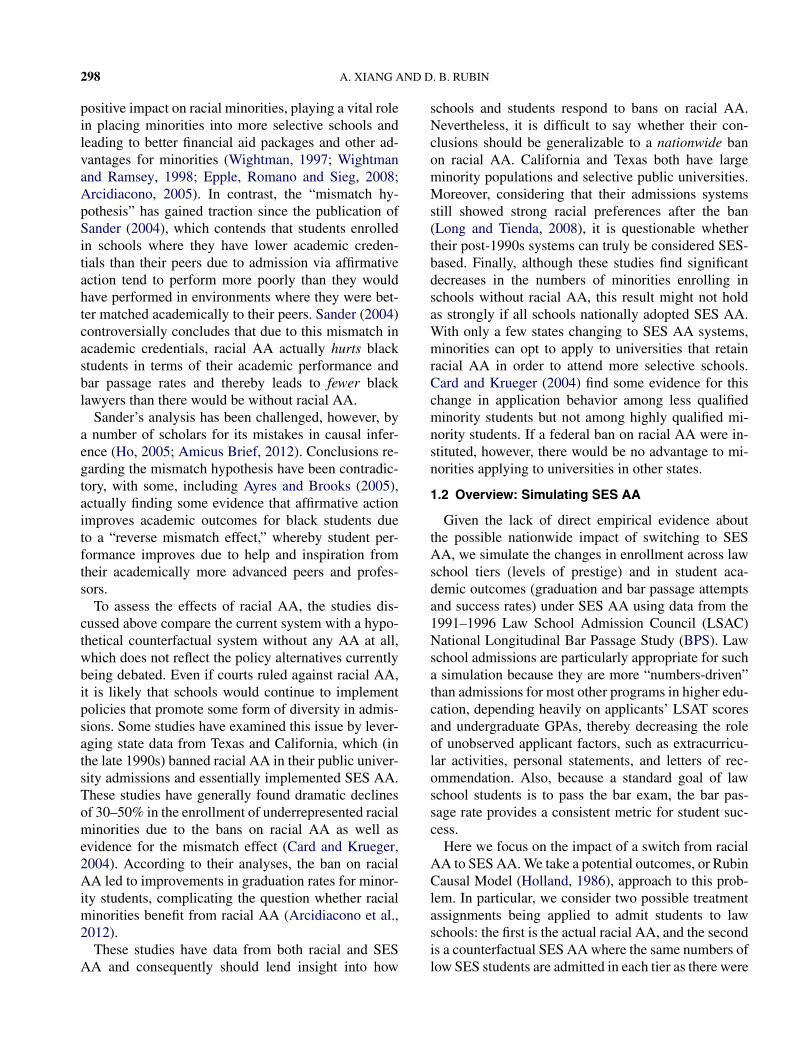
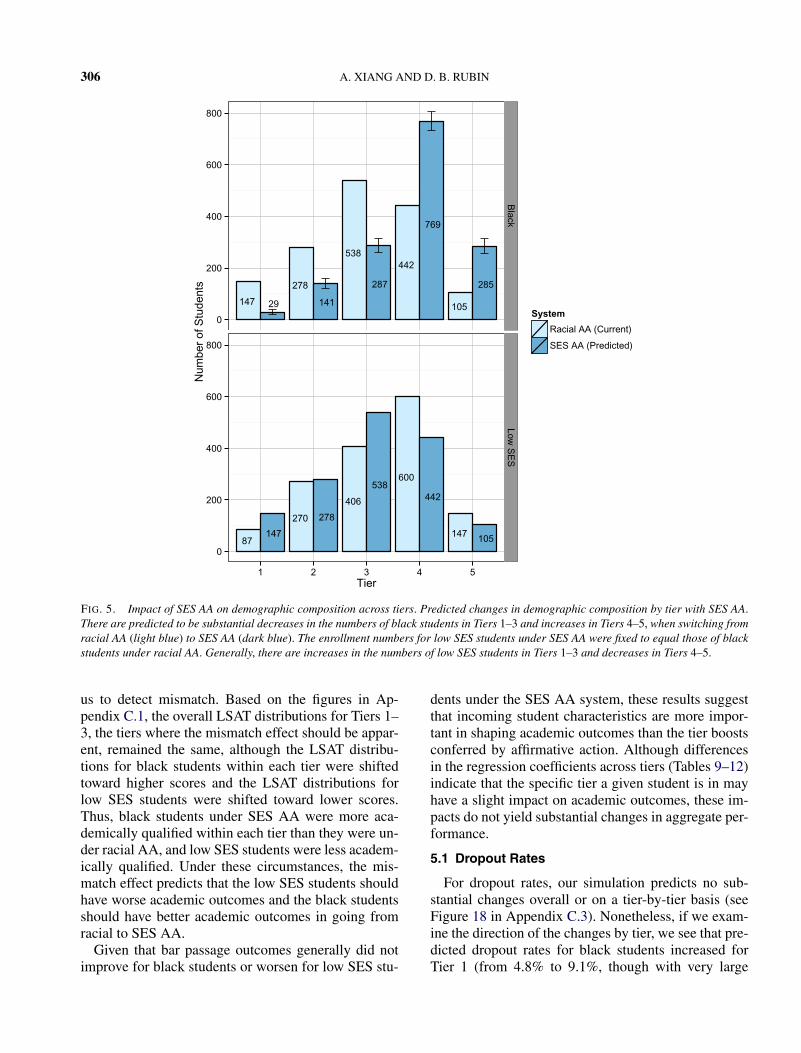
The results from the simulation predict substantialreductions in the numbers of black students in toptiers as a result of changing from racial AA to SESAA: from 147 to an estimated 29 black students inTier 1 and from 278 to an estimated 141 black stu-dents in Tier 2 (Figure 5). These dramatic changes stem
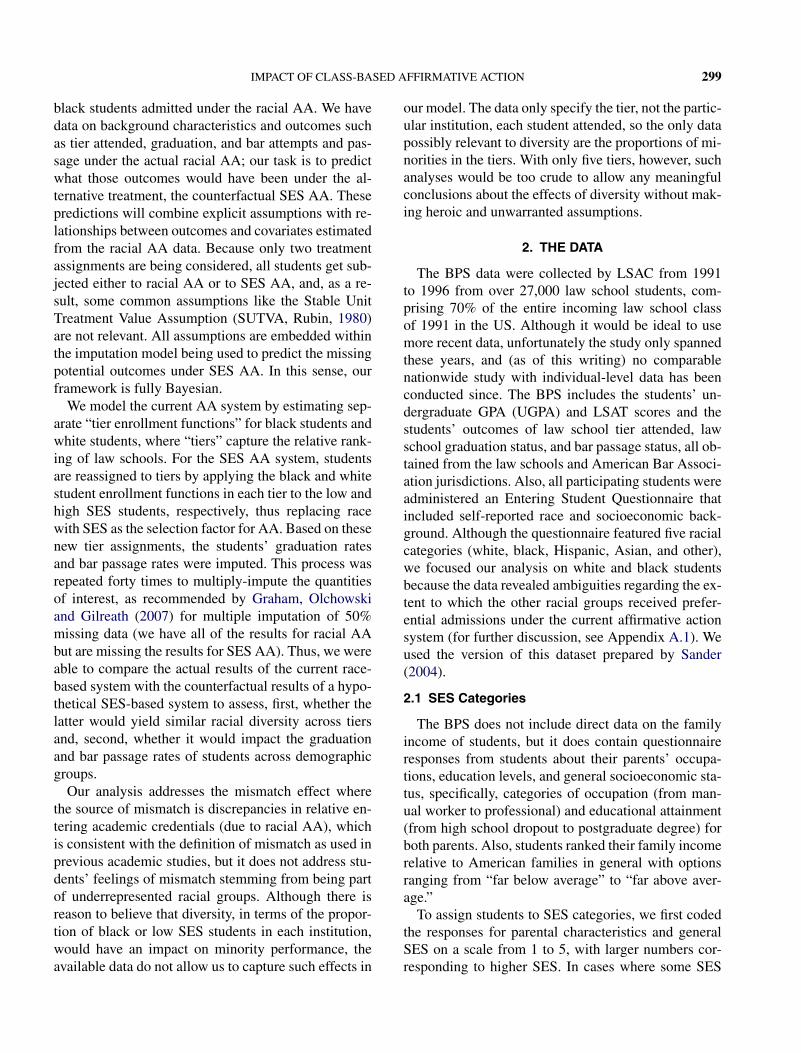
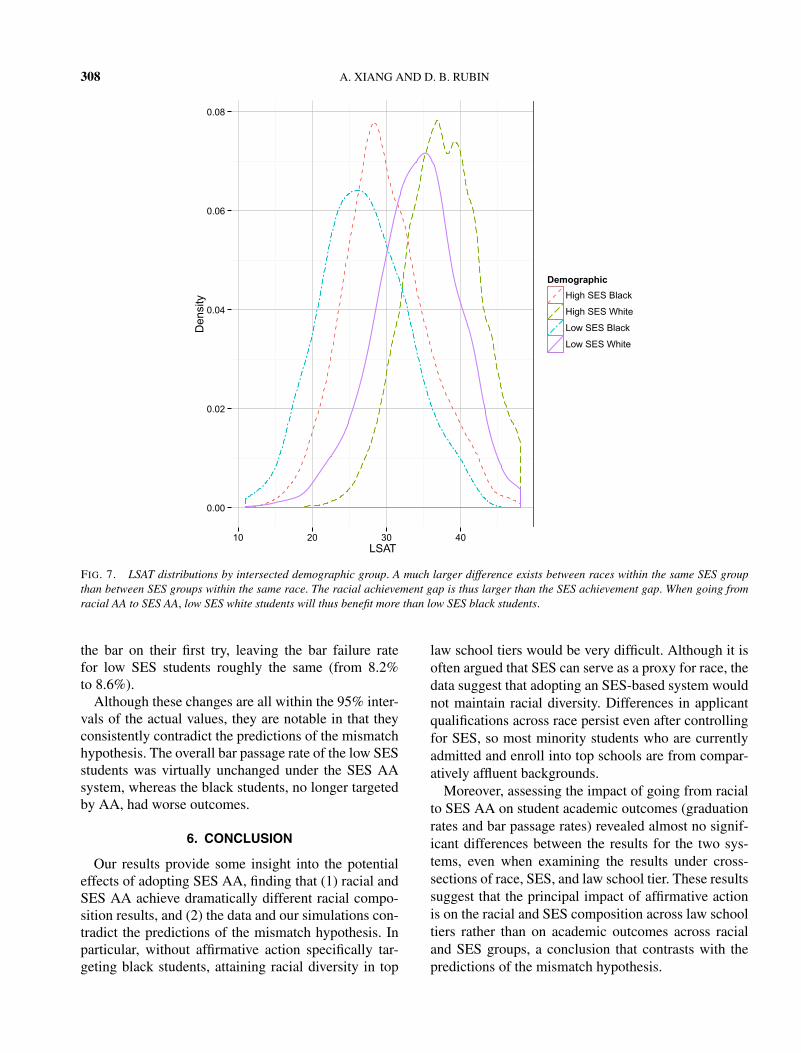
from the fact that low SES white students typicallyhave higher LSAT scores than high SES black students(see Figure 7), suggesting that the switch from racialAA to SES AA replaces black students with low SESwhite students. Even though low SES black studentsget the same AA boost under either AA system, someof the black students currently admitted are displacedby lower SES white students under SES AA.
Moreover, under the SES AA system, the total es-timated decrease in the number of black students inTiers 1–3 (506) substantially exceeds the increase inthe number of low SES students predicted to be ad-mitted to Tiers 1–3 (200), as illustrated in Figure 6,which can be attributed to the fact that the achievementgap (i.e., differences in LSAT distributions) betweenblack and white students exceeds the gap between lowand high SES students (Figure 9). Thus, when low SESstudents are given the AA boost rather than black stu-

IMPACT OF CLASS-BASED AFFIRMATIVE ACTION 303
FIG. 2. Fit of model by SES to current data. Empirical proportions of students of each SES group with a given LSAT score enrolled in agiven tier (red dots), along with the fitted enrollment probabilities for those students (green lines). The size of each dot reflects the number ofstudents with the corresponding LSAT score in the tier. The fitted lines appear jagged because LSAT scores are not continuous and becausethe functions depend not only on LSAT but also UGPA, which is not shown in the graphs. Given that the estimated probabilities fit the dataquite well, these graphs suggest that there is no substantial discrepancy between the enrollment functions of low vs. high SES students,supporting our assumption that under the current system, only racial minorities benefit from affirmative action.
dents, the low SES students do not benefit as dramat-ically as the black students did under racial AA. Un-der SES AA, low SES students principally benefit froman increase in representation in Tier 1 (from 87 to anestimated 147). Their numbers in Tier 2 are virtuallyunchanged (from 270 to an estimated 278), and theyonly see a moderate increase in representation in Tier 3(from 406 to an estimated 538) and moderate decreasesin Tiers 4 and 5 (from 600 to an estimated 442, andfrom 147 to an estimated 105, resp.), in contrast withthe dramatic tier composition changes experienced byblack students under the two systems.
It is noteworthy, however, that the sizable increasesin the numbers of low SES students in Tiers 1 and3 did little to mitigate the significant declines in thenumbers of black students in those tiers, which indi-
cates that although SES and race are correlated (17%of black students are low SES, compared with 5% ofwhite students), there is insufficient overlap to allowSES to serve as an effective proxy for race: only 251students are black and low SES, out of 1510 black stu-dents and 1510 low SES students. This presents a sig-nificant policy issue, because it suggests that it wouldbe difficult to achieve racial diversity without AA poli-cies specifically targeted to admit black students whoare not low SES.
4. ACADEMIC OUTCOMES
In addition to demographic composition, we esti-mated the predicted academic outcomes under the SESAA system, simulating whether each student would:

304 A. XIANG AND D. B. RUBIN
FIG. 3. Impact of SES AA on tier enrollment probabilities for students by race. Fitted probabilities for each student enrolling into each tierunder racial AA (green lines) and the estimated probabilities of enrollment under SES AA (red lines). The lines appear jagged because LSATscores are not continuous and because the functions depend not only on LSAT but also UGPA, which is not shown in these graphs.
i. Graduate from law school,ii. Attempt the bar exam,
iii. Pass the bar the first time,iv. Pass the bar on a later try, orv. Fail the bar.
We assumed that dropping out of law school im-plied not attempting the bar, and thus not passing thebar.
4.1 Imputing Graduation and Bar PassageOutcomes under SES AA
The graduation and bar passage outcomes wereimputed using a series of logistic regressions. First,whether the students graduated law school was im-puted by fitting a logistic regression to the currentdata’s dropout outcomes, using sex, LSAT score, LSATpercentile within tier, race, and SES as predictors. Sep-arate functions were estimated for each tier so that im-puting the students’ new academic outcomes simply
involved applying the function corresponding to theirSES AA tier assignment:
di,t = logit−1(αt
0 + αt1 · femalei + αt
2 · LSATi
+ αt3 · LSATperci + αt
4 · UGPAi
+ αt5 · LSATperci · blacki
+ αt6 · LSATperc · lowSESi
+ αt7 · blacki + αt
8 · lowSESi
),
where dit is the probability of student i in Tier t notgraduating (i.e., dropping out of) law school.
We included both LSAT score and LSAT percentilein order to better detect any potential mismatch effect.Under the mismatch hypothesis, we would expect thatLSAT percentile might have a significant negative ef-fect on the chances of undesirable outcomes (droppingout and failing the bar) and a significant positive ef-

IMPACT OF CLASS-BASED AFFIRMATIVE ACTION 305
FIG. 4. Impact of SES AA on tier enrollment probabilities for students by SES. Fitted probabilities for each student enrolling into each tierunder racial AA (green lines) and the estimated probabilities of enrollment under SES AA (red lines). The lines appear jagged because LSATscores are not continuous and because the functions depend not only on LSAT but also UGPA, which is not shown in these graphs.
fect on desirable outcomes (passing the bar), becausestudents with lower LSAT percentiles within their tierwould perform more poorly even given identical LSATscores. What we find, however, is that almost all ofthe coefficients on LSAT percentile and its interactionwith the black indicator variable are insignificant (seeregression coefficients in Appendix E). Moreover, thefew significant coefficients and most of the nonsignif-icant coefficients have the opposite signs from whatwould be expected under mismatch.
For each of the bar passage outcomes, the samemethodology was employed, removing students ineach subsequent step once their outcomes had beenimputed (the complete algorithm is described in Ap-pendix B.3). In order to attain estimates of the un-certainty for these predictions, multiple imputation(Rubin, 1987) was used by repeating the entire pro-cedure forty times.
5. RESULTS FOR ACADEMIC OUTCOMES
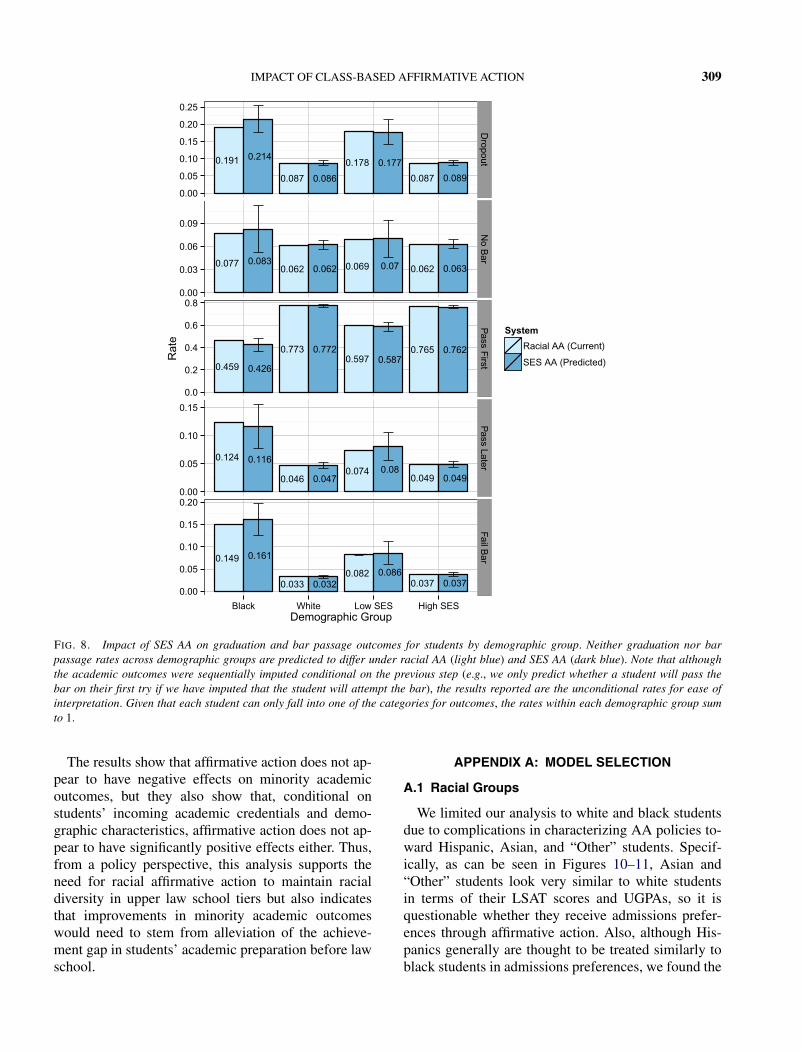
The results show that there are no substantial changesoverall for the student academic outcomes in goingfrom racial AA to SES AA. Figure 8, which sum-marizes the academic outcomes for each demographicgroup under both AA systems, shows that all of theresults for the SES system are predicted to be within95% intervals of the outcomes under the current racialAA system. Moreover, the magnitudes of these effectsappear to be mixed and minimal in the aggregate, sug-gesting either that the mechanisms behind them arelimited in effect or that they operate in opposite direc-tions and cancel each other out. The results by demo-graphic group are shown in Appendix C.2 and by tierin Appendix C.3.
Although the primary purpose of our simulation wasnot to estimate mismatch effects, the changes in mi-nority students’ relative academic credentials underSES AA in comparison to racial AA should allow
306 A. XIANG AND D. B. RUBIN
FIG. 5. Impact of SES AA on demographic composition across tiers. Predicted changes in demographic composition by tier with SES AA.There are predicted to be substantial decreases in the numbers of black students in Tiers 1–3 and increases in Tiers 4–5, when switching fromracial AA (light blue) to SES AA (dark blue). The enrollment numbers for low SES students under SES AA were fixed to equal those of blackstudents under racial AA. Generally, there are increases in the numbers of low SES students in Tiers 1–3 and decreases in Tiers 4–5.
us to detect mismatch. Based on the figures in Ap-pendix C.1, the overall LSAT distributions for Tiers 1–3, the tiers where the mismatch effect should be appar-ent, remained the same, although the LSAT distribu-tions for black students within each tier were shiftedtoward higher scores and the LSAT distributions forlow SES students were shifted toward lower scores.Thus, black students under SES AA were more aca-demically qualified within each tier than they were un-der racial AA, and low SES students were less academ-ically qualified. Under these circumstances, the mis-match effect predicts that the low SES students shouldhave worse academic outcomes and the black studentsshould have better academic outcomes in going fromracial to SES AA.
Given that bar passage outcomes generally did notimprove for black students or worsen for low SES stu-
dents under the SES AA system, these results suggestthat incoming student characteristics are more impor-tant in shaping academic outcomes than the tier boostsconferred by affirmative action. Although differencesin the regression coefficients across tiers (Tables 9–12)indicate that the specific tier a given student is in mayhave a slight impact on academic outcomes, these im-pacts do not yield substantial changes in aggregate per-formance.
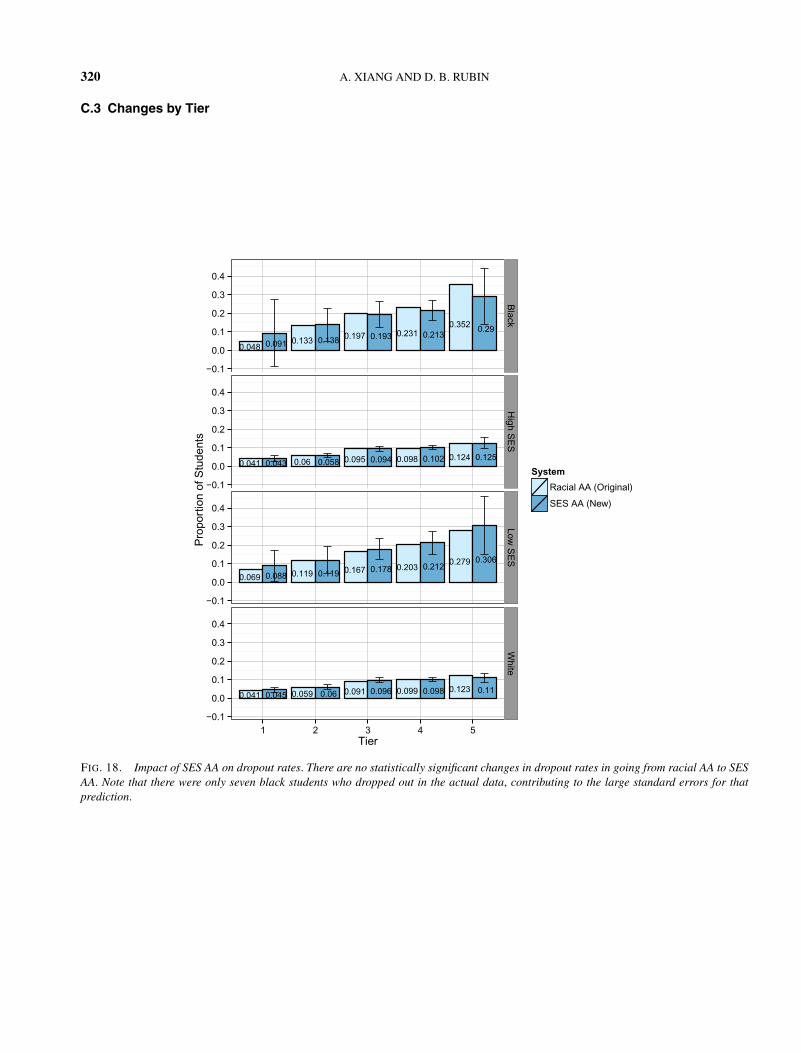
5.1 Dropout Rates
For dropout rates, our simulation predicts no sub-stantial changes overall or on a tier-by-tier basis (seeFigure 18 in Appendix C.3). Nonetheless, if we exam-ine the direction of the changes by tier, we see that pre-dicted dropout rates for black students increased forTier 1 (from 4.8% to 9.1%, though with very large

IMPACT OF CLASS-BASED AFFIRMATIVE ACTION 307
FIG. 6. Changes in demographic composition across tiers. Predicted effect on black and low SES students when switching to SES AA fromracial AA. The result is a decrease in black students in Tiers 1–3 that is far greater than the increase in low SES students in these tiers, aconsequence of the larger achievement gap, as measured by LSAT and UGPA, between black and white students than between low SES andhigh SES students.
standard errors), stayed roughly the same for Tiers 2and 3, and decreased for Tiers 4 and 5 (from 23.1% to21.3%, resp.). For low SES students, predicted dropoutrates slightly increased for Tier 1 (from 6.9% to 8.8%),stayed virtually the same for Tiers 2–4, and increasedfor Tier 5 (from 27.9% to 30.6%). Thus, with the ex-ception of the Tier 1 prediction for black students, ona tier-by-tier level, black students have slightly betterpredicted dropout rates under SES AA, whereas lowSES students have slightly worse predicted dropoutrates.3
5.2 Rates of Not Taking the Bar
For rates of not taking the bar exam, there are nopredicted significant changes overall and no apparenttrends between tiers from switching to SES AA fromracial AA (Figure 19 in Appendix C.3). For example,for black students, there is a decrease in the proportiontaking the bar in Tier 1 (4.2%), increases for Tier 2
3Note that only seven black students in Tier 1 dropped out inthe actual data, so the prediction for that outcome has very largestandard errors and should be interpreted cautiously.
(0.2%) and Tier 3 (0.8%), and decreases for Tier 4(0.4%) and Tier 5 (0.6%). This lack of a consistentpattern across tiers is understandable given that thereare many factors influencing a student’s decision not totake the bar exam. Some students might not take the barif they find better nonlegal job opportunities, whereasothers might not take the bar if they are worried abouttheir ability to pass.
5.3 Bar Passage Rates
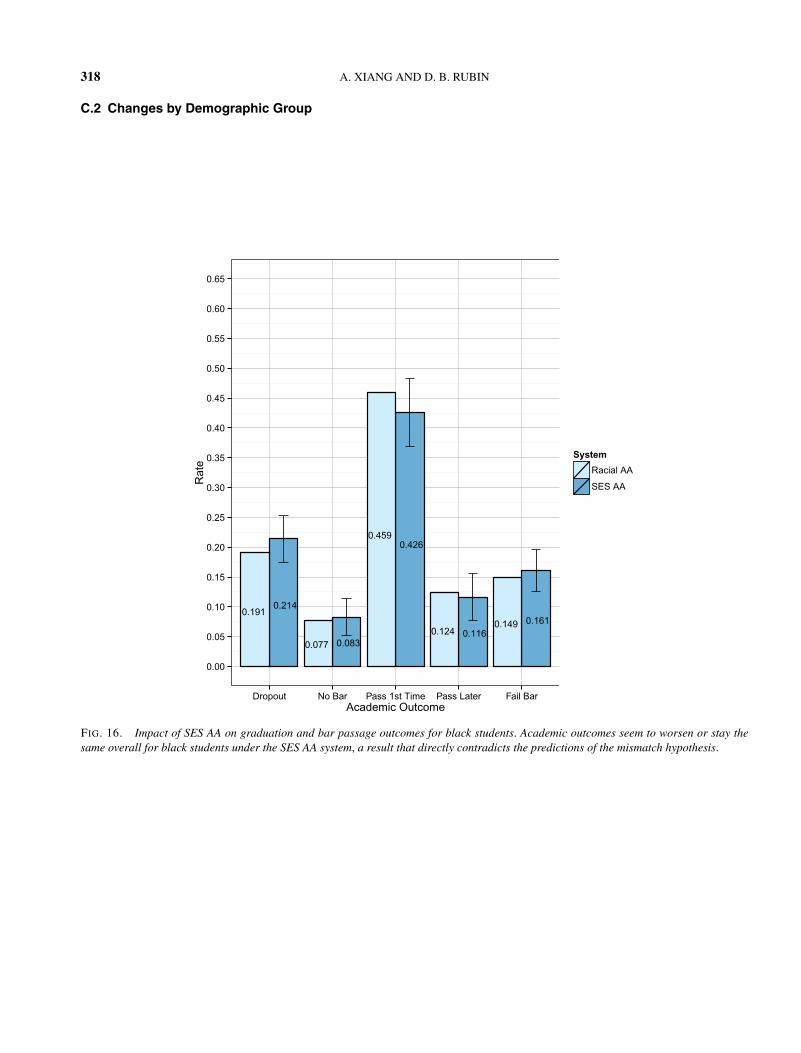
As shown in Figure 8, black students are predictedto have slightly lower first-time bar passage rates un-der SES AA than under racial AA (45.9% to 42.6%),and low SES students are predicted to have virtuallythe same rates (59.7% to 58.7%). Black students alsoare predicted to have slightly lower rates of passingthe bar in a later attempt (from 12.4% to 11.6%) andhigher rates of failing the bar (from 14.9% to 16.1%)under SES AA than under racial AA. Low SES stu-dents, on the other hand, are predicted to have a slightlyhigher rate of passing the bar in a later attempt (from7.4% to 8.0%), but this effect does not fully offsetthe decrease in low SES students predicted to pass
308 A. XIANG AND D. B. RUBIN
FIG. 7. LSAT distributions by intersected demographic group. A much larger difference exists between races within the same SES groupthan between SES groups within the same race. The racial achievement gap is thus larger than the SES achievement gap. When going fromracial AA to SES AA, low SES white students will thus benefit more than low SES black students.
the bar on their first try, leaving the bar failure ratefor low SES students roughly the same (from 8.2%to 8.6%).
Although these changes are all within the 95% inter-vals of the actual values, they are notable in that theyconsistently contradict the predictions of the mismatchhypothesis. The overall bar passage rate of the low SESstudents was virtually unchanged under the SES AAsystem, whereas the black students, no longer targetedby AA, had worse outcomes.
6. CONCLUSION
Our results provide some insight into the potentialeffects of adopting SES AA, finding that (1) racial andSES AA achieve dramatically different racial compo-sition results, and (2) the data and our simulations con-tradict the predictions of the mismatch hypothesis. Inparticular, without affirmative action specifically tar-geting black students, attaining racial diversity in top
law school tiers would be very difficult. Although it isoften argued that SES can serve as a proxy for race, thedata suggest that adopting an SES-based system wouldnot maintain racial diversity. Differences in applicantqualifications across race persist even after controllingfor SES, so most minority students who are currentlyadmitted and enroll into top schools are from compar-atively affluent backgrounds.
Moreover, assessing the impact of going from racialto SES AA on student academic outcomes (graduationrates and bar passage rates) revealed almost no signif-icant differences between the results for the two sys-tems, even when examining the results under cross-sections of race, SES, and law school tier. These resultssuggest that the principal impact of affirmative actionis on the racial and SES composition across law schooltiers rather than on academic outcomes across racialand SES groups, a conclusion that contrasts with thepredictions of the mismatch hypothesis.
IMPACT OF CLASS-BASED AFFIRMATIVE ACTION 309
FIG. 8. Impact of SES AA on graduation and bar passage outcomes for students by demographic group. Neither graduation nor barpassage rates across demographic groups are predicted to differ under racial AA (light blue) and SES AA (dark blue). Note that althoughthe academic outcomes were sequentially imputed conditional on the previous step (e.g., we only predict whether a student will pass thebar on their first try if we have imputed that the student will attempt the bar), the results reported are the unconditional rates for ease ofinterpretation. Given that each student can only fall into one of the categories for outcomes, the rates within each demographic group sumto 1.
The results show that affirmative action does not ap-pear to have negative effects on minority academicoutcomes, but they also show that, conditional onstudents’ incoming academic credentials and demo-graphic characteristics, affirmative action does not ap-pear to have significantly positive effects either. Thus,from a policy perspective, this analysis supports theneed for racial affirmative action to maintain racialdiversity in upper law school tiers but also indicatesthat improvements in minority academic outcomeswould need to stem from alleviation of the achieve-ment gap in students’ academic preparation before lawschool.
APPENDIX A: MODEL SELECTION
A.1 Racial Groups
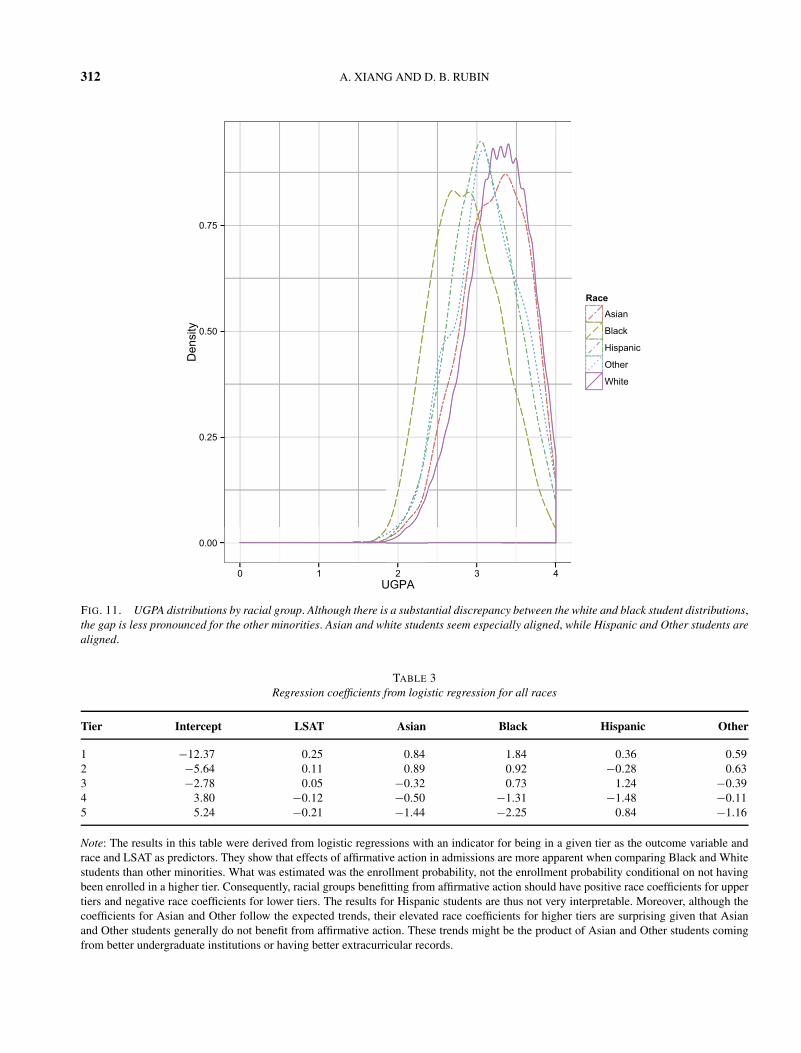
We limited our analysis to white and black studentsdue to complications in characterizing AA policies to-ward Hispanic, Asian, and “Other” students. Specif-ically, as can be seen in Figures 10–11, Asian and“Other” students look very similar to white studentsin terms of their LSAT scores and UGPAs, so it isquestionable whether they receive admissions prefer-ences through affirmative action. Also, although His-panics generally are thought to be treated similarly toblack students in admissions preferences, we found the

310 A. XIANG AND D. B. RUBIN
FIG. 9. LSAT distributions by demographic group. LSAT distribution by demographic group. Black and low SES students have lower LSATdistributions than white or high SES students, who have essentially the same distributions. Notably, there is a substantial gap between theblack and low SES student distributions, providing evidence that the LSAT gap between black and white students exceeds that between lowand high SES students.
trends in this dataset to be much less clear. For exam-ple, as shown in Table 3, the regression coefficients forthe probability of enrolling in each tier for Hispanicstudents do not follow a specific trend. These factorsmake constructing SES-equivalent categories for theseracial groups dubious. Thus, for this analysis, we fo-cused our attention on examining the impact of theracial vs. SES AA systems on black and white students.
A.2 Calculating the SES Score
The SES score was computed as the first principalcomponent of the SES factors. The resulting score wasthe following:
SES_Score = 0.442occmom + 0.458occdad
+ 0.485edmom + 0.492eddad
+ 0.342fam_inc,
where occ is the parent’s occupation category, ed is theparent’s educational attainment, and fam_inc is the re-sponse to the general SES question. All of the SES fac-tors were on a scale from 1 to 5, with higher numberscorresponding to higher SES, and were standardizedbefore calculating the principal component.
For 14,291 students, one or more components oftheir SES scores was missing. Because this numberof students is sufficiently large that simply removingthe students from the data would compromise the sam-ple size of minority students, we used the followingmethod to impute the missing SES data. For instanceswhere occ for a parent was missing but ed was avail-able, we imputed the occ of the parent as the ed ofthe parent, and vice versa when ed was missing fora parent. Similarly, although a response of “home-maker” is technically not missing data, it does not havea clear SES ranking relative to other occupations; wereplaced the occ for homemakers with the value of

IMPACT OF CLASS-BASED AFFIRMATIVE ACTION 311
FIG. 10. LSAT distributions by racial group. Although there are clear and substantial discrepancies between the LSAT distributions forwhite and black students, the differences are smaller for other racial minorities. In particular, Asians and “Other” students have similardistributions to white students, while Hispanics are distributed between white and black students. This might explain why the affirmativeaction trends were less apparent in the regression coefficients for Hispanic, Asian, and Other students in Table 3.
their ed to better capture their earning potentials. Ifocc and ed were both missing for a parent, we im-puted them with the occ and ed of the other parent un-der the assumption that people tend to marry within thesame SES.
If the information for both parents was missing for astudent, we assigned to the student the SES score cor-responding to her fam_inc percentile rank. For exam-ple, if her fam_inc were 5, and if 80% of students hada fam_inc less than 5, we would impute her “parentalscore” (the part of the score excluding fam_inc) asthe 80th percentile among all parental scores. Thus,the student’s relative score would be similar to what itwould be if the ranking system were exclusively basedon fam_inc. Analogously, in cases where fam_inc wasmissing for a student, we calculated the percentileof the student’s parental score and imputed the stu-dent’s fam_inc as the fam_inc corresponding to that
percentile. We removed students with no SES informa-tion available.
A.3 Undergraduate GPA (UGPA)
Although the data included the students’ UGPAs, itdid not include any information about the undergrad-uate institutions the students attended, thus renderingUGPA less interpretable. In carrying out our analysis,we included UGPA as a predictor for enrollment proba-bilities and academic outcomes, but the coefficients forUGPA should be interpreted carefully given this am-biguity. In general, LSAT is the more reliable metricfor student academic ability given that it is standard-ized for all students. Thus, throughout the paper, weoften examine changes in LSAT distribution in order togauge changes in relative academic ability across lawschool tiers and demographic groups.
312 A. XIANG AND D. B. RUBIN
FIG. 11. UGPA distributions by racial group. Although there is a substantial discrepancy between the white and black student distributions,the gap is less pronounced for the other minorities. Asian and white students seem especially aligned, while Hispanic and Other students arealigned.
TABLE 3Regression coefficients from logistic regression for all races
Tier Intercept LSAT Asian Black Hispanic Other
1 −12.37 0.25 0.84 1.84 0.36 0.592 −5.64 0.11 0.89 0.92 −0.28 0.633 −2.78 0.05 −0.32 0.73 1.24 −0.394 3.80 −0.12 −0.50 −1.31 −1.48 −0.115 5.24 −0.21 −1.44 −2.25 0.84 −1.16
Note: The results in this table were derived from logistic regressions with an indicator for being in a given tier as the outcome variable andrace and LSAT as predictors. They show that effects of affirmative action in admissions are more apparent when comparing Black and Whitestudents than other minorities. What was estimated was the enrollment probability, not the enrollment probability conditional on not havingbeen enrolled in a higher tier. Consequently, racial groups benefitting from affirmative action should have positive race coefficients for uppertiers and negative race coefficients for lower tiers. The results for Hispanic students are thus not very interpretable. Moreover, although thecoefficients for Asian and Other follow the expected trends, their elevated race coefficients for higher tiers are surprising given that Asianand Other students generally do not benefit from affirmative action. These trends might be the product of Asian and Other students comingfrom better undergraduate institutions or having better extracurricular records.

IMPACT OF CLASS-BASED AFFIRMATIVE ACTION 313
A.4 Diversity Quotas
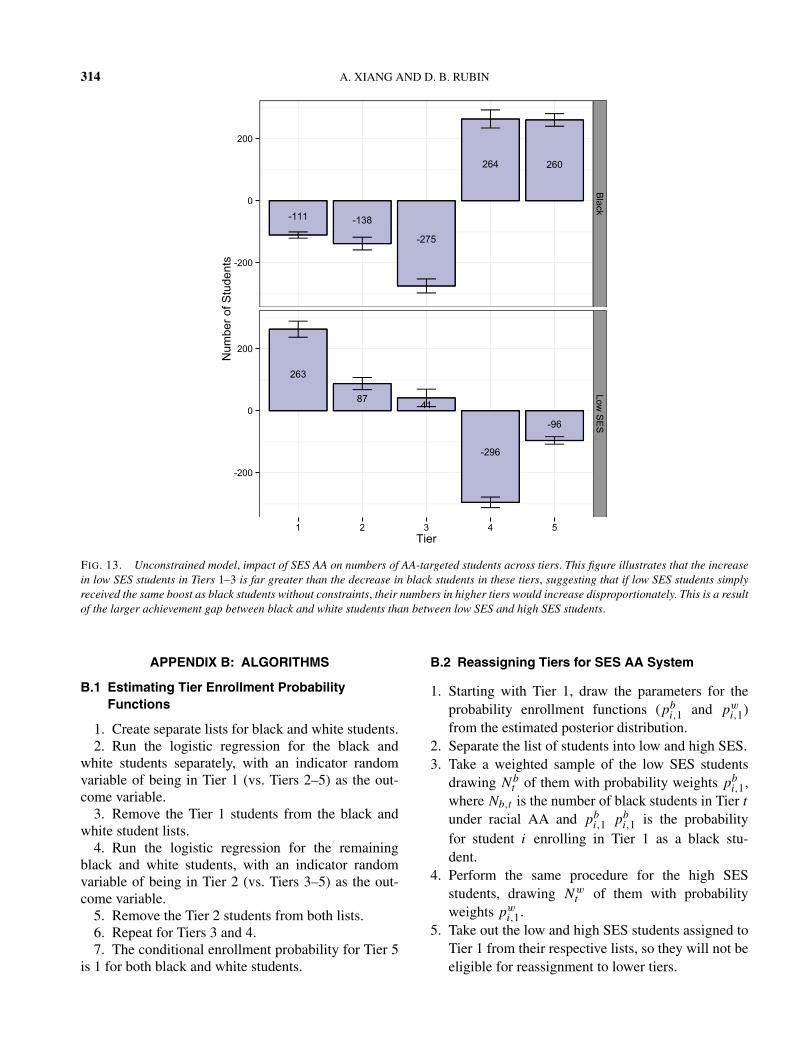
The rationale for modeling the admissions processwith diversity quotas is that admissions committees arepresumably less concerned with maintaining the size ofthe boost they give to AA-targeted students and moreconcerned with the outcomes—the numbers of AA-targeted students who enroll. Without this restriction,low SES students under SES AA would functionallyreceive the same increases in enrollment probabilitythat black students received under the race-based AAsystem. This is problematic because low SES studentsin general have higher LSAT scores than black students(Figure 10), so simply using the black student enroll-ment functions for low SES students would result inexcessive numbers of low SES students entering toptiers, as shown in Figures 12–13. For example, the un-
constrained model predicts the number of low SES stu-dents in Tier 1 increases from 77 to 340.
Although disproportionate increases in low SES stu-dent enrollment are conceivable, it is questionablewhether admissions committees would be willing to al-locate many more slots to low SES students under SESAA. Given that admissions committees exercise affir-mative action with the goal of achieving a diverse in-coming class, and given that a smaller boost would suf-fice to yield a socioeconomically diverse student body,it is more likely that admissions committees would of-fer low SES students a less substantial boost than theone currently offered to black students. Using a quotamodel thus reflects this mitigation of the size of the ad-missions boost.
A.5 No-Quota Model
FIG. 12. Unconstrained model, impact of SES AA on demographic composition across tiers. In the unconstrained model, students areenrolled into each tier (starting with Tier 1 and going down to Tier 5) until each tier is filled, but without constraints on the number oflow SES students in each tier. This figure shows that if SES students are given the same AA boost that black students received withoutconstraints on the numbers of low SES students enrolled into higher tiers, they experience disproportionate increases in their enrollment inhigher tiers.
314 A. XIANG AND D. B. RUBIN
FIG. 13. Unconstrained model, impact of SES AA on numbers of AA-targeted students across tiers. This figure illustrates that the increasein low SES students in Tiers 1–3 is far greater than the decrease in black students in these tiers, suggesting that if low SES students simplyreceived the same boost as black students without constraints, their numbers in higher tiers would increase disproportionately. This is a resultof the larger achievement gap between black and white students than between low SES and high SES students.
APPENDIX B: ALGORITHMS
B.1 Estimating Tier Enrollment ProbabilityFunctions
1. Create separate lists for black and white students.2. Run the logistic regression for the black and
white students separately, with an indicator randomvariable of being in Tier 1 (vs. Tiers 2–5) as the out-come variable.
3. Remove the Tier 1 students from the black andwhite student lists.
4. Run the logistic regression for the remainingblack and white students, with an indicator randomvariable of being in Tier 2 (vs. Tiers 3–5) as the out-come variable.
5. Remove the Tier 2 students from both lists.6. Repeat for Tiers 3 and 4.7. The conditional enrollment probability for Tier 5
is 1 for both black and white students.
B.2 Reassigning Tiers for SES AA System
1. Starting with Tier 1, draw the parameters for theprobability enrollment functions (pb
i,1 and pwi,1)
from the estimated posterior distribution.2. Separate the list of students into low and high SES.3. Take a weighted sample of the low SES students
drawing Nbt of them with probability weights pb
i,1,where Nb,t is the number of black students in Tier t
under racial AA and pbi,1 pb
i,1 is the probabilityfor student i enrolling in Tier 1 as a black stu-dent.
4. Perform the same procedure for the high SESstudents, drawing Nw
t of them with probabilityweights pw
i,1.5. Take out the low and high SES students assigned to
Tier 1 from their respective lists, so they will not beeligible for reassignment to lower tiers.

IMPACT OF CLASS-BASED AFFIRMATIVE ACTION 315
6. Repeat for Tiers 2–4, going from the most to leastselective.
7. Assign remaining students to Tier 5.
B.3 Imputing Academic Outcomes
1. Dropout: For each tier, use logistic regression tofind a function for student dropout probability basedon the original data.
2. Recalculate LSAT percentiles for each studentbased on their SES AA tier assignment.
3. Draw parameters from the posterior distribution ofthe fit. Use these parameters to impute the newdropout probabilities di,t for students by applyingthe function corresponding to their assigned lawschool tier under SES AA, where di,t is the prob-ability that student i would dropout after attendingTier t .
4. For each tier, go through the list of students onceand draw from a Bernoulli random variable withprobability di,t for each student to impute whetherthey did or did not drop out under the SES AA sys-tem.
5. Take Bar: Considering the list of students who grad-uated under the original racial system, use logis-tic regression to find functions, for each tier, of theprobability of a student deciding not to take the barexam.
6. Now consider the set of students who were imputedto have graduated from law school under the SESAA system. Use the function corresponding to theirnewly assigned law school tier to impute their prob-abilities of taking the bar.
7. Impute the outcome of taking the bar or not by go-ing through the list of students and drawing from aBernoulli random variable with the estimated prob-abilities of taking the bar exam.
8. Bar Passage: For the students whose outcomes arethat they would take the bar, impute whether theypass the first time using the same logistic regressionmethod.
9. For the remaining students who did not pass the barthe first time, impute whether they eventually passthe bar or fail using the same basic method.
APPENDIX C: RESULTS
TABLE 4Overall changes in academic outcomes
Outcome Original New (SE)
Dropout rate 0.0926 0.0937 (0.0036)Rate of not taking bar 0.0633 0.0624 (0.0030)First-try bar passage rate 0.752 0.753 (0.0053)Later-try bar passage rate 0.0507 0.0508 (0.0025)Bar failure rate 0.0393 0.0399 (0.0024)
Note: None of the academic outcomes change substantially in ag-gregate between the two systems.
TABLE 5Percentage changes in outcomes by race
Outcome variable Race Percentage change
Dropout rate Black 0.1196White −0.0023
Did not attempt bar Black 0.0755White 0.0081
Passed bar first try Black −0.0719White −0.0009
Passed bar later try Black −0.0622White 0.0108
Failed to pass bar Black 0.0812White −0.0031
Note: The quantities are expressed as percentage change in propor-tions in going from the racial to SES AA system.
TABLE 6Percentage changes in outcomes by SES
Outcome variable SES Percentage change
Dropout rate Low SES −0.0051High SES 0.0137
Did not attempt bar Low SES 0.0116High SES 0.0129
Passed bar first try Low SES −0.0172High SES −0.0027
Passed bar later try Low SES 0.0795High SES −0.0041
Failed to pass bar Low SES 0.0540High SES 0.0109
Note: The quantities are expressed as percentage change in propor-tions in going from the racial to SES AA system.

316 A. XIANG AND D. B. RUBIN
C.1 Changes in LSAT Distribution
FIG. 14. Impact of SES AA on LSAT distribution by tier. LSAT distributions remain roughly the same between racial and SES AA for Tiers1–3. The distributions for Tiers 4 and 5 widen, with Tier 4 having a lower mean and Tier 5 a higher mean. Thus, the academic qualificationsin each tier are not changing substantially between the two systems even as their demographic compositions change.

IMPACT OF CLASS-BASED AFFIRMATIVE ACTION 317
FIG. 15. Impact of SES AA on LSAT distribution by tier for black and low SES students. In going from racial AA to SES AA, LSATdistributions are shifted toward higher LSAT scores for black students in all tiers and toward lower LSAT scores for low SES students forTiers 1, 3, and 4. Given that the overall LSAT distributions have not changed substantially, as shown in Figure 14, this suggests that blackstudents are better academically matched to their tiers under SES AA than under racial AA, whereas low SES students are better academicallymatched to their tiers under racial AA than under SES AA. Thus, by analyzing the simulation results for SES AA, we can gauge whether thereis evidence for a mismatch effect.
318 A. XIANG AND D. B. RUBIN
C.2 Changes by Demographic Group
FIG. 16. Impact of SES AA on graduation and bar passage outcomes for black students. Academic outcomes seem to worsen or stay thesame overall for black students under the SES AA system, a result that directly contradicts the predictions of the mismatch hypothesis.

IMPACT OF CLASS-BASED AFFIRMATIVE ACTION 319
FIG. 17. Impact of SES AA on graduation and bar passage outcomes for low SES students. Academic outcomes seem to improve or staythe same overall for low SES students under the SES AA system, a result that directly contradicts the predictions of the mismatch hypothesis.
320 A. XIANG AND D. B. RUBIN
C.3 Changes by Tier
FIG. 18. Impact of SES AA on dropout rates. There are no statistically significant changes in dropout rates in going from racial AA to SESAA. Note that there were only seven black students who dropped out in the actual data, contributing to the large standard errors for thatprediction.

IMPACT OF CLASS-BASED AFFIRMATIVE ACTION 321
FIG. 19. Impact of SES AA on rates of not taking the bar. Rates of not taking the bar increase for black students in Tier 1 and Tiers 4–5 butdecrease for Tiers 2–3. The rates generally decrease for low SES students.

322 A. XIANG AND D. B. RUBIN
FIG. 20. Impact of SES AA on rates of passing bar on first try. First-try bar passage rates decrease for black students in Tier 1 but increasefor lower tiers. For low SES students, they increase for Tiers 1–3 but decrease for Tiers 4–5.

IMPACT OF CLASS-BASED AFFIRMATIVE ACTION 323
FIG. 21. Impact of SES AA on rates of passing bar on later try. Later-try bar passage rates generally decrease for black students. The ratesremain fairly constant for the other demographic groups.

324 A. XIANG AND D. B. RUBIN
FIG. 22. Impact of SES AA on bar failure rates. Bar failure rates increase for black students in Tier 1 and decrease across the remainderof the tiers, though with large error bars. The rates increase slightly for low SES students in Tier 1 and Tiers 4–5 but decrease for Tiers 2–3.

IMPACT OF CLASS-BASED AFFIRMATIVE ACTION 325
APPENDIX D: MODEL FIT FOR ACADEMICOUTCOMES
We simulated the academic outcomes based on theactual tier assignments and found that the model suc-cessfully predicted all of the quantities of interest towithin a 95% confidence interval.
TABLE 7Fitted values: Academic outcomes by race
Outcome variable Original Fitted (SE)
Dropout rate Black 0.1914 0.1922 (0.0177)White 0.0866 0.0868 (0.0029)
Did not attempt bar Black 0.0768 0.0837 (0.0138)White 0.0617 0.0625 (0.0024)
Passed bar first try Black 0.4589 0.4490 (0.0233)White 0.7731 0.7722 (0.0046)
Passed bar later try Black 0.1238 0.1219 (0.0123)White 0.0461 0.0463 (0.0024)
Failed to pass bar Black 0.1490 0.1532 (0.0161)White 0.0326 0.0322 (0.0019)
TABLE 8Fitted values: Academic outcomes by SES
Outcome variable Original Fitted (SE)
Dropout rate Low SES 0.1781 0.1787 (0.0162)High SES 0.0874 0.0877 (0.0030)
Did not attempt bar Low SES 0.0689 0.0730 (0.0133)High SES 0.0621 0.0631 (0.0024)
Passed bar first try Low SES 0.5974 0.5975 (0.0224)High SES 0.7646 0.7631 (0.0047)
Passed bar later try Low SES 0.0742 0.0713 (0.0128)High SES 0.0491 0.0494 (0.0022)
Failed to pass bar Low SES 0.0815 0.0794 (0.0127)High SES 0.0367 0.0367 (0.0018)
APPENDIX E: REGRESSION COEFFICIENTS
TABLE 9Regression coefficients for dropout rates
Coefficient Tier 1 (SE) Tier 2 (SE) Tier 3 (SE) Tier 4 (SE) Tier 5 (SE)
Intercept 5.06 (2.37) 0.77 (1.22) 0.91 (0.77) −1.09 (0.73) 1.44 (1.34)
Female −0.62 (0.22) −0.14 (0.12) −0.06 (0.08) −0.07 (0.07) −0.25 (0.14)
LSAT −0.19 (0.07) −0.08 (0.04) −0.09 (0.02) −0.03 (0.02) −0.09 (0.05)
LSAT percentile 1.74 (1.11) −0.08 (0.71) 0.37 (0.44) −0.43 (0.40) 0.18 (0.72)
UGPA −0.22 (0.30) −0.16 (0.16) −0.01 (0.11) 0.08 (0.09) −0.15 (0.16)
Black −1.56 (0.59) 0.21 (0.28) 0.31 (0.19) 0.71 (0.18) 0.71 (0.34)
Low SES 0.64 (0.72) 0.34 (0.30) 0.41 (0.21) 0.15 (0.18) 0.64 (0.33)
LSAT percentile: Black 4.79 (1.32) 0.32 (1.13) −0.96 (1.00) −0.79 (0.89) −1.15 (1.79)
LSAT percentile: Low SES −4.91 (4.32) 0.16 (0.80) 0.26 (0.52) 1.09 (0.39) 0.49 (0.68)
TABLE 10Regression coefficients for rates of not taking the bar
Coefficient Tier 1 (SE) Tier 2 (SE) Tier 3 (SE) Tier 4 (SE) Tier 5 (SE)
Intercept −2.98 (3.00) −0.56 (1.40) 2.26 (1.05) −3.09 (1.12) −3.45 (1.74)
Female −0.17 (0.19) −0.06 (0.11) 0.08 (0.10) 0.07 (0.09) 0.04 (0.16)
LSAT −0.12 (0.08) −0.04 (0.04) −0.16 (0.03) 0.01 (0.04) 0.01 (0.06)
LSAT percentile 2.61 (1.22) 0.80 (0.79) 2.41 (0.58) −0.18 (0.60) 0.23 (0.97)
UGPA 1.13 (0.33) −0.18 (0.15) −0.02 (0.13) −0.01 (0.12) 0.25 (0.19)
Black 0.54 (0.57) 0.44 (0.35) −0.22 (0.26) 0.50 (0.27) 1.25 (0.51)
Low SES 1.91 (0.78) 0.27 (0.34) −0.42 (0.33) 0.40 (0.27) −1.11 (0.70)
LSAT percentile: Black −0.05 (1.85) −3.36 (1.92) 0.78 (0.91) 0.16 (0.98) −4.34 (3.59)
LSAT percentile: Low SES −19.35 (10.27) −0.67 (0.89) 0.79 (0.74) 0.05 (0.59) 2.36 (1.10)

326 A. XIANG AND D. B. RUBIN
TABLE 11Regression coefficients for rates of passing bar on first try
Coefficient Tier 1 (SE) Tier 2 (SE) Tier 3 (SE) Tier 4 (SE) Tier 5 (SE)
Intercept −7.79 (2.12) −7.16 (1.25) −7.61 (0.94) −6.51 (0.79) −7.71 (1.72)
Female 0.07 (0.20) −0.22 (0.12) −0.08 (0.10) −0.12 (0.08) −0.48 (0.13)
LSAT 0.19 (0.06) 0.18 (0.04) 0.19 (0.03) 0.17 (0.03) 0.25 (0.06)
LSAT percentile −0.43 (1.05) −0.59 (0.76) −0.57 (0.55) −0.47 (0.44) −2.09 (0.90)
UGPA 0.94 (0.27) 0.99 (0.14) 1.04 (0.12) 0.96 (0.10) 0.76 (0.17)
Black 0.06 (0.37) −0.36 (0.24) −0.12 (0.19) −0.69 (0.19) −0.33 (0.41)
Low SES 0.84 (0.65) −0.76 (0.27) −0.44 (0.23) −0.09 (0.21) 0.59 (0.46)
LSAT percentile: Black −1.72 (1.51) −0.83 (0.91) −0.68 (0.83) −0.13 (0.81) −0.94 (1.51)
LSAT percentile: Low SES −2.34 (1.57) 0.29 (0.87) 0.34 (0.79) −0.01 (0.58) −0.74 (1.03)
TABLE 12Regression coefficients for rates of passing bar on later try
Coefficient Tier 1 (SE) Tier 2 (SE) Tier 3 (SE) Tier 4 (SE) Tier 5 (SE)
Intercept −4.61 (3.38) −4.92 (1.85) −2.52 (1.38) −3.37 (1.18) −4.41 (2.31)
Female 0.27 (0.41) 0.27 (0.21) 0.10 (0.18) −0.15 (0.14) −0.11 (0.23)
LSAT 0.12 (0.09) 0.14 (0.06) 0.04 (0.04) 0.11 (0.04) 0.15 (0.08)
LSAT percentile −1.04 (1.88) −1.94 (1.20) −0.31 (0.90) −1.78 (0.72) −1.14 (1.26)
UGPA 0.37 (0.56) 0.30 (0.27) 0.52 (0.22) 0.27 (0.17) 0.19 (0.30)
Black 0.26 (0.66) −0.21 (0.37) 0.30 (0.31) −0.47 (0.29) 0.31 (0.60)
Low SES −0.38 (1.15) −0.64 (0.44) −0.25 (0.36) −0.31 (0.32) 0.21 (0.78)
LSAT percentile: Black −0.17 (3.20) 0.30 (1.57) −3.49 (1.87) 1.32 (1.77) −6.78 (4.99)
LSAT percentile: Low SES −2.95 (3.45) 2.56 (1.92) 0.74 (1.70) 0.83 (1.09) −1.07 (1.99)
ACKNOWLEDGMENTS
We thank our peer reviewers for their thoughtfulcomments and insightful suggestions. Also, a specialthanks to Raj Chetty for helpful suggestions to relatedliterature and to the other members of the Statistics andEconomics Departments at Harvard who contributedtheir advice and support to this research project.
REFERENCES
ARCIDIACONO, P. (2005). Affirmative action in higher education:How do admission and financial aid rules affect future earnings?Econometrica 73 1477–1524. MR2156671
ARCIDIACONO, P. et al. (2012). The effects of Proposition 209on college enrollment and graduation rates in California. Paperpresented at Princeton Applied Microeconomics Seminar.
AYRES, I. and BROOKS, R. (2005). Does affirmative action reducethe number of black lawyers? Stanford Law Review 57 1807–1854.
CARD, D. and KRUEGER, A. B. (2004). Would the eliminationof affirmative action affect highly qualified minority applicants?Evidence from California and Texas. No. w10366. National Bu-reau of Economic Research, Cambridge, MA.
EPPLE, D., ROMANO, R. and SIEG, H. (2008). Diversity and affir-mative action in higher education. Journal of Public EconomicTheory 10 475–501.
FALLON, R. H. JR. (1995). Affirmative action based on economicdisadvantage. UCLA Law Review 43 1913–1951.
GELMAN, A. et al. (2006). A default prior distribution for logisticand other regression models. Unpublished manuscript. Avail-able at www.stat.columbia.edu/gelman.
GRAHAM, J. W., OLCHOWSKI, A. E. and GILREATH, T. D.(2007). How many imputations are really needed? Some practi-cal clarifications of multiple imputation theory. Prev. Sci. 8 206–213.
HO, D. E. (2005). Why affirmative action does not cause blackstudents to fail the bar. Yale Law Journal 117 1–8.
HOLLAND, P. W. (1986). Statistics and causal inference. J. Amer.Statist. Assoc. 81 945–970. MR0867618
KAHLENBERG, R. D. (1996). Class-based affirmative action. Cal-ifornia Law Review 84 1037–1100.
LAW SCHOOL ADMISSIONS COUNCIL (1991). National Longitu-dinal Bar Passage Study. Data prepared by Richard Sander.
LONG, M. C. and TIENDA, M. (2008). Winners and losers:Changes in Texas university admissions post-Hopwood. Educ.Eval. Policy Anal. 30 255–280.
MALAMUD, D. C. (1997). Assessing class-based affirmative ac-tion. J. Legal Educ. 47 452–471.

IMPACT OF CLASS-BASED AFFIRMATIVE ACTION 327
BRIEF OF EMPIRICAL SCHOLARS AS AMICI CURIAE IN SUP-PORT OF RESPONDENTS (2012). Fisher v. University of Texas.No. 11–345. Supreme Court of the US.
RUBIN, D. B. (1980). Discussion of “Randomization analysis ofexperimental data in the Fisher randomization test” by D. Basu.J. Amer. Statist. Assoc. 75 591–593.
RUBIN, D. B. (1987). Multiple Imputation for Nonresponse in Sur-veys. Wiley, New York. MR0899519
SANDER, R. H. (2004). A systemic analysis of affirmative actionin American law schools. Stanford Law Review 57 367–483.
WIGHTMAN, L. F. (1997). Threat to diversity in legal education:An empirical analysis of the consequences of abandoning raceas a factor in law school admission decisions. NYUL Rev. 721–53.
WIGHTMAN, L. F. and RAMSEY, H. JR. (1998). LSAC Researchreport series: LSAC National Longitudinal Bar Passage Study.