assessing the mediating role of marketing capability in ... · international journal of business...
TRANSCRIPT
International Journal of Business and Social Science Vol. 3 No. 23; December 2012
165
Assessing the Mediating Role of Marketing Capability in the Relationship between TQM
Practices and Innovation Performance Dynamic Capabilities Approach
Maha Mohammed Yusr
School of Business SBM
University Utara Malaysia UUM
Malaysia
Abdul Rahim Othman
School of Business SBM, UUM
Malaysia
Sany Sanuri Mohd Mokhtar
Quality Center, UUM
Malaysia
Abstract
Achieving high innovation performance has been considered as the best way to compete, survive, and gain market
share in the hyper competitive market. To do so, companies need to enhance and build its capabilities which
represent the main antecedents of innovation performance. In response to the aforementioned issue, this study
aims to investigate the effect of TQM as an effective organizational philosophy that enhances organizational performance and marketing capabilities, and in turn, innovation performance. To this end, a primary data is
collected from the manufacturing companies in Malaysia. Then, data is analyzed through Partial Least Square
PLS-SEM technique. The obtained results support all the formulated hypotheses.
Key words: TQM practices, marketing capabilities, innovation performance, dynamic capability, Partial Least Square PLS
1. Introduction
In fact, building and developing the capabilities of the organization have gained the attention of both managers
and theorists (Teece and Pisano, 1994) with the turbulence in the marketplace nowadays as the main reason
behind this attention. In this respect, achieving competitive advantage becomes a crucial factor for surviving and
sustainability (Schilling & Hill, 1998). To achieve that, innovation is the best weapon to compete, survive, and gain market share (Lundstedt & Moss, 1989; Porter, 1980; Cooper, 1998). In order to build and enhance
innovation performance, a bundle of capabilities should be built and developed, and, marketing capability is one
of the capabilities that strongly influence innovation performance of the organization (Dutta, Narasimhan, & Rajiv, 1999). Moreover, Day (1994) argued that one way marketing can make a more significant contribution to
the theory and practice of strategy is by explicit articulation of marketing capabilities.
Although the relationship between marketing capability and different aspects of organization’s performance has
been assessed by several studies, literature concerning the relationship is still limited (Weerawardena, 2003). This
lack of the studies is what underlies the intention behind the present study to examine this relationship empirically and provide some insight that will contribute to reduce the mentioned literature gap.
Among the most popular strategies and approaches that have been adopted to enhance many aspects of organizational performance, TQM practices have been confirmed by researchers to be a very important strategy in
helping organizations to create and sustain their competitive advantage (Idris & Zairi, 2006). However, studies
dedicated to the examination of how TQM practices enhance organizational capabilities, particularly marketing
capabilities are still few and far between. Thus, this study attempts to examine the effect of TQM practices on marketing capabilities. Furthermore, dynamic capabilities approaches will be the basis in which this relationship
will be addressed.

© Centre for Promoting Ideas, USA www.ijbssnet.com
166
Besides, this study tries to provide some light on manufacturing companies in Malaysia by determining the role of TQM practices in developing their capabilities which in turn, reflect on their innovation performance. To this end,
this study was carried out involving bit manufacturing companies in Malaysia as they are more suitable for their
technological and resources capabilities compared to their smaller counterparts (The World Bank: Malaysia Economic Monitor: Growth through Innovation, 2010).
1.2 Innovation performance of Malaysian manufacturing companies
Malaysia is planning to become a developed country by achieving Vision of Malaysia 2020 (10th Malaysia Plan
2011-2015, 2010). For that, Malaysia has developed and applied successive economic plans which helped the
country to move forward from stage to stage. Innovation Led Economy is one of the many plans that have been conducted with numerous procedures and steps to achieve the 2020 Vision (10th Malaysia plan 2011-2015,
2010). Malaysia has started to be concerned about innovation since 1990 (Lee, 2003; Lee & Chew-ging, 2007;
Saleh & Ndibisi, 2006), where it has carried out three waves of survey through its National Survey of Innovation in the manufacturing sector to determine the position of innovation performance in Malaysia (Lee, 2003). The
finding of these surveys is shown in Table 1 below:
Table 1: Innovation in the Malaysian Manufacturing Sector, 1990-2002
Items NSI-1 NSI-2 NSI-3 MyKe
Period 1990-1994 1997-1999 2000-2001 2000-2002
Number of innovation firms 270 217 263 771
Number of non-innovation firms 142 827 486 1048
Total number of firms 412 1044 749 1819
Percentage of innovating firms (%) 66 21 35 42
Source: NSI-1, NSI-2 and NSI-3 (National Survey of Innovation in Industry, 1997-1999, 2000; 2000-2001,
2003)
From Table 1 above, it is clear that there are negative variations in the incidence of innovation in the manufacturing sector from 66 to 21 per cent ( Lee & Chew-ging, 2007). After five years another indicator is
introduced as shown in Table 2 below:
Table 2: Innovation efforts by firms generally declined between 2002 and 2007
Innovation activity
All manufacturing
Firms
E&E Firms
2007 Chang from
2002
2007 Chang from
2002
Upgraded an existing product line 48.0 - 4.6 81.3 0.0
Developed a major new product line 26.2 - 3.6 46.9 -18.7
Upgraded machinery and equipment 60.3 - 2.0 84.4 0.0
Introduced new technology to change production process 27.6 - 1.7 50.0 +12.5
Filed patent/utility or copyright protected materials 11.1 - 3.2 9.7 -6.4
Subcontracted R&D projects to other organizations 6.1 + 1.5 6.3 +6.3
Agreed a new joint venture with foreign partner 5.2 + 1.0 6.3 -9.3 Source: The World Bank: Malaysia Economic Monitor: Growth through Innovation, 2010
According to the previous Tables, it can be concluded that despite adopting several policy initiatives and support
from institutions to help Malaysia become an innovation-led economy, the occurrence of innovation is still low in
Malaysia compared to what should have been based on its level of development. This fact encourages this study to investigate, determine and provide some insight that can help to enhance the innovation performance of
Malaysian manufacturing companies.

International Journal of Business and Social Science Vol. 3 No. 23; December 2012
167
2. Literature Review
In 1994, Teece and Pisano extended the Resource-Based View (RBV) Theory proposing the dynamic capabilities
theory as the total competencies/capabilities enabling a firm to come up with novel products and processes and to respond to the dynamic market situation. Hence, it can be stated that competitive advantage hinges on the
distinctive processes formed by the firm’s asset positions, the strategies employed and the processes undertaken.
Dynamic capability stresses on management capability and the unique combination of resources throughout the functions such as R&D, product and process development, manufacturing, human resources and organizational
learning (Lawson & Samson, 2001). As a result, the competition driver is not the introduction of new products or
processes but the firm’s capability of developing new products, and flexibly adopting to the dynamic environment (Prahalad & Hamel, 1990).
Moreover, dynamic capabilities theory is thus well-suited to the study of organizational innovation for two reasons. First, dynamic capability theory is more flexible, where it does not give a special focus on technology,
and where the technological capability theory is only among other resources and capabilities that can be available
to the organization to use in order to achieve high performance. This characteristic flexibility enables the
development of a holistic model of organizational innovation.
Second, the process of innovation may just be linked to the development of new products as well as it can be to new processes, systems or even business models. Additionally, the need for asset heterogeneity exhibits the lack
of one generic formula of innovation capability. However, there are generic threads that connect highly and lowly
innovative firms varying only in levels of importance (Tidd, Bessant & Pavitt, 2005).
Building on the previous discussion, this study uses dynamic capability theory to explain the relationship between
TQM practices and marketing capability. Applying TQM in a successful way requires several practices (e.g., leadership commitment, customer focus, people management, process management, supplier management, and
quality data reporting). Implementing those practices in the organization leads to generate several capabilities
within the organization. For example, leadership commitment to achieve quality performance provides an environment that encourages the trust and cooperation among the employees, which in turn, lead to knowledge
flow across the organization (Ju, Lin, Lin, & Kuo, 2006; Zeitz, Johannesson, & Jr, 1997). Furthermore, customer
focus orientation supports the organization with the necessary feedback regarding the customers’ attitudes,
preferences, and complaints. These kinds of information help the organization to improve its marketing capabilities to build good relationship with the customers, and facilitates its ability to solve and deal with
customers’ complaints to achieve customer satisfaction (Ooi, Teh, & Chong, 2009).
On the other side, TQM practices focus on developing people’s skills and capacities through the engagement of
employees in several kinds of training programs (Jones & Grimshaw, 2012; Perdomo-Ortiz, González-Benito, &
Galende, 2006), which provides the organization with skillful sales-force, and, skillful marketing team in general (Jones & Grimshaw, 2012). In addition, emphasizing TQM on managing process and continuous improvement in
all organizational aspects help to improve the process of making marketing decision, pricing, promotion activities,
distribution. To this end, the data related to improving the processes along with the previous success and failure stories have been recorded and reported to the relevant section (Perdomo-Ortiz, González-Benito, & Galende,
2009). Suppliers are one of the success factors especially for manufacturing companies. Therefore, establishing
good relationship with the suppliers is one of the principles that TQM asserts on. This kind of relationship
provides the necessary knowledge that helps to make right purchasing decision, develop the negotiation skills of the marketing team, and enhance the database with knowledge that relate to the suppliers in the industrial market.
According to the previous discussion the following hypothesis is formulated:
H1: There is a positive relationship between TQM practices and marketing capabilities.
On the other hand, dynamic capability theory is also considered among marketing capabilities that enhances
innovation performance. Moreover, marketing capability impacts on both technological and non-technological innovation, providing support for the view that marketing is an initiator of innovation activity in the organization
(Hutt, Reingen, & Ronchetto, 1988). Weerawardena (2003) confirmed that marketing capability influences both
innovation performance and competitive advantage.

© Centre for Promoting Ideas, USA www.ijbssnet.com
168
In another study conducted by Varadarajan (1992), it is concluded that marketing function is equipped to play a dominant role in the context of leveraging a number of distinctive organizational skills and resources into
sustainable positional advantages. Thus, based on the aforementioned statements the following hypothesis is
introduced:
H2: There is a positive relationship between marketing capabilities and innovation performance.
Regarding the relationship between TQM practices and innovation performance, although a review of literature
reveals that there is inconclusive finding among the previous studies, this study supports the argument that TQM
practices influence innovation performance. For example, Gustafson and Hundt (1995) asserted that TQM
practices represent the critical success factors that help to enhance innovation performance, where TQM helps the organization to be innovative through customer focus, which encourages the search of a better way to meet and
exceed customers’ requirements, and further, linking innovation with customers’ needs (Prajogo & Sohal, 2001).
Furthermore, people management and training programs will support the employees with required knowledge for innovation action (Kaynak, 2003; Snape, Wilkinson, Marchington, & Redman, 1995). Likewise, continuous
improvement, and supplier quality management provide the organization with important knowledge and
information from both inside and outside of the organization that helps to enhance the capabilities in the marketing field (Flynn, Schroeder, & Sakakibara, 1995). Pekovic and Galia (2009) argued that in order to achieve
considerable innovative performance, a very well-established quality is required through the organization. From
the previous discussion the following hypothesis is introduced:
H3: There is a positive relationship between TQM practices and innovation performance.
As discussed earlier, through dynamic capability theory it can be concluded that applying TQM practices provide the organization with distinctive marketing capabilities, which in turn, lead to enhancement of its innovation
performance (Weerawardena, 2003). In addition, building on the previous assumptions which meet the mediating
relationship criteria, it can be concluded that marketing capability play a mediating role in the relationship between TQM practices and innovation performance. Therefore, the following hypothesis is introduced:
H4: Marketing capability mediates the relationship between TQM practices and innovation performance.
Consequently, the following framework is introduced:
3. Research Methods
3.1. Sample and data collection
For the purpose of examining the conceptual model of this study, the data is collected from manufacturing
companies listed in Federation of Malaysian Manufacturing (FMM) (2010). For the justification mentioned
earlier, big companies have been chosen for this study. A survey research method is adopted to collect the data, where the instrument is adopted from the previous studies.
By using on-line survey approach, a total of 44 items was administrated randomly to 400 manufacturing companies. The unit of analysis of this study was represented by the following managers: CEO, quality manager,
R&D manager, or factory manager, as the researchers are convinced that those managers have knowledge
regarding the issue under study. Out of 400 distributed questionnaires, 138 usable questionnaires were returned, representing a response rate of 34.5 %.
TQM Practices Marketing
Capabilities
Innovation
Performance

International Journal of Business and Social Science Vol. 3 No. 23; December 2012
169
3.2. Data analysis
To evaluate the present model, Partial Least Square (PLS) analysis and Structural Equation Modeling (SEM)
techniques was adopted. PLS-SEM path modeling was adopted for several reasons; first of all, the model of the
present study includes formative construct (e.g., marketing capability construct), and, unlike CB-SEM approach, PLS-SEM has the ability to run formative constructs. Second, PLS-SEM is a nonparametric technique and,
consequently, does not assume normality of data. Third, PLS-SEM does not require a large sample size as CB-
SEM approach, and, since the sample size of the current study is considered small, PLS-SEM is a more suitable approach. Therefore, SmartPLS version 2.0.M3 was employed to examine the measurement of structural model.
As mentioned in the previous paragraph, this study has one formative construct represented by marketing capability. Unlike the reflective construct, the formative construct does not suppose that the measures are all
caused by a single underlying construct. Rather, it supposes that the measures all have an impact on (or cause) a
single construct. That is, the direction of causality flows from the indicators to the latent construct, and the
indicators, as a group, jointly determines the conceptual and empirical meaning of the construct (Jarvis, Mackenzie, & Podsakoff, 2003). Consequently, the processes to evaluate formative construct are quite different
from those that evaluate reflective constructs. The assessment of formative constructs and reflective constructs are
separately discussed in the following sections.
3.2.1. Formative construct
Marketing capability is formative first order construct, which consists of the cause-effect relationship between the manifest variables and the latent variable (Jarvis et al., 2003). Therefore, internal consistency reliability is not an
appropriate standard for evaluating the adequacy of the measures in formative models (Jarvis et al., 2003;
Mathieson, Peacock, & Chin, 1996). Instead, evaluating formative constructs require i) the assessment of the indicator/manifest relevance (weight); ii) the evaluation of the indicators significance (external validity); and iii)
the determination of the multicollinearity of indicators. The weight of the formative construct is shown in Table
(3) below:
Table (3) Items’ weight of marketing capability construct (formative construct)
MC construct Items Weight T-Value
MC1 -> MC -0.022 0.148
MC2 -> MC 0.277* 1.691
MC3 -> MC 0.162 0.763
MC4 -> MC 0.403** 2.181
MC5 -> MC 0.320** 1.986
** p < 0.05, * p < 0.01
Table (3) above shows that out of five items belonging to marketing capabilities, three were significant and
contribute to marketing capabilities. Although there were two items which were found to be non-significant,
formative indicators should never be discarded simply on the basis of statistical outcomes (Henseler, Ringle, & Sinkovics, 2009). Such actions may substantially change the content of the formative index (Jarvis et al., 2003).
Consequently, the researcher should keep both significant and insignificant formative indicators in the
measurement model as long as they are conceptually justified. As the items of marketing capabilities have been adopted from previous studies, this study is going to keep these insignificant indicators in the measurement model
of the current framework.
A concern with formative construct is the potential of multicollinearity among the items, which could produce
unstable estimates (Mathwick, Malhotra, & Rigdon, 2001). Accordingly, collinearity test is employed. Hair,
Anderson, Tatham and Black's (2010) procedure was followed. As defined in the multivariate literature, tolerance measure is the amount of the variance of the variable that is not explained by other variables. Similarly, VIF is the
inverse of tolerance value. According to Hair et al. (2010), tolerance values should be higher than 0.1, while VIF
values should be lower than 10. Table (4) indicates the multicollinearity result.
© Centre for Promoting Ideas, USA www.ijbssnet.com
170
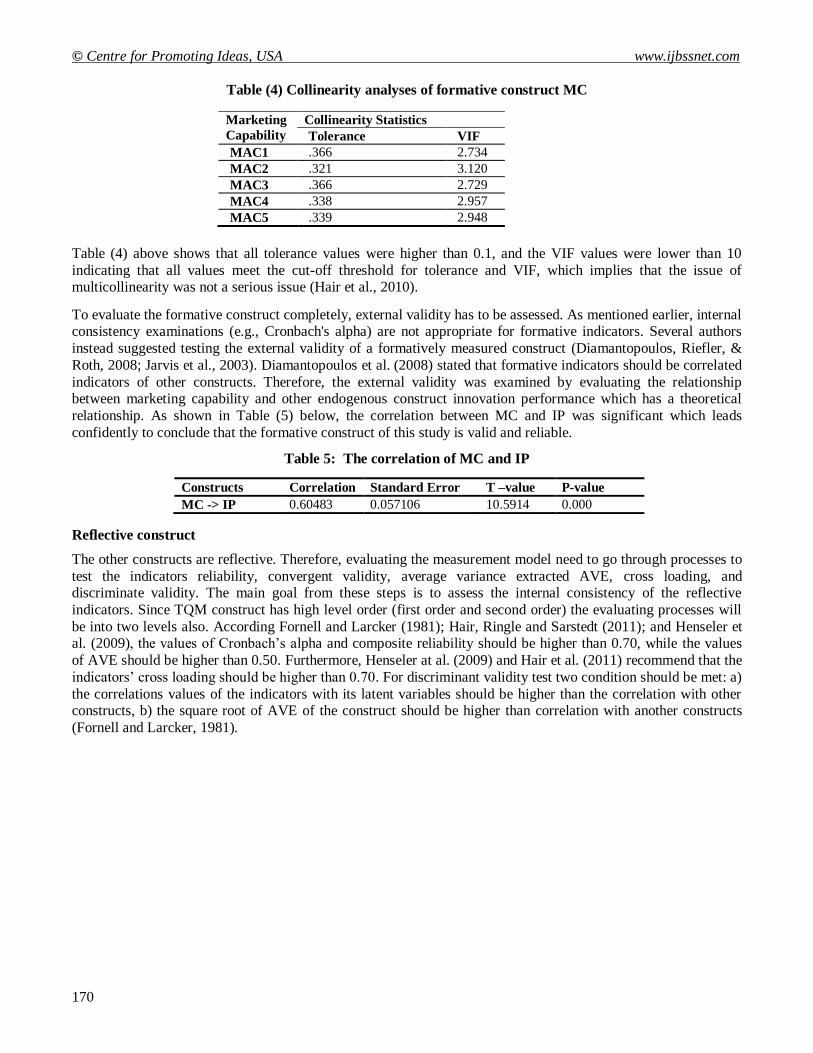
Table (4) Collinearity analyses of formative construct MC
Table (4) above shows that all tolerance values were higher than 0.1, and the VIF values were lower than 10
indicating that all values meet the cut-off threshold for tolerance and VIF, which implies that the issue of multicollinearity was not a serious issue (Hair et al., 2010).
To evaluate the formative construct completely, external validity has to be assessed. As mentioned earlier, internal consistency examinations (e.g., Cronbach's alpha) are not appropriate for formative indicators. Several authors
instead suggested testing the external validity of a formatively measured construct (Diamantopoulos, Riefler, &
Roth, 2008; Jarvis et al., 2003). Diamantopoulos et al. (2008) stated that formative indicators should be correlated
indicators of other constructs. Therefore, the external validity was examined by evaluating the relationship between marketing capability and other endogenous construct innovation performance which has a theoretical
relationship. As shown in Table (5) below, the correlation between MC and IP was significant which leads
confidently to conclude that the formative construct of this study is valid and reliable.
Table 5: The correlation of MC and IP
Constructs Correlation Standard Error T –value P-value
MC -> IP 0.60483 0.057106 10.5914 0.000
Reflective construct
The other constructs are reflective. Therefore, evaluating the measurement model need to go through processes to
test the indicators reliability, convergent validity, average variance extracted AVE, cross loading, and discriminate validity. The main goal from these steps is to assess the internal consistency of the reflective
indicators. Since TQM construct has high level order (first order and second order) the evaluating processes will
be into two levels also. According Fornell and Larcker (1981); Hair, Ringle and Sarstedt (2011); and Henseler et al. (2009), the values of Cronbach’s alpha and composite reliability should be higher than 0.70, while the values
of AVE should be higher than 0.50. Furthermore, Henseler at al. (2009) and Hair et al. (2011) recommend that the
indicators’ cross loading should be higher than 0.70. For discriminant validity test two condition should be met: a)
the correlations values of the indicators with its latent variables should be higher than the correlation with other constructs, b) the square root of AVE of the construct should be higher than correlation with another constructs
(Fornell and Larcker, 1981).
Marketing
Capability
Collinearity Statistics
Tolerance VIF
MAC1 .366 2.734
MAC2 .321 3.120
MAC3 .366 2.729
MAC4 .338 2.957
MAC5 .339 2.948

International Journal of Business and Social Science Vol. 3 No. 23; December 2012
171
Table 6: CFA of First order construct
Construct Items Internal
reliability
Convergent
validity
Construct Items
Cronbach’s
alpha
Factor
Loading
Composite
reliability
AVE
TQM LMC1 0.901 0.818 0.927 0.718
LMC3 0.838
LMC4 0.767 LMC5 0.910
LMC6 0.897
CF1 0.912 0.813 0.935 0.718 CF2 0.889
CF3 0.891
CF4 0.900
CF6 0.808
PEM1 0.919 0.814 0.937 0.712
PEM2 0.898
PEM3 0.868
PEM4 0.849
PEM5 0.838
PEM6 0.791
PRM1 0.915 0.863 0.936 0.746
PRM2 0.889
PRM3 0.867
PRM4 0.846
PRM5 0.854
SQM1 0.871 0.722 0.907 0.663
SQM4 0.841
SQM5 0.890
SQM6 0.829
SQM7 0.780
QDR1 0.908 0.796 0.932 0.732
QDR2 0.854
QDR3 0.873 QDR4 0.854
QDR5 0.898
IP IP1 0.927 0.819 0.940 0.662 IP2 0.878
IP3 0.814
IP4 0.809
IP5 0.779
IP6 0.831
IP7 0.732
IP8 0.839

© Centre for Promoting Ideas, USA www.ijbssnet.com
172
Table 7: Cross loading of the first order of TQM construct
CF IP LMC PEM PRM QDR SQM
CF1 0.801 0.339 0.695 0.557 0.560 0.542 0.560
CF2 0.879 0.483 0.629 0.646 0.704 0.595 0.631
CF3 0.885 0.539 0.695 0.696 0.721 0.678 0.618
CF4 0.894 0.426 0.694 0.692 0.730 0.688 0.672
CF5 0.679 0.289 0.498 0.527 0.545 0.480 0.522
CF6 0.804 0.363 0.651 0.634 0.654 0.639 0.619
IP1 0.338 0.819 0.350 0.454 0.408 0.427 0.429
IP2 0.404 0.878 0.438 0.503 0.484 0.501 0.463
IP3 0.342 0.814 0.378 0.517 0.482 0.455 0.458
IP4 0.392 0.809 0.389 0.433 0.451 0.413 0.455
IP5 0.415 0.779 0.349 0.429 0.474 0.459 0.463
IP6 0.391 0.831 0.334 0.442 0.445 0.516 0.472
IP7 0.458 0.732 0.329 0.465 0.489 0.387 0.453
IP8 0.495 0.839 0.500 0.519 0.587 0.560 0.522
LMC1 0.639 0.351 0.807 0.494 0.500 0.538 0.526
LMC2 0.418 0.272 0.649 0.463 0.355 0.462 0.486
LMC3 0.660 0.361 0.852 0.531 0.557 0.561 0.532
LMC4 0.536 0.392 0.769 0.379 0.467 0.462 0.568
LMC5 0.769 0.456 0.894 0.710 0.711 0.644 0.647
LMC6 0.718 0.452 0.876 0.629 0.605 0.621 0.571
PEM1 0.633 0.444 0.543 0.814 0.671 0.629 0.531
PEM2 0.637 0.498 0.547 0.898 0.720 0.628 0.572
PEM3 0.726 0.521 0.628 0.868 0.721 0.721 0.640
PEM4 0.574 0.519 0.571 0.849 0.645 0.580 0.572
PEM5 0.705 0.509 0.594 0.838 0.753 0.649 0.626
PEM6 0.553 0.438 0.498 0.791 0.609 0.578 0.627
PRM1 0.675 0.559 0.623 0.731 0.863 0.693 0.713
PRM2 0.728 0.479 0.573 0.690 0.889 0.654 0.675
PRM3 0.675 0.427 0.542 0.702 0.867 0.605 0.604
PRM4 0.658 0.496 0.521 0.671 0.846 0.659 0.566
PRM5 0.688 0.578 0.630 0.730 0.854 0.702 0.673
QDR1 0.652 0.608 0.567 0.735 0.699 0.796 0.631
QDR2 0.594 0.572 0.548 0.603 0.619 0.854 0.702
QDR3 0.667 0.460 0.610 0.605 0.678 0.873 0.652
QDR4 0.585 0.369 0.561 0.631 0.614 0.854 0.666
QDR5 0.641 0.441 0.625 0.631 0.670 0.898 0.675
SQM1 0.550 0.450 0.563 0.473 0.557 0.625 0.738
SQM2 0.500 0.413 0.527 0.470 0.534 0.575 0.690
SQM3 0.342 0.326 0.340 0.367 0.356 0.377 0.613
SQM4 0.600 0.482 0.565 0.592 0.583 0.636 0.853
SQM5 0.667 0.478 0.597 0.621 0.695 0.661 0.859
SQM6 0.592 0.421 0.508 0.550 0.572 0.568 0.795
SQM7 0.590 0.457 0.510 0.635 0.640 0.654 0.754
Table 8: Fornell-Larcker criterion (discriminant validity) (first order of TQM construct)
Construct Square root
of AVE
IP CF LMC PEM PRM SQM QDR
IP 0.814 1
CF 0.861 0.502 1
LMC 0.848 0.477 0.789 1
PEM 0.844 0.580 0.751 0.659 1
PRM 0.864 0.589 0.785 0.678 0.816 1
SQM 0.814 0.574 0.725 0.665 0.708 0.751 1
QDR 0.856 0.563 0.732 0.672 0.750 0.768 0.773 1

International Journal of Business and Social Science Vol. 3 No. 23; December 2012
173
Reviewing the above result indicates that all values of Cronbach’s alpha and composite reliability exceed the
threshold of 0.70, and the same conclusion was reached with the AVE test as the values exceed the cut-off values
of 0.50. As the statistics results show in the previous Tables, all values of cross loading and discriminant test
meet the recommended values where cross loadings of all indicators go beyond the recommended value 0.70, and, Fornell-Larcker criterion for discriminant validity indicates that all square root of AVE values of the latent
constructs were higher than correlation values with other constructs. Thus, it can be concluded that all reflective
constructs showed an adequate measurement model. Given this result, the hypotheses could be tested through the examination of the structural model which is discussed in the coming section.
Structural Model
Before examining the hypotheses, the predictive relevance of the model is tested. The quality of the structural
model can be assessed by R2 which shows the variance in the endogenous variable that is explained by the
exogenous variables. The R2 value is assessed based on assessment criterion suggested by Cohen (1988), where
0.26 is considered as substantial, 0.13 moderate, and 0.02 weak.
An additional criterion to evaluate the quality of the model is through the use of Blindfolding procedure to assess
the model’s capability to predict (Hair et al., 2011). According to Henseler et al. (2009), blindfolding procedure is
only applied to endogenous latent variable that has formative measurement model. The predictive relevance Q2
comes in two forms which are cross-validated redundancy and cross-validated communality (Hair et al., 2011).
Hair et al. (2011) recommended using the cross-validated redundancy where the use of PLS-SEM is required to
estimate both the structural model and the measurement model for data prediction. Therefore, cross-validated
redundancy is perfectly suitable for the PLS-SEM approach. The cross-validated redundancy measure value (i.e., Q²) should be higher than zero, otherwise, it indicates a lack of predictive relevance (Fornell and Cha, 1994;
Henseler et al., 2009). The following Table shows the prediction relevance of the model.
Table 9: Prediction Relevance of the Model
Endogenous R square Cross-Validated
Redundancy
IP 0.453 0.297
As reported in the above Table (9), R2 was found to be 0.453 indicating that TQM and MC can account for 45%
of the variance in the innovation performance. According to Henseler et al. (2009), if a particular inner path
model structures only partially explain endogenous latent variables by only a few (e.g., one or two), it is acceptable to consider exogenous latent variables with a moderate R
2. Referring to Cohen (1988) criterion, R
2 of
this study is considered substantial indicating the power of TQM and MC in explaining the innovation
performance. Regarding the Q2 value, as shown in Table 11 above, the cross-redundancy value was found to be
(0.297) more than zero. This result supports the claim that the model has an adequate prediction quality.
Having established the validity and the reliability of the measurement model, this paves the way to move to the next step which is testing the hypothesized relationship by running PLS algorithm and Bootstrapping algorithm in
SmartPLS 2.0. As shown in Table (10).
Table 10: Hypothesis testing result
Hypotheses path
coefficient
Standard
Error
T-Value P-value Decision
H1: TQM -> MC 0.631 0.066 9.581 0.000 Supported
H2: MC -> IP 0.327 0.091 3.584 0.000 Supported
H3: TQM -> IP 0.413 0.093 4.453 0.000 Supported
H4: TQM -> MC -> IP 0.207 0.066 3.12 0.001 Supported
Mediating Effect
To figure out the mediating role of MC in the relationship between TQM and IP, Baron and Kenny’s (1986)
criteria are followed. According to Baron and Kenny (1986), the following conditions have to be met to be able to claim that there is mediating relationship:

© Centre for Promoting Ideas, USA www.ijbssnet.com
174
a. The predictor TQM has to significantly influence the mediator MC (H1); b. The mediator MC has to significantly impact the criterion variable IP (H2); and
c. The predictor TQM has to significantly influence the criterion variable IP without the mediator influence.
Bootstrapping technique was used to determine the mediating relationship; accordingly, the result support the
mediating effect of MC in the relationship between TQM and IP (β= 0.207, t= 3.12, p<0.001) (H4) as shown in
Table 12. After excluding the mediating variable, the direct relationship between TQM and innovation was tested and a significant relationship was found between TQM and IP (β= 0.625, t= 10.071, p<0.001). By comparing the
path value between TQM and IP in the two cases (e.g., with mediating effect and without mediating effect) it was
found that the path value, although still significant, is reduced when the mediating variable MC, was introduced to this relationship. Thus, MC is established as a partial mediator in this relationship. To estimate the size of indirect
effect of TQM on IP through MC, the present study used the Variance Accounted For (VAF) values, which
represent the ration of the indirect effect to the total effect. The VAF value indicates that 33.4% of the total effect
of TQM on IP is explained by indirect effect (MC) as shown in the following equation.
𝑉𝐴𝐹 = 𝑎 × 𝑏
𝑎 × 𝑏 + 𝑐=
0.631 × 0.327
0.631 × 0.327 + 0.413= 0.334
Goodness of Fit (GoF) of the Model
In contrast to CBSEM approach, PLS-SEM has only one measure of goodness of fit which was defined by
Tenenhaus, Vinzi, Chatelin and Lauro (2005) as the global fit measure (GoF). This measure is the geometric
mean of the average variance extracted and the average R2 for the endogenous variables. GoF is calculated by the
following formula:
According to Wetzels, Odekerken-Schröder and Oppen (2009) criterion, the outcome demonstrated that the model’s goodness of fit measure is large and adequate for global PLS model validity, where Wetzels et al. (2009)
suggested that small =0.1, medium =0.25 and large =0.36.
Discussion and Conclusions
Maintaining and enhancing innovation performance has been considered as the key engine to achieve competitive
advantage, gain market share and customer loyalty (Cooper, 1998; Porter, 1980). Recently, the tendency of most
of the studies concerned with innovation is the investigation of factors that can be the antecedences of high
innovative performance. However, the past studies somehow ignored the effect of the organizations’ capabilities. Thus, there is lack of studies that examine the effect of capabilities, and, specially marketing capabilities on
innovation performance. Consequently, this study is one of the studies that aim to answer the question: how can
organizations enhance their innovation performance? To this end, the study introduces the framework through which the effect of TQM practices and marketing capabilities on the innovation performance was examined.
Therefore, the main purpose of this study is to explore the following point.
First, examining the effect of integration of TQM and marketing capabilities on innovation performance is the
main goal of this study. To achieve this goal, the relationship between TQM practice and marketing capabilities was examined. The finding shows that TQM practices have a positive and significant effect on marketing
capabilities of the organization (β = 0.631, t = 9.581, p > 0.001). This result is compatible with previous studies
(Lorente, Dewhurst, & Dale, 1999; Perdomo-Ortiz et al., 2006; Prajogo & Hong, 2008; Santos-Vijande & Lez,
2007), and provides additional evidence of the importance of TQM practice to the organizations.
Second, the relationship between marketing capabilities and innovation performance also has been examined. The
outcome indicated that marketing capabilities contribute significantly to enhance the innovation performance (β = 0.327, t = 3.584, p > 0.001).
)AVE(y Communalit Average x R 2
GOF
749.0 )0.662(y Communalit Average x 0.848 2
GOF

International Journal of Business and Social Science Vol. 3 No. 23; December 2012
175
This result is in line with dynamic capabilities theory that considers the organization’s capabilities as the most
important antecedent to achieve high innovation performance (Teece & Pisano, 1994). Furthermore, the direct
relationship between TQM practices and innovation performance was examined. The obtained result indicates that
there is a positive and significant relationship between TQM practices and innovation performance (β = 0.413, t = 4.453, p > 0.001). This result is similar to that obtained by Flynn, Schroeder and Sakakibara (1994) and is
consistent with Hung, Lien, Yang, Wu and Kuo (2010) and Prajogo and Sohal's (2003) conclusion, where they
confirmed that TQM is not only a tool to improve quality, it is also provides a suitable environment that reinforces innovation performance.
Finally, having established the relationship among TQM practices, marketing relationship and innovation performance, the partial mediating role of marketing capabilities in the relationship between TQM practices and
innovation performance was also established as significant (β = 0.207, t = 3.12, p > 0.001). Moreover, the
outcome indicates that 33% of the total effect of TQM practices on innovation performance is explained through
marketing capabilities.
The implications of this study are presented by providing the evidence that companies aiming to be innovative need to continuously enhance and build their capabilities. Additionally, through the findings of this study, it can
be advised that managers should adopt and apply quality practices within their companies, as it was confirmed
that TQM practices provide an environment that help and pave the way to develop and build the organization’s capabilities. This study also highlights that marketing capabilities is one of other organization’s capabilities that
lead to superior innovation performance. Therefore, managers of companies should give more attention and
allocate necessary resources to build and enhance these kinds of capabilities.
References
10th Malaysia Plan 2011-2015. (2010).
Baron, R. M., & Kenny, D. a. (1986). The moderator-mediator variable distinction in social psychological research:
conceptual, strategic, and statistical considerations. Journal of personality and social psychology, 51(6), 1173–82. Cohen, J. (1988). Statistical power analysis for the behavioral sciences (2nd ed.). Hillsdale, Lawrence Erlbaum Associates,
NJ.
Cooper, J. (1998). A multidimensional approach to the adoption of innovation. Management Decision, 36(8), 493–502.
Day, G. S. (1994). The Capabilities of Market-Driven Organizations. Journal of Marketing, 58(October), 37–52.
Diamantopoulos, A., Riefler, P., & Roth, K. P. (2008). Advancing formative measurement models. Journal of Business
Research, 61(12), 1203–1218.
Dutta, S., Narasimhan, O., & Rajiv, S. (1999). Success in High-Technology Markets: Is Marketing Capability Critical?
Marketing Science, 18(4), 547–568.
Flynn, B. B., Schroeder, R. G., & Sakakibara, S. (1994). A framework for quality management research and an associated
measurement instrument. Journal of Operations Management, 11(4), 339–366.
Flynn, B. B., Schroeder, R. G., & Sakakibara, S. (1995). The impact of quality management practices on performance and competitive adv ... Decision Sciences, 26(5), 659–691.
Fornell, C., & Larcker, D. F. (1981). Evaluating structural equation models with unobservable variables and measurement
Error. Journal of Marketing Research, 18(Feb), 39–50.
Gustafson, H., & Hundt, A. (1995). Findings of innovation research applied to quality management principles for health care.
Health Care Management Review, 20(2), 16–33.
Hair, J. F., Anderson, R. E., Tatham, R. L., & Black, W. C. (2010). Multivariate Data Analysis (7th Ed.). Prentice Hall, USA.
Hair, J. F., Ringle, C. M., & Sarstedt, M. (2011). PLS-SEM: Indeed a Silver Bullet. The Journal of Marketing Theory and
Practice, 19(2), 139–152.
Henseler, J., Ringle, C. M., & Sinkovics, R. R. (2009). The use of Partial Least Squares Path Modeling in International
Marketing. Advances in International Marketing, 20, 277–319.
Hung, R. Y. Y., Lien, B. Y.-H., Yang, B., Wu, C.-M., & Kuo, Y.-M. (2010). Impact of TQM and organizational learning on
innovation performance in the high-tech industry. International Business Review, 20(2), 213–225. Hutt, M. D., Reingen, P. H., & Ronchetto, J. R. (1988). Tracing Emergent Processes in Marketing Strategy Formation,
52(January), 4–19.
Idris, M. A., & Zairi, M. (2006). Sustaining TQM: A Synthesis of Literature and Proposed Research Framework. Total
Quality Management & Business Excellence, 17(9), 1245–1260. doi:10.1080/14783360600750535
Jarvis, C. B., Mackenzie, S. B., & Podsakoff, P. M. (2003). Critical Review and of Construct Indicators and Measurement
Model Marketing in Misspecification. Journal of Consumer Research, 30(September), 199–217.
Jones, B., & Grimshaw, D. (2012). Training and skills to improve innovation in firms (pp. 1–38). Manchester.

© Centre for Promoting Ideas, USA www.ijbssnet.com
176
Ju, T. L., Lin, B., Lin, C., & Kuo, H. (2006). TQM critical factors and KM value chain activities. Total Quality Management
& Business Excellence, 17(3), 373–393. Kaynak, H. (2003). The relationship between total quality management practices and their effects on firm performance.
Journal of Operations Management, 21(4), 405–435.
Lawson, B., & Samson, D. (2001). Developing Innovation Capability in Organisations: a Dynamic Capabilities Approach.
International Journal of Innovation Management, 05(03), 377–400.
Lee, C. (2003). Determinants of Innovation in the Malaysian Manufacturing Sector : An Econometric Analysis at the Firm
Level. 22 September, Kuala Lumpur.
Lee, C., & Chew-ging, L. (2007). Encouraging innovation in Malaysia Appropriate sources of finance. CACCI, 1, 23–28.
Lorente, A. R. M., Dewhurst, F., & Dale, B. G. (1999). TQM and business innovation. European Journal of Innovation
Management, 2(1), 12–19.
Mathieson, K., Peacock, E., & Chin, W. W. (1996). Extending the Technology Acceptance Model: The Influence of
Perceived User Resources. WP 96 – 18, Faculty of Management, University of Calgary. Mathwick, C., Malhotra, N., & Rigdon, E. (2001). Experiential value: conceptualization, measurment and application in the
catalog and internet shopping envirnment. Journal Retailing, 77, 9–16.
National Survey of Innovation in Industry, 1997-1999. (2000). Kuala Lumpur.
National Survey of Innovation in Industry, 2000-2001. (2003). Putrajaya.
Ooi, K.-B., Teh, P.-L., & Chong, A. Y.-L. (2009). Developing an integrated model of TQM and HRM on KM activities.
Management Research News, 32(5), 477–490.
Pekovic, S., & Galia, F. (2009). From quality to innovation: Evidence from two French Employer Surveys. Technovation,
29(12), 829–842.
Perdomo-Ortiz, J., González-Benito, J., & Galende, J. (2006). Total quality management as a forerunner of business
innovation capability. Technovation, 26(10), 1170–1185. doi:10.1016/j.technovation.2005.09.008
Perdomo-Ortiz, J., González-Benito, J., & Galende, J. (2009). The intervening effect of business innovation capability on the
relationship between Total Quality Management and technological innovation. International Journal of Production Research, 47(18), 5087–5107.
Porter, E. M. (1980). Competitive strategy: Techniques for analyzing industries and competitors. New York: A Division of
Macmillan Publishing Co., Inc.
Prahalad, C. K., & Hamel, G. (1990). The Core Competence of the Corporation. harvard business review, May-June, 1–15.
Prajogo, D. I., & Hong, S. W. (2008). The effect of TQM on performance in R&D environments: A perspective from South
Korean firms. Technovation, 28(12), 855–863. Prajogo, D. I., & Sohal, A. S. (2001). TQM and innovation : a literature review and research framework, 21(July 2000), 539–558. Prajogo, D. I., & Sohal, A. S. (2003). The relationship between TQM practices, quality performance, and innovation performance: An
empirical examination. International Journal of Quality & Reliability Management, 20(8), 901–918.
Saleh, A. S., & Ndibisi, N. O. (2006). SME Development in Malaysia : Domestic and Global Challenges. University of
Wollongong.
Santos-Vijande, M. L., & Lez, L. I. A. lvarez-G. (2007). Innovativeness and organizational innovation in total quality
oriented firms: The moderating role of market turbulence. Technovation, 27(9), 514–532.
Schilling, M. A., & Hill, C. W. L. (1998). Managing the new product development process : Strategic imperatives. Academy
of Management Excutive, 12(3), 67–81.
Snape, E., Wilkinson, A., Marchington, M., & Redman, T. (1995). Managing human resources for TQM: possibilities and
Emerald pitfalls. Employee Relations,, 17(3), 42–51.
Teece, D. J., & Pisano, G. (1994). ’The dynamic capabilities of firms: An introduction. Industrial and Corporate Change, 3(3), 537–556.
Tenenhaus, M., Vinzi, V. E., Chatelin, Y.-M., & Lauro, C. (2005). PLS path modeling. Computational Statistics & Data
Analysis, 48(1), 159–205.
The World Bank: Malaysia Economic Monitor: Growth through Innovation. (2010). (pp. 1–126).
Tidd, J., Bessant, J., & Pavitt, K. (2005). Managing Innovation: Integrating Technological, Market and Organizational
Change (3rd ed.). Hoboken: John Wiley & Sons Inc.
Varadarajan, P. R. (1992). Marketing’s contribution to strategy: the view from a different looking Glass. Journal of the
Academy of Marketing Science, 20(4), 335–343.
Weerawardena, J. (2003). The role of marketing capability in innovation-based competitive strategy. Journal of Strategic
Marketing, 11(1), 15–35.
Wetzels, M., Odekerken-Schröder, G., & Oppen, C. van. (2009). Using PLS P Ath Modeling For Assessing Hierarchical
Construct Models : Guidelines and Empirical. MIS Quarterly Vol., 33(1), 177–195. Zeitz, G., Johannesson, R., & Jr, J. E. R. (1997). An employee survey measuring total quality management practices and
culture : Development and Validation. Group & Organization Management, 22(4), 414–444.