assessing the impact of sediments from dredging on corals · 2017-05-15 · the wamsi dredging...
TRANSCRIPT

Assessing the impact of sediments from dredging on corals Ross Jones1,4, Pia Bessell-Browne1,2,4, Rebecca Fisher1,4, Alan Duckworth1,4, Wojciech Klonowski3, Matthew Slivkoff3 1 Australian Institute of Marine Science, Perth, Western Australia, Australia
2 The Oceans Institute and The Centre for Microscopy, Characterisation and Analysis, The University of Western Australia, Perth, Western Australia, Australia
3 Curtin University, Bentley, Western Australia, Australia
4 Western Australian Marine Science Institution, Perth, Western Australia, Australia
WAMSI Dredging Science Node Theme 4 Report
Project 4.1 April 2017


WAMSI Dredging Science Node
The WAMSI Dredging Science Node is a strategic research initiative that evolved in response to uncertainties in the environmental impact assessment and management of large-scale dredging operations and coastal infrastructure developments. Its goal is to enhance capacity within government and the private sector to predict and manage the environmental impacts of dredging in Western Australia, delivered through a combination of reviews, field studies, laboratory experimentation, relationship testing and development of standardised protocols and guidance for impact prediction, monitoring and management.
Ownership of Intellectual property rights
Unless otherwise noted, any intellectual property rights in this publication are owned by the Western Australian Marine Science Institution, the Australian Institute of Marine Science and the University of Western Australia.
Copyright
© Western Australian Marine Science Institution
All rights reserved.
Unless otherwise noted, all material in this publication is provided under a Creative Commons Attribution 3.0 Australia Licence. (http://creativecommons.org/licenses/by/3.0/au/deed.en)
Funding Sources
The $20million Dredging Science Node is delivering one of the largest single issue environmental research programs in Australia. This applied research is funded by Woodside Energy, Chevron Australia, BHP Billiton and the WAMSI Partners and designed to provide a significant and meaningful improvement in the certainty around the effects, and management, of dredging operations in Western Australia. Although focussed on port and coastal development in Western Australia, the outputs will also be broadly applicable across Australia and globally.
This remarkable collaboration between industry, government and research extends beyond the classical funder-provider model. End-users of science in regulator and conservation agencies, and consultant and industry groups are actively involved in the governance of the node, to ensure ongoing focus on applicable science and converting the outputs into fit-for-purpose and usable products. The governance structure includes clear delineation between end-user focussed scoping and the arms-length research activity to ensure it is independent, unbiased and defensible.
And critically, the trusted across-sector collaboration developed through the WAMSI model has allowed the sharing of hundreds of millions of dollars worth of environmental monitoring data, much of it collected by environmental consultants on behalf of industry. By providing access to this usually confidential data, the Industry Partners are substantially enhancing WAMSI researchers’ ability to determine the real-world impacts of dredging projects, and how they can best be managed. Rio Tinto's voluntary data contribution is particularly noteworthy, as it is not one of the funding contributors to the Node.
Funding and critical data Critical data

Legal Notice
The Western Australian Marine Science Institution advises that the information contained in this publication comprises general statements based on scientific research. The reader is advised and needs to be aware that such information may be incomplete or unable to be used in any specific situation. This information should therefore not solely be relied on when making commercial or other decision. WAMSI and its partner organisations take no responsibility for the outcome of decisions based on information contained in this, or related, publications.
Year of publication: 2017
Metadata: http://catalogue.aodn.org.au/geonetwork/srv/eng/metadata.show?uuid=882deb07-b6d1-4bb0-9070-3fa52b84b5dc
Citation: Jones R, Bessell-Browne P, Fisher R, Klonowski W, Slivkoff M (2017) Assessing the impacts of sediments from dredging on corals. Report of Theme 4 – Project 4.1 Dredging Science Node, Western Australian Marine Science Institution (WAMSI). Perth, Western Australia, 33pp.
Author Contributions: Conceived the study RJ, PB-B, RF. Conducted the analyses, and developed the model RJ, P B-B RJ. Conducted the PSD and light quality and quantity measurements MS, WK. All authors contributed to the writing and approved the final review.
Corresponding author and Institution: Ross Jones (AIMS). Email: r.jones.aims.gov.au
Competing Interests: The commercial investors and data providers had no role in the data analysis, data interpretation, the decision to publish or in the preparation of the manuscript. The authors have declared that no competing interests exist.
Acknowledgements: Dr Ray Masini and Mr Kevin Crane (WAMSI Dredging Science Node, Node Leadership Team) for their advice and assistance during the project and the preparation of this report.
Collection permits/ethics approval: No collection occurred in the production of this report
Publications supporting this work:
Jones R, Bessell-Browne P, Fisher R, Klonowski W, Slivkoff M (2016) Assessing the impacts of sediments from dredging on corals. Marine Pollution Bulletin http://dx.doi.org/10.1016/j.marpolbul.2015.10.049
Front cover images (L-R) Image 1: Trailing Suction Hopper Dredge Gateway in operation during the Fremantle Port Inner Harbour and Channel Deepening Project.
(Source: OEPA)
Image 2: Close up image of the reef flat at Scott Reef (Source: AIMS)
Image 3: Dredge Plume at Barrow Island. Image produced with data from the Japan Aerospace Exploration Agency (JAXA) Advanced Land Observing Satellite (ALOS) taken on 29th August 2010.
Image 4: Close up image of the reef flat at Scott Reef (Source: AIMS)

Dredging Science Node | Theme 4| Project 4.1
Contents EXECUTIVE SUMMARY ...................................................................................................................................... I
CONSIDERATIONS FOR PREDICTING AND MANAGING THE IMPACT OF DREDGING ......................................... III
RESIDUAL KNOWLEDGE GAPS .......................................................................................................................... V
PUBLICATIONS ................................................................................................................................................. 1
1. ASSESSING THE IMPACTS OF SEDIMENTS FROM DREDGING ON CORALS. ...................................................................1

Dredging Science Node | Theme 4 | Project 4.1
Assessing the impacts of sediments from dredging on corals
Dredging Science Node | Theme 4 | Project 4.1
i
Executive summary
The release of sediment into the water column by dredging and dredging-related activities such as dredge material placement (spoil disposal) increases water cloudiness (turbidity) causing a range of effects on the underlying habitats. There is a pressing need to derive relevant water quality thresholds to better manage dredging projects whilst underway, or for use beforehand at the environmental impact assessment (EIA) stage, to predict the likely environmental outcomes. Increased confidence in outcomes would result in less compliance monitoring, in turn imparting significant cost savings to dredging proponents and more timely approvals1.
A comprehensive review2 was conducted of all available scientific literature on the effects of sediments on corals to guide subsequent laboratory and field-based studies associated with threshold development. To frame the review, a conceptual model was developed using the US Environmental Protection Agency (USEPA) causal/diagnosis decision information system framework (CADDIS). The model was used to identify the likely proximal stressors and potential (biologically plausible) cause-effect pathways, how they are interlinked, and their relationship with interacting factors such as natural turbidity events and seasonal cycles. Potential damage associated with dredging and turbidity-generating activities were then separated into direct and indirect effects. The direct effects included the removal of hard and soft substrate i.e. the dredging footprint, and smothering of the seabed at the dredge material placement sites (spoil disposal grounds). The indirect effects were associated with mobilization of sediments into the water column (i.e. turbidity or plume-generation), and formed a second and larger group of cause-effect pathways. The indirect effects were subsequently divided into (1) chemical effects (such as the release of FeS-rich sediments and nutrients and legacy contaminants) and (2) physical effects. The review is primarily concerned with the physical effects.
direct effects (dredge footprint)
indirect effects (plume migration) → (a) chemical effects (release of nutrients, legacy contaminants etc) (b) physical effects (light attenuation, sedimentation etc
The model showed that the key proximal stressors affecting corals are: (1) light attenuation affecting photosynthesis (autotrophy), (2) high suspended sediment concentrations (SSCs) affecting feeding processes (heterotrophy) and, (3) sediment deposition resulting in smothering of corals and restricting solute exchange and light. The mechanism(s) whereby each of these proximal stressors affects corals are discussed. From the model it is clear that the proximal stressors are highly interlinked, and that they could act alone or in combination, and that the most relevant parameter(s) may change according to dredging activities, metocean conditions, distance from the dredge etc.
Surprisingly, water quality conditions during large-scale dredging programs have not been very well described (in the public literature) for the key proximal stressors. To that purpose, an analysis was also conducted of water quality information collected during several major dredging programs3,4,5 in tropical Western Australia in recent years. In the near-field environment (~100s metres from an operating dredge) sediments released into the water column and moving out of the immediate dredging area were primarily silt-sized (4–62 µm). These measurements are consistent with analyses of the composition of the seabed after the dredging programs described in the review, which show a build-up of predominantly silt-sized particles. Water quality was profoundly affected by dredging, as anticipated; however, a significant and characteristic feature was that even close to dredging activities turbidity events are often very ephemeral. Order of magnitude changes in water 1 EPA (2016) Technical Guidance: Environmental Impact Assessment of Marine Dredging Proposals. Environmental Protection Authority,
Perth, Western Australia. 2 Jones R, Bessell-Browne P, Fisher R, Klonowski W, Slivkoff M (2016) Assessing the impacts of sediments from dredging on corals. Marine
Pollution Bulletin http://dx.doi.org/10.1016/j.marpolbul.2015.10.049 3 Pluto LNG Development, Burrup Peninsula: WA Environmental Protection Authority Bulletin 1259, Ministerial Statement No. 7573 4 Cape Lambert B project: WA Environmental Protection Authority Bulletin 1357, Ministerial Statement No. 840 5 Gorgon Gas Development Barrow Island Nature Reserve: WA Environmental Protection Authority Bulletin 1221 Ministerial Statement No.
800

Assessing the impacts of sediments from dredging on corals
Dredging Science Node | Theme 4 | Project 4.1
ii
quality can occur in the space of hours and days, but are often interspersed with periods of otherwise quite good water quality. This has implications for designing and interpreting information collected from water quality monitoring programs and the setting of thresholds (see below). SSCs over very short term periods (hours) could reach levels of hundreds of mg L-1 but over days to weeks the worst case scenarios averaged 10s of mg L-1 and over a period of a month averaged <10 mg L-1.
Scattering and light attenuation by suspended sediments occurred rapidly in the water column, with the shallow reef environment routinely experiencing semi-dark, caliginous or diurnal ‘twilight’ periods. Complete loss of light at moderately elevated SSCs occurred quite regularly, especially at deeper sites. Hyper-spectral analyses of light quality underneath a plume, which are some of the first measurements of their kind for dredging in reefal environments, showed different wavelengths of light are preferentially attenuated. There was a more immediate loss of useful blue light and a shift of the underwater spectrum to less photosynthetically useable yellow-green light. This is significant because photosynthetically active radiation (PAR) which is frequently monitored during dredging projects, may be present but not in a very useable form for primary production.
All available laboratory and field based studies of the effects of suspended sediments and sediment deposition on corals were then compiled and reviewed. The experimental conditions used in these tests were also closely scrutinized. This body of literature, which has been generated over the last 30 years, has been reviewed many times, and has shaped our present day understanding of the effects of sediments on corals. The experimental/laboratory conditions in these studies have been highly varied in terms of sediments used, particle size distributions, lighting conditions, test durations, exposure regimes and sediment loading rates. The experimental conditions used were also found to differ quite significantly from the in situ conditions described previously. Several studies had used proxies for sediment including carborundum. Many studies, especially those associated with sediment deposition, have also used sands (62–2000 µm) as opposed to the fine silts and clays which typify a dredge plume. Experiments exposing corals to elevated suspended sediments have also typically been conducted in small aquaria, and not all studies compensated for the fact that there would only be a small amount of light attenuation in the few centimetres of water above the corals in a shallow tank. For example the light attenuation associated with a high 30 mg L-1 SSC may be ~10% in a shallow aquarium, whereas in situ, on the reef and at 5 m, an equivalent SSC would attenuate >99% of all PAR. Re-interpreting some of these studies within this review, it is suggested that elevated SSCs per se (as opposed to the associated light reduction and sediment deposition) is perhaps not as significant a stressor as previously considered. None of the studies had compensated for spectral changes in light discussed previously, and overall results from these studies are therefore difficult to evaluate.
One of the most significant issues identified by the review was the problem of understanding the effects of high sedimentation caused by dredging on corals. During natural high turbidity events produced by high wind/wave, wave orbital velocities are usually sufficient to keep some of the sediments in suspension. Sediment deposition subsequently occurs (after a settling lag) during quiescent periods and after further entrainment and dilution occurs. In contrast, dredging can result in high SSCs in a low energy water column, where sediments cannot be supported by ambient hydrodynamics. Under such conditions the sediment rapidly falls out of suspension and probably exceeds levels that corals are ever likely to have experienced naturally (unless under extreme circumstances). Once the inherent self-cleaning capacity of a coral has been exceeded, sediments will begin to accumulate on its surface, progressively smothering it in a thick sediment deposit. The ultimate fate of the underlying coral tissue is then localised mortality and lesion formation unless sediments can be resuspended by strong water flow such as during a storm. Understanding the relationship between sedimentation rates and coral health is very important for determining the severity of impact around dredging operations. The problem is that there have been few ecologically-relevant and reliable measurements made of sedimentation over appropriate scales (i.e. mg cm-2 d-1) because of a lack of suitable instrumentation.
In terms of impact prediction, the review concludes that the proximal stressors associated with dredging (elevated SSCs, light reduction and sedimentation) are very interlinked, that they could act alone or in combination, and that the most relevant parameter(s) may change according to dredging activities, metocean conditions, distance from the dredge etc. This ‘protean’ nature of suspended sediments i.e. the ability of the stressor parameters to change shape and form, makes it particularly challenging to (a) identify which is the most

Assessing the impacts of sediments from dredging on corals
Dredging Science Node | Theme 4 | Project 4.1
iii
relevant or important parameter(s) at any given time (the cause-effect pathway(s)), and (b) establish dose-response relationships. This potentially confounds and confuses laboratory and field experiments and observations and their interpretation. The problem is further compounded by the lack of suitable instrumentation for estimating sediment deposition and consequently a lack of pressure field characterization for one of the key-cause effect pathways.
Considerations for predicting and managing the impact of dredging
Pre-development Surveys
The review contained an initial exploration of the temporal and spatial patterns in water quality (SSCs and light attenuation) and an analysis of water column and seabed sediment particle size distributions that can occur during large-scale dredging campaigns. The information proved invaluable for characterizing the pressure field and for contextualizing the results of past, predominantly laboratory studies. The significance of this data as a reference point for contextualizing any effects on water quality in future dredging projects is discussed in several other reports, see 6,7,8. Dredging proponents should be encouraged to make available for future analysis all data (and metadata) from water quality investigations (i.e. turbidity, surface and benthic PAR, temperature, sediment particle size distributions in the water column and seabed, and associated ecological information) collected during baseline periods and during and after dredging.
The increased silt content of the seabed from sediments spilled during the dredging process described in the review may have longer term implications for the environment, as the sediments are more easily re-suspended by storms and wind or wave events (see also7). Chronic low level turbidity may influence coral recruitment and may result in population and community level effects as opposed to effects on adult colonies. Efforts should be made to establish how long after dredging projects the seabed particle size distributions are skewed towards finer particles, and whether this is having a measureable effect on water quality, and over what time periods. Studies are needed to understand the longer term legacy effects of dredging i.e. how long after dredging projects the seabed particle size distributions are skewed towards finer particles, whether this is having a measureable effect on water quality, and over what time periods. This necessitates establishing pre-development information on seabed particle size distribution and temporal/spatial variability in water quality.
Impact prediction
The initial exploration of the temporal and spatial patterns in water quality during dredging showed that it is highly ephemeral and to fully capture this, thresholds for impact prediction should be developed at multiple time frames, including both short term, acute periods from hours to days to longer chronic thresholds from weeks to months. A generally accepted model for how corals tolerate turbidity is that they survive short term periods of high SSCs by shifting between phototrophic and heterotrophic dependence, by relying on energy reserves, and by rapidly replenishing reserves in periods between turbidity events. The ephemeral nature of plumes and the potential for corals to recover from individual turbidity events, means dredging programs can be managed by considering cumulative pressure. Implicit in this concept is that natural turbidity events (or periods of low light), are an integral component of the total pressure. That is, corals or other epi-benthic organisms cannot differentiate between natural turbidity events and dredging-related events, and they should not be distinguished between during water quality monitoring programs associated with dredging campaigns. Thresholds for impact prediction therefore should be developed over multiple time frames which include 6 Fisher R, Stark C, Ridd P, Jones R (2015) Spatial patterns in water quality changes during dredging in tropical environments. PLoS ONE
10:e0143309. 7 Jones R, Fisher R, Stark C, Ridd P (2015) Temporal patterns in water quality from dredging in tropical environments. PLoS ONE 10(10):
e0137112. doi:10.1371/journal.pone.0137112 8 Abdul Wahab MA, Fromont J, Gomez O, Fisher R, Jones R (2017) Effects of dredging on benthic filter feeder communities, field study.
Report of Theme 6 - Project 6.3, prepared for the Dredging Science Node, Western Australian Marine Science Institution, Perth, Western Australia.

Assessing the impacts of sediments from dredging on corals
Dredging Science Node | Theme 4 | Project 4.1
iv
natural turbidity events.
Many environmental impact assessments for large scale dredging projects contain meta-analyses and tabulations of results from many published laboratory-based studies on the effects of sediments on corals for (or to support) impact prediction. This is a logical step, but caution needs to be exercised in using the information (for that purpose), as not all studies may be suitable. This relates to problems with the types and particle sizes of sediments used, and the use of sediment proxies, as well as problems associated with extrapolating results from laboratory based experiments which have not adequately compensated for light reduction.
The change in spectral quality of light by dredging plumes identified during the review also has implications for determining minimum light requirements for corals from laboratory-based studies. Lab-based studies typically reduce light levels by using neutral density filters, or by adjusting the intensity or distance of lights above the corals. This will reduce the light quantity but the spectrum will not be notably changed. This could lead to an underestimation of the light required in situ. In the field, the symbiotic algae in corals may be able to adjust their photosynthetic and accessory pigments to harvest light from the less optimal wavelengths, but given the highly ephemeral nature of plumes, they may not be able to undergo such photoacclimatory changes over periods of hours or days. The implications of this are that laboratory based studies could underestimate the amount of light required by phototrophs in situ. The potential significance of this should be examined further under controlled laboratory based conditions.
For impact prediction purposes a much more significant problem than the relevance of experimental conditions from past experiments is a broader issue associated with the existence of the many different and often intertwined cause-effect pathways. Whilst the laboratory based experiments are useful for understanding physiological responses for specific cause-effect pathways, the information may not be directly suitable for impact prediction purposes unless the consequences of the exposure scenarios are known for all other possible pathways. For example, laboratory-based studies where corals have survived exposures to suspended sediment concentrations in the high tens of mg L-1 for several days may not be useful for impact prediction purposes in situ if it occurs during calm sea conditions which would result in very high deposition rates (and subsequent sediment smothering). This could lead to much more rapid mortality of corals — and before any effects of the elevated SSCs and light reduction in the water column could occur. This indicates the need for multiple thresholds for different cause-effect pathways and the use of realistic worst case scenarios to avoid failing to predict an effect when one might occur. The immediate problem, and as emphasized in the review, is that until suitable ways can be developed to measure ecologically-relevant sediment deposition rates in situ at appropriate scales (i.e. mg cm2 day-1), and relationships to coral health determined, there will always be a great deal of uncertainty associated with impact prediction for dredging near coral reefs. How to deal with this uncertainty is discussed in a subsequent section regarding the water quality threshold development based on the laboratory and field studies.
One approach to circumventing these problems (the existence of multiple cause-effect pathways9 and the lack of instrumentation to measure pressure associated with one of them) is to concentrate on the first step in the chain of the interlinked cause-effect pathways, which was identified by the CADDIS model as elevated turbidity. The underlying logic is that elevated turbidity must be indicative of elevated SSCs and light attenuation (by definition), and there may be elevated sediment deposition depending on the sea conditions. In theory a range of turbidity values can be determined, over different time scales, which have, or have not, resulted in environmental effects in past dredging campaigns. The information might have use for impact prediction purposes. The advantages of this approach is that impact prediction is based on a single parameter, that turbidity can be measured relatively easily by in situ instrumentation, and that there is information from combined water quality and coral health monitoring programs during baseline periods and dredging phases for several programs to examine the relationship. The disadvantage of the approach is that turbidity is simply being used as a proxy 9 (1) Light attenuation and a reduction in coral phototrophy, (2) high suspended sediment concentrations and a reduction in coral
heterotrophy, (3) high sedimentation rates and an increase in sediment mothering.

Assessing the impacts of sediments from dredging on corals
Dredging Science Node | Theme 4 | Project 4.1
v
for the 3 different cause-effect pathways8, the relationship between turbidity and sedimentation is poorly understood, and any effects observed will be correlative.
Residual knowledge gaps
The review identified several knowledge gaps needed to be addressed to enhance capacity within government and the private sector to predict and manage the environmental impacts of dredging. Since the purpose of the review was to inform the research program in Theme 4, most of the knowledge gaps are being addressed in the individual projects. Thus Project 4.2.3 is focused on understanding the relationship between turbidity and sedimentation and identification of conditions where high turbidity may or may not result in high sediment deposition. Project 4.2.4 concentrates on the development of new instrumentation for measuring sedimentation in situ, and Project 4.4 strives to the cause-effect pathways either alone or in combination, and establishing dose response relationships for sedimentation and coral clearances rates to identify when smothering may occur.


Marine Pollution Bulletin 102 (2016) 9–29
Contents lists available at ScienceDirect
Marine Pollution Bulletin
j ourna l homepage: www.e lsev ie r .com/ locate /marpo lbu l
Review
Assessing the impacts of sediments from dredging on corals
Ross Jones a,e,⁎, Pia Bessell-Browne a,b,e, Rebecca Fisher a,e, Wojciech Klonowski c,d, Matthew Slivkoff c,d
a Australian Institute of Marine Science (AIMS), Perth, Australiab Centre of Microscopy, Charaterisation and Analysis, The University of Western Australia, Perth, Australiac Curtin University, Bentley, Perth, Australiad In situ Marine Optics, Bibra Lake, Perth, Australiae Western Australian Marine Science Institution, Perth, Australia
⁎ Corresponding author at: Australian Institute of MariE-mail address: [email protected] (R. Jones).
http://dx.doi.org/10.1016/j.marpolbul.2015.10.0490025-326X/Crown Copyright © 2015 Published by Elsevie
a b s t r a c t
a r t i c l e i n f oArticle history:Received 16 September 2015Received in revised form 19 October 2015Accepted 22 October 2015Available online 1 December 2015
Keywords:CoralsDredgingTurbidityLightThresholdsWater quality
There is a need to developwater quality thresholds for dredgingnear coral reefs that can relate physical pressuresto biological responses and define exposure conditions abovewhich effects could occur.Water quality character-istics during dredging have, however, not been well described. Using information from several major dredgingprojects, we describe sediment particle sizes in the water column/seabed, suspended sediment concentrationsat different temporal scales during natural and dredging-related turbidity events, and changes in light quanti-ty/quality underneath plumes. These conditions differ considerably from those used in past laboratory studiesof the effects of sediments on corals. The review also discusses other problems associatedwith using informationfrom past studies for developing thresholds such as the existence of multiple different and inter-connectedcause-effect pathways (which can confuse/confound interpretations), the use of sediment proxies, and the reli-ance on information from sediment traps to justify exposure regimes in sedimentation experiments.Crown Copyright © 2015 Published by Elsevier Ltd. This is an open access article under the CC BY-NC-ND license
(http://creativecommons.org/licenses/by-nc-nd/4.0/).
Contents
1. Introduction . . . . . . . . . . . . . . . . . . . . . . . . . . . . . . . . . . . . . . . . . . . . . . . . . . . . . . . . . . . . . . . 102. Natural and dredging-related turbidity events . . . . . . . . . . . . . . . . . . . . . . . . . . . . . . . . . . . . . . . . . . . . . . . . 103. Conceptual model of the effects of sediments on corals . . . . . . . . . . . . . . . . . . . . . . . . . . . . . . . . . . . . . . . . . . . . 114. Cause-effect pathways . . . . . . . . . . . . . . . . . . . . . . . . . . . . . . . . . . . . . . . . . . . . . . . . . . . . . . . . . . 12
4.1. Suspended-sediment . . . . . . . . . . . . . . . . . . . . . . . . . . . . . . . . . . . . . . . . . . . . . . . . . . . . . . . . 124.2. Light availability . . . . . . . . . . . . . . . . . . . . . . . . . . . . . . . . . . . . . . . . . . . . . . . . . . . . . . . . . . 134.3. Sediment covering . . . . . . . . . . . . . . . . . . . . . . . . . . . . . . . . . . . . . . . . . . . . . . . . . . . . . . . . . 144.4. Combined effects of proximal stressors . . . . . . . . . . . . . . . . . . . . . . . . . . . . . . . . . . . . . . . . . . . . . . . . 14
5. Water quality characteristics of dredging plumes . . . . . . . . . . . . . . . . . . . . . . . . . . . . . . . . . . . . . . . . . . . . . . 155.1. Particle size distributions (PSDs) associated with dredging . . . . . . . . . . . . . . . . . . . . . . . . . . . . . . . . . . . . . . . 165.2. Suspended-sediment concentrations (SSCs) . . . . . . . . . . . . . . . . . . . . . . . . . . . . . . . . . . . . . . . . . . . . . 175.3. Light attenuation and light quality . . . . . . . . . . . . . . . . . . . . . . . . . . . . . . . . . . . . . . . . . . . . . . . . . . 19
6. Experimental studies of the effect of sediments on corals . . . . . . . . . . . . . . . . . . . . . . . . . . . . . . . . . . . . . . . . . . . 196.1. Suspended-sediments . . . . . . . . . . . . . . . . . . . . . . . . . . . . . . . . . . . . . . . . . . . . . . . . . . . . . . . 196.2. Sediment deposition . . . . . . . . . . . . . . . . . . . . . . . . . . . . . . . . . . . . . . . . . . . . . . . . . . . . . . . . 20
7. Discussion . . . . . . . . . . . . . . . . . . . . . . . . . . . . . . . . . . . . . . . . . . . . . . . . . . . . . . . . . . . . . . . . 207.1. Experimental studies of the effects of suspended-sediment and light attenuation on corals . . . . . . . . . . . . . . . . . . . . . . . . 247.2. Experimental studies of the effects of sediment deposition on corals . . . . . . . . . . . . . . . . . . . . . . . . . . . . . . . . . . 247.3. Seawater quality thresholds for coral reefs and future directions . . . . . . . . . . . . . . . . . . . . . . . . . . . . . . . . . . . . 26
Author contributions . . . . . . . . . . . . . . . . . . . . . . . . . . . . . . . . . . . . . . . . . . . . . . . . . . . . . . . . . . . . . . 26Competing interests . . . . . . . . . . . . . . . . . . . . . . . . . . . . . . . . . . . . . . . . . . . . . . . . . . . . . . . . . . . . . . 26Acknowledgements . . . . . . . . . . . . . . . . . . . . . . . . . . . . . . . . . . . . . . . . . . . . . . . . . . . . . . . . . . . . . . 26References . . . . . . . . . . . . . . . . . . . . . . . . . . . . . . . . . . . . . . . . . . . . . . . . . . . . . . . . . . . . . . . . . . 26
ne Science (AIMS), Perth, Australia.
r Ltd. This is an open access article under the CC BY-NC-ND license (http://creativecommons.org/licenses/by-nc-nd/4.0/).
10 R. Jones et al. / Marine Pollution Bulletin 102 (2016) 9–29
1. Introduction
Dredging and dredging related activities such as dredge materialplacement (spoil disposal) releases sediment into the water columnwhere it can have a significant effect on nearby benthic communities(Bak, 1978; Brown et al., 1990; Dodge and Vaisnys, 1977; Erftemeijeret al., 2012; Foster et al., 2010; Rogers, 1990). Consequently, mostlarge-scale dredging projects require environmental impact assess-ments (EIAs) and active management when underway (EPA, 2011).The environmental and management issues associated with dredgingand construction around ports and harbours have recently beenreviewed and guidelines produced for monitoring, management, andmitigation (Foster et al., 2010).
There is a critical need to improve the ability to make scientificallysound predictions of the likely extent, severity, and persistence of envi-ronmental impacts associated with dredging especially when conduct-ed close to sensitive habitats such as coral reefs. One of the morepractical ways is by water quality monitoring, i.e. measuring the keyhazards which are capable of having adverse biological effects. Waterqualitymonitoring can be vessel-based or by fixed or rapidly relocatablemobile ‘sentinel’ in situ platforms, or even autonomously by vehicles re-motely controlled from land (Van Lancker and Baeye, 2015). The use ofthese technologies allows dredging proponents to be quickly alerted toconditions where environmental damage may occur and modify thedredging activities as required. However, to be useful in this way, thewater quality data have to be coupled to thresholds that relate the phys-ical pressure(s) to a biological response(s) and define exposure condi-tions above which effects could occur.
Similar threshold values for chemical contaminants are usually de-rived from field data and more frequently from controlled, laboratory-based studies (i.e. exposure studies) where test organisms are incubat-ed with toxicant(s)/hazards over short-term (acute) and longer term(chronic) time periods (Chapman, 2002). Many such studies havebeen conducted on the effects of sediments on corals in the context ofunderstanding the effects of terrestrial run-off and dredging, and thestudies have been collated and reviewed many times(i.e., Erftemeijeret al., 2012; Fabricius, 2005; Foster et al., 2010; Jones et al., 2015b;Rogers, 1990). These studies have contributed to our collective under-standing and concern of the environmental effect of sediments oncoral reefs. Logically, information from these studies should be suitablefor threshold development. However, the results are dependent on theexposure scenarios and experimental conditions used, and it is notice-able that although a great deal of data have been collected (see,Falkenberg and Styan, 2014), there is little information in the public lit-erature about the conditions that can occur in situ during dredgingaround coral reefs (Jones et al., 2015a). Recently, Harris et al. (2014)highlighted the fundamental significance in ecotoxicology of the useor environmentally relevant or realistic conditions, the need for com-prehensive justification of any exposure conditions, and the dangers as-sociated with an incomplete understanding.
We first identify, through a conceptual model, the likely exposurepathway(s) associatedwith the effects of dredging, includinghowprox-imal stressors are interlinked and interact with natural stressors. Datafrom several recentmajor dredging programmes in reefal areas of trop-ical Australia are then examined to describe how thewater quality con-ditions change over time to provide a first order approximation of theenvironmentally relevant or realistic exposure scenarios. The existingliterature of the effects of sediments on corals is then examined withspecific attention to the experimental conditions used in order to assessthe suitability of past studies for deriving information for impact predic-tion purposes (i.e. for modelling and monitoring). One of the objectivesof the review is also to facilitate a technical understanding of sedimentsand sediment resuspension, water quality issues associatedwith dredg-ing programmes, and some of the terminologies used and processes in-volved. The analysis concludes with some recommendations andguidance for future study.
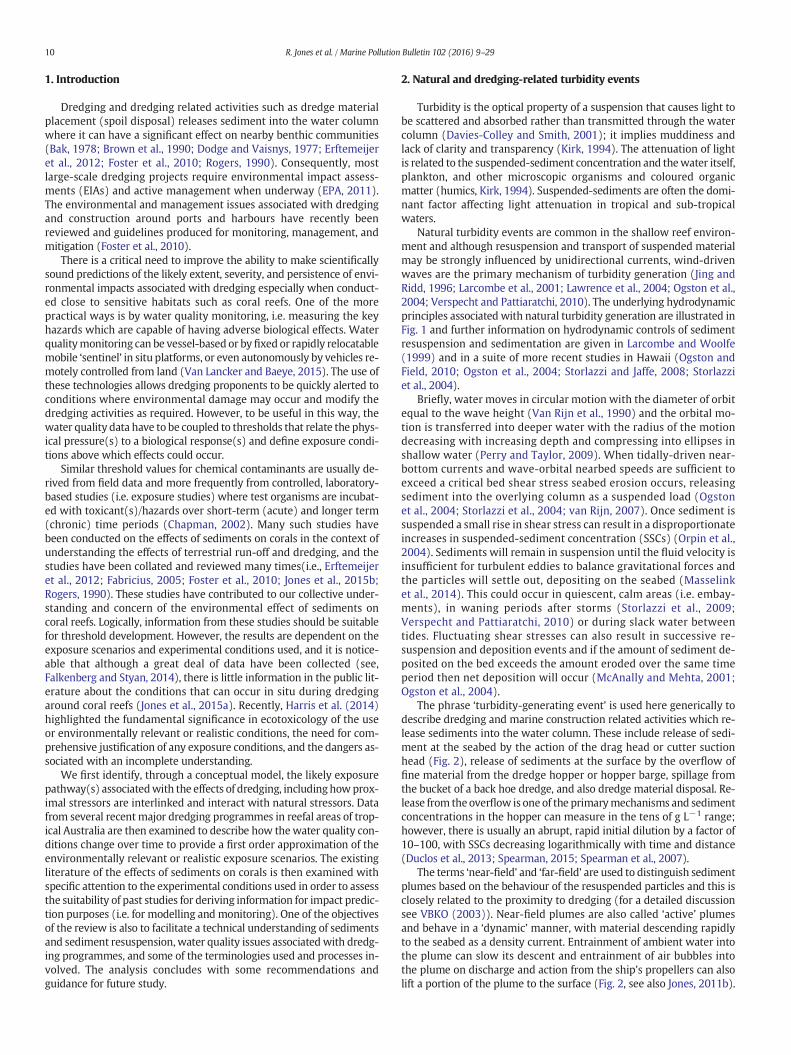
2. Natural and dredging-related turbidity events
Turbidity is the optical property of a suspension that causes light tobe scattered and absorbed rather than transmitted through the watercolumn (Davies-Colley and Smith, 2001); it implies muddiness andlack of clarity and transparency (Kirk, 1994). The attenuation of lightis related to the suspended-sediment concentration and thewater itself,plankton, and other microscopic organisms and coloured organicmatter (humics, Kirk, 1994). Suspended-sediments are often the domi-nant factor affecting light attenuation in tropical and sub-tropicalwaters.
Natural turbidity events are common in the shallow reef environ-ment and although resuspension and transport of suspended materialmay be strongly influenced by unidirectional currents, wind-drivenwaves are the primary mechanism of turbidity generation (Jing andRidd, 1996; Larcombe et al., 2001; Lawrence et al., 2004; Ogston et al.,2004; Verspecht and Pattiaratchi, 2010). The underlying hydrodynamicprinciples associated with natural turbidity generation are illustrated inFig. 1 and further information on hydrodynamic controls of sedimentresuspension and sedimentation are given in Larcombe and Woolfe(1999) and in a suite of more recent studies in Hawaii (Ogston andField, 2010; Ogston et al., 2004; Storlazzi and Jaffe, 2008; Storlazziet al., 2004).
Briefly, water moves in circular motion with the diameter of orbitequal to the wave height (Van Rijn et al., 1990) and the orbital mo-tion is transferred into deeper water with the radius of the motiondecreasing with increasing depth and compressing into ellipses inshallow water (Perry and Taylor, 2009). When tidally-driven near-bottom currents and wave-orbital nearbed speeds are sufficient toexceed a critical bed shear stress seabed erosion occurs, releasingsediment into the overlying column as a suspended load (Ogstonet al., 2004; Storlazzi et al., 2004; van Rijn, 2007). Once sediment issuspended a small rise in shear stress can result in a disproportionateincreases in suspended-sediment concentration (SSCs) (Orpin et al.,2004). Sediments will remain in suspension until the fluid velocity isinsufficient for turbulent eddies to balance gravitational forces andthe particles will settle out, depositing on the seabed (Masselinket al., 2014). This could occur in quiescent, calm areas (i.e. embay-ments), in waning periods after storms (Storlazzi et al., 2009;Verspecht and Pattiaratchi, 2010) or during slack water betweentides. Fluctuating shear stresses can also result in successive re-suspension and deposition events and if the amount of sediment de-posited on the bed exceeds the amount eroded over the same timeperiod then net deposition will occur (McAnally and Mehta, 2001;Ogston et al., 2004).
The phrase ‘turbidity-generating event’ is used here generically todescribe dredging and marine construction related activities which re-lease sediments into the water column. These include release of sedi-ment at the seabed by the action of the drag head or cutter suctionhead (Fig. 2), release of sediments at the surface by the overflow offine material from the dredge hopper or hopper barge, spillage fromthe bucket of a back hoe dredge, and also dredge material disposal. Re-lease from theoverflow is one of the primarymechanisms and sedimentconcentrations in the hopper can measure in the tens of g L−1 range;however, there is usually an abrupt, rapid initial dilution by a factor of10–100, with SSCs decreasing logarithmically with time and distance(Duclos et al., 2013; Spearman, 2015; Spearman et al., 2007).
The terms ‘near-field’ and ‘far-field’ are used to distinguish sedimentplumes based on the behaviour of the resuspended particles and this isclosely related to the proximity to dredging (for a detailed discussionsee VBKO (2003)). Near-field plumes are also called ‘active’ plumesand behave in a ‘dynamic’ manner, with material descending rapidlyto the seabed as a density current. Entrainment of ambient water intothe plume can slow its descent and entrainment of air bubbles intothe plume on discharge and action from the ship's propellers can alsolift a portion of the plume to the surface (Fig. 2, see also Jones, 2011b).

Fig. 1. Stylized representation of current and wave-induced turbidity generation in the shallow, reef environment (see text for explanation).
11R. Jones et al. / Marine Pollution Bulletin 102 (2016) 9–29
Settling of coarser rather than finer particles occurs as sediment isadvected away from the dredging site and sandswill drop quicklywith-in the first 10–20 min (Duclos et al., 2013). The far-field or passiveplume is made up of much lower SSCs and the fine fraction of materialmixed into the water column can stretch for many kilometres and per-sist for several hours, as determined by site-specific hydrodynamics andlocal conditions (Fig. 3B).
3. Conceptual model of the effects of sediments on corals
A conceptual model of the effects of turbidity-generating eventson corals based on the US Environmental Protection Agency(USEPA) causal/diagnosis decision information system framework(CADDIS)(Norton et al., 2009; USEPA, 2004) is shown in Fig. 4. Inthe model, all known cause–effect linkages, biologically plausiblecause–effect pathways, and potentially confounding variables andinteracting factors are displayed in a single framework. Sources ofsediments include carbonate and igneous and siliciclastic intertidaland subtidal sediments released into the water column (Fig. 4).There are many activities associated with dredging and land recla-mation activities that can cause turbidity ranging frommajor sourcessuch as hopper overflow to more trivial sources such as rock-dumping (Koskela et al., 2002). Damage associated with dredgingand turbidity-generating activities can be separated into direct andindirect effects (Fig. 4), with direct effects including the removal ofhard and soft substrate (within the dredge footprint), and smother-ing of the seabed at disposal (placement) sites.
A second and much larger group of cause–effect pathways are asso-ciated with mobilization of sediments into the water column, i.e. ‘tur-bidity’ or ‘plume-generation’ and subsequent movement of sedimentout of the immediate dredging or dredge material placement site.
Fig. 2. Stylized representation of plume generation by a trailing suction hopper dredge, themosbidity is generated at the drag-head and at the surface if sediment-laden water inside the hothrough a vertical shaft inside the hopper, exiting below water level (Foster et al., 2010; VBKO
These ‘indirect’ effects can be further divided into (1) chemical and(2) physical effects. Chemical effects include the release of FeS-rich sed-iments which can rapidly deoxygenate water and change pH levels (i.e.a proximal stressor) (Morgan et al., 2012). Desorption of legacy contam-inants and release of nutrients and pore-water dilution can also changethe chemical environment of the water column (Eggleton and Thomas,2004; Su et al., 2002). Nutrient release has the potential to change oxy-gen concentrations, mediated through phytoplankton and microbialblooms (i.e. a step in the causal pathway, Fig. 4). Changes in oxygenand nutrient levels and especially contaminant concentrations havethe potential for acute and chronic toxicological, cellular and physiolog-ical effects, including genotoxic (mutagenic, teratogenic and carcino-genic) effects, as well as bioaccumulative effects through uptake andingestion of contaminants (see for example Hedge et al. (2009)). Priorto dredging, sediments are normally examined for contaminant concen-trations and, in Australia at least, landfilled if levels exceed screeningguidelines (DEWHA, 2009). Many capital dredging projects in the tro-pics also occur in green-field sites without historical pollution, and sed-iment contamination is typically less of a concern than industrializedareas (with a few notable exceptions, see Jones, 2011a). Whilst notdiscounting the potential significance of chemical effects, especially inthe near-field environment, the rest of the review is concerned with in-direct effects of physical proximate stressors associated with turbiditygenerating events and include (1) elevated suspended-sediments,(2) changes in light quality and quantity, and (3) sediment covering(Fig. 4).
For all proximate stressors the key interacting factors are periods ofnaturally elevated turbidity associated with (1) currents, wind-drivenwaves and elevated sea states associated with trade winds and storms(Jing and Ridd, 1996; Larcombe et al., 2001; Lawrence et al., 2004;Ogston et al., 2004; Orpin and Ridd, 2012; Verspecht and Pattiaratchi,
t commonly used of the hydraulic dredges for soft sediments (see Foster et al., 2010). Tur-pper is allowed to discharge (overflow). This can occur from the ship's sides but usually, 2003).

Fig. 3. (A)Working trailing suction hopper dredge in the Pilbara region ofWestern Australia generating buoyant surface plumes through propeller wash. (B, C) Atmospherically corrected,colour corrected, pan sharpened satellite image from theUnited StatesGeological Survey (USGS) Operational Land Imager (OLI) instrument on (B) 10 July 2014, showing sediment plumescausedby dredging and dredgematerial placement nearOnslow in the Pilbara region ofWestern Australia (whereDMPS=offshoredredgematerial placement site) and (C) 25 September2013, showing natural turbidity caused by a highwind event. (D) Buoyant turbidity plume overlying a branchingAcropora spp. colony. (E) A branchingAcropora spp. colony photographedduring the daytime, and temporarily in darkness causedby the elevated turbidity levels. (F) Smothering of a platingMontipora spp. by sediment. ImagesD and Fwere takenduring a dredg-ing project at Magnetic Island (Central Great Barrier Reef) and image E during the Barrow Island project. Satellite images courtesy of Mark Broomhall and Peter Fearns (Department ofImaging and Applied Physics Curtin University of Technology).
12 R. Jones et al. / Marine Pollution Bulletin 102 (2016) 9–29
2010) and (2) in the nearshore, coastal environment, the effects ofriver-borne discharges from monsoonal events and tropical depres-sions, and associated sediment-laden, hypopycnal flood waters (Orpinand Ridd, 2012; Storlazzi et al., 2009). Natural cycles of light availabilityare also an interacting factor and summarized in Anthony et al. (2004)),these include (1) the seasonal pattern of daily surface irradiance (inso-lation) governed by the solar declination cycle (Kirk, 1994), (2) tidal cy-cles which affect the depth of thewater, (3)meteorological phenomenaincluding patterns of cloud formation (Wright, 1997) and (4) large-scale pressure systems such as the Madden-Julian oscillation (MJO)(Madden and Julian, 1994).
4. Cause-effect pathways
4.1. Suspended-sediment
Corals are both autotrophs and heterotrophs andmany studies haveshown raptorial capabilities and the capture of up to meso/macro sizedzooplankton by nematocyst discharges and tentacle grabbing(Ferrier-Pages et al., 2003; Marshall and Orr, 1931; Sebens et al., 1998;Sebens et al., 1996; Vaughan, 1916). Zooplankton feeding contributessignificantly to fixed carbon incorporated into coral skeletons (recentlyreviewed by Houlbrèque and Ferrier-Pagès (2009)).
From the early suggestions of Goreau et al. (1971) and Muscatineand Porter (1977), corals have been shown to gain some energy hetero-trophically by tentacular suspension feeding (Houlbrèque and Ferrier-
Pagès, 2009). General suspension feedingmechanisms include direct in-terception and electrostatic attraction (LaBarbera, 1984; Rubensteinand Koehl, 1977) and once captured there is a second stage involvingparticle retention and a third phase involving movement of capturedparticles to the mouth (Shimeta and Koehl, 1997). Tentacular suspen-sion feeding for particulate matter occurs through entrapment inmucus on the coral surface. Another capture process is via mucusthreads or filaments attached to the oral disk that are swept by waterturbulence entangling fine particulate material as well as larger zoo-plankton (Lewis and Price, 1975, 1976; Lewis, 1976). Ingestion is com-pleted by movement by cilia of particles trapped in the mucus to themouth (Lewis and Price, 1975; Vaughan, 1916).
Recent studies have shown that the coral cilia can generate verticalflows extending up to 2 mm from the surface which can substantiallyenhance the transport of solutes to and from the coral surface(Shapiro et al., 2014) suggesting corals may be complementing passiveentrapment by active mechanisms. Marshall and Orr (1931) observedthat ciliary movement of deposited sediment is a short term responsewhich cannot be maintained for long periods, implying a metaboliccost. However, the energy invested in powering the ciliary movementis reported to be a negligible fraction of the coral's metabolic budget(Shapiro, 2014), but how this changes in response to increased drag as-sociated with high SSCs has yet to be determined.
Ingestion of sediments has been observed in many studies (Lewisand Price, 1975; Lewis, 1976; Logan, 1988; Marshall and Orr, 1931;Stafford-Smith and Ormond, 1992; Stafford-Smith, 1993) and appears

Fig. 4. A conceptual model of the effects of turbidity-generating events on corals based on the US Environmental Protection Agency (USEPA) causal/diagnosis decision information systemframework (CADDIS), identifying the sources of sediment, dredging-related turbidity-generating activities, all known cause–effect pathways, biologically plausible cause–effect pathways,modes of action, interacting factors, and likely physiological and ecological responses (see text for explanation).
13R. Jones et al. / Marine Pollution Bulletin 102 (2016) 9–29
to be part of a normal feeding mechanism. Suspended particulatematter constitutes a potentially diverse food source containing bacteria,microalgae, protozoa, detrital organic matter (Marshall, 1965), intersti-tial invertebrates, detached, undissolved mucus (Wild et al., 2004), mi-crobial exudates, and excretory products from other animals (e.g. fromfish, Meyer and Schultz, 1985; Lopez & Levinton 1987; Houlbrèque andFerrier-Pagès, 2009).Many studies have now shown that after sedimentingestion corals are capable of assimilating and obtaining nutritionalbenefits from the associated organic matter (Anthony, 1999, 2000;Anthony and Fabricius, 2000; Mills and Sebens, 1997; Mills et al.,2004; Rosenfeld et al., 1999).
Mills and Sebens (1997) suggested that high loads of clean sedi-ments may cause most of the polyps to stop feeding and reject sedi-ments, reducing ingestion rates. Similarly, Anthony (2000) indicatedthat at concentrations N30 mg L−1 Acropora millepora and Pocilloporadamicornis from clear water offshore environments showed a tendencyto retract their polyps reducing potential for energy gains from feeding.It follows that depending on organic content, water flow and morphol-ogy, low SSCs may be beneficial for some corals in some circumstancesand detrimental at higher concentrations. This concept of a low dosestimulation and high dose inhibition has now been reported in numer-ous studies (Anthony, 1999, 2000; Logan et al., 1994; Mills and Sebens,1997; Mills et al., 2004; Mills and Sebens, 2004; Rosenfeld et al., 1999;Stafford-Smith and Ormond, 1992; Tomascik and Sander, 1985).Whilstlow suspended-sediment concentrations can have beneficial effects,
overall high SSCs is one of the key pressure parameters reducing feedingactivity and requiring energy to continually process and transportintercepted sediments (Fig. 4).
4.2. Light availability
Most reef-building corals form mutualistic symbioses with dinofla-gellates of the genus Symbiodinium (Freudenthal, 1962), a diverserange of microalgae divided into nine known clades with significantfunctional and genetic intercladal diversity (Stat et al., 2012). The algaeprovide ‘photosynthates’ or photosynthetically fixed carbon to the host,providing additional energy for respiration and growth (Dubinskyet al., 1984; Falkowski et al., 1984; Goreau, 1959; Lesser, 2004;Muscatine, 1990). The Symbiodinium spp. reside endosymbiotically inthe coral endodermal (gastrodermal) tissues within a membrane com-plex, the symbiosome (Roth et al., 1988; Wakefield and Kempf, 2001),at densities of typically one to two, but sometimes up to six per hostcell (Muscatine et al., 1998). Forming the symbiosis enhances depositionof the calcium carbonate skeleton in light-enhanced (DCMU-sensitive)calcification (Gattuso et al., 1999). The highly reflective skeleton also en-hances the lightfield experienced by a polyp through light scattering anddiffuse reflection, increasing the probability of absorption and increasingthe exposure to photosynthetically active radiation (PAR) by 3–20 fold(Enrıquez et al., 2005; Kuhl et al., 1995; Marcelino et al., 2013; Reefet al., 2009).

14 R. Jones et al. / Marine Pollution Bulletin 102 (2016) 9–29
Corals and their algal symbionts are superbly adapted to living inboth low light and high light environments, exhibiting behaviouralmorphological and physiological plasticity to maximise light utilizationandminimize damage (Roth, 2014). For the host (animal) these includechanges in polyp retraction (Levy et al., 2003) and micro- and macro-scale growth morphology (Barnes, 1973). For the algal symbionts thisincludes changes in optical cross sectional areas and light harvesting ca-pabilities through changes in photosynthetic and accessory pigmentconcentrations (Anthony and Hoegh-Guldberg, 2003; Falkowski andDubinsky, 1981; Falkowski et al., 1984; Mass et al., 2010).
The quantity and quality (spectral composition) of the submarinelight field is fundamentally important for the physiology and ecologyof the coral–algal symbiosis and light attenuation, mediated by absorp-tion and scattering of light by suspended particles (i.e. a step in the caus-al pathway), is one of the key proximal stressors in the short andespecially long-term. In very low or zero light conditions, corals canenter a state of hypoxia and then anoxia; the mode of action is throughreduced autotrophy and hypoxia (considered further below).
4.3. Sediment covering
The immediate response of corals to deposition of sediments ontheir surfaces is an attempt to self-clean by moving sediments toedges where they are dropped off the colony (Marshall and Orr,1931). The principal sediment rejection mechanisms identified for arange of coral species, representing different families and a range ofgrowth forms and corallite morphologies are: ciliary action, hydrostaticinflation, tentaclemovement, contractions, andmucus entrapment (Bakand Elgershuizen, 1976; Hubbard and Pocock, 1972; Logan, 1988;Marshall and Orr, 1931; Schuhmacher, 1977; Stafford-Smith andOrmond, 1992; Stafford-Smith, 1993; Vaughan, 1916; Yonge andNicholls, 1931). These are usually referred to as active processes (re-quiring energy) and most corals employ ciliary action and hydrostaticinflation (sometimes in conjunction with pulsed contractions andpolyp expansion), mucus entanglement, and tentacle movement to re-move sediments.
A number of other mechanisms have been proposed includingmovement of sediment by mesenterial filaments, capture of sedimentby nematocysts, and sediment ingestion. Commensal crabs becomemore active during high sediment deposition rates (Stafford-Smithand Ormond, 1992) and can create local turbulence, which dislodgesparticles. Turbulence from feeding fish can have similar effects (Loya,1976). It is unclearwhether someof these proposedmechanisms are as-sociatedwith feeding responses andwhether they represent physiolog-ically significant sediment-rejection mechanisms. Observations oftentacle movement and processing of individual sediment particlesmay be a consequence of the large, sand-sized particles used in someof these feeding experiments (Stafford-Smith and Ormond, 1992).Ingested sediments are subsequently regurgitated several hours lateras mucous-bound pseudo faeces (Logan, 1988), so sediment ingestionwill not clear sediment from the surface.
Corals also have gross and fine scale skeletal morphologies whichcan assist gravitational forces to remove sediments from their surfaces.These include surface inclination, branch spacing and diameter in arbo-rescent species and aspect ratio and the degree of sphericity in massivespecies. Finer scale morphology relates to calical size and shape(Hubbard and Pocock, 1972; Lasker, 1980; Logan, 1988; Marshall andOrr, 1931; Vaughan, 1916). Stafford-Smith (1993) also proposed anew parameter, surface smoothness, which is an index of surfacemicroarchitecture and the ability of corals to expand tissues (by the ac-tive process of hydrostatic inflation) above skeletal projections,resulting in a shape which better sheds sediments passively. Calix incli-nation is a key parameter Logan (1988).
Once the sediment clearance rates have been exceeded, sedimentswill inevitability build-up on a coral's surface and it becomes progres-sively buried in a sediment deposit (i.e. smothering, Fig. 3F). The
ultimate fate of the underlying tissues is partial mortality (lesion forma-tion), unless the layer is removed by a storm. One of the significant is-sues associated with smothering is tissue hypoxia, brought about byeither light attenuation caused by a sediment covering or a reductionin gas (solute) transfer across diffusive boundary layers (DBLs). Coralsare oxygen conformers, routinely experiencing pronounced diel chang-es in tissue oxygen concentrations ranging from super-saturation(hyperoxia) during the daytime associated with algal photosynthesis,to night-time oxygen shortage (hypoxia) or even anoxia by host andalgal respiration (Jones and Hoegh-Guldberg, 2001; Kuhl et al., 1995;Shashar et al., 1996). In darkness, or low flow conditions, oxygen con-centrations can fall to levels where aerobic respiration and ATP genera-tion is limited, a situation analogous to flooding of terrestrial plants(Bailey-Serres and Voesenek, 2008; Fukao and Bailey-Serres, 2004).Sea-anemones can survive hypoxic periods by engaging in fermentationprocesses involving glycolysis (Ellington, 1977; Ellington, 1980, 1982)which generates some ATP although at much lower yields (6× less)than aerobic respiration (Shick, 1991). Fermentation processes havebeen regularly implicated in corals as a means of tolerating short-termhypoxia (Weber et al., 2012; Wooldridge, 2013).
Themechanismunderlying sediment-smothering inducedmortalityand local necrosis has been described in detail byWeber et al. (2012). Arapid (b24 h) microbially-mediated anoxia and change in pH was re-corded inMontipora peltiformis smothered with a couple of millimetresof organically-rich sediments, leading to localised necrosis. Sedimentsmothering is therefore a key pressure parameter associated with tur-bidity generation, resulting in boundary-related effects and decreasedsolutes (such as oxygen) and metabolite exchange, mass transport lim-itations, and decreased filtering/feeding. Sediment smothering is relat-ed to sedimentation processes in the water column, which isdependent on wave movement turbulence and local hydrodynamics(i.e. an interacting factor).
4.4. Combined effects of proximal stressors
The key pressure parameters identified above and associatedwith the indirect effects of dredging activities on reef communities(represented by the inner triangle in Fig. 4) are: (1) high SSCs affect-ing feeding (heterotrophy reduction), (2) a reduction in light and as-sociated effects on the photosynthesis of the symbiotic microalgae ofcorals (phototrophy reduction), and (3) sediment smothering whichcauses a reduction in gas (solute) transfer across diffusive boundarylayers. These three cause–effect pathways are highly interconnected,with suspended-sediments causing biological effects directly, butalso acting as a causal step to changes in light quality and quantity(through attenuation and scattering in the water column). Similarly,high SSCs are a prerequisite for sediment deposition, mediated bythe process of sedimentation (a casual step) in the water column.Once the coral's surface is veneered or smothered by sediment, theeffect will be similar to light reduction in the water column and feed-ing processes will also be affected, and for this reason smothering bysediments has most biological effects associated with it (Fig. 4).
The relative influence of these three key pressure parameters can besymbolized in the ternary diagrams of Fig. 5 with epibenthic filterfeeders such a sponges most likely to be more affected by high SSCs(Bell et al., 2015) and sitting at the apex of the triangle (Fig. 5A).Seagrasses, which have comparatively high light requirements(Dennison et al., 1993), are likely to be located more towards thelower left hand side. Non-photosynthetic benthic filter feeders, suchas tropical barnacles (Fabricius andWolanski, 2000), are likely to be lo-cated on the right hand-side. Species with mixed modes of nutrition,such as symbiotic hard and soft corals, are likely to be equally influencedand are represented at the triangle's orthocentre (Fig. 5A).
During dredging, these representations are likely to move on anhourly, daily, and seasonal basis, depending and on the dredging activ-ities, diel and tidal cycles, and sea-state. Four different exposure

Fig. 5. Ternary diagrams representing the relative influence of 3 key proximal stressors associated with turbidity generation activities i.e. suspended sediment (SS), light availability (LA)and sediment covering (SC) on shallow tropical benthic organisms such as corals, sponges, seagrass and filter feeders such as barnacles. During dredging the relative influence of the prox-imal stressors could move on an hourly, daily, and seasonal basis, depending on the dredging activities, diel and tidal cycles, and sea-state. Four different exposure scenarios for symbioticcorals exposed to dredging plumes are symbolized: (B) A scenariowhereby a buoyant plume drifts over the reefwith little contact with the corals andwhere light availability only is likelyto be the key proximal stressor (see photograph Fig. 3D), (C) A turbidity event during relatively turbulentwater conditionswhere (wave+ current) shear stresses are sufficient to inhibitthe deposition ofmost sediment and so suspended-sediments and reduced light availability are the predominant influences (see photograph Fig. 3E). (D) A scenario where elevated SSCshas occurred during very calm conditions and where sediment has subsequently fallen out of suspension and smothered corals (see photograph Fig. 3F), (E) represents a night time sce-nario of high SSCs in turbulent conditions where suspended-sediment is the sole proximal stressor.
15R. Jones et al. / Marine Pollution Bulletin 102 (2016) 9–29
scenarios for symbiotic corals exposed to dredging plumes are repre-sented in Fig. 5B–E. In a scenario of a buoyant plume drifting over thereef with little contact with the corals, light availability is likely to bethe key stressor (Fig. 5B and photograph Fig. 3D). Under energeticwater conditions, where most sediment is in suspension, suspended-sediments and reduced light availability are the predominant influences(Fig. 5C and photograph Fig. 3E). Fig. 5D represents a scenario where el-evated SSCs occurred during calm conditions and where sediment hasfallen out of suspension and smothering has occurred (Fig. 3F). Fig. 5Erepresents a scenario of high SSCs in turbulent conditions at night
Fig. 6. Location map showing the Pilbara coast in Western Australia and the sites of 3 recent lasediment dredged over 530 days from 19May 2010 to 31 October 2011,Ministerial statement 8dredged over 911 days from 22 Nov 2007 to 21May 2010, Ministerial statement 757), and (C)Dec 2007 to 15 Sept 2012, Ministerial statement 840). These projects were associated with dreities, berth pockets, and liquefied natural gas (LNG) jetties and tug harbours and involved deepvessels. The dredging campaigns generally occurred on a 7 days × 24 h basis, stopping only ftrailing suction hopper dredges, cutter suction dredges and back hoe dredges, and bed levellerstatements (MS) for these projects are searchable on the WA EPA website (www.epa.wa.gov.a
time, where suspended-sediments are the predominant influencewhile light attenuation and reduced light availability has no influence.
5. Water quality characteristics of dredging plumes
There have recently been several major dredging programmes inAustralia where the state and federal regulatory conditions have re-quired detailed water quality monitoring programmes over extendedperiods using arrays of in situ instrumentation (Fig. 6, Falkenberg andStyan, 2014). These data have been made available for study and are
rge scale capital dredging projects, including: (A) the Barrow Island project (~7.6 Mm3 of00), (B) the Burrup Peninsula project in the Dampier Archipelago (~12.5Mm3 of sedimentthe Cape Lambert Dredging Project (~14 Mm3 of sediment dredged over 633 days from 22dging for entrance channels, approach areas, turning basins (TB), material offloading facil-ening the seabed to−12.5 to−20 m to allow access for bulk iron ore and LNG transportor maintenance and bunkering requirements, with most projects using a combination ofs, and with dredge material placement at offshore disposal sites. The ministerial approvalu).

Fig. 7. Sediment particle size distributions in the water column, collected 150 m awayfrom aworking trailing suction hopper dredge in a capital dredging programme, showingthe fine nature of the released sediments (Burrup Peninsula Project, see Figs. 3A and 6B).(A) Depth averaged particle size distributions (μm) and suspended sediment concentra-tions (mg L−1) inside and outside of a dredging plume. Numbers refer to the sitesshown in Fig. 6 B. (B) Average particle size distributions at the top (N0.3 m deep), middle(4–5 m) and bottom (8–9 m or 1 m from seabed) of the water column inside and outsideof the plume or (C) at the dredge material placement site. (D) Stylized display of coarsesand through silts to clay based on the Udden–Wentworth US standard classificationscale of sediments.
16 R. Jones et al. / Marine Pollution Bulletin 102 (2016) 9–29
examined below in terms of defining environmentally relevant or real-istic conditions during dredging programmes.
5.1. Particle size distributions (PSDs) associated with dredging
Sediment PSDs in the water column were measured during theBurrup Peninsula dredging programme in Western Australia (Fig. 6).Samples were collected inside a plume 125–200m away from an oper-ating trailing suction hopper dredge and at a reference site outside ofthe plume and ~800 m southwest of the dredge (Fig. 6B insert). Sam-pling inside the plume occurred over a 65 min period and at the refer-ence site outside of the plume a further 45 min later. Triplicate watersamples were collected at the top, middle and bottom of the watercolumnusing a 2.5 LNiskin bottle. Sampleswere filtered ontoWhatman47mmGF/F filters, and 100mL of distilled water used to rinse the con-tainer, filter funnel and filter pads of salts. Filters were then dried over-night in a 65 °C oven and weighed. Water column PSDs were assessedusing a Laser In-Situ Scattering and Transmissometry (LISST) 100XType C (Sequoia,WA, US) calculated by examining the angular distribu-tion of forward scattered light (referenced to purewater) over the rangefrom 2–500 μm using the proprietary inversion process. Data shallowerthan 0.3 m were discarded to remove the possibility of artefacts fromsmall bubbles and dissolving salts from the detector window uponimmersion.
Gravimetrically determined depth-averaged SSC ranged from12–110 mg L−1 within the plume, with the highest SSCs recorded atthe surface and the seabed (Fig. 7A) and with depth averaged PSDsranging within the silt-sized (4–62.5 μm) fraction. Surface plumes hadcomparatively finer PSDs b62.5 μm, but peak values of ~60 μmwere ob-served in bottom samples, collected 1m from the seabed (Fig. 7A). PSDsat the reference site were fine- andmedium-sized silts (Fig. 7A). Similarmeasurements at the offshore spoil ground showed lower SSCs andmuch smaller particle sizes, with peaks between 10–20 μm and a pat-tern of slightly coarser sediments at the seabed (Fig. 7C). PSDs of theseabed collected before the start of the dredging programme (seebelow) indicated a mixture of sand (22%), silt (38%), and clay (40%)was being dredged at the time of sampling.
Grain size analysis of surficial sediments within the area influencedby dredging plumes was examined a few months before and afterboth the Burrup Peninsula and Cape Lambert projects (Fig. 6). For theBurrup Peninsula project, surficial (top 10 cm) sediment sampleswere collected by SCUBA divers at ~50 sites along 8 transects with 4nearshore transects (0.5–2 km from shore) and 4 offshore transects(2–4 km from shore) ranging from 0.1–1 km from the edge of thedredged channel or turning basin (Fig. 6B). Sediments were analysedby a commercial laboratory using Australian Standard (AS) 1289.3.6.2and 1289.3.6.3 and data expressed as relative percentage of particlesizes in each of the four classes: gravel (N2000 μm), sand(2000–62.5 μm), silt (6.25–2 μm), and clay (b2 μm). For the CapeLambert project, 5 surficial (top 10 cm) sediment cores were collectedby SCUBA divers at ~20 sites along 4 transects (Fig. 6C), with 5 sitesalong each transect located at distances of approximately 0.25–5 kmfrom the edge of the turning basin (Fig. 6). Sediments were analysedby a commercial laboratory using wet sieving techniques for samplesN500 μm and laser diffraction (Malvern Instruments MastersizerMS2000) for fractions between 2 and 500 μm (ISO 13320–1) and dataexpressed as relative percentage of particle sizes in each of the four clas-ses: gravel (N2000 μm), sand (2000–62.5 μm), silt (62.5–4 μm), and clay(b4 μm).
The pre-dredging surveys in the Burrup Peninsula dredging projectindicated difference in the sediment composition according to proxim-ity to the coast, with the nearshore samples (located within ~2 km ofthe land) composed of approximately equal fractions of sand, silt, andclay whereas the more offshore sediments (N3 km) were overwhelm-ingly dominated by sand (~70%) (Fig. 8A). Overall, there are clear differ-ences in the sediment composition after the dredging programme, with
increases in the silt content and decreases in the sand/gravel fraction(indicated as a movement of the larger circular symbols in the ternarydiagram of Fig. 8). The second post-dredging survey (conducted 6months after the first) showed a near identical pattern of sedimentcomposition (data not shown). In the Cape Lambert dredging pro-gramme, all sediments were sandy (70%) before dredging, with siltsand clays making up only 10% and 5% respectively, of the size fractions.After the 2-year dredging programme, there was a reduction in thegravel and sand fraction of the sediment and a near doubling of thesilt and clay fraction to 20% and 10%, respectively (Fig. 8B).

Fig. 8. Particle size distributions in surficial sediment before and after dredging, showing a shift to finer grain sizes after dredging. (A) Cape Lambert and (B) Burrup Peninsula dredgingprojects (see Fig. 6B, C). The accompanying ternary diagrams show clay–silt–sand–gravel size distributions based on the Udden–Wentworth standard classification scale with the largercircles representing the average PSD before and after dredging.
17R. Jones et al. / Marine Pollution Bulletin 102 (2016) 9–29
5.2. Suspended-sediment concentrations (SSCs)
At the Barrow Island project (Fig. 6A), turbidity and light levelswere recorded on a single sensor platform attached to a steel framemounted ~40 cm from the seabed. Turbidity was measured using a
Fig. 9. Turbidity, light and water depth during the Barrow Island project close to the dredging adredging related turbidity events. Shown are the NTU and instantaneous PAR (μmol photons m(A) site 1 in Fig. 6A and at (B) a reference site near theMontebello Islands (site 10 in Fig. 6) overdaytime darkness periods when elevated SSC levels have reduced PAR levels to 0 μmol photons3 day study period.
single sideways mounted optical backscatter device (nephelometer)and Photosynthetically Active Radiation (PAR) was recorded using a2π quantum sensor (see Jones et al., 2015a, 2015b for water qualitymeasurements and site descriptions). Data were recorded every10 min before and during the ~1.5 year dredging programme at
nd at a distantly located reference site, showing loss of all benthic light during short-term,−2 s−1, primary y-axis) and water depth (metres, secondary y-axis) at Barrow Island ata 4 day period in April 2011. Black bars represent night time periods and arrows representm−2 s−1. Turbidity at the reference site is barely detectable, averaging b1.5 NTU over the

18 R. Jones et al. / Marine Pollution Bulletin 102 (2016) 9–29
multiple sites, but for the purpose of this analysis, data were aver-aged from 3 of the sites closest to the dredging (see Fig. 6A) located250 m from where the dredging was occurring.
A characteristic feature of thewater quality data is pronounced tem-poral variability, shown in Fig. 9A for a 3-d period in April 2011 whereNTUs underwent short term (several hours) 20–fold excursions, fromb5 ≥ 80 NTUs. These events were associated with tidal cycles and turbidplumes passing over the sensor platforms on an incoming tide. Whenthe turbidity levels peaked, the benthic light levels decreased to0 μmol photons m−2 s−1 during the daytime (see arrows in Fig. 9A).At a reference location with similar water depth (8–10 m) but located35 km from thedredging and uninfluenced by sediment plumes, turbid-ity levels were very low, averaging b1.5 NTU over the 3 day period andmid-day light levels peaked at ~100–200 μmol photons m−2 s−1. Thisindicates that the complete loss of daytime light near the dredgingwas caused by turbidity rather than high cloud cover.
Over the 1.5-year dredging programme turbidity levels regularlyexceeded 100 NTUs compared to baseline levels of b20 NTUs, butthese episodic periods of poor seawater quality were interspersedwith periods of good seawater quality (Fig. 10). Given this characteristic,a runningmeans analysis of the raw10min turbidity and lightmeasure-ment was conducted over multiple incrementing time periods from 1 h(for turbidity) or 1 day (for PAR) to 30 d. Each running time period cal-culated the average of the previousNT data points, whereNT is the num-ber of samples in the T hour mean. For example, for the 2-h runningmean (T = 2), NT = 12 as there are six 10-min samples per hour. TheT hour running mean at a point in time t
xT tð Þ ¼ 1NT
∑NT
i¼1xi tð Þ ð1Þ
Where xT ðtÞ is the mean calculated over the previous T hours of thedata from time t–T to time t hours, and xi(t) are the NT data points up toand including time t. To avoid biased averages, noxT valuewas recorded
Fig. 10. Changes in turbidity and light before and during a major capital dredging program(DLI, mol m−2) during the Barrow Island project at 3 sites closest to the dredging (see Fig.three sites close to the dredging (7–9m deep and b100–500m away). Figures on the right hto 30 days) before (dashed lines) and during (solid lines) the dredging programme.
ifmore than 20%of the data points for any particular runningmean timeperiod calculation were missing. Percentile values of the running meanvalues xT ðtÞ for each running mean period were then calculated for thepre-dredging and dredging periods.
In R (R Core Team, 2014), running means were calculated byconverting the data series for each site into an S3 time series objectusing the zoo function from the zoo library (Zeileis and Grothendieck,2005) then applying the runmean function from the caTools library(Tuszynski, 2013). Once running means for each time span were calcu-lated, these were summarized using an average along with various per-centile (P) values (P50, P80, P99 and maximum for turbidity and P50, P20,P5, P1 and minimum for PAR). These were plotted as a function of therunningmean time span and compared for the pre-dredging and dredg-ing periods. Analysis of the baseline data (i.e. pre-dredging) capturesshort term, transient increases in turbidity associated with natural tur-bidity events, whilst analysis when dredging was underway shows theeffect of turbidity generating effects on top of the natural patterns.
Prior to dredging the P95 percentile of the 1 h, 1 day, and 1week tur-bidity values were all 2–3 NTUs, whilst during dredging these valueswere over an order of magnitude higher at 22, 18, and 16 NTUs, respec-tively (Fig. 10A). The 5th percentile of the daily light integral (DLI, molphotons m−2) for 1 day and 1 week running mean periods was ~0.9and 1.3 mol photons m−2 in the baseline period but 0.1 and 0.3 molphotonsm2whendredgingwas underway (Fig. 10B). During the dredg-ing programme one of the worst sequences of light reduction was a 16-d period in the first few weeks of May 2011, where the average DLI didnot exceed 0.1 mol photons m−2 and the maximum instantaneous PARwas 30 μmol photons m−2 s−1.
Daily light integrals averaged 3.3 mol photons m−2 in the baselineperiod as compared to 1.8 mol photons m−2 day−1 during dredging.NTU data can be converted to SSCs (as mg L−1) by applying site-specific algorithms (conversion factors) based on gravimetrically deter-mined total suspended solid levels versus nephelometer readings. Forthe Barrow Island project, the conversion factor calculated this way
me where (A) Mean instantaneous NTU (every 10 min) and (B) Daily light integrals6A) in the pre-dredging (baseline) or during the dredging phase. Data are the mean ofand side show the different percentiles over different runningmean periods (from 1 h

19R. Jones et al. / Marine Pollution Bulletin 102 (2016) 9–29
was 1.3–1.6 and average nephelometrically-derived SSCs over the base-line period were 2.3 mg L−1 (marginally above the ~1.5 mg L−1 preci-sion of the instruments) and 7.1 mg L−1 over the dredging project.The runningmeans/percentile analysis was also conducted for the base-line and dredging seawater quality monitoring sites located from0.2–15 km away from the principle dredging activity (the creation ofthe turning basins) during the Barrow Island project at sites for boththe baseline and dredging periods and expressed as the P95 (Fig. 11).The turbidity patterns show a rapid initial decay in turbidity with in-creasing distance and effects on seawater quality could be observedup to 15–20 km from the dredging.
5.3. Light attenuation and light quality
Approximately 80 vertically-resolved downwelling planar irradi-ance light profiles were measured during the Cape Lambert dredgingproject using a Hydrorad-2 (Hydro-Optics, Biology, & Instrumenta-tion Laboratories, USA). This radiometer provided irradiance mea-surement values at sub-nanometre spectral spacing. For eachvertical profile the irradiance just-below surface Ed (0,λ) and thelight attenuation coefficient Kd ,λ were determined using the Beer-Lambert law. A general linear relationship between Kd ,λ and surfaceSSC measurements was established for the dredge plumes encoun-tered during sampling. This linear relationship, applied to all wave-lengths between 350 and 850 nm, yielded a mass specific spectralattenuation coefficient for SSC, and an offset closely resembling theattenuation spectrum of seawater itself. Additionally, a relationshipbetween clear sky extrapolated just-below surface incident irradi-ance Ed (0,λ) spectra and the solar zenith angle was determined.
Using these empirical relationships a downwelling irradiancespectrum was simulated for a given sun angle and water column av-eraged SSC concentration and PAR values were calculated from thefull-spectrum measurement. Although empirically tied to the condi-tions found during the Cape Lambert dredging campaign, the modeloutputs demonstrated the general and spectral trends encounteredin a dredge plume due to increased SSCs (Fig. 12A, B). This includeda decrease in light with depth and increasing SSCs and a shift tomore yellow light at high SSCs. For reference purposes, a verticallyintegrated 10 mg L−1 suspension of silt-sized sediments reducedlight levels to ~11 μmol photons m−2 s−1 at 10 m depth and a30 mg L−1 SSC reduced the light to the same values by ~4 m depth(Fig. 12A). At 5 m depth, the light spectrum under a dredgingplume shifted almost entirely to yellow/green wavelengths at
Fig. 11. Turbidity (NTU) values at different distances from dredging (from 200m to 15 km awaypercentile values (see (1)) in the baseline period (before dredging, grey symbols) and during t
concentrations of 10 mg L−1 and higher (Fig. 12B). These calcula-tions were simulated for a clear (cloud-free) sky at solar noon, andduring cloudy days at lower azimuth angles and at different seastates, underwater light quality and quantity would be substantiallylower.
6. Experimental studies of the effect of sediments on corals
Laboratory-based studies examining the effects of sediments oncorals can be grouped into experiments examining the effects in sus-pension and those examining the response of corals to a downwardflux of particles. The latter group includes a range of burial and sedimentcovering experiments. As discussed further below, it is not clear if sedi-ments were kept in suspension in the former group and the division be-tween the tables is subjective.
6.1. Suspended-sediments
Some of the earliest studies of the effects of suspended-sedimentswere associated with understanding the sub-lethal and lethal toxic-ity of drilling muds and fluids on corals (Kendall et al., 1983;Szmant-Froelich et al., 1981; Thompson, 1980; Thompson et al.,1980) and several short-term feeding experiments investigatingthe effects of particulate matter concentrations on ingestion of corals(Table 1). However, the majority of the studies have been conductedover longer terms (weeks tomonths) and associated with examiningthe effects of sediments on corals to gain a better understand the ef-fects of river runoff and/or dredging (Table 1). Whilst some studieshave been conducted in situ using sediments introduced to smallchambers held on the reef (i.e. Thompson et al. (1980) and Kendallet al. (1983)), most experiments were conducted in aquarium systemsassociated with marine research facilities. These ex situ studies havebeen conducted using either artificial lights (fluorescent and metal ha-lides lamps) or under natural sunlight (b300 μmol photons m−2 s−1)using neutral density shade cloth to manipulate irradiance.
Sediments used in these studies have been calcium carbonate sandsfrom the reefs where the corals were collected, sediments collected byfiltering or back flushing filters, marl (a naturally occurring calcite),and kaolin clay (Table 1). The particle size distributions in these studieshave not always been quantified and range from fine sands (i.e. Rice andHunter 1992; Sofonia and Anthony, 2008), to fine silts (b20 μm, Floreset al. (2012). A combination of water pumps and aeration have typicallybeen used to keep sediments in suspension.
) and over different runningmean time periods (from 1 h to 30 days). Shown are the 95thhe Barrow Island dredging project (black symbols, see Fig. 6A).

Fig. 12. Simulated effects of suspended sediment on light quantity and quality based onempirical data collected during the Cape Lambert dredging project. (A) Simulated verticalPAR (μmol photons m−2 s−1) profiles for eight SSCs from 0.5–30 mg L−1 (B andC) Simulated downwelling irradiance spectra at 5 and 10 m depth with varying SSCsfrom 0.5–30 mg L−1 and associated PAR as μmol photons m−2 s−1. The incidentdownwelling irradiance spectrum for all figures is typical of a clear sky at tropical noon,with an initial (underwater, 0 m depth) PAR value of ~1530 μmol photons m−2 s−1.
20 R. Jones et al. / Marine Pollution Bulletin 102 (2016) 9–29
6.2. Sediment deposition
The sediments used in deposition studies have typically been col-lected from local reefs or inter-reefal area and primarily composed ofbiogenic calcium carbonate or more terrestrial, siliciclastic sedimentscollected from river mouths (i.e. Loiola et al., 2013) (Table 2). Onestudy used terrestrial quartz/granite beach sand (Peters and Pilson,
1985) and several studies have used silicon carbide (carborundum)for experiments on smaller particle sizes (e.g. Bak and Elgershuizen,1976; Stafford-Smith, 1993; Browne et al., 2014) and limestone(Logan, 1988). Most studies employed a screening process to removecoarse and fine material and although PSDs of the sediments haveonly been quantified in a few studies, most have used sands, a fewhave used silts, and only the more recent studies have begun usingfine, silt sized fractions, including the studies by Weber et al. (2006),Flores et al. (2012) and Weber et al. (2012).
The application methods have varied widely from manual applica-tion of sediments via a tube (i.e. Bak and Elgershuizen, 1976), funnel(Riegl, 1995), or pipette (Logan, 1988), a syringe (Gleason, 1998) ormanually applied by unspecified techniques (Schuhmacher, 1977;Lasker, 1980; Stafford-Smith, 1993; Sofonia and Anthony, 2008; Piniak,2007). In some of the studies, sediments were applied by creating ini-tially high SSCs, which were then allowed to settle out of suspensionon the corals (Philipp and Fabricius, 2003; Weber et al., 2012; Weberet al., 2006). For longer term exposures various sediment resuspensionapparatus have used re-circulatory airlift systems (Browne et al., 2014;Riegl and Branch, 1995; Todd et al., 2004).
Themajority of studies reported nominal sedimentation rates calcu-lated by weight of sediment added and the surface area of the colonies.In some studies, it is not clear how sedimentation rates were calculated(Lirman et al., 2008) and in a few studies, sedimentation rate was mea-sured using small sediment traps or plastic squares placed within theexperimental containers (Browne et al., 2015; Flores et al., 2012;Peters and Pilson, 1985; Sofonia and Anthony, 2008; Todd et al., 2004).
7. Discussion
Our present day understanding of the effects of sediments on coralscomes from observations and the results of many laboratory- and field-based manipulative studies in a body of literature generated primarilyover the last 30 years. It has been reviewed many times (Erftemeijeret al., 2012; Fabricius, 2005; Foster et al., 2010; Jones et al., 2015b;Rogers, 1990), and it seems reasonable to assume that results fromthese studies can be used for impact prediction purposes and derivingwater quality values for managing dredging programmes near coralreefs. However, it is noticeable that seawater quality conditions duringdredging programmes have never been quantified in detail (but seeJones et al., 2015a), and using information from several of the largescale dredging programmes close to coral reefs in recent years, the insitu seawater quality conditions differ in many regards from the exper-imental conditions used in past manipulative studies. In their review ofprinciples of sound ecotoxicology and risk assessment, Harris et al.(2014) emphasize the critical importance of defining and testing realis-tic and environmentally relevant exposure scenarios and to compre-hensively justify those exposure conditions (Harris et al., 2014).
The conceptual model developed in this review identified keycause–effect pathways affecting corals are light attenuation affectingphotosynthesis (autotrophy), high SSCs affecting feeding and cleaningprocesses (heterotrophy), and sediment covering restricting solute ex-change (smothering). These are well-known cause–effect pathways forthe effects of sediments on corals (see Rogers, 1990), but from the con-ceptual model it is clear the proximal stressors are highly interlinked,with some connected along causal pathways and some acting alone orin combination. As such, the most relevant parameter(s) may changeaccording to dredging activities, sea-state, distance from the dredgeetc. Homer's sea-god Proteus was known for his ability to transform,i.e. to change shape and form. The ‘protean’ nature of suspended-sedimentsmakes it difficult to identifywhich is themost relevant or im-portant pressure parameter(s) at any given time, to identify cause-effect pathway(s), and importantly, to establish dose–response rela-tionships. For example, if smothering of the coral's surface occurs, anybiological effects which subsequently occur cannot be related to turbid-ity measured in the overlying water column. This has important

Table 1Studies examining the effects of suspended-sediments on corals. Experiments were conducted either under diel cycles or artificial lights from fluorescent and or metal halide lights. Under artificial lighting, the light intensities are expressed in μmolphotons m2 s−1 and Daily Light Integral (mol photon m day−1) calculated from the photoperiod. ns = not specified, SPM = suspended particulate matter.
Study Species Sediment typePSD(μm)
Test typeTime(day)
SSCs (mg L−1)L:D cycleLight source
PAR (max μmol m−2 s−1)DLI (mol m−2 day−1)
Rice and Hunter(1992)
7 species of Atlantic corals Offshore reef sediments b500 33 min turnover 10–204 conc.49–199
14:10 hSource: ns
PAR 2–2.5, DLI N0.13
Experimental outcome: No effects on survival in any treatments and no consistent patterns of a decline in growth rate
Telesnicki andGoldberg (1995)
D. stokesiiM. meandrites
Silt sized marlstone b63Partial water changesevery 4 days
7–211–2, 7–9, 14–16, 28–30NTUs
14:10 hMetal halide lamps
1–2 NTUs: PAR ~68, DLI 3.47–9 NTUs: PAR ~64, DLI 3.214–16 NTUs: PAR ~62, DLI 3.128–30 NTUs: PAR ~56, DLI 2.8
Experimental outcome: Effects on P/R ratios at 14–16 and 28–30 NTUs compared to controls. Prolonged exposure to 28–30 NTUs caused lesions in both species. NTU of 29–30 NTUs was equivalent to a Marl concentration on 55 mg L−1.
Anthony andFabricius (2000)
G. retiformisP. cylindrica
Collected by back-flushing asand filter
ns 33 min turnover 56b2~4~16
Natural cycleSunlight + neutral densityshade cloth
b2: PAR 600, DLI 8.1–12.8~4: PAR 140, DLI 2.5–4~16: PAR 140, DLI 2.5–4
Experimental outcome: Skeletal growth rates negatively affected by shading but not by the SPM treatments
Anthony (2000)P. damicornisA. millepora
Filtering of water from thereef
ns Static 1 h 1, 4, 8, 16 and 30Natural cycleSunlight + neutral densityshade cloth
PAR equivalent to 3–5 m depthacross all treatments
Experimental outcome: Experimental outcome: Reduced feeding rates in corals exposed to 30 mg L−1
Sofonia and Anthony(2008)
Turbinaria mesenterinaCollected from an inshoreturbid reef
60–120Flow though withrepeat dosing
34 b1, 16, 100 mg cm2 10:14 hMetal halide lamps
PAR ~300, DLI 11
Experimental outcome: No effect of the highest sediment load, regardless of flow conditions
Flores et al. (2012)A. milleporaM. aequituberculata
Reef sediment ground using aceramic mill
Mean 6 1.3 day turnover 84 1, 3, 10, 30, 10012:12 hFluorescent lights
1 mg L−1: PAR 200, DLI 8.330 mg L−1: PAR 184, DLI 8100 mg L−1: PAR 177, DLI 7.6
Experimental outcome: For branching A. millepora some partial mortality occurred in the 100 mg L−1 treatment (LOEC) but no mortality was noted at 30 mg L−1 (NOEC). For M. aequituberculata (horizontal growth form) partialmortality was noted at 3 mg L−1 and above, but related to settlement of sediment on the surface.
Cooper and Fabricius(2012)
Porites spCollected from an inshorereef
b63 Continuous flow 562 and 20 under 2 shadetreatments
12:12 hMetal halide lamps+ neutral density shadecloth
1–2 mg L−1: 835, DLI 3720 mg L−1: PAR 598, DLI 261–2 mg L−1: PAR 56, DLI 2.420 mg L−1: PAR 32, DLI 1.4
Experimental outcome no mortality in corals, change in colour brightness in corals exposed to SPM
Browne et al. (2015)Merulina ampliata, Pachyseris speciosa,Platygyra sinensis
Silicon carbide1–300Mean60
Flow through 28150–100100–250
10:14 hHigh Output aquariumbulbs
1 mg L−1: PAR140, DLI 550–100 mg L−1: PAR 110, DLI 4100–250 mg L−1: PAR 80, DLI 2.9
21R.Jones
etal./Marine
PollutionBulletin
102(2016)
9–29

Table 2Studies examining the effects of settling sediments on corals.
Study Species Sediment PSDs (μm) Application methodsApplication rate (mg cm−2
day−1)Experimental outcome
Bak and Elgershuizen(1976)
19 Caribbean reef coralsReef sand and carborundumpowder
100–3000 mean = 12000.75, 1.5 and 3.5 g sand and0.75 g carborundumdelivered by a tube
100–425 (sand) and 100(carborundum)
Sand cleared more efficiently thancarborundum powder and coralsurfaces were typically clean by 24h in up to 3000 mg cm2 treatments
Schuhmacher (1974) 14 species from Gulf of Aqaba, Red Sea Carbonate and silicate sand N180 b 1.4 mmSand dropped on corals tocover the surface by a layerof 1 mm
Could not be determinedMost species covered with 1 mm ofsand were still partially coveredafter 72 h
Lasker (1980) Montastrea cavernosaCollected from a reef, wet sievedand 2 fractions used
60–250 (fine)500–1000 (coarse)
20 cm3 of sedimentdeposited on each colony
18.5 (fine) 74.4 (coarse)
Approximately half to two thirds ofthe sediment removed from thesurfaces within 8 h with mostclearance occurring in the first 2 h
Peters and Pilson (1985) Astrangia danaeQuartz/granite beach sandpassed through b500 μm sieveand combusted at 550 °C
62–500 mean = ~200Sand sprinkled on thesurface of the corals whichwere examined for 8 h
200 applied daily for 4weeks then 3 times a dayfor 2 weeks
Sand rapidly (within 1–2 h) cleanedfrom the surface with littleremaining after 24 h. No effects atthe 200 mg cm−2 day−1 treatmentbut some cellular damage at the 600mg cm−2 day−1 treatment
Logan (1988) Scolymia cubensis Fine, medium and coarse N62–20003 g spread with a pipetteover the corals' oral disk
Cannot be determinedbut likely to be N100 s
10–60% removed within 24 h inhorizontally orientated corals, withfine sediments removed quickerthan coarse sediment. Sedimentclearance was 90% complete within24 h if corals were inclined at 75°
Hodgson (1990)Oxypora glabra, Montipora verrucosa,Porites lobata, Pocillopora meandrina
Fine, freshwater washed anddried marine sediment
‘Fine’ sediment50 or 300 g of sedimentstirred vigorously 1–2 × day
30–40 for 7–10 day
Sediments accumulated on flat andconcave parts resulting in bleachingthen tissue necrosis, and sedimentsoverlying tissues changed to agreyish-black
Stafford-Smith (1993) 22 species of Australian corals~70% carbonate & 30% quartzobtained from reefs
63–250500–1000
5 g of sediment spreadevenly over a 5 × 5 cmsurface of the coral
200 and 200 for 6 weeks
Fine sediments were rejected moreefficiently than coarse ones, withbranching species clearingsediment loads within a few hours.Clearance of 50–100% of surfaceoccurred within 24 h, with someless tolerant species failing tocompletely remove sediments aftera few days. Bleaching and mortalitywas observed in some specieswithin a few days, but other speciesrequired longer periods of sedimentcovering for mortality to occur
Riegl (1995) 8 species of corals from South Africa Locally collected non-reef sandv. fine (40–125) fine(125–250) coarse (N500)sand
Deposited through a funneland a constant flow of finesand through a re-circulatorysystem
200 for 8 h200 for 6 weeks(continual coverage)
No difference between sedimenttype and 50–100% clearance ofsediment in 8 h with no differencesbetween species in the ability toshift different grain sizes. Mortalitynoted in 3 species after 15 dayscontinuous exposure to 200 mgcm−2 day−1
Riegl and Branch (1995)Favia favus, Favites pentagona,Platygyra daedalea, Gyrosmiliainterrupta
Coarse reef sand combusted at350 °C
46.1%250–50053.4%125–250
14.2 g applied to a chambercontaining a coral
200Reduction in P/R ratios at allconcentrations
22R.Jones
etal./Marine
PollutionBulletin
102(2016)
9–29

Mean = 253
Gleason (1998) Porites astreoidesIntertidal beach sandCombusted at 450 °C
70% b10,25% 10–503% N 50–1002% N100
Applied with a syringe5–6 applied twice a dayfor four days
Sediment built up on the corals'surface resulting in many coloniesexhibiting
Philipp and Fabricius(2003)
Montipora peltiformisCollected from 3 m water depthfrom a local harbour
Fine, muddy sedimentscreened to b1000
Unspecified amount ofsediment was placed into a1000 L tanks and allowed tosettle over 6 h
Average 151(Range 79–234)
Bleaching and early signs ofnecrosis in colonies exposed to 151mg cm−2 for 12–18 h and necrosisin corals covered from 24–36 h.Effects were confined to areas thatwere sediment covered
Todd et al. (2004)Diploastrea helioporaFavia speciosa
90%:10% quartz: carbonate5% coarse, 45% medium, 45%fine and 5% very fine sand
Unspecified amount ofsediment was resuspended for1–5 min four times per day.
Average of 20 for 4 monthsSome minor bleaching was observed,no mortality occurred and no obviousmorphological changes
Weber et al. (2006) Montipora peltiformisCollected from 2 rivers estuariesand 3 reefs, and aragonite dustfrom Porites skeletons
b63, fine sand (63–250)medium (250–500)
Unspecified amount ofsediment was placed in 60 Lcontainers and allowed tosettle out over a 2 h period
Nominal values of 33, 66,100, 133, 160
Sands were removed moreefficiently than silts and nutrientpoor sediments removed moreefficiently than nutrient enrichedones. Anoxia develop under nutrientenriched silty sediments even undershort term (days) exposure
Piniak (2007) P. lobata and M. capitataCarbonate beach sand andsiliciclastic harbour mud
Sand (99%, 63–2000), mud(55%, 63–2000 and 23% b
0.62)
200–250 g of sand or mudspread evenly over thesurface of the corals
M. capitata = 2200(mud), 2,800 (sand),P. lobata = 1,500 mg(mud), 1,600 (sand)
Reduction in quantum yield incorals smothered in sediments for 30h or more, with harbour mud havinga greater effect than beach sand
Sofonia and Anthony(2008)
Turbinaria mesenterinaSediment (sandy silt) collectedfrom a turbid reef environment
60–120Fine sediment was appliedmanually 3 × per day for 34days
b1, 16 and 100 each day No effects observed
Lirman et al. (2008) Porites astreoides Siderastrea sidereaSurficial sediments collectedfrom a local reef
Sand with mean PSD of 1761000 mg L−1 sedimentadded daily to 5 L containers
53 per day for 3 weeks
Reduced growth rate in coralsexposed to sand deposition for 3weeks and involving a temporarycovering of sediment and temporaryreduction in light of 95% for 6 h each day
Flores et al. (2012)Acropora milleporaMontipora aequituberculata
Sediments were collected froman offshore reef
95% b20 μm mean size ofb6 μm
Added to 30 L containers,and kept in suspension bypumps to give 1, 3, 10, 30,100 mg L−1 solutions
b1 to 83
No mortality in A. milleporaexposed to 30 mg L−1 for 4 weeksand some partial and whole colonymortality at 100 mg L−1. Partialmortality in M. aequituberculataoccurred as to as low as 3 mg L−1
and 60% mortality occurred at 100mg L−1. Mortality was directlyrelated to sediment smotheringwhich varied considerably betweenmorphology the branching andplate like mortality
Weber et al. (2012) Montipora peltiformisOrganic rich sediment collectedfrom 5–10 m on a fringing reefof GBR
b63 μm mean = 15 μm
Sediment added to 60 Lcontainers and held static forseveral hours to coat coralsin a layer of sediment
66 = 2.1–2.6 mm thick
Rapid (15–18 h)microbially mediatedanoxia and tissue necrosis in coralscovered in a 2–3 mm thick layer oforganically enriched sediments
Loiola et al. (2013) Mussismilia braziliensisMuddy, 91% siliciclasticsediment from a river channel
Fine silt
Sediment was added to 4 Lcontainers and stirred for 2min each day to resuspendthe sediments
Unspecified amount ofsediment allowed tosettle over 24 h toproduce 7 sedimentationrates of 0, 10, 50, 199,250, 350 and 450
No necrosis in corals exposed to upto 150 mg cm−2 day−1 of organicfree sediments for 45 days or up to400 for 5 days
Browne et al. (2015)Merulina ampliata, Pachyserisspeciosa, Platygyra sinensis
Carborundum 1–300 μm median 60 μmCorals exposed tointermittent bursts ofsedimentation
4 week exposure to25–65 and 4 weekrecovery period
No effects (Platygyra sinensis) b5%partial mortality (Merulinaampliata) or b15% mortality(Pachyseris speciosa) 23
R.Jonesetal./M
arinePollution
Bulletin102
(2016)9–29

24 R. Jones et al. / Marine Pollution Bulletin 102 (2016) 9–29
implications and potentially confuses and confounds laboratory andfield experiments and the associated conclusions.
Summarizing the detailed seawater quality information in this studyfrom Figs 7–11 (and also Fisher et al., in press ; Jones et al. 2015a), in thenear-field environment sediments released into the water column andmoving out of the immediate dredging area (to create the far-fieldplume) are primarily silt- and clay-sized. Dredging increases the fre-quency of extreme values and alters the intensity, duration and fre-quency of the turbidity events over background levels. Upperpercentile values (e.g. NP95) of seawater quality parameters can behigh-ly elevated over short periods i.e. increasing by 2–3 orders ofmagnitudeover a day and exceeding hundreds of mg L−1 over a period of hours.Over longer periods (days), SSCs P95 are in the tens of mg L−1 and typ-ically less than 10mg L−1 over a period ofweeks andmonths. Scatteringand light attenuation by the suspended-sediments occurs rapidly in thewater column, with the shallow reef environment routinely experienc-ing semi-dark, caliginous, or ‘twilight’ periods, and frequently completeloss of light atmoderately elevated SSCs. However, amore common fea-ture was extended periods, i.e. days to weeks, of low light. Differentwavelengths are preferentially attenuated underneath plumes, withmore immediate loss of red and blue light and a shift to less photosyn-thetically useable yellow-green light. The impacts of dredging on sedi-mentation and the problems associated with measuring sedimentdeposition and the significance of quantifying sediment deposition forunderstanding coral mortality in dredging programmes are discussedfurther below.
7.1. Experimental studies of the effects of suspended-sediment and lightattenuation on corals
It is not clear from the description of many of the laboratory basedstudies whether sediments were truly kept in suspension throughoutthe study, especially those with larger particle sizes (i.e. Rice andHunter 1992) and higher sediment concentrations (Browne et al.,2015; Sofonia and Anthony, 2008). Many of the laboratory-based stud-ies examining the effects of suspended-sediment have not specified theparticle sizes and therefore it is difficult to ascribe any observed effectsto SSCs or to sediment covering. All studies were conducted in shallowcontainers and it is conspicuous thatmany studies have not compensat-ed for the fact that light attenuation is exponential, and likely to be quitesmall in such a shallow water depth even at higher concentrations.Flores et al. (2012)measured a b10% reduction in PAR in 15 cmdeep ex-perimental containers caused by a 30mg L−1 SSC offine silt, whereas ona reef at solar noon and on a sunny day, nearly all light would be atten-uated by 5 m under an equivalent concentration (Figs. 9, 10 and 12).Some studies have recognised this issue and compensated for thisdepth effect by reducing light levels with neutral density shade-clothat higher sediment concentrations, or partially compensated for theeffect by reducing light uniformly across several different sediment con-centrations (Anthony, 2000; Anthony and Fabricius, 2000; Cooper andFabricius, 2012). Other studies have not addressed the issue at all(Browne et al., 2015; Flores et al., 2012; Hodgson, 1990; Riegl, 1995;Sofonia and Anthony, 2008; Telesnicki and Goldberg, 1995; Thompsonet al., 1980). This canmake the resultsmisleading for hazard assessmentpurposes, i.e. corals could be living through SSC treatments in laborato-ry-based experiments which in situ could have more profound effectsbecause of the associated light reduction. In the experiments ofBrowne et al. (2015), PAR levels in the shallow containers during highsediment pulses (50–100 and 100–250 mg L−1) were reduced from140 μmol photons m−2 s−1 to 100 and ~70 μmol photons m−2 s−1, re-spectively. Because there was no additional shading to reduce the lightlevels to the levels corals would experience in situ under similarsuspended-sediment concentrations, the corals lived through the4 week exposure with either no effects (Platygyra sinensis) b5% partialmortality (Merulina ampliata) or b15% mortality (Pachyseris speciosa).Survival of corals in situ under more appropriate light regimes (i.e.
most probably full light extinction— see Fig. 12A) over a similar extend-ed time period, could have resulted in a different outcome given thephysiological effects known to occur in corals in darkness (DeSalvoet al., 2012; Rogers, 1979; Yonge and Nicholls, 1931).
Compensating for the depth effect using neutral density shade clothover containers will not, however, correct for spectral changes whichmay occur underneath dredge plumes. The underwater light field ismodified by the spectral-dependent absorption and scattering proper-ties of the seawater itself involving absorption of the red-infrared-spectral region, and also by phytoplankton, humic substances(gelbstoff) and especially particulate matter (Jerlov, 1976; Kirk, 1994;Kirk, 1985). The hyperspectral data showed a reduction in blue andred wavelengths and a clear shift to yellow-green conditions under-neath a dredge plume. This region is outside of the major absorptionpeak of photopigments, meaning that light is poorly absorbed by thecorals in this part of the spectrum and it is relatively inefficient at driv-ing photosynthesis (Halldal, 1968; Szabó et al., 2014). This is a signifi-cant issue with monitoring programmes and for deriving in situ dose–response relationships from laboratory experiments, because thetypes of light sensors commonly used in monitoring programmes inte-grate across the PAR wavelengths and do not account for any spectralchanges. That is, the reported light levels in 9, 10, and 12 could be mis-leading as to what corals can actually use for photosynthesis, i.e. the dif-ference between photosynthetically useable radiation (PUR) (Morel,1978) and photosynthetically active radiation (PAR) (Tyler, 1966). Anumber of recent studies have begun investigating the effects of lightquality on coral physiology (Wangpraseurt et al., 2012; Wangpraseurtet al., 2014) made easier by recent advances in lighting technology(Wijgerde et al., 2012; Yeh et al., 2014), and spectral changes shouldbe considered in future studies if results from laboratory based studiesexamining SSCs and light reduction are to be extrapolated to the field.
The results from those experiments where there was no light com-pensation have inadvertently provided evidence to suggest corals canactually survive quite high SSCs as long as the light is sufficient andthere is no sediment accumulation on the surfaces. For example, therewas no mortality in A. millepora exposed to mg L−1 for 30 days (Floreset al., 2012), or in Porites spp. exposed to 20 mg L−1 for 56 days(Cooper and Fabricius, 2012). Skeletal growth of Goniastrea retiformisand Porites cylindrica exposed to 16 mg L−1 for 2 months were alsonot different from ex situ or in situ controls (Anthony and Fabricius,2000). These sediment loads (intensity × duration) are high comparedto natural resuspension events (Larcombe et al., 1995) and conditionswhich can occur close to a major capital dredging project (see Figs. 10,11). By isolating SSCs as the primary variable, these studies have provid-ed evidence that for adult corals, light availability and sediment cover-ing are probably the most important cause–effect pathways associatedwith turbidity generating events in the short term.
7.2. Experimental studies of the effects of sediment deposition on corals
There have been many studies examining the effects of sedimenta-tion on corals but there are also some methodological issues whichmake interpretation of these studies difficult. Many studies have usedsilicon carbide as a sediment proxy (Browne et al., 2015; Junjie et al.,2014; Lui et al., 2012; Stafford-Smith and Ormond, 1992), which be-cause of differences in specific gravity, sphericity and porosity andlight scattering and absorbing properties makes generalization ex-tremely difficult (Storlazzi et al., 2015). The use of black carborundum,which traces back to the feeding experiments of Yonge (1930), shouldbe considered carefully if the intention is to use the results of such stud-ies to make generalizations of the effects of sediments released fromdredging. As significantly, it is noticeable that many studies have usedsands (62–2000 μm) as opposed to the fine silts and clays which typifythe near and far-field dredge plume. Smaller particles havemuch great-er scattering and absorption properties and so light transmission andsolute exchange will vary considerably depending on sediment type

25R. Jones et al. / Marine Pollution Bulletin 102 (2016) 9–29
(and colour) (Storlazzi et al., 2015). Weber et al. (2006) recorded lighttransmission of only ~0.1% through a 66 mg cm sediment layer on acoral in contrast to Riegl and Branch (1995), who recorded light trans-mission as high as 30% through a 200 mg cm2 sediment layer. The pri-mary difference between the studies was that Weber et al. (2006)used silt (with a median grain size of ~10 μm) and Riegl and Branch(1995) used much coarser sand with a median grain size of 250 μm(~50% between 250 and 500 μm).
The difference between the silt and clay sized particles found indredging plumes and the sands used in some of the laboratory experi-mentsmakes it difficult to interpret information and extrapolate to con-ditions during dredging. For example, in experiments designed topartition the effect of turbidity and settling particles on Galaxeafascicularis andGoniopora somaliensis, Junjie et al. (2014) acknowledgedthat settled sediment could create an additional barrier to light, but thendiscounted the potentially confounding effect on the high light avail-ability reported by Riegl and Branch (1995) discussed above. Junjieet al. (2014) used substantially smaller grain size (10–300 μm with amedian grain size of 60 μm), used black carborundum (see Storlazziet al., 2015), and the possibility that light attenuation by the sedimentlayer was not a significant factor in this experiment study has notbeen discounted.
Why such coarse sediments have so routinely been used is not clear,but perhaps the reason is purely practical, as silts and clay cloud the sea-water somuch that the corals cannot be seen (see Bak and Elgershuizen,1976; Todd et al., 2004). Settling velocities of sediments are related todensity and proportional to the diameter squared according to Stoke'slaw. Assuming particles do not coagulate, flocculate, or grow and inthe absence of vertical mixing, a fall velocity of 1.29 cm s−1 for sand-sized (200 μm) particles (Storlazzi et al., 2011) should result in sedi-ment at the surface reaching a 10 m deep seabed within b15 min. Set-tling velocities of silts are lower and they have the opportunity tomove away from dredges onto nearby habitats. Far field plumes (kmaway from dredges) are likely to be made up of smaller particles still,similar to thefine silts and clayswhich only recently have been reportedas dominating river plumes a few km from river mouths (Bainbridgeet al., 2012).
A different and perhaps more fundamental problem than sedimenttype and particle size is the application rates (sedimentation rates)used in these studies. All the studies have used experimental sedimen-tation rates based on in situ measurements with sediment traps. Theproblem with traps is that they capture all particles including thosewhich are just passing over the reef or that are onlymomentarily depos-ited (Field et al., 2012; Risk and Edinger, 2011; Storlazzi et al., 2011;Thomas and Ridd, 2004). Traps can even collect sediments that neveractually settle and therefore can provide a sedimentation estimate(even in net erosional environments), i.e. they provide a ‘pseudo-sedi-mentation’ rate. Interpreting data from traps ismore difficult in shallow,energetic environments that are characteristic of reefs, and these limita-tions do not include the effects of waves and wave orbital velocitieswhich result in acceleration and deceleration of horizontally movingparticles over the trap mouth during agitated sea states (Bothneret al., 2006; Storlazzi et al., 2011)(cf Fig. 1). Traps have been describedas at best only providing a vague approximation (Storlazzi et al.,2011) of the amount and type of sediment that deposits, and havebeen suggested as being more apt to record information onsuspended-sediment dynamics than provide any useful data on sedi-mentation (Buesseler et al., 2007; Gardner, 1980; Gardner et al., 1983;Storlazzi et al., 2011). These problems have been discussed andreviewed many times in different fields of marine research, see forexample (Bothner et al., 2006; Browne et al., 2012; Buesseler et al.,2007; Butman et al., 1986; Jürg, 1996; Kozerski, 1994; Reynolds et al.,1980; Risk and Edinger, 2011; Storlazzi et al., 2011; Thomas and Ridd,2004).
A number of studies have attempted to overcome the trapping arte-fact and address the question of what are typical sedimentation rates on
coral reefs. OnKenyan reefs,McClanahan andObura (1997) noted that afactor of 3 is required to scale up sedimentation rates on flat tiles (whichdo not suffer resuspension limitation and deposition bias) to thosemea-sured with sediment traps (range 3–6mg cm−2 day−1). More recently,using circular, concrete-filled PVC hubs (SedPods), Field et al.(2012) measured net sedimentation rates of 0.3–0.6 mg−2 day−1
in Hanalei Bay, Hawaii, as opposed to sediment trap accumulationrates of 7–17 mg cm−2 day−1. Using shallow trays, which alsoallow resuspension, Browne et al. (2012) estimated that net depositionrates in the high-turbidity nearshore coral settings on the inner shelf ofthe central Great Barrier Reef, averaged 3–7 mg cm−2 day−1 over thecourse of a year. These values were considerably lower than measuredusing traps in the same area i.e. a mean of 44 mg cm−2 day−1 with anupper value as high as 364 mg cm−2 day−1 (Mapstone et al., 1992).These more recent studies of deposition rates need to be contrastedwith earlier suggestions — but based on the current understanding atthe time — that sedimentation rates in excess of 200 mg cm−2 day−1
for periods of days to weeks are ‘…not uncommon on fringing reefs ofthe GBR…’ (Stafford-Smith, 1993).
The problem with interpreting information from traps led Storlazziet al. (2011) to conclude that prior research results in the literatureneed to be interpreted carefully and with recognition that there maybe irregularities in the trapping technique or in the application to un-derstanding coral reef processes. Within the context of developingthresholds for dredging projects, if sediment traps are overestimatingsedimentation rates (through resuspension limitation and depositionbias), then replicating those rates conditions in laboratory studies mayresult in exposure scenarios that are unrepresentative of anything butextreme conditions. The experimental application rates are often inthe high tens of mg cm−2 day−1, commonly hundreds of mg cm−2-
day−1, and sometimes even g cm−2 day−1. When these rates are ap-plied under still or low flow conditions this can result in sedimentdeposits that aremillimetres thick on the corals' surface. The depositionrate of 66mg cm2 day−1 in the studies ofWeber et al. (2012) resulted ina smothering of the coral tissues in a 2–3 mm thick layer of sediment,and this is likely to be less than the earlier deposition experiments ofPhilipp and Fabricius (2003) where deposition rates of up to ~-230 mg cm2 day−1 were used. For comparative purposes, the visuallysignificant turbid flood plumes on the Great Barrier Reef have concen-trations of sediments which, if settled to the seabed, would produce adeposit of only 10 μm (Orpin et al., 2004). The question then becomeshow representative are experiments that create mm thick deposits ofsediment in less than a day, and do these reflect conditions that canoccur naturally or only very extreme events such as cyclones or onlyconditions that occur very close to dredging.
Smothering is regularly observed in dredging projects and occursbecause the sedimentation rate is likely to exceed any natural ratescorals have experienced previously. This is because dredging cancause high SSCs in sea-states where ambient hydrodynamics cannotsupport the load (Fig. 3A–D) and the sediment ‘overburden’ rapidlyfalls out of suspension according to particle specific settling velocities.Smothering occurs when sediment cannot be cleared fast enoughfrom the surface and sediment begins to accumulate over successivedays producing the sort of images in Bak, 1978; Foster et al., 2010, andFig. 3. In contrast, natural high SSCs produced by high wind eventsoccur where wind-driven waves and tidal currents create conditionswhere wave orbital velocities are sufficient to keep some of the sedi-ments in suspension and deposition subsequently occurs (after a set-tling lag) during quiescent periods and after further entrainment anddilution (Ogston et al., 2004). These are very different scenarios andsediment deposition is therefore different fromother proximal stressorssuch as elevated SSCs and light reduction, as short term turbidity eventsand low light, twilight, periods are not uncommon in the marine envi-ronment associated with wind and wave events (Anthony andLarcombe, 2000; Jones, 2008; Storlazzi et al., 2009). For these proximalstressors it is likely to be the duration and frequency caused by dredging

26 R. Jones et al. / Marine Pollution Bulletin 102 (2016) 9–29
that differs fromnatural conditions rather than the intensity aswith sed-iment deposition. Corals are exposed to conditions (of low light and highSSCs) that they have experienced previously, in the short term, and arephysiologically acclimated to these natural conditions. How they dothis is via a range of strategies including photo-acclimatory changes,shifts from autotrophy to heterotrophy, and replenishment of energy re-serves between turbidity events (Anthony, 2000, 2006; Anthony andFabricius, 2000; Anthony and Hoegh-Guldberg, 2003; Anthony andLarcombe, 2000).
There are currently no suitable techniques formeasuring lowmgpercm2 deposition events with sufficient resolution to be effective as amonitoring tool for dredging programmes (Field et al., 2012; Perkeyand Wadman, 2013; Risk and Edinger, 2011; Thomas and Ridd, 2004),although use of upward pointing optical backscatter devices offer prom-ise (Thomas and Ridd, 2005; Thomas et al., 2003). Once information be-comes available on the range of sediment deposition rates (as mass perunit area or thickness deposition per day) over different time periodsduring natural conditions, or in the near- and far-field during dredgingprogrammes, then this will allow contextualization of past studies andinformation that can be used for impact prediction purposes forsedimentation.
7.3. Seawater quality thresholds for coral reefs and future directions
Future ex situ studies need to clearly state what pressure parameteris being tested and recognise and eliminate the potential confoundingeffect of other parameters if values are to be proposed for threshold de-velopment. Studies should be conducted with locally collected reefalsediments rather than using sediment proxies such as carborundum.Studies to characterize the organic content of the sediments releasedinto the water column by dredging (i.e. loss at the drag/cutter heads,by overflowing, or released by disposal at placement sites), and how itcompares to surficial samples from the seabed before dredging areneeded. Many studies have now shown the importance of the organiccontent of the sediments on coral sediment clearance and survivorship(Loiola et al., 2013; Weber et al., 2012; Weber et al., 2006). The use oflow organic content or organic free sediments (Peters and Pilson,1985; Riegl, 1995; Riegl and Branch, 1995), or proxies (Browne et al.,2014; Lui et al., 2012) has been suggested a starting point for under-standing coral sediment shifting capabilities without additional variableof organic content, nutrient, andmicrobial content. Particle sizes shouldbemeasured and experiments examining the effects of sediment depo-sition in the near-field need to use up to coarse silt-sized sediments andfiner fractions for far-field conditions. Contaminant levels need to bede-scribed if there is reasonable doubt they are of concern. PAR levels intanks should be specified asmaximum, aswell as the daily light integraland recent advances in lighting technologies such as light emitting di-odes (LEDs) means it is now possible to address spectral changesunder plumes.
As Harris et al. (2014) warn in their review of principles of soundecotoxicology, there is a danger associated with an incomplete under-standing of exposure pathways and the use of conditions that are un-representative of the majority of situations typically encountered bywildlife. This statement seemsapplicable to studies on the effects of sed-iments on corals (see also Storlazzi et al., 2015; Storlazzi et al., 2011), asmany experiments have been conductedwithout explicit justification ofthe exposure regimes especially with studies examining sedimentation.Harris et al. (2014) suggest authors should be open and honest aboutthe context of their study to those conditions which have been mea-sured (or predicted) in the real environment and the explanation ofthe exposure conditions for futures studies should be comprehensive.This will then enable judgements to be made of whether highsuspended-sediment concentrations and the associated light reductionand sediment smothering at different distances from dredging is a haz-ard or a risk to underlying communities, and allow the development of
the water quality thresholds for impact prediction and monitoringpurposes.
Author contributions
Conceived the study RJ, PB-B, RF. Conducted the analyses, and devel-oped the model RJ, P B-B RJ. Conducted the PSD and light quality andquantity measurements MS, WK. All authors contributed to the writingand approved the final review.
Competing interests
The authors have declared no competing interests exist.
Acknowledgements
This project was funded by Chevron Australia, Woodside EnergyLimited, BHP Billiton and Rio Tinto through contributions to the West-ern Australian Marine Science Institution (WAMSI) Dredging ScienceNode. This research was enabled by data and information generouslyprovided by Woodside Energy Ltd, Rio Tinto Iron Ore and Chevron.The funders had no role in data analysis, decision to publish, or prepara-tion of the manuscript.
References
Anthony, K., 1999. Coral suspension feeding on fine particulate matter. J. Exp. Mar. Biol.Ecol. 232, 85–106.
Anthony, K., 2000. Enhanced particle-feeding capacity of coral on turbid reefs (Great Bar-rier Reef, Australia). Coral Reefs 19, 59–67.
Anthony, K., 2006. Enhanced energy status of corals on coastal, high-turbidity reefs. Mar.Ecol. Prog. Ser. 319, 111–116.
Anthony, K., Fabricius, K., 2000. Shifting roles of heterotrophy and autotrophy in coral en-ergetics under varying turbidity. J. Exp. Mar. Biol. Ecol. 252, 221–253.
Anthony, K., Hoegh-Guldberg, O., 2003. Kinetics of photoacclimation in corals. Oecologia134, 23–31.
Anthony, K., Larcombe, P., 2000. Coral reefs in turbid waters: sediment-induced stressesin corals and likely mechanisms of adaptation. Proceedings of the 9th InternationalCoral Reef Symposium. Bali, Indonesia. 1, pp. 239–244.
Anthony, K., Ridd, P., Orpin, A., Larcombe, P., Lough, J., 2004. Temporal variation of lightavailability in coastal benthic habitats: effects of clouds, turbidity, and tides. Limnol.Oceanogr. 49, 2201–2211.
Bailey-Serres, J., Voesenek, L.A.C.J., 2008. Flooding stress: acclimations and genetic diver-sity. Annu. Rev. Plant Biol. 59, 313–339.
Bainbridge, Z.T., Wolanski, E., Alvarez-Romero, J.G., Lewis, S.E., Brodie, J.E., 2012. Fine sed-iment and nutrient dynamics related to particle size and floc formation in a BurdekinRiver flood plume, Australia. Mar. Pollut. Bull. 65, 236–248.
Bak, R.P.M., 1978. Lethal and sublethal effects of dredging on reef coral. Mar. Pollut. Bull. 9,14–16.
Bak, R., Elgershuizen, J., 1976. Patterns of oil-sediment rejection in corals. Mar. Biol. 37,105–113.
Barnes, D., 1973. Growth in colonial scleractinians. Bull. Mar. Sci. 23, 280–298.Bell, J., McGrath, E., Biggerstaff, A., Bates, T., Bennett, H., Marlow, J., Shaffer, M., 2015. Sed-
iment impacts on marine sponges. Mar. Pollut. Bull. 94, 5–13.Bothner, M.H., Reynolds, R.L., Casso, M.A., Storlazzi, C.D., Field, M.E., 2006. Quantity, com-
position, and source of sediment collected in sediment traps along the fringing coralreef off Molokai, Hawaii. Mar. Pollut. Bull. 52, 1034–1047.
Brown, B., LeTissier, M., Scoffin, T., Tudhope, A., 1990. Evaluation of the environmental im-pact of dredging on intertidal coral reefs at Ko Phuket, Thailand, using ecological andphysiological parameters. Mar. Ecol. Prog. Ser. 65, 273–281.
Browne, N.K., Precht, E., Last, K.S., Todd, P.A., 2014. Photo-physiological costs associatedwith acute sediment stress events in three near-shore turbid water corals. Mar.Ecol. Prog. Ser. 502, 129–143.
Browne, N.K., Smithers, S.G., Perry, C.T., Ridd, P.V., 2012. A field-based technique for mea-suring sediment flux on coral reefs: application to turbid reefs on the Great BarrierReef. J. Coast. Res. 284, 1247–1262.
Browne, N.K., Tay, J., Todd, P.A., 2015. Recreating pulsed turbidity events to determinecoral–sediment thresholds for active management. J. Exp. Mar. Biol. Ecol. 466,98–109.
Buesseler, K.O., Antia, A.N., Chen, M., Fowler, S.W., Gardner, W.D., Gustafsson, O., Harada,K., Michaels, A.F., der Loeff, M.R., Sarin, M., 2007. An assessment of the use of sedi-ment traps for estimating upper ocean particle fluxes. J. Mar. Res. 65, 345–416.
Butman, C.A., Grant, W.D., Stolzenbach, K.D., 1986. Predictions of sediment trap biases inturbulent flows: a theoretical analysis based on observations from the literature.J. Mar. Res. 44, 601–644.
Chapman, P.M., 2002. Integrating toxicology and ecology: putting the “eco” into ecotoxi-cology. Mar. Pollut. Bull. 44, 7–15.

27R. Jones et al. / Marine Pollution Bulletin 102 (2016) 9–29
Cooper, T.F., Fabricius, K.E., 2012. Pigmentation of massive corals as a simple bioindicatorfor marine water quality. Mar. Pollut. Bull. 65, 333–341.
Davies-Colley, R., Smith, D., 2001. Turbidity, suspended sediment and water quality: a re-view. J. Am. Water Works Assoc. 37, 1085–1101.
Dennison, W.C., Orth, R.J., Moore, K.A., Stevenson, J.C., Carter, V., Kollar, S., Bergstrom,P.W., Batiuk, R.A., 1993. Assessing water quality with submersed aquatic vegetation.Bioscience 43, 86–94.
DeSalvo, M., Estrada, A., Sunagawa, S., Medina, M., 2012. Transcriptomic responses todarkness stress point to common coral bleaching mechanisms. Coral Reefs 31,215–228.
DEWHA, 2009. National Assessment Guidelines Dredging (2009). In: W. Heritage, theArts (DEWHA) (Eds.), Department of the Environment (http://www.environment.gov.au, Canberra, Australia).
Dodge, R.E., Vaisnys, J.R., 1977. Coral populations and growth patterns: responses to sed-imentation and turbidity associated with dredging. J. Mar. Res. 35, 715–730.
Dubinsky, Z., Falkowski, P., Porter, J., Muscatine, L., 1984. Absorption and utilization of ra-diant energy by light-and shade-adapted colonies of the hermatypic coral Stylophorapistillata. Proc. R. Soc. Lond. Ser. B Biol. Sci. 222, 203–214.
Duclos, P.-A., Lafite, R., Le Bot, S., Rivoalen, E., Cuvilliez, A., 2013. Dynamics of turbidplumes generated by marine aggregate dredging: an example of a macrotidal envi-ronment (the Bay of Seine, France). J. Coast. Res. 25-37.
Eggleton, J., Thomas, K.V., 2004. A review of factors affecting the release and bioavailabil-ity of contaminants during sediment disturbance events. Environ. Int. 30, 973–980.
Ellington, R., 1977. Aerobic and anaerobic degradation of glucose by the estuarine seaanemone, Diadumene leucolena. Comp. Biochem. Physiol. B: Biochem. Mol. Biol. 58,173–175.
Ellington, W., 1980. Some aspects of the metabolism of the sea-anemone Haliplanellaluciae (Verrill) during air exposure and hypoxia. 1, 255–262.
Ellington, W., 1982. Metabolic responses of the sea anemone Bunodosoma cavernata(Bosc) to declining oxygen tensions and anoxia. Physiol. Zool. 55, 240–249.
Enrıquez, S., Méndez, E.R., Iglesias-Prieto, R., 2005. Multiple scattering on coral skeletonsenhances light absorption by symbiotic algae. Limnol. Oceanogr. 50, 1025–1032.
EPA, 2011. Environmental Assessment Guidleine for Marine Dredging Programs EAG7.Environmental Protection Authority (EPA), Perth, Western Australia, p. 36.
Erftemeijer, P.L., Riegl, B., Hoeksema, B.W., Todd, P.A., 2012. Environmental impacts ofdredging and other sediment disturbances on corals: a review. Mar. Pollut. Bull. 64,1737–1765.
Fabricius, K.E., 2005. Effects of terrestrial runoff on the ecology of corals and coral reefs:review and synthesis. Mar. Pollut. Bull. 50, 125–146.
Fabricius, K.E., Wolanski, E., 2000. Rapid smothering of coral reef organisms by muddymarine snow. Estuar. Coast. Shelf Sci. 50, 115–120.
Falkenberg, L.J., Styan, C.A., 2014. Too much data is never enough: a review of the mis-match between scales of water quality data collection and reporting from recent ma-rine dredging programmes. Ecol. Indic. 45, 529–537.
Falkowski, P.G., Dubinsky, Z., 1981. Light-shade adaptations of Stylophora pistillata, a her-matypic corals from the Gulf of Eilat. Nature 289, 172–174.
Falkowski, P.G., Dubinsky, Z., Muscatine, L., Porter, J.W., 1984. Light and the bioenergeticsof a symbiotic coral. Bioscience 34, 705–709.
Ferrier-Pages, C., Witting, J., Tambutté, E., Sebens, K., 2003. Effect of natural zooplanktonfeeding on the tissue and skeletal growth of the scleractinian coral Stylophorapistillata. Coral Reefs 22, 229–240.
Field, M.E., Chezar, H., Storlazzi, C.D., 2012. SedPods: a low-cost coral proxy for measuringnet sedimentation. Coral Reefs 32, 155–159.
Fisher, R., Stark, C., Ridd, P., Jones, R., 2015. Spatial patterns in water quality changes dur-ing dredging in tropical environments. PLoS ONE (in press).
Flores, F., Hoogenboom, M.O., Smith, L.D., Cooper, T.F., Abrego, D., Negri, A.P., 2012. Chron-ic exposure of corals to fine sediments: lethal and sub-lethal impacts. PLoS One 7,e37795.
Foster, T., Corcoran, E., Erftemeijer, P., Fletcher, C., Peirs, K., Dolmans, C., Smith, A.,Yamamoto, H., Jury, M., 2010. Dredging and port construction around coral reefs.PIANC Environmental Commission, Report No 108.
Freudenthal, H., 1962. Symbiodinium gen. nov. and Symbiodinium microadriaticum sp.nov., a Zooxanthella: taxonomy, life cycle, and morphology. J. Protozool. 9, 45–52.
Fukao, T., Bailey-Serres, J., 2004. Plant responses to hypoxia— is survival a balancing act?Trends Plant Sci. 9, 449–456.
Gardner, W., 1980. Field assessment of sediment traps. J. Mar. Res. 38, 41–52.Gardner, W., Richardson, M., Hinga, K., Biscaye, P., 1983. Resuspension measured with
sediment traps in a high-energy environment. Earth Planet. Sci. Lett. 66, 262–278.Gattuso, J.-P., Allemand, D., Frankignoulle, M., 1999. Photosynthesis and calcification at
cellular, organismal and community levels in coral reefs: a review on interactionsand control by carbonate chemistry. Am. Zool. 39, 160–183.
Gleason, D.F., 1998. Sedimentation and distributions of green and brown morphs of theCaribbean coral Porites astreoides Lamarck. J. Exp. Mar. Biol. Ecol. 230, 73–89.
Goreau, T.F., 1959. The physiology of skeleton formation in corals. I. A method for measur-ing the rate of calcium deposition by corals under different conditions. Biol. Bull. Mar.Biol. Lab. Woods Hole 59–75.
Goreau, T.F., Goreau, N.I., Yonge, C., 1971. Reef corals: autotrophs or heterotrophs? Biol.Bull. Mar. Biol. Lab. Woods Hole 141, 247–260.
Halldal, P., 1968. Photosynthetic capacities and photosynthetic action spectra of endozoicalgae of the massive coral Favia. Biol. Bull. 134, 411–424.
Harris, C.A., Scott, A.P., Johnson, A.C., Panter, G.H., Sheahan, D., Roberts, M., Sumpter, J.P.,2014. Principles of sound ecotoxicology. Environ. Sci. Technol. 48, 3100–3111.
Hedge, L.H., Knott, N.A., Johnston, E.L., 2009. Dredging related metal bioaccumulation inoysters. Mar. Pollut. Bull. 58, 832–840.
Hodgson, G., 1990. Tetracycline reduces sedimentation damage to corals. Mar. Biol. 104,493–496.
Houlbrèque, F., Ferrier-Pagès, C., 2009. Heterotrophy in tropical scleractinian corals. Biol.Rev. Camb. Philos. Soc. 84, 1–17.
Hubbard, J.A., Pocock, Y.P., 1972. Sediment rejection by recent scleractinian corals: a keyto palaeo-environmental reconstruction. Geol. Rundsch. 61, 598–626.
Jerlov, N.G., 1976. Marine Optics. Elsevier.Jing, L., Ridd, P.V., 1996. Wave-current bottom shear stresses and sediment resuspension
in Cleveland Bay, Australia. Coast. Eng. 29, 169–186.Jones, R.J., 2008. Coral bleaching, bleaching-induced mortality, and the adaptive signifi-
cance of the bleaching response. Mar. Biol. 154, 65–80.Jones, R.J., 2011a. Spatial patterns of chemical contamination (metals, PAHs, PCBs, PCDDs/
PCDFS) in sediments of a non-industrialized but densely populated coral atoll/smallisland state (Bermuda). Mar. Pollut. Bull.
Jones, R., 2011b. Environmental effects of the cruise tourism boom: sediment resuspen-sion from cruise ships and the possible effects of increased turbidity and sedimentdeposition on corals (Bermuda). Bull. Mar. Sci. 87, 659–679.
Jones, R., Hoegh-Guldberg, O., 2001. Diurnal changes in the photochemical efficiency of thesymbiotic dinoflagellates (Dinophyceae) of corals: photoprotection, photoinactivationand the relationship to coral bleaching. Plant Cell Environ. 24, 89–99.
Jones, R., Fisher, R., Stark, C., Ridd, P., 2015a. Temporal patterns in water quality fromdredging in tropical environments. PLoS One 10 (10), e0137112. http://dx.doi.org/10.1371/journal.pone.0137112.
Jones, R., Ricardo, G., AP, N., 2015b. Effects of sediments on the reproductive cycle ofcorals. Mar. Pollut. Bull. 100, 13–33.
Junjie, R.K., Browne, N.K., Erftemeijer, P.L.A., Todd, P.A., 2014. Impacts of sediments oncoral energetics: partitioning the effects of turbidity and settling particles. PLoS One9, e107195.
Jürg, B., 1996. Towards a new generation of sediment traps and a better measurement/understanding of settling particle flux in lakes and oceans: a hydrodynamical proto-col. Aquat. Sci. 58, 283–296.
Kendall, J., Powell, E., Connor, S., Bright, T., 1983. The effects of drilling fluids (muds)and turbidity on the growth and metabolic state of the coral Acropora cervicornis,with comments on methods of normalization for coral data. Bull. Mar. Sci. 33,336–352.
Kirk, J.T., 1985. Effects of Suspensoids (Turbidity) on Penetration of Solar Radiation inAquatic Ecosystems, Perspectives in Southern Hemisphere Limnology. Springer,208, p. 195.
Kirk, J., 1994. Light and Photosynthesis in Aquatic Ecosystems. Third Edition. Third edi-tion. Cambridge University Press, New York.
Koskela, R.W., Ringeltaube, P., Small, A.R., Koskela, T.V., Fraser, A.R., Lee, J.D., Marshall, P.,2002. Using predictive monitoring to mitigate construction impacts in sensitive ma-rine environments. 10th Pacific Congress onMarine Science and Technology (PACON2002) July 21–26, 2002, Chiba, Japan.
Kozerski, H.-P., 1994. Possibilities and limitations of sediment traps to measure sedimen-tation and resuspension. Hydrobiologia 284, 93–100.
Kuhl, M., Cohen, Y., Dalsgaard, T., Jorgensen, B.B., Revsbech, N.P., 1995. Microenvironmentand photosynthesis of zooxanthellae in scleractinian corals studied withmicrosensors for O2, pH and light. Mar. Ecol. Prog. Ser. 117, 159–172.
LaBarbera, M., 1984. Feeding currents and particle capture mechanisms in suspensionfeeding animals. Am. Zool. 24, 71–84.
Larcombe, P., Woolfe, K., 1999. Increased sediment supply to the Great Barrier Reefwill not increase sediment accumulation at most coral reefs. Coral Reefs 18,163–169.
Larcombe, P., Costen, A., Woolfe, K.J., 2001. The hydrodynamic and sedimentary setting ofnearshore coral reefs, central Great Barrier Reef shelf, Australia: Paluma Shoals, a casestudy. Sedimentology 48, 811–835.
Larcombe, P., Ridd, P., Prytz, A., Wilson, B., 1995. Factors controlling suspended sedimenton inner-shelf coral reefs, Townsville, Australia. Coral Reefs 14, 163–171.
Lasker, H.R., 1980. Sediment rejection by reef corals: the roles of behavior andmorphology in Montastrea cavernosa (Linnaeus). J. Exp. Mar. Biol. Ecol. 47,77–87.
Lawrence, D., Dagg, M.J., Liu, H., Cummings, S.R., Ortner, P.B., Kelble, C., 2004. Wind eventsand benthic-pelagic coupling in a shallow subtropical bay in Florida. Mar. Ecol. Prog.Ser. 266, 1–13.
Lesser, M.P., 2004. Experimental biology of coral reef ecosystems. J. Exp. Mar. Biol. Ecol.300, 217–252.
Levy, O., Dubinsky, Z., Achituv, Y., 2003. Photobehavior of stony corals: responses to lightspectra and intensity. J. Exp. Biol. 206, 4041–4049.
Lewis, J.B., 1976. Experimental tests of suspension feeding in Atlantic reef corals. Mar. Biol.36, 147–150.
Lewis, J., Price, W., 1975. Feeding mechanisms and feeding strategies of Atlantic reefcorals. J. Zool. 176, 527–544.
Lewis, J., Price, W., 1976. Patterns of ciliary currents in Atlantic reef corals and their func-tional significance. J. Zool. 178, 77–89.
Lirman, D., Herlan, J., Langdon, C., Capo, T., 2008. To nutrient-enriched sediments miti-gates the negative impacts of sedimentation on coral growth in the Caribbean coralsPorites astreoides and Siderastrea siderea. Proceedings of the 11th International CoralReef Symposium. Fort Lauderdale, Florida. US, pp. 900–904.
Logan, A., 1988. Sediment-shifting capability in the recent solitary coral Scolymia cubensis(Milne-Edwards and Haime) from Bermuda. Bull. Mar. Sci. 43, 241–248.
Logan, A., Yang, L., Tomascik, T., 1994. Linear skeletal extension rates in two species ofDiploria from high-latitude reefs in Bermuda. Coral Reefs 13, 225–230.
Loiola, M., Oliveira, M.D.M., Kikuchi, R.K.P., 2013. Tolerance of Brazilian brain coralMussismilia braziliensis to sediment and organic matter inputs. Mar. Pollut. Bull. 77,55–62.
Lopez, G.R., Levinton, J.S., 1987. Ecology of deposit-feeding animals in marine sediments.Q. Rev. Biol. 235–260.

28 R. Jones et al. / Marine Pollution Bulletin 102 (2016) 9–29
Loya, Y., 1976. Effects of water turbidity and sedimentation on the community structureof Puerto Rican corals. Bull. Mar. Sci. 26, 450–466.
Lui, G.C., Setiawan, W., Todd, P., Erftemeijer, P.L., 2012. Among genotype variation for sed-iment rejection in the reef building coral Diploastrea heliopora (Lamark, 1816). RafflesBull. Zool. 60, 525–531.
Madden, R.A., Julian, P.R., 1994. Observations of the 40–50-day tropical oscillation— a re-view. Mon. Weather Rev. 122, 814–837.
Mapstone, B.D., Choat, J., Cumming, R., Oxley, W., 1992. The fringing reefs of MagneticIsland: benthic biota and sedimentation-a baseline study: a report to the Great Barri-er Reef Marine Park Authority. Research report No.13. Great Barrier Reef Marine ParkAuthority, Townsville, Australia.
Marcelino, L.A., Westneat, M.W., Stoyneva, V., Henss, J., Rogers, J.D., Radosevich, A.,Turzhitsky, V., Siple, M., Fang, A., Swain, T.D., Fung, J., Backman, V., 2013. Modulationof light-enhancement to symbiotic algae by light-scattering in corals and evolution-ary trends in bleaching. PLoS One 8, e61492.
Marshall, N., 1965. Detritus over the reef and its potential contribution to adjacent watersof Eniwetok Atoll. Ecology 46, 343–344.
Marshall, S.M., Orr, A.P., 1931. Sedimentation on Low Isles Reef and its relation to coralgrowth. Brit. Mus. (Nat. Hist.).
Mass, T., Kline, D.I., Roopin, M., Veal, C.J., Cohen, S., Iluz, D., Levy, O., 2010. The spectralquality of light is a key driver of photosynthesis and photoadaptation in Stylophorapistillata colonies from different depths in the Red Sea. J. Exp. Biol. 213, 4084–4091.
Masselink, G., Hughes, M., Knight, J., 2014. Introduction to Coastal Processes and Geomor-phology. Routledge.
McAnally, W.H., Mehta, A.J., 2001. Coastal and Estuarine Fine Sediment Processes. ElsevierScience.
McClanahan, T., Obura, D., 1997. Sedimentation effects on shallow coral communities inKenya. J. Exp. Mar. Biol. Ecol. 209, 103–122.
Meyer, J.L., Schultz, E.T., 1985. Tissue condition and growth rate of corals associated withschooling fish. Limnol. Oceanogr. 30, 157–166.
Mills, M., Sebens, K., 1997. Particle ingestion efficiency of the corals Siderastrea siderea andAgaricia agaricites: effects of flow speed and sediment loads. Proceedings of the 8thInternational Coral Reef Symposium. Panama 2, 1059–1064.
Mills, M.M., Sebens, K.P., 2004. Ingestion and assimilation of nitrogen from benthic sedi-ments by three species of coral. Mar. Biol. 145, 1097–1106.
Mills, M.M., Lipschultz, F., Sebens, K.P., 2004. Particulate matter ingestion and associatednitrogen uptake by four species of scleractinian corals. Coral Reefs 23, 311–323.
Morel, A., 1978. Available, usable, and stored radiant energy in relation to marine photo-synthesis. Deep-Sea Res. 25, 673–688.
Morgan, B., Rate, A.W., Burton, E.D., 2012. Water chemistry and nutrient release duringthe resuspension of FeS-rich sediments in a eutrophic estuarine system. Sci. Total En-viron. 432, 47–56.
Muscatine, L., 1990. The role of symbiotic algae in carbon and energy flux in reef corals.Ecosyst. World 25, 75–87.
Muscatine, L., Porter, J.W., 1977. Reef corals: mutualistic symbioses adapted to nutrient-poor environments. Bioscience 27, 454–460.
Muscatine, L., Ferrier-Pagès, C., Blackburn, A., Gates, R.D., Baghdasarian, G., Allemand, D.,1998. Cell-specific density of symbiotic dinoflagellates in tropical anthozoans. CoralReefs 17, 329–337.
Norton, S.B., Cormier, S.M., Suter II, G.W., Schofield, K., Yuan, L., Shaw-Allen, P., Ziegler,C.R., 2009. CADDIS: The Causal Analysis/diagnosis Decision Information System, Deci-sion Support Systems for Risk-based Management of Contaminated Sites. Springer,pp. 1–24.
Ogston, A.S., Field, M.E., 2010. Predictions of turbidity due to enhanced sediment resus-pension resulting from sea-level rise on a fringing coral reef: evidence from Molokai,Hawaii. J. Coast. Res. 26, 1027–1037.
Ogston, A.S., Storlazzi, C.D., Field, M.E., Presto, M.K., 2004. Sediment resuspension andtransport patterns on a fringing reef flat, Molokai, Hawaii. Coral Reefs 23, 559–569.
Orpin, A.R., Ridd, P.V., 2012. Exposure of inshore corals to suspended sediments due towave-resuspension and river plumes in the central Great Barrier Reef: a reappraisal.Cont. Shelf Res. 47, 55–67.
Orpin, A., Ridd, P., Thomas, S., Anthony, K., Marshall, P., Oliver, J., 2004. Natural turbidityvariability andweather forecasts in risk management of anthropogenic sediment dis-charge near sensitive environments. Mar. Pollut. Bull. 49, 602–612.
Perkey, D.W., Wadman, H.M., 2013. Laboratory Feasibility Study Concerning the Use ofthe SediMeter™ to Detect Fine-scale (≤1 mm) Sedimentation Resulting From Dredg-ing Operations. DOER Technical Notes Collection. ERDC TN-DOER-T11. US Army Engi-neer Research and Development Center, Vicksburg, MS (http://el.erdc.usace.army.mil/dots/doer/).
Perry, C., Taylor, K., 2009. Environmental Sedimentology. John Wiley & Sons.Peters, E.C., Pilson, M.E., 1985. A comparative study of the effects of sedimentation on
symbiotic and asymbiotic colonies of the coral Astrangia danae Milne Edwards andHaime 1849. J. Exp. Mar. Biol. Ecol. 92, 215–230.
Philipp, E., Fabricius, K., 2003. Photophysiological stress in scleractinian corals in responseto short-term sedimentation. J. Exp. Mar. Biol. Ecol. 287, 57–78.
Piniak, G.A., 2007. Effects of two sediment types on the fluorescence yield of two Hawai-ian scleractinian corals. Mar. Environ. Res. 64, 456–468.
R Core Team, 2014. R: A language and environment for statistical computing. R Founda-tion for Statistical Computing, Vienna, Austria (URL http://www.R-project.org/).
Reef, R., Kaniewska, P., Hoegh-Guldberg, O., 2009. Coral skeletons defend against ultravi-olet radiation. PLoS One 4, e7995.
Reynolds, C.S., Wiseman, S.W., Gardner, W., 1980. An annotated bibliography of aquaticsediment traps and trapping methods. Freshwater Biological Association. OccasionalPublication No.11 (54 pp.).
Rice, S., Hunter, C., 1992. Effects of suspended sediment and burial on scleractinian coralsfrom west central Florida patch reefs. Bull. Mar. Sci. 51, 429–442.
Riegl, B., 1995. Effects of sand deposition on scleractinian and alcyonacean corals. Mar.Biol. 121, 517–526.
Riegl, B., Branch, G., 1995. Effects of sediment on the energy budgets of four scleractinian(Bourne 1900) and five alcyonacean (Lamouroux 1816) corals. J. Exp. Mar. Biol. Ecol.186, 259–275.
van Rijn, L.C., 2007. Unified view of sediment transport by currents andwaves. I: initiationof motion, bed roughness, and bed-load transport. J. Hydraul. Eng. 133, 649–667.
Risk, M.J., Edinger, E., 2011. Impacts of sediment on coral reefs. In: Hopley, D. (Ed.), Ency-clopedia of Modern Coral Reefs. Springer, Netherlands, pp. 575–586.
Rogers, C.S., 1979. The effect of shading on coral reef structure and function. J. Exp. Mar.Biol. Ecol. 41, 269–288.
Rogers, C.S., 1990. Responses of coral reefs and reef organisms to sedimentation. Mar.Ecol. Prog. Ser. 62, 185–202.
Rosenfeld, M., Bresler, V., Abelson, A., 1999. Sediment as a possible source of food forcorals. Ecol. Lett. 2, 345–348.
Roth, M.S., 2014. The engine of the reef: photobiology of the coral–algal symbiosis. Front.Microbiol. 5, 1–22.
Roth, E., Jeon, K., Stacey, G., 1988. Homology in endosymbiotic systems: the term‘symbiosome’. In: Palacios, R., Verma, D.P.S. (Eds.), Molecular Genetics of Plant–Microbe Interactions. St. Paul, MN, pp. 220–225.
Rubenstein, D.I., Koehl, M., 1977. The mechanisms of filter feeding: some theoretical con-siderations. Am. Nat. 111, 981–994.
Schuhmacher, H., 1974. On the conditions accompanying the first settlement of corals onartificial reefs with special reference to the influence of grazing sea urchins (Eilat, RedSea). Proceedings of the 2nd International Coral Reef Symposium, Brisbane, Australia.1, pp. 257–267.
Schuhmacher, H., 1977. Ability of fungiid corals to overcome sedimentation. Proceedingsof the 3rd International Coral Reef Symposium, Miami, US, pp. 503–510.
Sebens, K., Grace, S., Helmuth, B., Maney Jr., E., Miles, J., 1998.Water flow and prey captureby three scleractinian corals, Madracis mirabilis, Montastrea cavernosa and Poritesporites, in a field enclosure. Mar. Biol. 131, 347–360.
Sebens, K., Vandersall, K., Savina, L., Graham, K., 1996. Zooplankton capture by twoscleractinian corals, Madracis mirabilis and Montastrea cavernosa, in a field enclosure.Mar. Biol. 127, 303–317.
Shapiro, O.H., Fernandez, V.I., Garren, M., Guasto, J.S., Debaillon-Vesque, F.P., Kramarsky-Winter, E., Vardi, A., Stocker, R., 2014. Vortical ciliary flows actively enhance masstransport in reef corals. Proc. Natl. Acad. Sci. 111, 13391–13396.
Shashar, N., Kinane, S., Jokiel, P.L., Patterson, M.R., 1996. Hydromechanical boundarylayers over a coral reef. J. Exp. Mar. Biol. Ecol. 199, 17–28.
Shick, J.M., 1991. Energymetabolism and respiratory gas exchange, a functional biology ofsea anemones. Springer, pp. 119–173.
Shimeta, J., Koehl, M.A.R., 1997. Mechanisms of particle selection by tentaculate suspen-sion feeders during encounter, retention, and handling. J. Exp. Mar. Biol. Ecol. 209,47–73.
Sofonia, J., Anthony, K., 2008. High-sediment tolerance in the reef coral Turbinariamesenterina from the inner Great Barrier Reef lagoon (Australia). Estuar. Coast.Shelf Sci. 78, 748–752.
Spearman, J., 2015. A review of the physical impacts of sediment dispersion from aggre-gate dredging. Mar. Pollut. Bull. 94, 260–277.
Spearman, J., Bray, R., Land, J., Burt, T., Mead, C., Scott, D., 2007. Plume dispersion model-ling using dynamic representation of trailer dredger source terms. Proc. Mar. Sci. 8,417–448.
Stafford-Smith, M.G., 1993. Sediment-rejection efficiency of 22 species of Australianscleractinian corals. Mar. Biol. 115, 229–243.
Stafford-Smith, M., Ormond, R., 1992. Sediment-rejection mechanisms of 42 species ofAustralian scleractinian corals. Mar. Freshw. Res. 43, 683–705.
Stat, M., Baker, A.C., Bourne, D.G., Correa, A.M.S., Forsman, Z., Huggett, M.J., Pochon, X.,Skillings, D., Toonen, R.J., van Oppen, M.J.H., Gates, R.D., 2012. Chapter one — molec-ular delineation of species in the coral holobiont. In: Michael, L. (Ed.)Adv. Mar.Biol.Academic Press, pp. 1–65
Storlazzi, C.D., Jaffe, B.E., 2008. The relative contribution of processes driving variability inflow, shear, and turbidity over a fringing coral reef: West Maui, Hawaii. Estuar. Coast.Shelf Sci. 77, 549–564.
Storlazzi, C.D., Field, M.E., Bothner, M.H., 2011. The use (and misuse) of sediment traps incoral reef environments: theory, observations, and suggested protocols. Coral Reefs30, 23–38.
Storlazzi, C.D., Field, M.E., Bothner, M.H., Presto, M.K., Draut, A.E., 2009. Sedimentationprocesses in a coral reef embayment: Hanalei Bay, Kauai. Mar. Geol. 264, 140–151.
Storlazzi, C., Norris, B., Rosenberger, K., 2015. The influence of grain size, grain color, andsuspended-sediment concentration on light attenuation: why fine-grained terrestrialsediment is bad for coral reef ecosystems. Coral Reefs 1-9.
Storlazzi, C.D., Ogston, A.S., Bothner, M.H., Field, M.E., Presto, M.K., 2004. Wave- andtidally-driven flow and sediment flux across a fringing coral reef: Southern Molokai,Hawaii. Cont. Shelf Res. 24, 1397–1419.
Su, S., Pearlman, L., Rothrock, J., Iannuzzi, T., Finley, B., 2002. Potential long-term ecologi-cal impacts caused by disturbance of contaminated sediments: a case study. Environ.Manag. 29, 234–249.
Szabó, M., Wangpraseurt, D., Tamburic, B., Larkum, A.W.D., Schreiber, U., Suggett, D.J.,Kühl, M., Ralph, P.J., 2014. Effective light absorption and absolute electron transportrates in the coral Pocillopora damicornis. Plant Physiol. Biochem. 83, 159–167.
Szmant-Froelich, A., Johnson, V., Hoehn, T., Battey, J., Smith, G., Fleischmann, E., Porter, J.,Dallmeyer, D., 1981. The physiological effects of oil drilling muds on the Caribbeancoral Montastrea annularis. Proceedings of the 4th International Coral Reef Sympo-sium, Manila, Philippines, pp. 163–168.
Telesnicki, G.J., Goldberg, W.M., 1995. Effects of turbidity on the photosynthesis and res-piration of two South Florida reef coral species. Bull. Mar. Sci. 57, 527–539.

29R. Jones et al. / Marine Pollution Bulletin 102 (2016) 9–29
Thomas, S., Ridd, P.V., 2004. Review of methods to measure short time scale sediment ac-cumulation. Mar. Geol. 207, 95–114.
Thomas, S., Ridd, P., 2005. Field assessment of innovative sensor for monitoring of sedi-ment accumulation at inshore coral reefs. Mar. Pollut. Bull. 51, 470–480.
Thomas, S., Ridd, P.V., Renagi, O., 2003. Laboratory investigation on the effect of particlesize, water flow and bottom surface roughness upon the response of an upward-pointing optical backscatter sensor to sediment accumulation. Cont. Shelf Res. 23,1545–1557.
Thompson, J.H., 1980. Responses of Selected Scleractinian Corals to Drilling Fluids Used inthe Marine Environment (PhD Dissertation) Texas A & M University, College Station.
Thompson, J.H., Shinn, E.A., Bright, T.J., 1980. Effects of drilling mud on seven species ofreef-building corals as measured in the field and laboratory. Elsevier Oceanogr. Ser.27, 433–453.
Todd, P.A., Sidle, R.C., Lewin-Koh, N.J.I., 2004. An aquarium experiment for identifying thephysical factors inducing morphological change in two massive scleractinian corals.J. Exp. Mar. Biol. Ecol. 299, 97–113.
Tomascik, T., Sander, F., 1985. Effects of eutrophication on reef-building corals. I. Growthrate of the reef-building coral Montastrea annularis. Mar. Biol. 87, 143–155.
Tuszynski, J., 2013. caTools: Tools: moving window statistics, GIF, Base64, ROC AUC, etc. Rpackage version 1.16. (http://CRAN.R-project.org/package=caTools).
Tyler, J., 1966. Report on the second meeting of the joint group of experts on photosyn-thetic radiant energy. UNESCO Tech. Pap. Mar. Sci. 2, 1–11.
USEPA, 2004. In: Assessment, N.C.f.E. (Ed.), Development plan for the causal/diagnosis de-cision information system. USEPA, Washington, DC.
Van Lancker, V., Baeye, M., 2015. Wave glider monitoring of sediment transport anddredge plumes in a shallow marine sandbank environment. PLoS One 10, e0128948.
Van Rijn, L.C., van Rijn, L.C., van Rijn, L.C., 1990. Principles of Fluid Flow and SurfaceWavesin Rivers, Estuaries, Seas and Oceans. Aqua Publications Amsterdam, The Netherlands.
Vaughan, T.W., 1916. The results of investigations of the ecology of the Floridian andBahaman Shoal-Water Corals. Proc. Natl. Acad. Sci. U. S. A. 2, 95–100.
VBKO, 2003. Protocol for the field measurementof sediment release from dredgers. Apractical guide to measuring sediment release from dredging plant for calibrationand verification of numerical models. HR Wallingford Ltd & Dredging Research Ltd.Reporrt produced for VBKO TASS project by. (83 pp.).
Verspecht, F., Pattiaratchi, C., 2010. On the significance of wind event frequency for partic-ulate resuspension and light attenuation in coastal waters. Cont. Shelf Res. 30,1971–1982.
Wakefield, T., Kempf, S., 2001. Development of host- and symbiont-specific monoclonalantibodies and confirmation of the origin of the symbiosome membrane in a Cnidar-ian–diniflagellate symbiosis. Biol. Bull. Mar. Biol. Lab. Woods Hole 200, 127–143.
Wangpraseurt, D., Larkum, A.W., Ralph, P.J., Kühl, M., 2012. Light gradients and opticalmicroniches in coral tissues. Front. Microbiol. 3.
Wangpraseurt, D., Tamburic, B., Szabó, M., Suggett, D., Ralph, P.J., Kühl, M., 2014. Spectraleffects on Symbiodinium photobiology studied with a programmable light engine.PLoS One 9, e112809.
Weber, M., de Beer, D., Lott, C., Polerecky, L., Kohls, K., Abed, R.M., Ferdelman, T.G.,Fabricius, K.E., 2012. Mechanisms of damage to corals exposed to sedimentation.Proc. Natl. Acad. Sci. U. S. A. 109, E1558–E1567.
Weber, M., Lott, C., Fabricius, K.E., 2006. Sedimentation stress in a scleractinian coral ex-posed to terrestrial andmarine sedimentswith contrasting physical, organic and geo-chemical properties. J. Exp. Mar. Biol. Ecol. 336, 18–32.
Wijgerde, T., Henkemans, P., Osinga, R., 2012. Effects of irradiance and light spectrum ongrowth of the scleractinian coral Galaxea fascicularis — applicability of LEP and LEDlighting to coral aquaculture. Aquaculture 344, 188–193.
Wild, C., Huettel, M., Klueter, A., Kremb, S.G., Rasheed, M.Y., Jørgensen, B.B., 2004. Coralmucus functions as an energy carrier and particle trap in the reef ecosystem. Nature428, 66–70.
Wooldridge, S., 2013. A new conceptual model of coral biomineralisation: hypoxia as thephysiological driver of skeletal extension. Biogeosciences 10, 2867–2884.
Wright, W., 1997. Tropical–extratropical cloudbands and Australian rainfall: I. Climatol.Int. J. Climatol. 17, 807–829.
Yeh, N., Yeh, P., Shih, N., Byadgi, O., Chih Cheng, T., 2014. Applications of light-emitting di-odes in researches conducted in aquatic environment. Renew. Sust. Energ. Rev. 32,611–618.
Yonge, C., 1930. Great Barrier Reef Expedition 1928–29, Scientific Reports. British Muse-um (Natural History), London (UK), pp. 13–57.
Yonge, C.M., Nicholls, A., 1931. Studies on the physiology of corals. V. The Effects of Star-vation in Light and in Darkness on the Relationship Between Corals andZooxanthellaeGreat Barrier Reef Expedition 1928–29, Scientific Reports. British Mu-seum (Natural History), London (UK), pp. 13–57 (British Museum 1).
Zeileis, A., Grothendieck, G., 2005. Zoo: S3 infrastructure for regular and irregular time se-ries. J. Stat. Softw. 14, 1–27.