assessing the greenhouse impact of natural gas - earth and
TRANSCRIPT

1
Assessing the greenhouse impact of 1
natural gas 2
L.M.Cathles,June6,20123
Abstract 4
Theglobalwarmingimpactofsubstitutingnaturalgasforcoalandoiliscurrentlyin5debate.Weaddressthisquestionherebycomparingthereductionofgreenhousewarming6thatwouldresultfromsubstitutinggasforcoalandsomeoiltothereductionwhichcould7beachievedbyinsteadsubstitutingzerocarbonenergysources.Weshowthatsubstitution8ofnaturalgasreducesglobalwarmingby40%ofthatwhichcouldbeattainedbythe9substitutionofzerocarbonenergysources.Atmethaneleakageratesthatare~1%of10production,whichissimilartotoday’sprobableleakagerateof~1.5%ofproduction,the1140%benefitisrealizedasgassubstitutionoccurs.Forshorttransitionstheleakagerate12mustbemorethan10to15%ofproductionforgassubstitutionnottoreducewarming,13andforlongertransitionstheleakagemustbemuchgreater.Buteveniftheleakagewasso14highthatthesubstitutionwasnotofimmediatebenefit,the40%‐of‐zero‐carbonbenefit15wouldberealizedshortlyaftermethaneemissionsceasedbecausemethaneisremoved16quicklyformtheatmospherewhereasCO2isnot.Thebenefitsofsubstitutionare17unaffectedbyheatexchangetotheocean.CO2emissionsarethekeytoanthropogenic18climatechange,andsubstitutinggasreducesthemby40%ofthatpossiblebyconversionto19zerocarbonenergysources.Gassubstitutionalsoreducestherateatwhichzerocarbon20energysourcesmustbeeventuallyintroduced.21
Introduction 22
Inarecentcontroversialpaper,Howarthetal.(2011)suggestedthat,becausemethaneisa23
farmorepotentgreenhousegasthancarbondioxide,theleakageofnaturalgasmakesits24
greenhouseforcingasbadandpossiblytwiceasbadascoal,andtheyconcludedthatthis25
underminesthepotentialbenefitofnaturalgasasatransitionfueltolowcarbonenergy26
sources.Others(Hayhoeetal.,2009;Wigley,2011)havepointedoutthatthewarming27
causedbyreducedSO2emissionsascoalelectricalfacilitiesareretiredwillcompromise28
someofthebenefitsoftheCO2reduction.Wigley(2011)hassuggestedthatbecausethe29
impactofgassubstitutionforcoalonglobaltemperaturesissmallandtherewouldbe30
2
somewarmingasSO2emissionsarereduced,thedecisionoffueluseshouldbebasedon31
resourceavailabilityandeconomics,notgreenhousegasconsiderations.32
Someofthesesuggestionshavebeenchallenged.ForexampleCathlesetal.(2012)have33
takenissuewithHowarthetal.forcomparinggasandcoalintermsoftheheatcontentof34
thefuelsratherthantheirelectricitygeneratingcapacity(coalisusedonlytogenerate35
electricity),forexaggeratingthemethaneleakagebyafactorof3.6,andforusingan36
inappropriatelyshort(20year)globalwarmingpotentialfactor(GWP).Neverthelessit37
remainsdifficulttoseeinthepublishedliteraturepreciselywhatbenefitmightberealized38
bysubstitutinggasforcoalandtheuseofmetricssuchasGWPfactorsseemstocomplicate39
ratherthansimplifytheanalysis.Thispaperseekstoremedythesedeficienciesby40
comparingthebenefitsofnaturalgassubstitutiontothoseofimmediatelysubstituting41
low‐carbonenergysources.Thecomparativeanalysisgoesbacktothefundamental42
equationanddoesnotusesimplifiedGWPmetrics.Becauseitisanullanalysisitavoids43
thecomplicationsofSO2,carbonblack,andthecomplexitiesofCO2removalfromthe44
atmosphere.Itshowsthatthesubstitutionofnaturalgasforcoalandsomeoilwould45
realize~40%ofthegreenhousebenefitsthatcouldbehadbyreplacingfossilfuelswith46
lowcarbonenergysourcessuchaswind,solar,andnuclear.Inthelongtermthisgas47
substitutionbenefitdoesnotdependonthespeedofthetransitionorthemethaneleakage48
rate.Ifthetransitionisfaster,greenhousewarmingisless.Iftheleakageisless,the49
reductionofwarmingduringthesubstitutionperiodisgreater,butregardlessoftherateof50
leakageorthespeedofsubstitution,naturalgasachieves~40%ofthebenefitsoflow51
carbonenergysubstitutionafewdecadesaftermethaneemissionsassociatedwithgas52
productioncease.Thebenefitofnaturalgassubstitutionisadirectresultofthedecrease53
inCO2emissionsitcauses.54
ThecalculationmethodsusedherefollowWigley(2011),butarecomputedusing55
programsofourowndesignfromtheequationsandparametersgivenbelow.Parameters56
aredefinedthatconvertscenariosfortheyearlyconsumptionofthefossilfuelstothe57
yearlyproductionofCO2andCH4.Thesegreenhousegasesarethenintroducedintothe58
atmosphereandremovedusingacceptedequations.Radiativeforcingsarecalculatedfor59
thevolumetricgasconcentrationsastheyincrease,theequilibriumglobaltemperature60
3
changeiscomputedbymultiplyingthesumoftheseforcingsbytheequilibriumsensitivity61
factorcurrentlyfavoredbytheIPCC,andtheincrementsofequilibriumtemperature62
changeareconvertedtotransienttemperaturechangesusingatwolayeroceanthermal63
mixingmodel.64
Emission Scenarios 65
GreenhousewarmingisdrivenbytheincreaseintheatmosphericlevelsofCO2,CH4and66
othergreehousegasesthatresultfromtheburningoffossilfuels.Between1970and2002,67
worldenergyconsumptionfromallsources(coal,gas,oil,nuclear,hydroandrenewables)68
increasedattherateof2.1%peryear.Intheyear2005sixandahalfbillionpeople69
consumed~440EJ(EJ=exajoules=1018joules,1joule=1.055Btu;EIA,2011)ofenergy.70
Oilandgassupplied110EJeach,coal165EJ,andothersources(hydro,nuclear,and71
renewablessuchawindandsolar)55EJ(MiniCAMscenario,Clark,2007).In2100the72
worldpopulationisprojectedtoplateauat~10.5billion.Iftheperpersonconsumption73
thenisattoday’sEuropeanaverageof~7kWp‐1,globalenergyconsumptionin210074
wouldbe2300EJperyear(74TW).Westartwiththefuelconsumptionpatternat200575
ADandgrowitexponentiallysothatitreaches2300EJperyearattheendofa“transition”76
period.Attheendofthetransitiontheenergyissuppliedalmostentirelybylowcarbon77
sourcesinallcases,butinthefirsthalfofthetransition,whichwecallthegrowthperiod,78
hydrocarbonconsumptioneitherincreasesonthecurrenttrajectory(the“business‐as‐79
usual”scenario),increasesatthesameequivalentratewithgassubstitutedforcoalandoil80
(a“substitute‐gasscenario),ordeclinesimmediately(thelow‐carbon‐fastscenario).Coal81
useisphasedoutatexactlythesamerateinthesubstitute‐gasandlow‐carbon‐fast82
scenarios,sothatthereductionofSO2andcarbonblackemissionsisexactlythesamein83
thesetwoscenariosandthereforisnotafactorwhenwecomparethereductionin84
greenhousewarmingforthesubstitute‐gasandthelow‐carbon‐fastscenarios.85
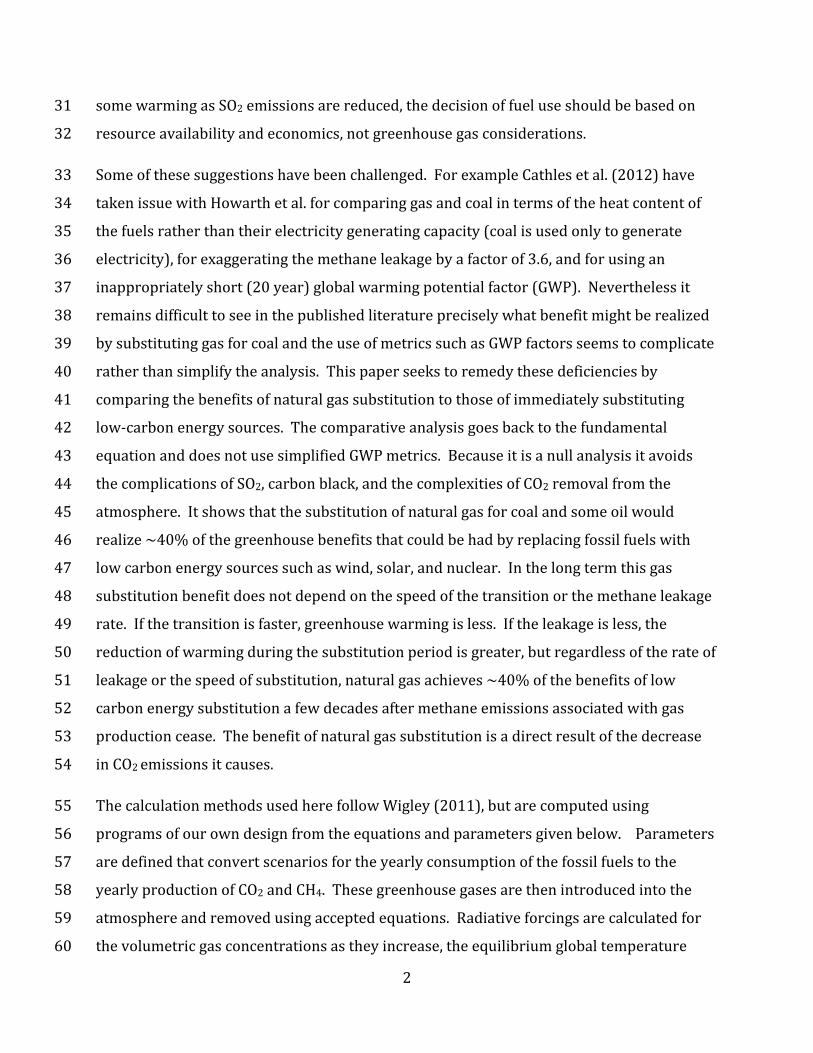
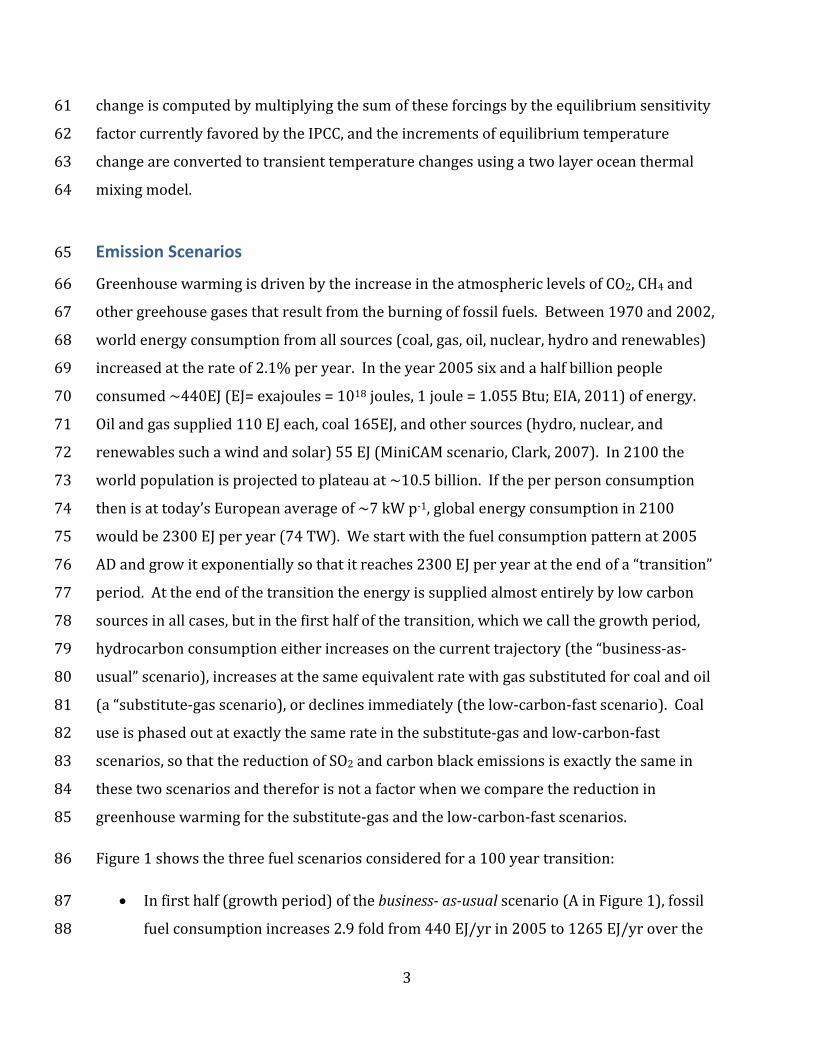
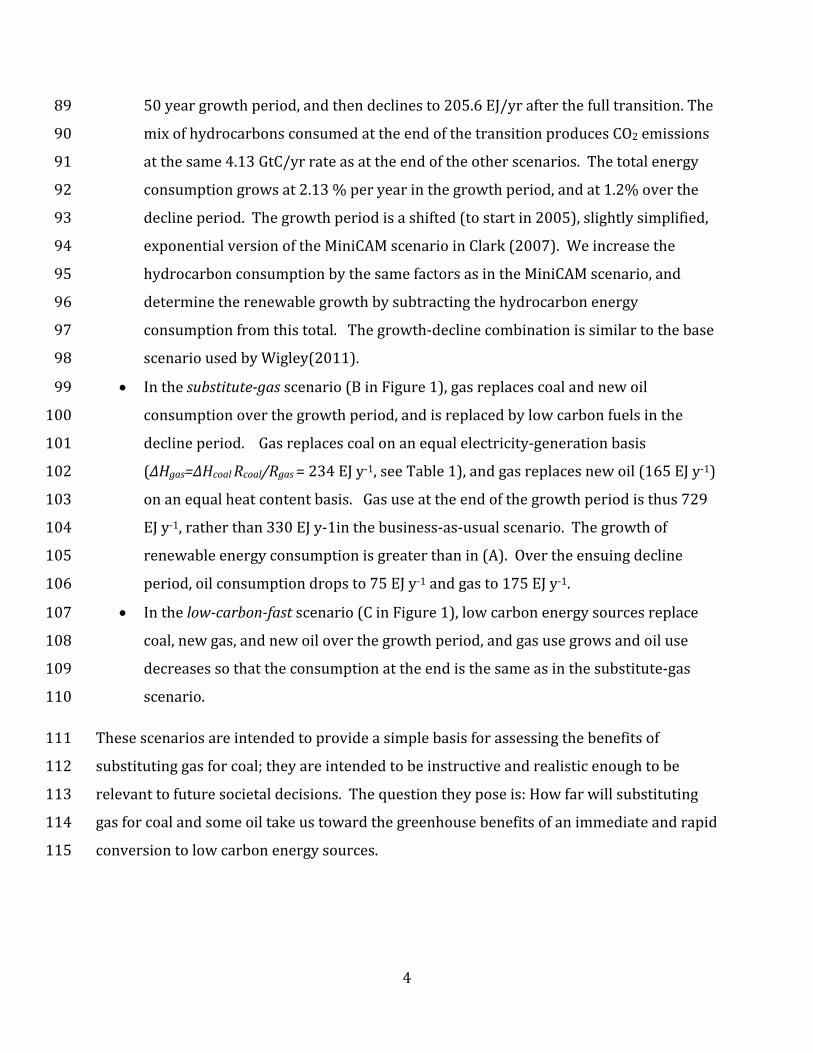
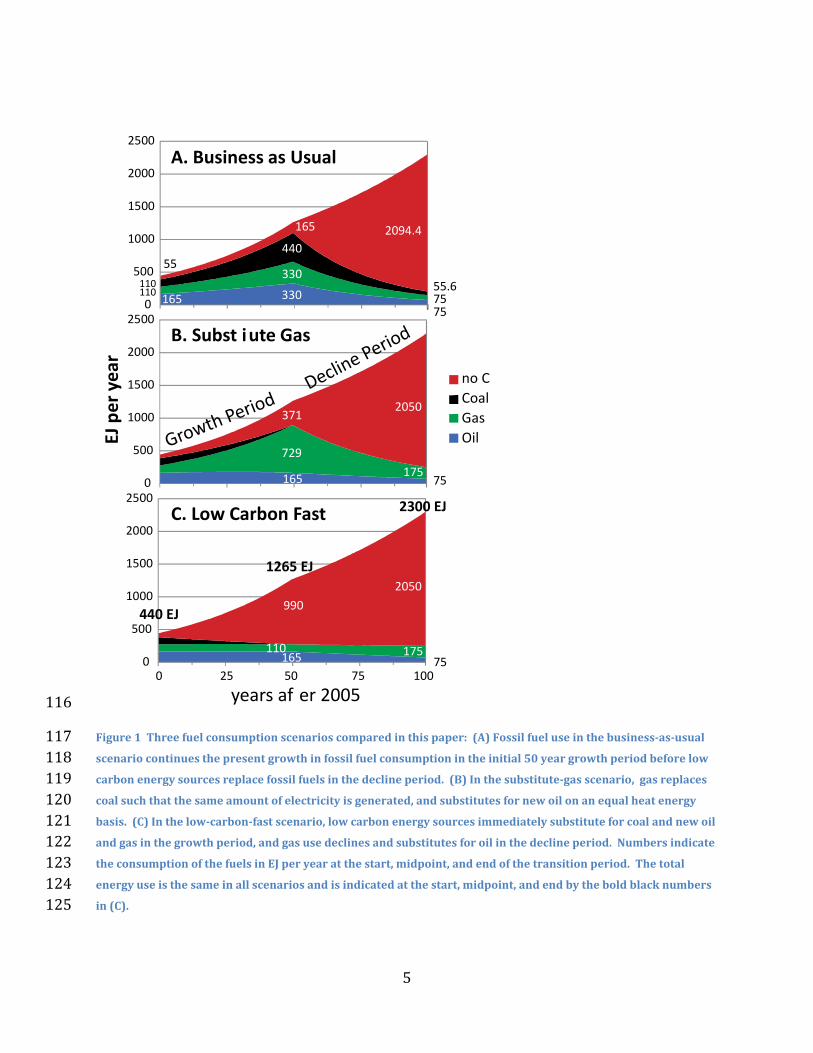
Figure1showsthethreefuelscenariosconsideredfora100yeartransition:86
Infirsthalf(growthperiod)ofthebusiness‐as‐usualscenario(AinFigure1),fossil87
fuelconsumptionincreases2.9foldfrom440EJ/yrin2005to1265EJ/yroverthe88
4
50yeargrowthperiod,andthendeclinesto205.6EJ/yrafterthefulltransition.The89
mixofhydrocarbonsconsumedattheendofthetransitionproducesCO2emissions90
atthesame4.13GtC/yrrateasattheendoftheotherscenarios.Thetotalenergy91
consumptiongrowsat2.13%peryearinthegrowthperiod,andat1.2%overthe92
declineperiod.Thegrowthperiodisashifted(tostartin2005),slightlysimplified,93
exponentialversionoftheMiniCAMscenarioinClark(2007).Weincreasethe94
hydrocarbonconsumptionbythesamefactorsasintheMiniCAMscenario,and95
determinetherenewablegrowthbysubtractingthehydrocarbonenergy96
consumptionfromthistotal.Thegrowth‐declinecombinationissimilartothebase97
scenariousedbyWigley(2011).98
Inthesubstitute‐gasscenario(BinFigure1),gasreplacescoalandnewoil99
consumptionoverthegrowthperiod,andisreplacedbylowcarbonfuelsinthe100
declineperiod.Gasreplacescoalonanequalelectricity‐generationbasis101
(∆Hgas=∆HcoalRcoal/Rgas=234EJy‐1,seeTable1),andgasreplacesnewoil(165EJy‐1)102
onanequalheatcontentbasis.Gasuseattheendofthegrowthperiodisthus729103
EJy‐1,ratherthan330EJy‐1inthebusiness‐as‐usualscenario.Thegrowthof104
renewableenergyconsumptionisgreaterthanin(A).Overtheensuingdecline105
period,oilconsumptiondropsto75EJy‐1andgasto175EJy‐1.106
Inthelow‐carbon‐fastscenario(CinFigure1),lowcarbonenergysourcesreplace107
coal,newgas,andnewoiloverthegrowthperiod,andgasusegrowsandoiluse108
decreasessothattheconsumptionattheendisthesameasinthesubstitute‐gas109
scenario.110
Thesescenariosareintendedtoprovideasimplebasisforassessingthebenefitsof111
substitutinggasforcoal;theyareintendedtobeinstructiveandrealisticenoughtobe112
relevanttofuturesocietaldecisions.Thequestiontheyposeis:Howfarwillsubstituting113
gasforcoalandsomeoiltakeustowardthegreenhousebenefitsofanimmediateandrapid114
conversiontolowcarbonenergysources.115
5
0
500
1000
1500
2000
2500
A. Business as Usual
0
500
1000
1500
2000
2500
EJperyear
B. Subst iute Gas
no C
Coal
Gas
Oil
0
500
1000
1500
2000
2500
0 25 50 75
C. Low Carbon Fast
100
years af er 2005
55
110
165110
330
330
440
165
55.67575
2094.4
2050
2050
729
371
165175
75
110165 175
75
Growth
Period
Declin
e Perio
d
990440 EJ
1265 EJ
2300 EJ
116
Figure1Threefuelconsumptionscenarioscomparedinthispaper:(A)Fossilfueluseinthebusiness‐as‐usual117scenariocontinuesthepresentgrowthinfossilfuelconsumptionintheinitial50yeargrowthperiodbeforelow118carbonenergysourcesreplacefossilfuelsinthedeclineperiod.(B)Inthesubstitute‐gasscenario,gasreplaces119coalsuchthatthesameamountofelectricityisgenerated,andsubstitutesfornewoilonanequalheatenergy120basis.(C)Inthelow‐carbon‐fastscenario,lowcarbonenergysourcesimmediatelysubstituteforcoalandnewoil121andgasinthegrowthperiod,andgasusedeclinesandsubstitutesforoilinthedeclineperiod.Numbersindicate122theconsumptionofthefuelsinEJperyearatthestart,midpoint,andendofthetransitionperiod.Thetotal123energyuseisthesameinallscenariosandisindicatedatthestart,midpoint,andendbytheboldblacknumbers124in(C).125

6
Table1.Parametersusedinthecalculations.Iistheenergycontentofthefuel,Rtheefficiencyofconversionto126electricity,andandthecarbonandmethaneemissionsfactors.Seetextfordiscussion.127
I[EJGt‐1] R[EJeEJ‐1] ξ[GtCEJ‐1] ζ[GtCH4EJ‐1]
Gas 55 0.6 0.015 1.8x10‐4foraleakageof1%ofproduction
Oil 43 0.020
Coal 29 0.32 0.027 1.2x10‐4for5m3/t
128
Computation Method and Parameters 129
Table1summarizestheparametersusedinthecalculations.I[EJGt‐1],givestheheat130
energyproducedwheneachfossilfuelisburnedinexajoules(1018joules)pergigaton(109131
tons)ofthefuel.Thevaluesweusearefromhttp://www.natural‐132
gas.com.au/about/references.html.Theenergydensityofcoalvariesfrom25‐37GJ/t,133
dependingontherankofthecoal,but29GJ/tisconsideredagoodaveragevaluefor134
calculations.135
R[EJeEJ‐1]istheefficiencywithwhichgasandcoalcanbeconvertedtoelectricityin136
exajoulesofelectricalenergyperexajouleofheat.Gascangenerateelectricitywithmuch137
greaterefficiencythancoalbecauseitcandriveagasturbinewhoseeffluentheatcanthen138
beusedtodriveasteamgenerator.Lookingforward,olderlowefficiencycoalplantswill139
likelybereplacedbyhigherefficiencycombinedcyclegasplantsofthiskind.Theelectrical140
conversionefficienciesweadoptinTable1arethoseselectedbyHayhoeetal.(2002,their141
TableII).142
Thecarbonemissionfactorsingigatonsofcarbonreleasedtotheatmosphereperexajoule143
ofcombustionheat,ξ[GtCEJ‐1],listedinthefourthcolumnofTable1arethefactors144
compiledbytheEPA(2005)andusedbyWigley(2011).145
Finally,themethaneemissionfactors,ζ[GtCH4EJ‐1]inthelastcolumnofTable1are146
computedfromthefractionofmethanethatleaksduringtheproductionanddeliveryof147
naturalgasandthevolumeofmethanethatisreleasedtotheatmosphereduringmining148
andtransportofcoal:149
7
]Gt EJ[]Gt Gt[]EJ Gt[ -1burned-CH4
-1burned-CH4vented-CH4
-1CH4 ILgas (1a)150
]Gt EJ[]m [] tm[]EJ Gt[ -1burned-coal
-3CH44CH4
-1mined-coal
3CH4
-1CH4 ItV CHcoal . (1b)151
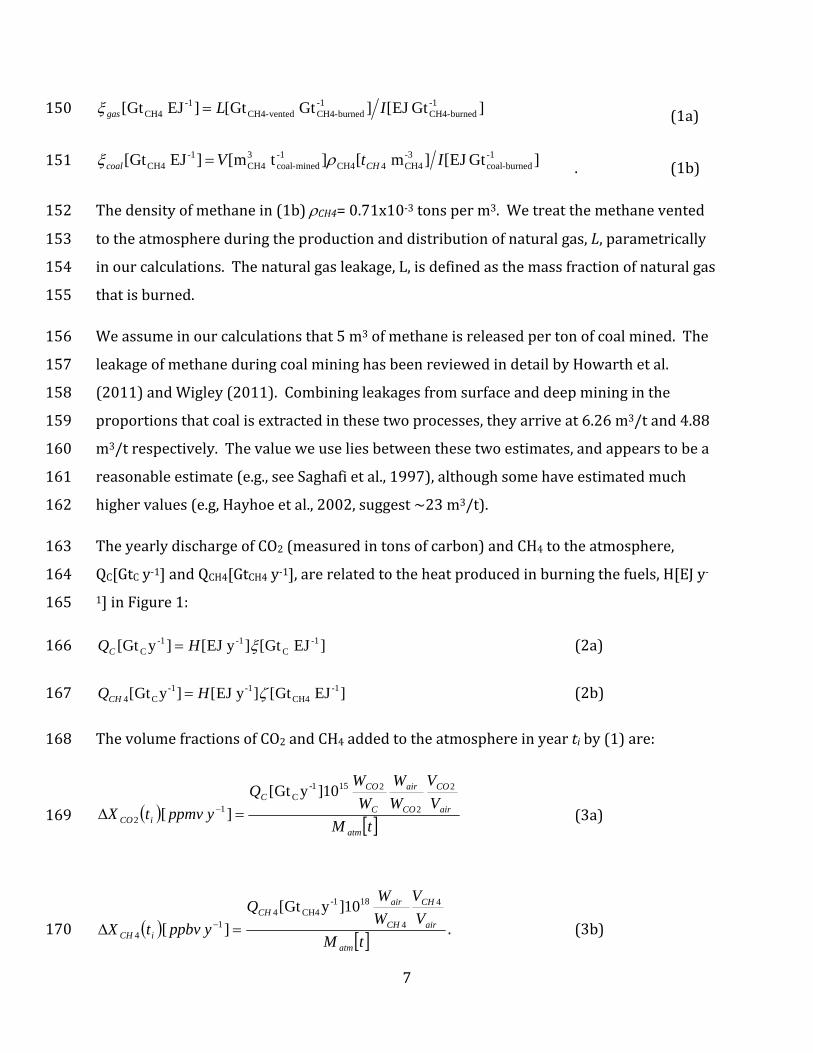
Thedensityofmethanein(1b)CH4=0.71x10‐3tonsperm3.Wetreatthemethanevented152
totheatmosphereduringtheproductionanddistributionofnaturalgas,L,parametrically153
inourcalculations.Thenaturalgasleakage,L,isdefinedasthemassfractionofnaturalgas154
thatisburned.155
Weassumeinourcalculationsthat5m3ofmethaneisreleasedpertonofcoalmined.The156
leakageofmethaneduringcoalmininghasbeenreviewedindetailbyHowarthetal.157
(2011)andWigley(2011).Combiningleakagesfromsurfaceanddeepmininginthe158
proportionsthatcoalisextractedinthesetwoprocesses,theyarriveat6.26m3/tand4.88159
m3/trespectively.Thevalueweuseliesbetweenthesetwoestimates,andappearstobea160
reasonableestimate(e.g.,seeSaghafietal.,1997),althoughsomehaveestimatedmuch161
highervalues(e.g,Hayhoeetal.,2002,suggest~23m3/t).162
TheyearlydischargeofCO2(measuredintonsofcarbon)andCH4totheatmosphere,163
QC[GtCy‐1]andQCH4[GtCH4y‐1],arerelatedtotheheatproducedinburningthefuels,H[EJy‐164
1]inFigure1:165
]EJ Gt[]y EJ[]yGt[ -1C
-1-1C HQC (2a)166
]EJ Gt[]y EJ[]yGt[ -1CH4
-1-1C4 HQCH (2b)
167
ThevolumefractionsofCO2andCH4addedtotheatmosphereinyeartiby(1)are:168
tM
V
V
W
W
W
WQ
yppmvtXatm
air
CO
CO
air
C
COC
iCO
2
2
2151-C
12
10]yGt[
][ (3a)169
tM
V
V
W
WQ
yppbvtXatm
air
CH
CH
airCH
iCH
4
4
181-CH44
14
10]yGt[
][ . (3b)170
8
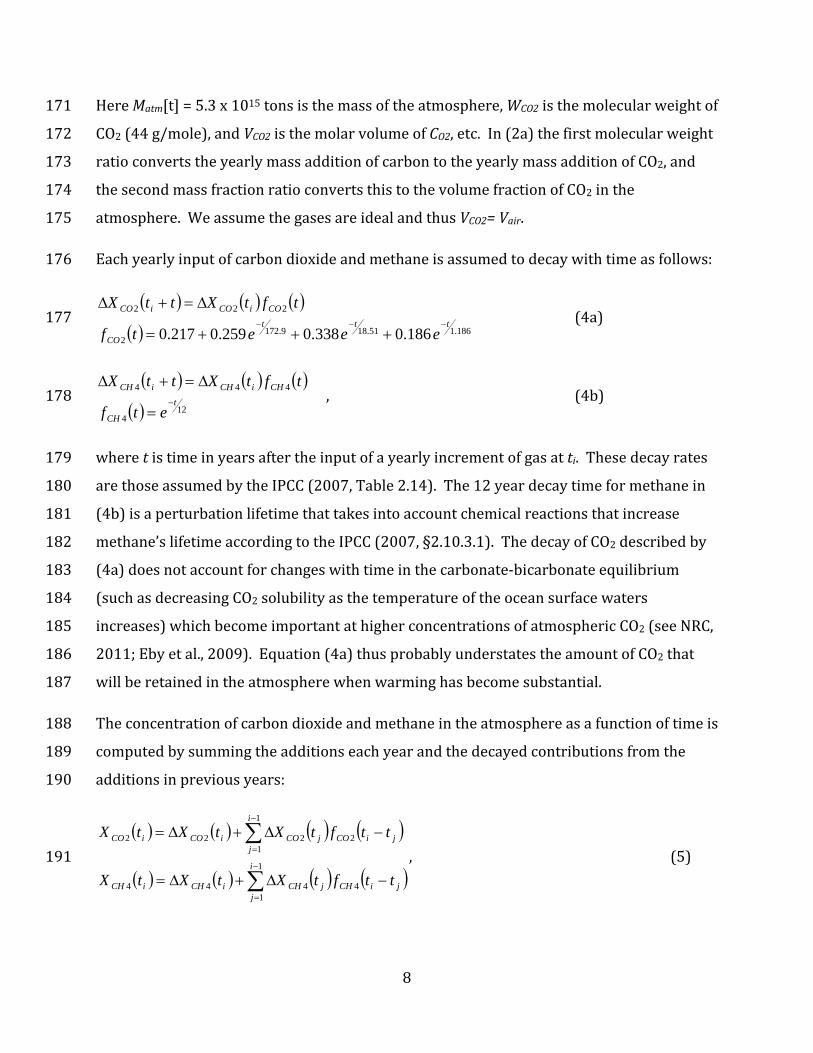
HereMatm[t]=5.3x10¹⁵tonsisthemassoftheatmosphere,WCO2isthemolecularweightof171
CO2(44g/mole),andVCO2isthemolarvolumeofCO2,etc.In(2a)thefirstmolecularweight172
ratioconvertstheyearlymassadditionofcarbontotheyearlymassadditionofCO2,and173
thesecondmassfractionratioconvertsthistothevolumefractionofCO2inthe174
atmosphere.WeassumethegasesareidealandthusVCO2=Vair.175
Eachyearlyinputofcarbondioxideandmethaneisassumedtodecaywithtimeasfollows:176
186.151.189.172
2
222
186.0338.0259.0217.0ttt
CO
COiCOiCO
eeetf
tftXttX
(4a)177
12
4
444
t
CH
CHiCHiCH
etf
tftXttX
, (4b)178
wheretistimeinyearsaftertheinputofayearlyincrementofgasatti.Thesedecayrates179
arethoseassumedbytheIPCC(2007,Table2.14).The12yeardecaytimeformethanein180
(4b)isaperturbationlifetimethattakesintoaccountchemicalreactionsthatincrease181
methane’slifetimeaccordingtotheIPCC(2007,§2.10.3.1).ThedecayofCO2describedby182
(4a)doesnotaccountforchangeswithtimeinthecarbonate‐bicarbonateequilibrium183
(suchasdecreasingCO2solubilityasthetemperatureoftheoceansurfacewaters184
increases)whichbecomeimportantathigherconcentrationsofatmosphericCO2(seeNRC,185
2011;Ebyetal.,2009).Equation(4a)thusprobablyunderstatestheamountofCO2that186
willberetainedintheatmospherewhenwarminghasbecomesubstantial.187
Theconcentrationofcarbondioxideandmethaneintheatmosphereasafunctionoftimeis188
computedbysummingtheadditionseachyearandthedecayedcontributionsfromthe189
additionsinpreviousyears:190
1
14444
1
12222
i
jjiCHjCHiCHiCH
i
jjiCOjCOiCOiCO
ttftXtXtX
ttftXtXtX
, (5)191
9
where iCO tX 2 and iCH tX 4 arevolumetricconcentrationofCO2andCH4inppmvandppbv192
respectively,irunsfrom1tottotwherettotisthedurationofthetransitioninyears,andthe193
sumtermsontherighthandsidesdoesnotcontributeunlessi≥2.194
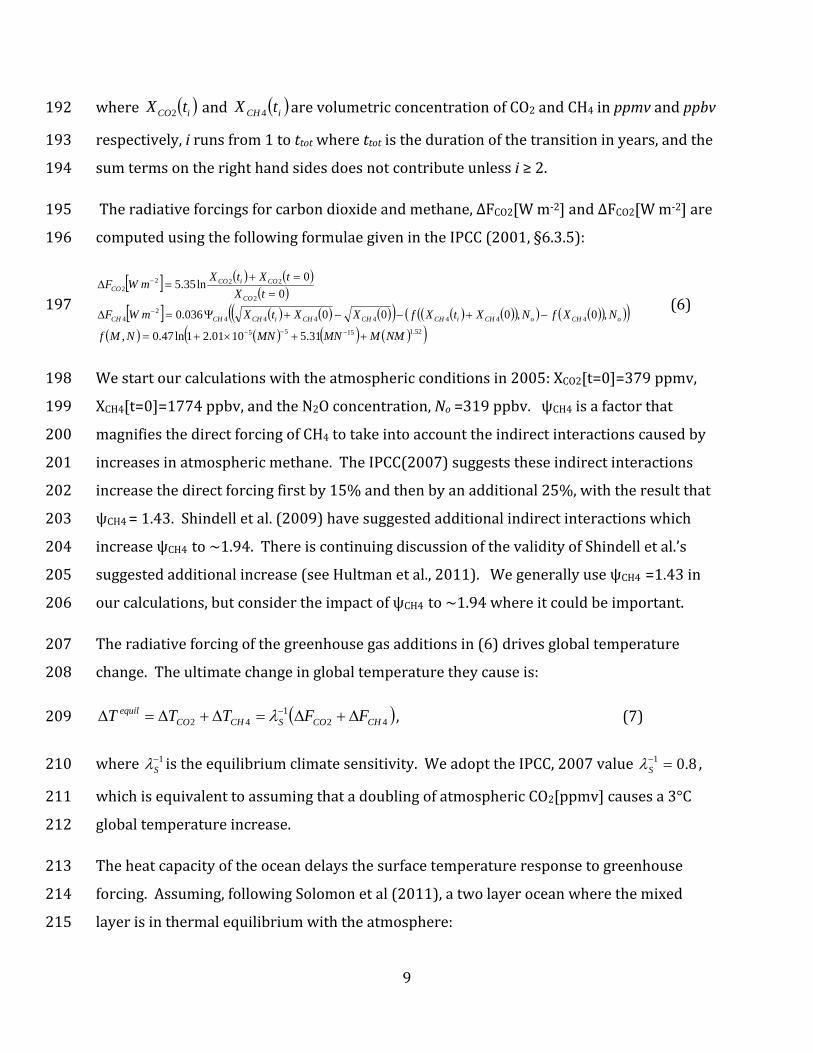
Theradiativeforcingsforcarbondioxideandmethane,∆FCO2[Wm‐2]and∆FCO2[Wm‐2]are195
computedusingthefollowingformulaegivenintheIPCC(2001,§6.3.5):196
52.11555
44444442
4
2
2222
31.51001.21ln47.0,
,0,000036.0
0
0ln35.5
NMMMNMNNMf
NXfNXtXfXXtXmWF
tX
tXtXmWF
oCHoCHiCHCHCHiCHCHCH
CO
COiCOCO
(6)197
Westartourcalculationswiththeatmosphericconditionsin2005:XCO2[t=0]=379ppmv,198
XCH4[t=0]=1774ppbv,andtheN2Oconcentration,No=319ppbv.ψCH4isafactorthat199
magnifiesthedirectforcingofCH4totakeintoaccounttheindirectinteractionscausedby200
increasesinatmosphericmethane.TheIPCC(2007)suggeststheseindirectinteractions201
increasethedirectforcingfirstby15%andthenbyanadditional25%,withtheresultthat202
ψCH4=1.43.Shindelletal.(2009)havesuggestedadditionalindirectinteractionswhich203
increaseψCH4to~1.94.ThereiscontinuingdiscussionofthevalidityofShindelletal.’s204
suggestedadditionalincrease(seeHultmanetal.,2011).WegenerallyuseψCH4=1.43in205
ourcalculations,butconsidertheimpactofψCH4to~1.94whereitcouldbeimportant.206
Theradiativeforcingofthegreenhousegasadditionsin(6)drivesglobaltemperature207
change.Theultimatechangeinglobaltemperaturetheycauseis:208
421
42 CHCOSCHCOequil FFTTT , (7)209
where 1S istheequilibriumclimatesensitivity.WeadopttheIPCC,2007value 8.01
S ,210
whichisequivalenttoassumingthatadoublingofatmosphericCO2[ppmv]causesa3°C211
globaltemperatureincrease.212
Theheatcapacityoftheoceandelaysthesurfacetemperatureresponsetogreenhouse213
forcing.Assuming,followingSolomonetal(2011),atwolayeroceanwherethemixed214
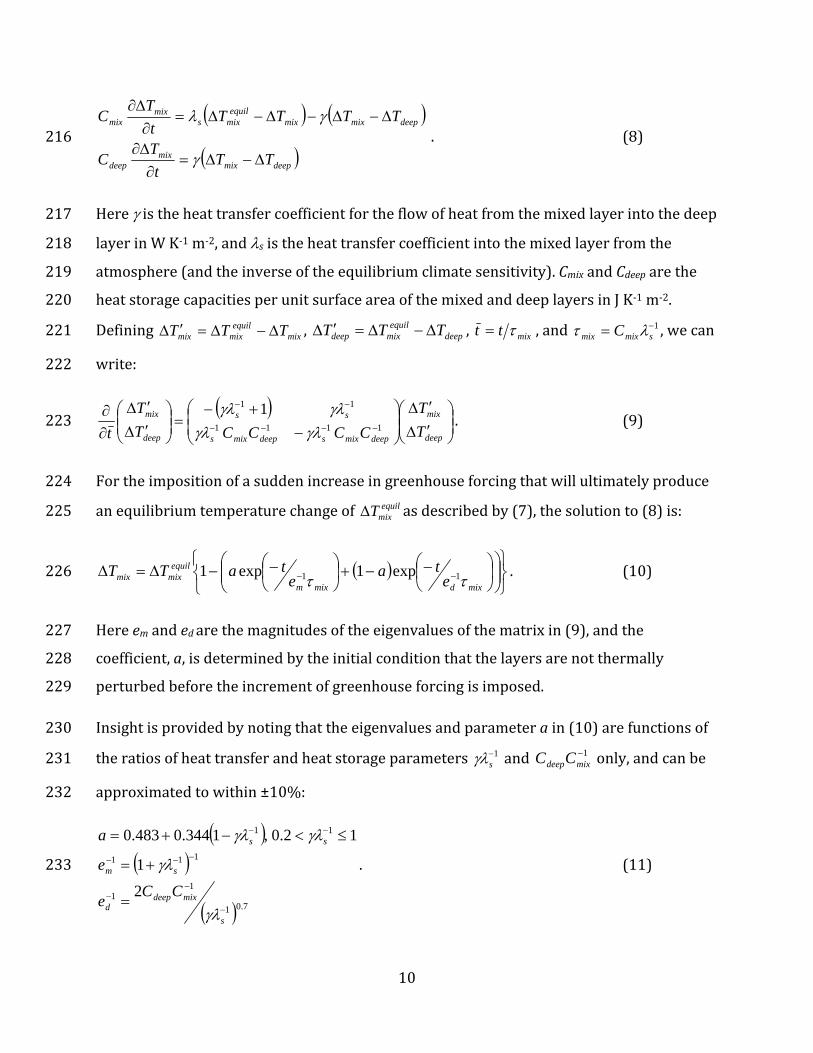
layerisinthermalequilibriumwiththeatmosphere:215
10
deepmixmix
deep
deepmixmixequil
mixsmix
mix
TTt
TC
TTTTt
TC
. (8)216
Hereistheheattransfercoefficientfortheflowofheatfromthemixedlayerintothedeep217
layerinWK‐1m‐2,andsistheheattransfercoefficientintothemixedlayerfromthe218
atmosphere(andtheinverseoftheequilibriumclimatesensitivity).CmixandCdeeparethe219
heatstoragecapacitiesperunitsurfaceareaofthemixedanddeeplayersinJK‐1m‐2.220
Defining mixequil
mixmix TTT , deepequil
mixdeep TTT , mixtt ,and 1 smixmix C ,wecan221
write:222
deep
mix
deepmixsdeepmixs
ss
deep
mix
T
T
CCCCT
T
t 1111
11 1
. (9)223
Fortheimpositionofasuddenincreaseingreenhouseforcingthatwillultimatelyproduce224
anequilibriumtemperaturechangeof equilmixT asdescribedby(7),thesolutionto(8)is:225
mixdmixm
equilmixmix e
tae
taTT 11 exp1exp1 . (10)226
Hereemandedarethemagnitudesoftheeigenvaluesofthematrixin(9),andthe227
coefficient,a,isdeterminedbytheinitialconditionthatthelayersarenotthermally228
perturbedbeforetheincrementofgreenhouseforcingisimposed.229
Insightisprovidedbynotingthattheeigenvaluesandparameterain(10)arefunctionsof230
theratiosofheattransferandheatstorageparameters 1s and 1
mixdeepCC only,andcanbe231
approximatedtowithin±10%:232
7.01
11
111
11
2
1
12.0,1344.0483.0
s
mixdeepd
sm
ss
CCe
e
a
. (11)233
11
Itisunlikelythatthatheatwillbetransferredoutthebaseofthemixedlayermore234
efficientlythanitisintothetopofthemixedlayerbecausethetransferwillbemostly235
drivenbywindsandcoolingoftheoceansurface.Forthisreasontheheattransfer236
coefficientratio 1s isalmostcertainly≤1andthereductionoftemperatureisgreatestfor237
11 s .For 11
s ,theinitialtemperaturechangeinthemixedlayerwillbeabouthalf238
thechangethatwilloccurwhentheoceanlayersarefullywarmed,andtheresponsetime239
requiredtoreachthisequilibriumchange(thetimerequiredtoreach2/3rdsofthe240
equilibriumvalue)willbeabout½oftheresponsetimeofthemixedlayer(e.g., 211
mixe ).241
For 11 s ,theresponsetimeofthedeeplayeristwicetheheatstoragecapacityratio242
timestheresponsetimeofthemixedlayer: mixmixdeepCC 12 .243
Thetransienttemperaturechangecanbecomputedfromtheequilibriumtemperature244
changein(7)byconvolvinginafashionsimilartowhatwasdonein(5):245
1
111
exp1exp1i
j mixd
ji
mixm
jij
equili e
tta
e
ttatTtT
, (12)246
wherei≥j.Wedonotusetheapproximationsofequation(11)whenwecarryoutthe247
convolutionin(12).Ratherwesolvefortheactualvaluesoftheeigenvaluesand248
parameterafromthematrixin(9)ateachyearlyincrementintemperaturechange.For249
mix=5years,Tmixwillreach0.483Tmixequilwithadecaytimeof2.5yearsandriseto250
Tmixequilwithadecaytimeof200years.251
Thecurrentconsensusseemstobethat 11 s andthetransientthermalresponseis252
abouthalfthefullequilibriumforcingvalue(NRC,2011,§3.3).Theratiooftheheatstorage253
capacityofthedeeptomixedlayer, 1mixdeepCC isprobablyatleast20,avalueadoptedby254
Solomonetal.(2011).Schwartz(2007)estimatedthethermalresponsetimeofthemixed255
layerat~5yearsfromthetemporalautocorrelationofseasurfacetemperatures.Thismay256
bethebestestimateofthisparameter,butSchwartznotesthatestimatesrangefrom2to257
30years.Fortunatelythemoderationoftemperaturechangebytheoceansdoesnot258
12
impactthebenefitofsubstitutinggasforcoalandoilatall.Itisofinterestindefiningthe259
coolingthatsubstitutionwouldproduce,however.Wecalculatethetransienttemperature260
changesforthefullrangeofoceanmoderationparameters.261
Equations(1)to(10)plus(12),togetherwiththeparametersjustdiscusseddefine262
completelythemethodsweusetocalculatetheglobalwarmingcausedbythefueluse263
scenariosinFigure1.264
0 100 200
Conc
entr
atio
nCh
ange
[ppm
vca
rbon
diox
ide]
0
500 Carbon Dioxide [ppmv]434 ppmv
327
190
Business as usual
Substitute gas
Low carbon fast
Low carbon fast
Substitute gasBusiness as usual
404
470 ppbv
120
0 100 200
time [years] since 2005
Conc
entr
atio
nCh
ange
[ppb
vm
etha
ne]
0
500 Methane [ppbv]
258
194
113
368
428 ppbv
115
397
359
108
154
115
66
50 yeartransition
100 yeartransition
200 yeartransition
A
B
265
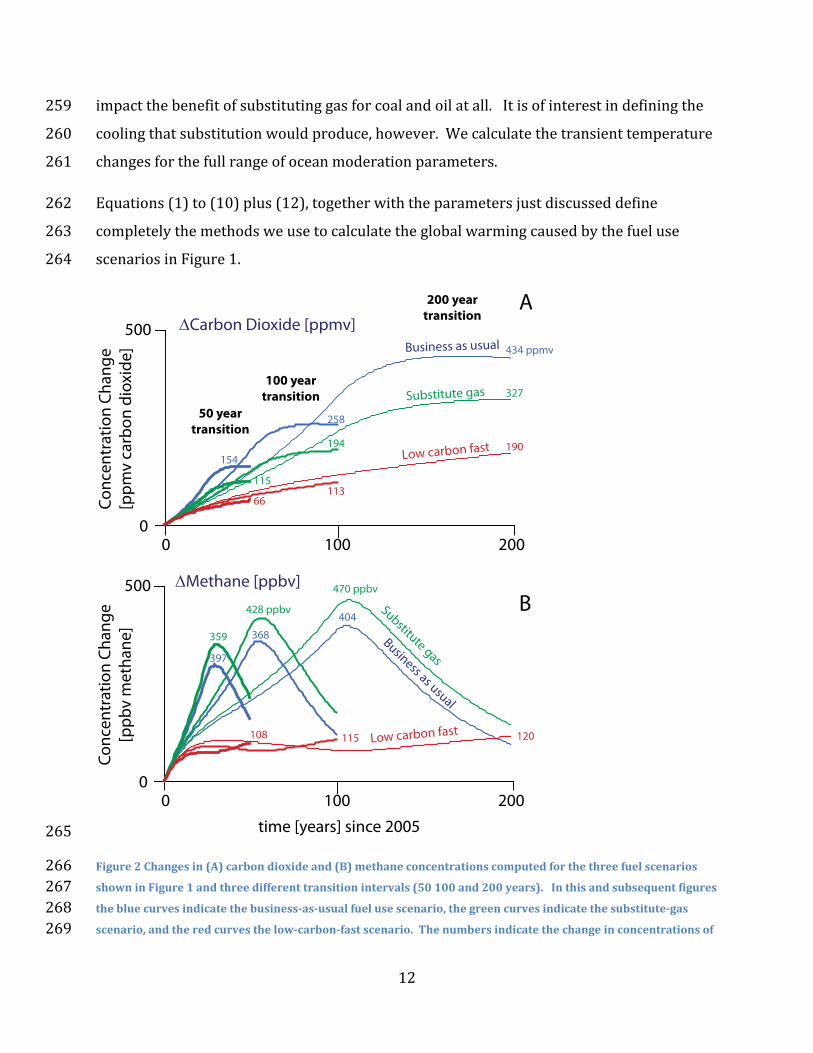
Figure2Changesin(A)carbondioxideand(B)methaneconcentrationscomputedforthethreefuelscenarios266showninFigure1andthreedifferenttransitionintervals(50100and200years).Inthisandsubsequentfigures267thebluecurvesindicatethebusiness‐as‐usualfuelusescenario,thegreencurvesindicatethesubstitute‐gas268scenario,andtheredcurvesthelow‐carbon‐fastscenario.Thenumbersindicatethechangeinconcentrationsof269
13
CO2andmethanefromthe379ppmvforCO2and1774ppbvforCH4levelspresentintheatmospherein2005.270ThecalculationisbasedonL=1%ofgasconsumptionandV=5m3methanepertonofcoalburned.271
Results 272
Figure2showstheadditionsofCO2inppmvandmethaneinppbvthatoccurforthe273
differentfuelconsumptionscenariosshowinFigure1forthethreetransitionperiods(50,274
100and200years).Themethaneleakageisassumedtobe1%ofconsumption.Fivecubic275
metersofmethaneareassumedtoleaktotheatmosphereforeachtonofcoalmined.The276
atmosphericmethaneconcentrationstrackthepatternofmethanereleasequiteclosely277
becausemethaneisremovedquicklyfromtheatmospherewithanexponentiallydecay278
constantof12years(equation4b).Ontheotherhand,becauseonlyaportionoftheCO2279
introducedintotheatmospherebyfuelcombustionisremovedquickly(seeequation4a),280
CO2accumulatesacrossthetransitionperiodsand,aswewillshowbelow,persistsfora281
longtimethereafter.282
0 100 200
time [years]
Radi
ativ
eFo
rcin
g[W
m-2
]
0
5
Methane
Carbon Dioxidebusiness as usual
substitute gas
low carbon fast
40%
41%
42%
283
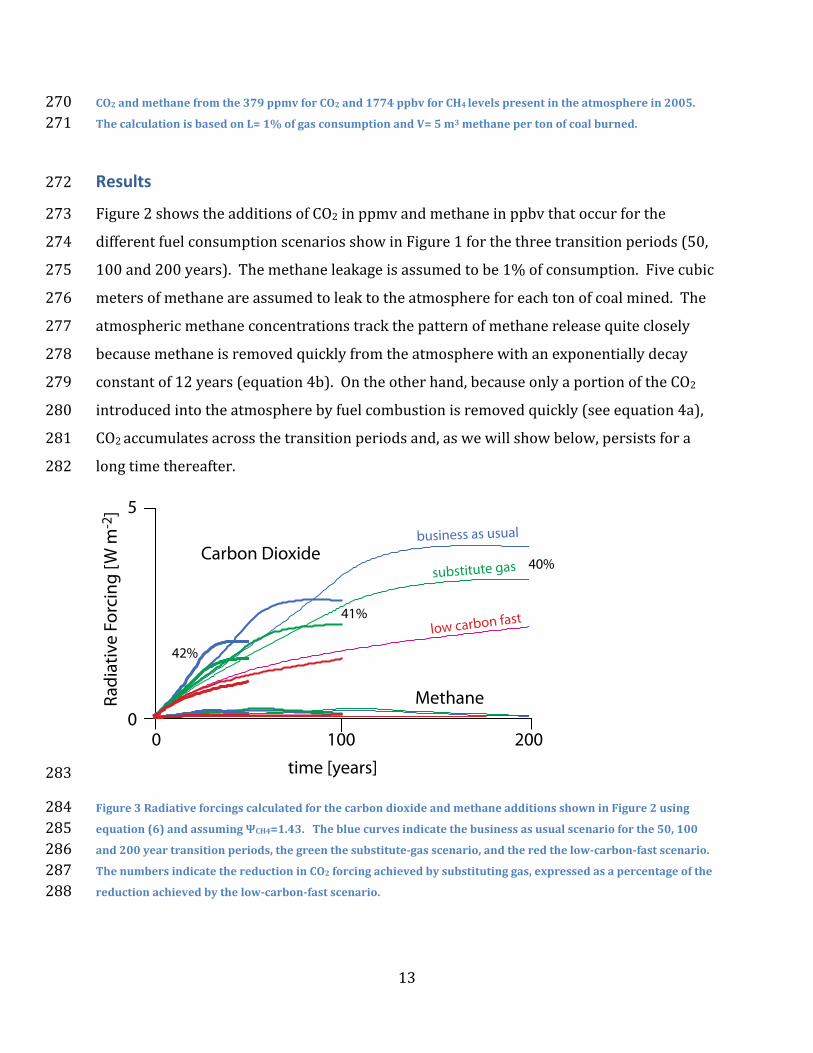
Figure3RadiativeforcingscalculatedforthecarbondioxideandmethaneadditionsshowninFigure2using284equation(6)andassumingΨCH4=1.43.Thebluecurvesindicatethebusinessasusualscenarioforthe50,100285and200yeartransitionperiods,thegreenthesubstitute‐gasscenario,andtheredthelow‐carbon‐fastscenario.286ThenumbersindicatethereductioninCO2forcingachievedbysubstitutinggas,expressedasapercentageofthe287reductionachievedbythelow‐carbon‐fastscenario.288
14
Figure3showstheradiativeforcingscorrespondingtotheatmosphericgasconcentrations289
showninFigure2usingequation(6).ThemethaneforcingisafewpercentoftheCO2290
forcing,andthusisunimportantindrivinggreenhousewarmingforagasleakagerateof291
1%.292
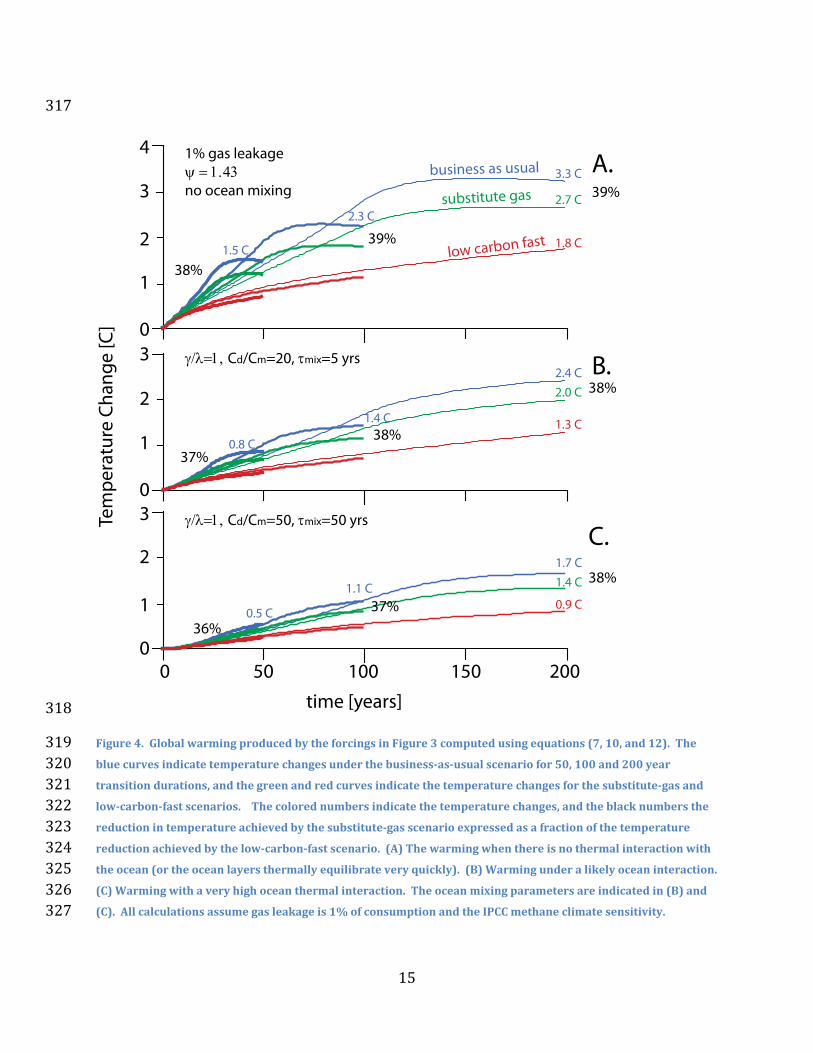
Figure4showstheglobalwarmingpredictedfromtheradiativeforcingsinFigure3for293
variousdegreesofheatlosstotheocean.Wetaketheequilibriumclimatesensitivity 1s =294
0.8(e.g.,adoublingofCO2causesa3°Cofglobalwarming).Thefastertransitionsproduce295
lessglobalwarmingbecausetheyputlessCO2intotheatmosphere.Thethermal296
modulationoftheoceanscanreducethewarmingbyuptoafactoroftwo.Forexample,297
Figure4Ashowstheglobalwarmingthatwouldresultfromthebusiness‐as‐usualscenario298
iftherewerenoheatlossestotheoceanrangesfrom1.5°Cforthe50yeartransitionto299
3.3°Cforthe200yeartransition.Figure4Cindicatesthatheatexchangetotheoceans300
couldreducethiswarmingbyafactoroftwoforthelongtransitionsandthreeforthe50301
yeartransition.Awarmingreductionthislargeisunlikelybecauseitassumesextreme302
parametervalues:adeepoceanlayerwithaheatstorage50timestheshallowmixedlayer,303
andalongmixingtimefortheshallowlayer(mix=50years).Figure4Bindicatesthemore304
likelyoceantemperaturechangemoderationbasedonmid‐rangedeeplayerstorage305
( 1mixdeepCC =20)andmixedlayerresponsetime(mix=5years)parametervalues.306
Theimportantmessageofthisfigureforthepurposesofthispaper,however,isnotthe307
amountofwarmingthatmightbeproducedbythevariousfuelscenariosofFigure1,but308
theindicationthatthereductioningreenhousewarmingfromsubstitutinggasforcoaland309
oilisnotsignificantlyaffectedbyheatexchangewiththeoceanorbythedurationofthe310
transitionperiod.Thesamepercentreductioninglobalwarmingfromsubstitutinggasfor311
coalandoilisrealizedregardlessofthedurationofthetransitionperiodorthedegreeof312
thermalmoderationbytheocean.Thebenefitofsubstitutinggasisapercentorsolessfor313
theshorttransitions,andtheoceanmoderationreducesthebenefitbyapercentorso,but314
thebenefitinallcircumstancesremains~38%.Heatlossintotheoceansmayreducethe315
warmingbyafactoroftwo,butthebenefitofsubstitutinggasisnotsignificantlyaffected.316
15
317
0
4business as usual
substitute gas
low carbon fast
1% gas leakage no ocean mixing
1.5 C
2.3 C
3.3 C
1.8 C
2.7 C
Tem
pera
ture
Chan
ge[C
]
32.4 C2.0 C
1.3 C1.4 C
0.8 C
Cd/Cm=20, mix=5 yrs
0
0 50 100 200
time [years]
3
0150
1.7 C1.4 C
0.9 C1.1 C
0.5 C
Cd/Cm=50, mix=50 yrs
39%
38%
38%
39%
38%
37%
38%
37%
36%1
2
1
2
1
2
3A.
B.
C.
318
Figure4.GlobalwarmingproducedbytheforcingsinFigure3computedusingequations(7,10,and12).The319bluecurvesindicatetemperaturechangesunderthebusiness‐as‐usualscenariofor50,100and200year320transitiondurations,andthegreenandredcurvesindicatethetemperaturechangesforthesubstitute‐gasand321low‐carbon‐fastscenarios.Thecolorednumbersindicatethetemperaturechanges,andtheblacknumbersthe322reductionintemperatureachievedbythesubstitute‐gasscenarioexpressedasafractionofthetemperature323reductionachievedbythelow‐carbon‐fastscenario.(A)Thewarmingwhenthereisnothermalinteractionwith324theocean(ortheoceanlayersthermallyequilibrateveryquickly).(B)Warmingunderalikelyoceaninteraction.325(C)Warmingwithaveryhighoceanthermalinteraction.Theoceanmixingparametersareindicatedin(B)and326(C).Allcalculationsassumegasleakageis1%ofconsumptionandtheIPCCmethaneclimatesensitivity.327
16
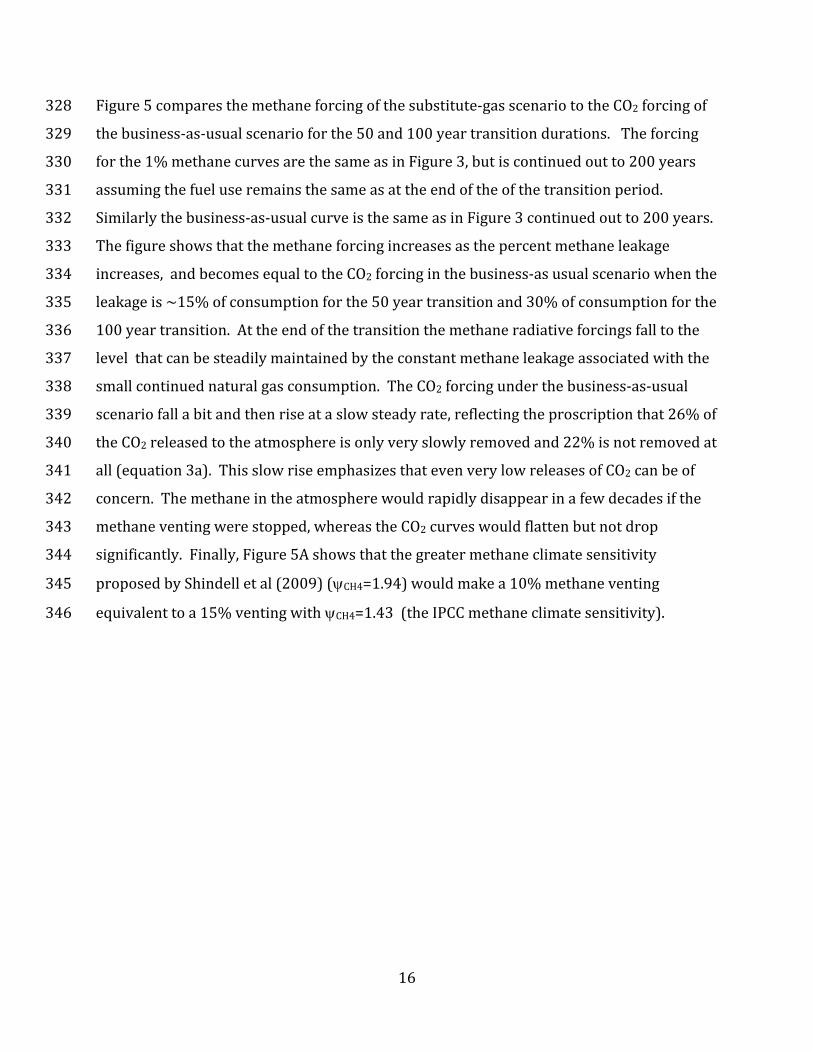
Figure5comparesthemethaneforcingofthesubstitute‐gasscenariototheCO2forcingof328
thebusiness‐as‐usualscenarioforthe50and100yeartransitiondurations.Theforcing329
forthe1%methanecurvesarethesameasinFigure3,butiscontinuedoutto200years330
assumingthefueluseremainsthesameasattheendoftheofthetransitionperiod.331
Similarlythebusiness‐as‐usualcurveisthesameasinFigure3continuedoutto200years.332
Thefigureshowsthatthemethaneforcingincreasesasthepercentmethaneleakage333
increases,andbecomesequaltotheCO2forcinginthebusiness‐asusualscenariowhenthe334
leakageis~15%ofconsumptionforthe50yeartransitionand30%ofconsumptionforthe335
100yeartransition.Attheendofthetransitionthemethaneradiativeforcingsfalltothe336
levelthatcanbesteadilymaintainedbytheconstantmethaneleakageassociatedwiththe337
smallcontinuednaturalgasconsumption.TheCO2forcingunderthebusiness‐as‐usual338
scenariofallabitandthenriseataslowsteadyrate,reflectingtheproscriptionthat26%of339
theCO2releasedtotheatmosphereisonlyveryslowlyremovedand22%isnotremovedat340
all(equation3a).ThisslowriseemphasizesthatevenverylowreleasesofCO2canbeof341
concern.Themethaneintheatmospherewouldrapidlydisappearinafewdecadesifthe342
methaneventingwerestopped,whereastheCO2curveswouldflattenbutnotdrop343
significantly.Finally,Figure5Ashowsthatthegreatermethaneclimatesensitivity344
proposedbyShindelletal(2009)(CH4=1.94)wouldmakea10%methaneventing345
equivalenttoa15%ventingwithCH4=1.43(theIPCCmethaneclimatesensitivity).346
17
2.5
01%
5%
10%
15%
20% Business as Usual
Substitute Gas
Leakage rate[% of consumption]
100 200
time [years]
Radi
ativ
eFo
rcin
g[W
m-2
]
2.5
00
0.5
1.0
1.5
2.0
3.0
0.5
1.0
1.5
2.0
50 150
Business as Usual
Substitute Gas
1%
5%
10%
15%
20%
25%
30%
50 year transition
100 year transition
A.
B.
347
Figure5.RadiativeforcingsofCO2forthebusinessasusualscenario(bluecurves)andforCH4forvariousgas348leakageratesinthesubstitute‐gasscenario(greencurves).The1%methanecurvesandthebusinessasusual349curvesarethesameasinFigure3excepttheverticalscaleisexpandedandthecurvesareextendedfromtheend350ofthetransitionto200yearsassumingthegasemissionsarethesameasattheendofthetransitionpast100351years.Themethaneforcingsplateauatthelevelscorrespondingtotheatmosphericconcentrationsupportedby352thesteadyCH4emissions.TheCO2forcingincreasesbecauseanappreciablefractionoftheCO2emissionsare353removedslowlyornotatallfromtheatmosphere.ThemethaneforcingsallassumetheIPCCmethaneclimate354sensitivity(CH4=1.43)exceptthesingleredcurve,whichassumesthemethaneclimatesensitivitysuggestedby355Shindelletal.(2009)(CH4=1.94).356
18
0 50
time [years]
1.5
0
Cd/Cm=20, mix=5 yrs
1%
0.96 C
5%
1.07 C
10%
1.19 C
15%
1.30 C
0 100
1.5
0
1%
1.60 C
10%
1.84 C
20%
2.05 C
0 200
1.5
0
2.69 C
1%
35%
3.48 C
A. 50yr Transition
B. 100yr Transition
C. 200 yr Transition
40%
1%
40%
21%
5%
-6%
17%
39%
-1%
Tem
pera
ture
Chan
ge[C
]
Busi
ness
asU
sual
Subs
titut
eG
asLo
wCar
rbon
Fast
357
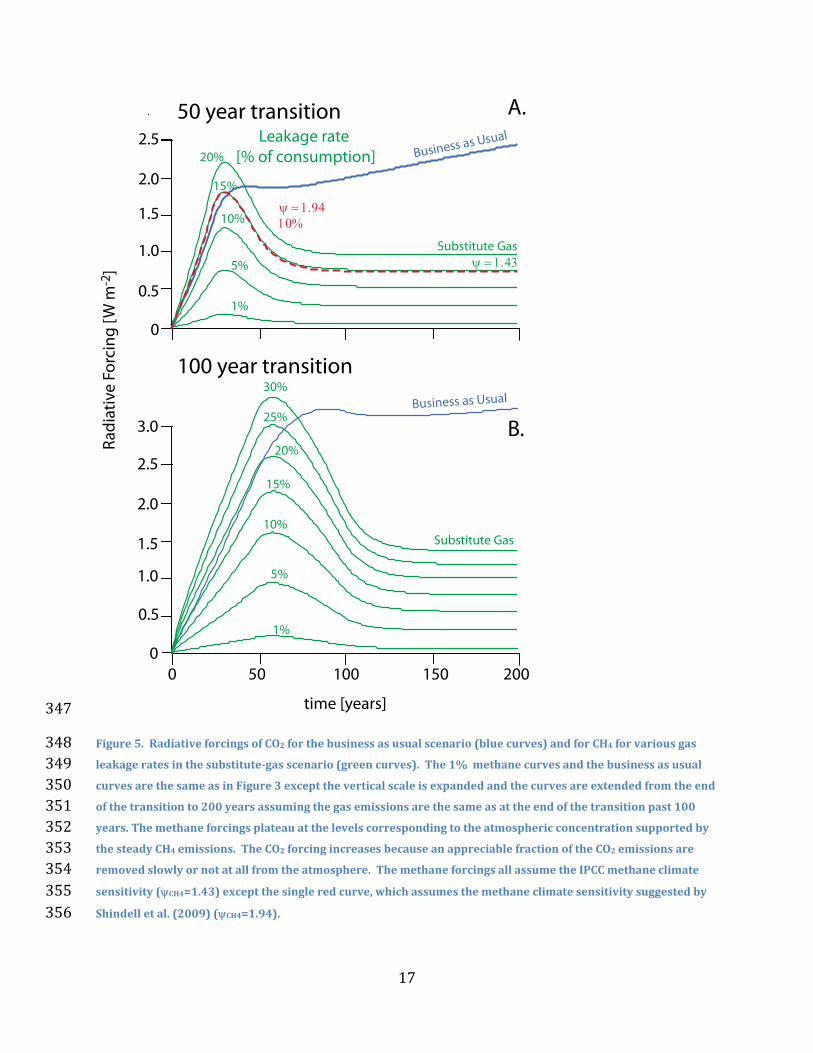
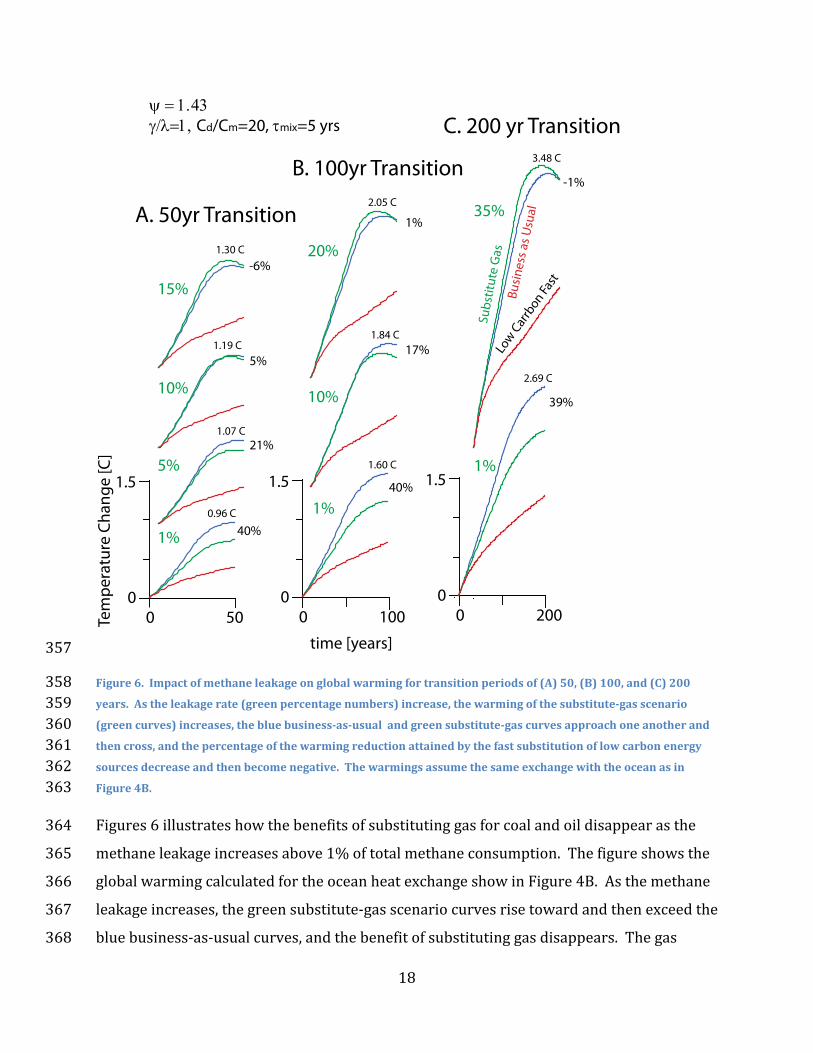
Figure6.Impactofmethaneleakageonglobalwarmingfortransitionperiodsof(A)50,(B)100,and(C)200358years.Astheleakagerate(greenpercentagenumbers)increase,thewarmingofthesubstitute‐gasscenario359(greencurves)increases,thebluebusiness‐as‐usualandgreensubstitute‐gascurvesapproachoneanotherand360thencross,andthepercentageofthewarmingreductionattainedbythefastsubstitutionoflowcarbonenergy361sourcesdecreaseandthenbecomenegative.Thewarmingsassumethesameexchangewiththeoceanasin362Figure4B.363
Figures6illustrateshowthebenefitsofsubstitutinggasforcoalandoildisappearasthe364
methaneleakageincreasesabove1%oftotalmethaneconsumption.Thefigureshowsthe365
globalwarmingcalculatedfortheoceanheatexchangeshowinFigure4B.Asthemethane366
leakageincreases,thegreensubstitute‐gasscenariocurvesrisetowardandthenexceedthe367
bluebusiness‐as‐usualcurves,andthebenefitofsubstitutinggasdisappears.Thegas368
19
leakageatwhichsubstitutinggasforoilandcoalwarmstheearthmorethanthebusiness‐369
as‐usualscenarioissmallest(L~10%)forthe50yeartransitionperiodandlargest370
(L~35%)forthe200yeartransitionperiod.371
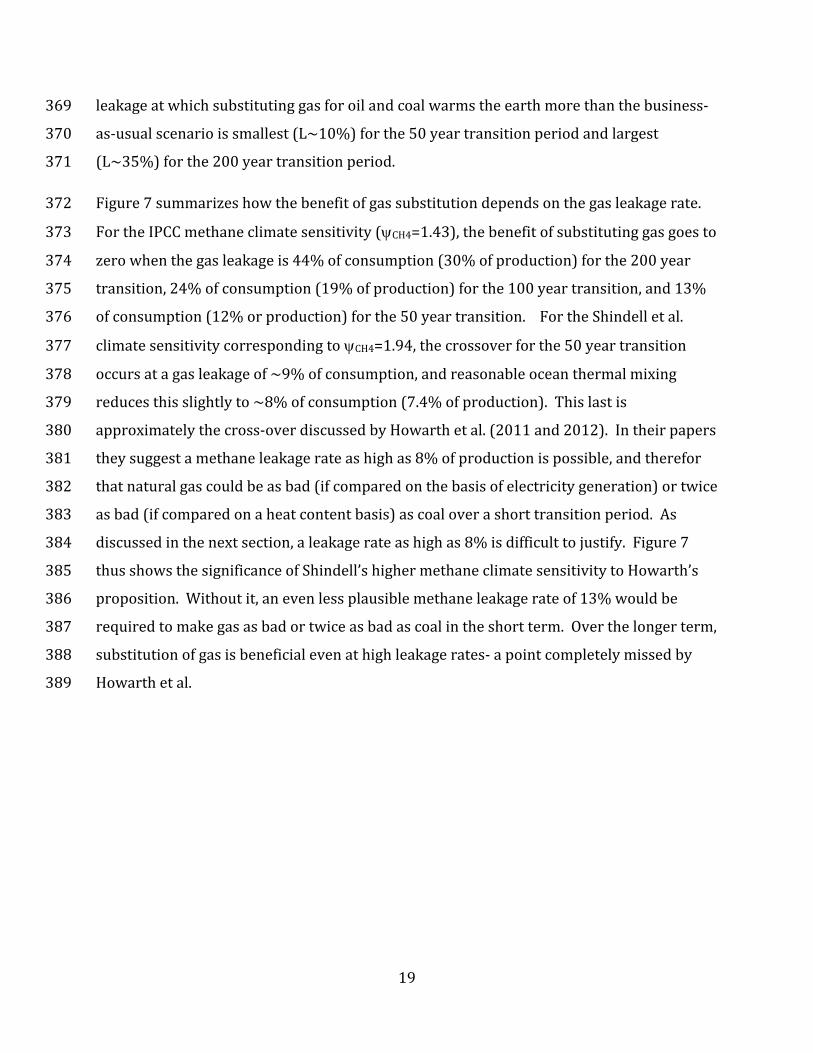
Figure7summarizeshowthebenefitofgassubstitutiondependsonthegasleakagerate.372
FortheIPCCmethaneclimatesensitivity(CH4=1.43),thebenefitofsubstitutinggasgoesto373
zerowhenthegasleakageis44%ofconsumption(30%ofproduction)forthe200year374
transition,24%ofconsumption(19%ofproduction)forthe100yeartransition,and13%375
ofconsumption(12%orproduction)forthe50yeartransition.FortheShindelletal.376
climatesensitivitycorrespondingtoCH4=1.94,thecrossoverforthe50yeartransition377
occursatagasleakageof~9%ofconsumption,andreasonableoceanthermalmixing378
reducesthisslightlyto~8%ofconsumption(7.4%ofproduction).Thislastis379
approximatelythecross‐overdiscussedbyHowarthetal.(2011and2012).Intheirpapers380
theysuggestamethaneleakagerateashighas8%ofproductionispossible,andtherefor381
thatnaturalgascouldbeasbad(ifcomparedonthebasisofelectricitygeneration)ortwice382
asbad(ifcomparedonaheatcontentbasis)ascoaloverashorttransitionperiod.As383
discussedinthenextsection,aleakagerateashighas8%isdifficulttojustify.Figure7384
thusshowsthesignificanceofShindell’shighermethaneclimatesensitivitytoHowarth’s385
proposition.Withoutit,anevenlessplausiblemethaneleakagerateof13%wouldbe386
requiredtomakegasasbadortwiceasbadascoalintheshortterm.Overthelongerterm,387
substitutionofgasisbeneficialevenathighleakagerates‐apointcompletelymissedby388
Howarthetal.389
20
0
10
20
30
40
50
0 5 10 15
%Percent low‐C‐fast
Leakage [% of consumption]
Benefit of Gas Substitution
1 to 2% leakage
390
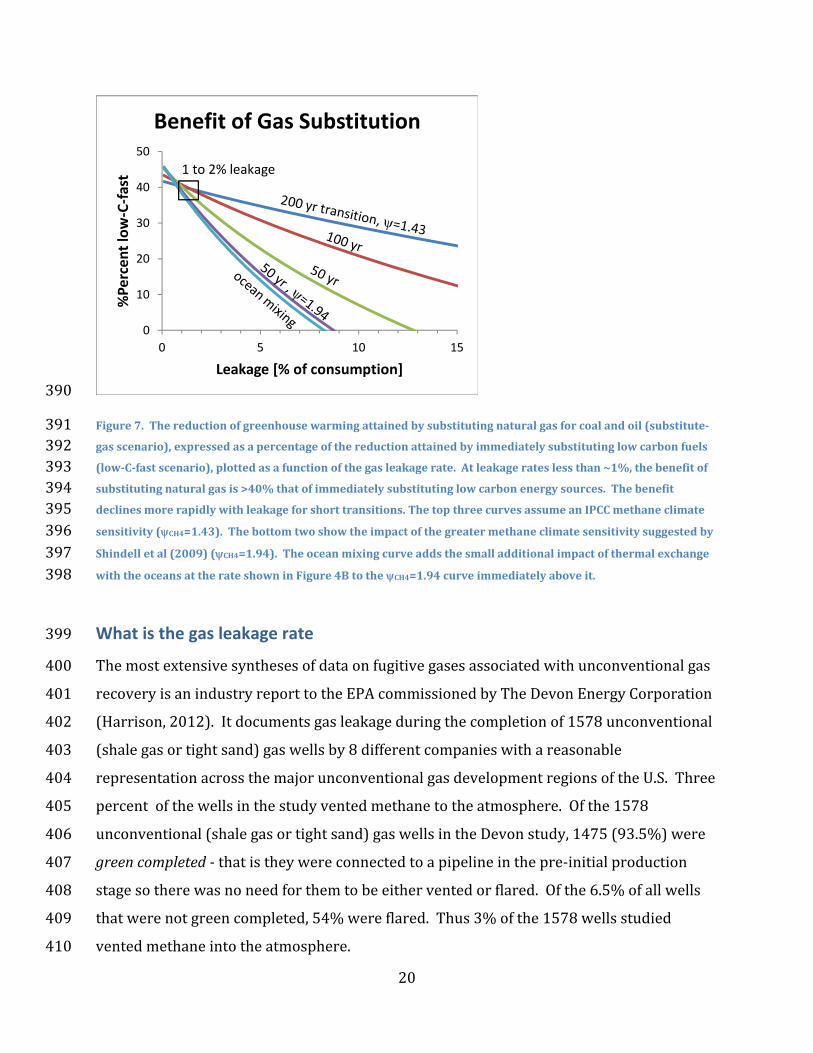
Figure7.Thereductionofgreenhousewarmingattainedbysubstitutingnaturalgasforcoalandoil(substitute‐391gasscenario),expressedasapercentageofthereductionattainedbyimmediatelysubstitutinglowcarbonfuels392(low‐C‐fastscenario),plottedasafunctionofthegasleakagerate.Atleakagerateslessthan~1%,thebenefitof393substitutingnaturalgasis>40%thatofimmediatelysubstitutinglowcarbonenergysources.Thebenefit394declinesmorerapidlywithleakageforshorttransitions.ThetopthreecurvesassumeanIPCCmethaneclimate395sensitivity(CH4=1.43).Thebottomtwoshowtheimpactofthegreatermethaneclimatesensitivitysuggestedby396Shindelletal(2009)(CH4=1.94).Theoceanmixingcurveaddsthesmalladditionalimpactofthermalexchange397withtheoceansattherateshowninFigure4BtotheCH4=1.94curveimmediatelyaboveit.398
What is the gas leakage rate 399
Themostextensivesynthesesofdataonfugitivegasesassociatedwithunconventionalgas400
recoveryisanindustryreporttotheEPAcommissionedbyTheDevonEnergyCorporation401
(Harrison,2012).Itdocumentsgasleakageduringthecompletionof1578unconventional402
(shalegasortightsand)gaswellsby8differentcompanieswithareasonable403
representationacrossthemajorunconventionalgasdevelopmentregionsoftheU.S.Three404
percentofthewellsinthestudyventedmethanetotheatmosphere.Ofthe1578405
unconventional(shalegasortightsand)gaswellsintheDevonstudy,1475(93.5%)were406
greencompleted‐thatistheywereconnectedtoapipelineinthepre‐initialproduction407
stagesotherewasnoneedforthemtobeeitherventedorflared.Ofthe6.5%ofallwells408
thatwerenotgreencompleted,54%wereflared.Thus3%ofthe1578wellsstudied409
ventedmethaneintotheatmosphere.410
21
Thewellsthatventedmethanetotheatmospheredidsoattherateof765411
Mcsf/completion.Themaximumgasthatcouldbeventedfromthenon‐greencompleted412
wellswasestimatedbycalculatingthesonicventingratefromthechoke(orifice)sizeand413
sourcegastemperatureofthewell,usingaformularecommendedbytheEPA.Sincemany414
wellsmightventatsub‐sonicrates,whichwouldbeless,thisisanupperboundonthe415
ventingrate.Thetotalventedvolumewasobtainedbymultiplyingthisventingratebythe416
knowndurationofventingduringwellcompletion.Theseventedvolumesrangedfrom417
340to1160Mscf,withanaverageof765Mscf.Theventingfromanaverage418
unconventionalshalegaswellindicatedbytheDevonstudyisthus~23Mscf(=0.03x765419
Mscf),whichissimilartothe18.33McfEPA(2010)estimatesisventedduringwell420
completionofaconventionalgaswell(halfventedandhalfflared).Sinceventingduring421
wellcompletionandworkoverconventionalgaswellsisestimatedat0.01%ofproduction422
(e.g.,Howarthetal.,2011),thiskindofventingisinsignificantforbothunconventionaland423
conventionalwells.424
TheunconventionalgasleakagerateindicatedbytheDevondataisverydifferentfromthe425
4587MscftheEPA(2010)inferredwasventedduringwellcompletionandworkoverfor426
unconventionalgaswellsfromtheamountofgascapturedinaverylimitednumberof427
“greencompletions”reportedtothembyindustrythroughtheirGasSTARprogram.In428
their2010backgroundtechnicalsupportdocumenttheEPAassumedthatthiskindof429
“green”capturewasveryrare,andthatthegaswasusuallyeitherventedorflared.430
Assumingfurtherthatthegaswasvented50%ofthetime,theEPAconcludedthat4587431
Mscfwasventedtotheatmosphereandthatunconventionalwellsvent250times432
(=4587/18.3)moremethaneduringwellcompletionandworkoverthanconventionalgas433
wells.TheEPA(2010)studyisa“BackgroundTechnicalSupportDocument”andnotan434
officialreport.Itwasprobablyneverintendedtobemorethananoutlineofanapproach435
andaninitialestimate,andtheEPAhassincecautionedthattheyhavenotreviewedtheir436
analysisindetailandcontinuetobelievethatnaturalgasisbetterfortheenvironmentthan437
coal(Fulton,2011).NeverthelesstheEPA(2010)reportsuggestedtomanythatthe438
leakageduringwellcompletionandworkoverforunconventionalgaswellscouldbea439
substantialpercentage(~2.5%)ofproduction,andmanyacceptedthissuggestionwithout440
22
furthercriticalexaminationdespitethefactthatthesafetyimplicationsofthemassive441
ventingimpliedbytheEPAnumbersshouldhaveraisedquestions(e.g.,Cathlesetal.,442
2012a,b).443
Onceawellisinplace,theleakageinvolvedinroutineoperationofthewellsiteandin444
transportingthegasfromthewelltothecustomeristhesameforanunconventionalwell445
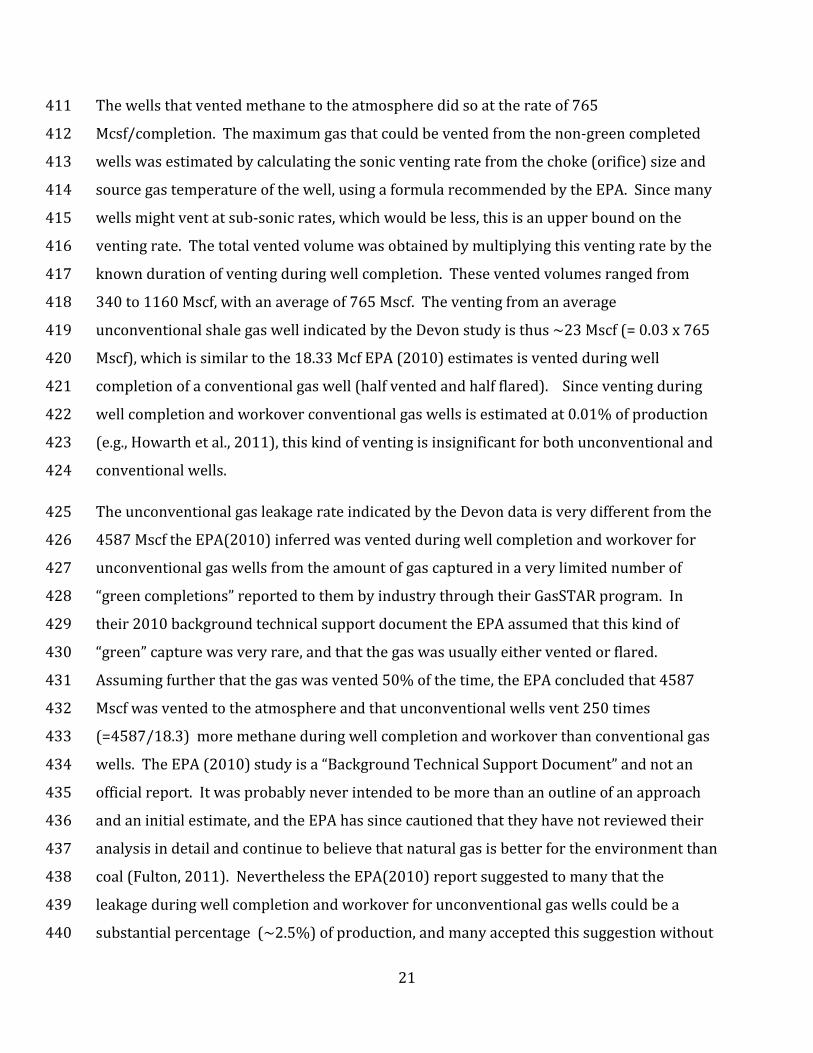
asitisfromaconventionalwell.WhatweknowaboutthisleakageissummarizedinTable446
2.Routinesiteleaksoccurwhenvalvesareopenedandclosed,andleakageoccurswhen447
thegasisprocessedtoremovingwaterandinertcomponents,duringtransportationand448
storage,andintheprocessofdistributiontocustomers.Thefirstmajorassessmentof449
theseleakswascarriedoutbytheGasResearchInstitute(GRI)andtheEPAin1997and450
theresultsareshowninthesecondcolumnofTable2.AppendixAofEPA(2010)givesa451
detailedandveryspecificaccountingofleaksofmanydifferentkinds.Thesenumbersare452
summedintothesamecategoriesanddiaplayedincolumn3ofTable2.EPA(2011)found453
similarleakagerates(column4).Skone(2011)assessedleakagefrom6classesofgas454
wells.WeshowhisresultsforunconventionalgaswellsintheBarnettShaleincolumn5of455
Table2.Hisotherwellclassesaresimilar.Venkatishetal(2011)carriedoutan456
independentassessmentthatisgivenincolumn6.Therearevariationsinthese457
assessments,butoverallaleakageof~1.5%ofproductionissuggested.Additional458
discussionofthisdataanditscompilationcanbefoundinCathlesetal.(2012)andCathles459
(2012).460
Table2.Leakageofnaturalgasthatiscommontobothconventionalandunconventionalgaswellsinperentof461gasproduction.462
GRI‐EPA
(1997)
EPA
(2010)
EPA
(2011)
Skone
(2011)
Venkatish
eta.(2011)
Routinesiteleaks 0.37% 0.40% 0.39%
Processing 0.15% 0.12% 0.16% 0.21% 0.42%
Transportation&storage 0.48% 0.37% 0.40% 0.40% 0.26%
Distribution 0.32% 0.22% 0.26% 0.22%
Totals 1.32% 1.11% 1.21%
23
463
Basedontheabovereviewthenaturalgasleakagerateappearstobenodifferentduring464
thedrillingandwellpreparationofunconventional(tightshalesdrilledhorizontallyand465
hydrofractured)gaswellsthanforconventionalgaswells,andtheoverallleakagefromgas466
wellsisprobably<1.5%ofgasproduction.Intheircontroversialpapersuggestingthatgas467
couldbetwiceasbadacoalfromagreenhousewarmingperspective,Howarthetal(2011,468
2012)suggestedroutinesiteleakscouldbeupto1.9%ofproduction,leakageduring469
transportation,storage,anddistributioncouldbeupto3.6%orproduction,andgas470
leakagefromunconventionalgaswellsduringwellcompletionandworkovercouldbe471
1.9%ofproduction.Adding0.45%leakageforliquidunloadingandgasprocessing,the472
suggestedgasleakagecouldbe7.9%ofproduction,enoughto“undercutthelogicofitsuse473
asabridgingfuelinthecomingdecades,ifthegoalistoreduceglobalwarming.”474
ThebasisgivenbyHowarthetal.(2011)fortheirmorethan5foldincreaseinleakage475
duringtransportation,storage,anddistributionis:(a)aleakageinRussianpipelinesthat476
occurredduringthebreakupoftheSovietUnionwhichisirrelevanttogaspipelinesinthe477
U.S.,and(b)adebateontheaccountingofgasinTexaspipelinesthatconcernsroyalties478
andtaxreturns(Percival,2010).Howarthetal.suggestinthisTexascasethattheindustry479
isseekingtohidemethanelossesofmorethan5%ofthegastransmitted,butthe480
proponentsinthearticlestate“Wedon’tthinkthey’rereallylosingthegas,wejustthink481
they’renotpayingforit”.Intheir5foldincreaseinroutinegasleaks(fromtheaverage482
levelinTable2of0.38%to1.9%),Howarth’setal.(2011)citeaGAOstudyofventingfrom483
wellsinonshoreandoffshoregovernmentleasesthatdoesnotdistinguishventingfrom484
flaring.Lackingthisdistinction,itisnotsurprisingthatitconflictsdramaticallywiththe485
summariesinTable2.Wehavealreadydiscussedleakageduringwellcompletionand486
workoverandnotedthattheDevondataindicateHowarthetal.’s1.9%leakageatthis487
stageishugelyexaggerated(theDevondataindicatestheleakageis~0.01%andsimilarto488
thatfromconventionalgaswellcompletionsandworkovers).489
TherehavebeenanumberofpaperspublishedrecentlythatoffersupportforHowarth’s490
highleakageestimates.Hughes(2011)re‐interpreteddatapresentedinawidely491
24
distributedNETLpowerpointanalysisbySkone(2011).ByloweringSkone’sEstimated492
UltimateRecoveries(EUR)fortheBarnellShalefrom3Bcfto0.84Bcfwhilekeepingthe493
sameestimateofleakageduringwellcompletionandgasdelivery,Hughesincreased494
Skone’sleakageestimatesfrom2to6%ofproduction‐alevelwhichfallsmidwaybetween495
Howarth’slowandhighgasleakageestimates.Howeverleakageisafractionofwell496
production(awellthatdoesnotproducecannotemit),andthusisitbogustoreducethe497
EUR(thedenominator)withoutalsoreducingthenumerator(theabsoluteleakageofthe498
well).Skone’sdatamustbeevaluatedonitsownterms,notsimplyadjustedtofitsomeone499
else’sconclusions.500
Petronetal.(2012)analyzedairsamplesatthe300mhighBolderAtmospheric501
Observatory(BAO)towerwhenthewindwastowarditfromacrosstheDenver‐Julesburg502
Basin(DJB).Gasesventingfromcondensate(condensedgasfromoilandwetgaswells)503
stocktanksintheDJBarerichinpropanerelativetomethane,whereastherawnaturalgas504
ventingfromgaswellsintheDJBcontainverylittlepropane.Fromtheintermediateratio505
ofpropanetomethaneobservedattheBAOtowerandestimatesofleakagefromthestock506
tanks,Petroneetal.calculatethattodilutethepropaneleakingfromthestocktankstothe507
propane/methaneratioobservedatthetower,~4%ofmethaneproducedbygaswellsin508
theDJBmustventintotheatmosphere.TheairsampledattheBAOtoweriscertainlynot509
simplyamixofrawnaturalgasandstocktankemissionsfromtheDJBasPetronetal.510
assume,however.IfthiswerethecasetherewouldbenooxygenintheairattheBAO511
towerlocation.Thebackgroundatmospheremustcertainlymixinwiththesetwo(and512
perhapsother)gassources.BackgroundairintheDenverareacontains~1800ppb513
methaneandverylittlepropane.Mixingwiththebackgroundatmospherecoulddilutethe514
stocktankemissionstothepropane/methaneratioobservedattheBAOtowerwithno515
leakagefromgaswellsintheDJBrequiredatall.Contrarytotheirsuggestion,theBAO516
towerdatareportedbyPetroneetal.placenoconstraintsatallonthegasleakageratesin517
theDJBwhatsoever.MoredetailsareinCathles(2012).518
Certainlythereismorewecouldlearnaboutnaturalgasleakagerates.Theissueis519
complicatedbecausegasisusedinthetransmissionprocesssoshrinkageofproductdoes520
notequatetoventing.Inadditionthereareconventionsandpracticesthatmakescientific521
25
assessmentdifficult.Despitethedifficulties,however,itappearsthattheleakagerateis522
lessthan2%ofproduction.523
Discussion 524
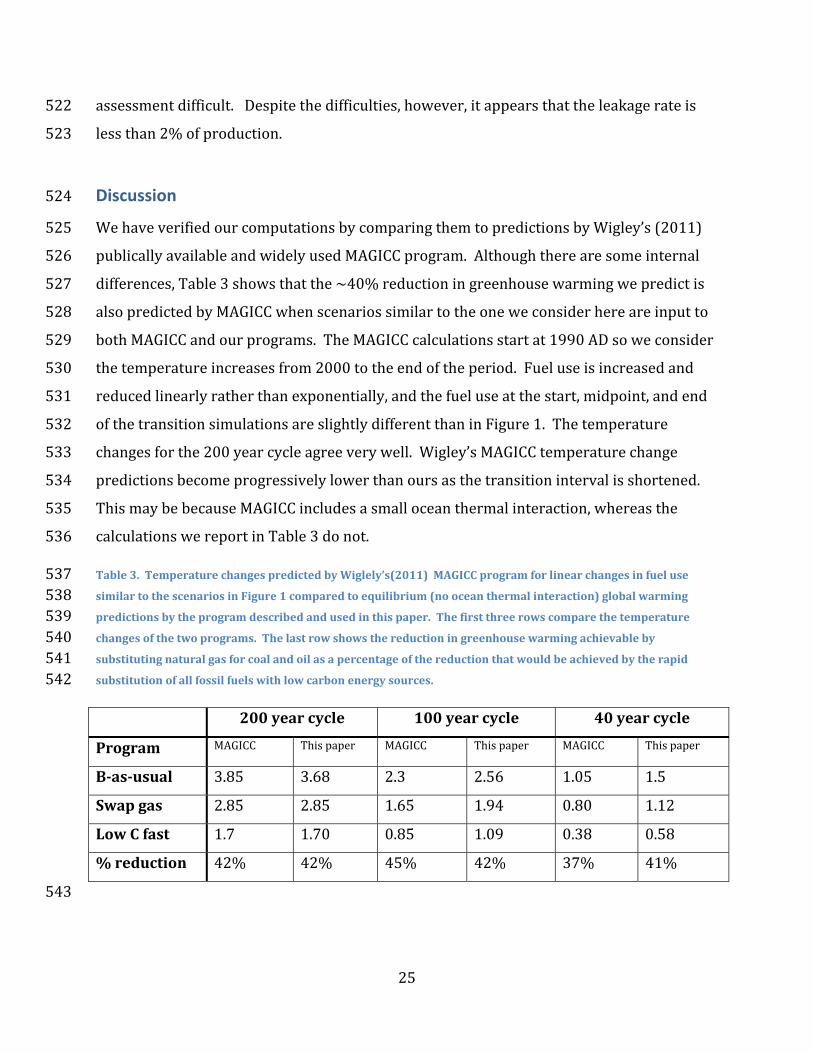
WehaveverifiedourcomputationsbycomparingthemtopredictionsbyWigley’s(2011)525
publicallyavailableandwidelyusedMAGICCprogram.Althoughtherearesomeinternal526
differences,Table3showsthatthe~40%reductioningreenhousewarmingwepredictis527
alsopredictedbyMAGICCwhenscenariossimilartotheoneweconsiderhereareinputto528
bothMAGICCandourprograms.TheMAGICCcalculationsstartat1990ADsoweconsider529
thetemperatureincreasesfrom2000totheendoftheperiod.Fueluseisincreasedand530
reducedlinearlyratherthanexponentially,andthefueluseatthestart,midpoint,andend531
ofthetransitionsimulationsareslightlydifferentthaninFigure1.Thetemperature532
changesforthe200yearcycleagreeverywell.Wigley’sMAGICCtemperaturechange533
predictionsbecomeprogressivelylowerthanoursasthetransitionintervalisshortened.534
ThismaybebecauseMAGICCincludesasmalloceanthermalinteraction,whereasthe535
calculationswereportinTable3donot.536
Table3.TemperaturechangespredictedbyWiglely’s(2011)MAGICCprogramforlinearchangesinfueluse537similartothescenariosinFigure1comparedtoequilibrium(nooceanthermalinteraction)globalwarming538predictionsbytheprogramdescribedandusedinthispaper.Thefirstthreerowscomparethetemperature539changesofthetwoprograms.Thelastrowshowsthereductioningreenhousewarmingachievableby540substitutingnaturalgasforcoalandoilasapercentageofthereductionthatwouldbeachievedbytherapid541substitutionofallfossilfuelswithlowcarbonenergysources.542
200yearcycle 100yearcycle 40yearcycle
Program MAGICC Thispaper MAGICC Thispaper MAGICC Thispaper
B‐as‐usual 3.85 3.68 2.3 2.56 1.05 1.5
Swapgas 2.85 2.85 1.65 1.94 0.80 1.12
LowCfast 1.7 1.70 0.85 1.09 0.38 0.58
%reduction 42% 42% 45% 42% 37% 41%
543
26
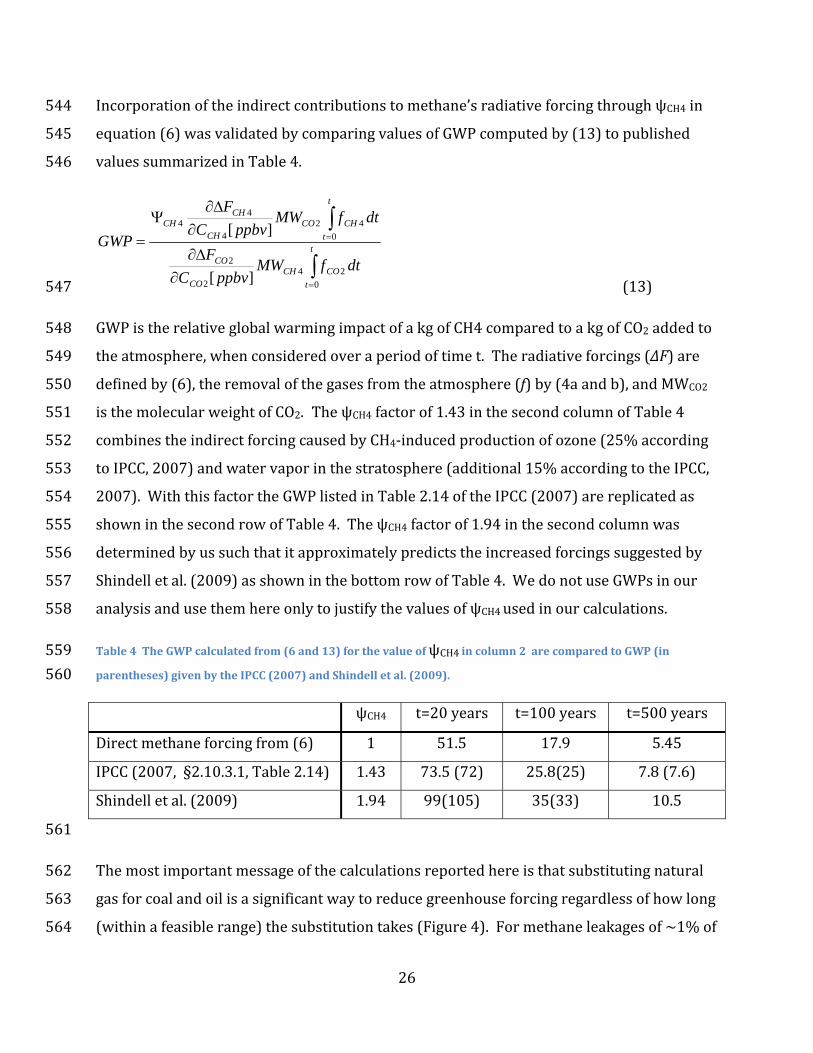
Incorporationoftheindirectcontributionstomethane’sradiativeforcingthroughψCH4in544
equation(6)wasvalidatedbycomparingvaluesofGWPcomputedby(13)topublished545
valuessummarizedinTable4.546
t
t
COCHCO
CO
t
t
CHCOCH
CHCH
dtfMWppbvC
F
dtfMWppbvC
F
GWP
0
242
2
0
424
44
][
][
(13)547
GWPistherelativeglobalwarmingimpactofakgofCH4comparedtoakgofCO2addedto548
theatmosphere,whenconsideredoveraperiodoftimet.Theradiativeforcings(∆F)are549
definedby(6),theremovalofthegasesfromtheatmosphere(f)by(4aandb),andMWCO2550
isthemolecularweightofCO2.TheψCH4factorof1.43inthesecondcolumnofTable4551
combinestheindirectforcingcausedbyCH4‐inducedproductionofozone(25%according552
toIPCC,2007)andwatervaporinthestratosphere(additional15%accordingtotheIPCC,553
2007).WiththisfactortheGWPlistedinTable2.14oftheIPCC(2007)arereplicatedas554
showninthesecondrowofTable4.TheψCH4factorof1.94inthesecondcolumnwas555
determinedbyussuchthatitapproximatelypredictstheincreasedforcingssuggestedby556
Shindelletal.(2009)asshowninthebottomrowofTable4.WedonotuseGWPsinour557
analysisandusethemhereonlytojustifythevaluesofψCH4usedinourcalculations.558
Table4TheGWPcalculatedfrom(6and13)forthevalueofψCH4incolumn2arecomparedtoGWP(in559
parentheses)givenbytheIPCC(2007)andShindelletal.(2009).560
ψCH4 t=20years t=100years t=500years
Directmethaneforcingfrom(6) 1 51.5 17.9 5.45
IPCC(2007,§2.10.3.1,Table2.14) 1.43 73.5(72) 25.8(25) 7.8(7.6)
Shindelletal.(2009) 1.94 99(105) 35(33) 10.5
561
Themostimportantmessageofthecalculationsreportedhereisthatsubstitutingnatural562
gasforcoalandoilisasignificantwaytoreducegreenhouseforcingregardlessofhowlong563
(withinafeasiblerange)thesubstitutiontakes(Figure4).Formethaneleakagesof~1%of564
27
totalconsumption,replacingcoalusedinelectricitygenerationand50%oftheoilusedin565
transportationwithnaturalgas(veryfeasiblestepsthatcouldbedrivenbythelowcostof566
methanealonewithnogovernmentencouragement)wouldachieve~40%ofthe567
greenhousewarmingreductionthatcouldbeachievedbytransitioningimmediatelytolow568
carbonenergysourcessuchaswind,nuclear,orsolar.Afastertransitiontolow‐carbon569
energysourceswoulddecreasegreenhousewarmingfurther,butthesubstitutionof570
naturalgasfortheotherfossilfuelsisequallybeneficialinpercentagetermsnomatterhow571
fastthetransition.572
Thebasisforthe~40%reductioningreenhouseforcingissimplythereductionoftheCO2573
putintotheatmosphere.Whengasleakageislow,thecontributionofmethaneto574
greenhousewarmingisnegligible(Figure3),andonlytheCO2inputcounts.Thereduction575
inCO2ventedbetweenthebusiness‐as‐usualandthesubstitute‐gasscenariosis44.1%of576
thereductionbetweenthebusiness‐as‐usualtothelow‐carbon‐fastscenarios.This577
fractionisindependentofthetransitionperiod;itisthesamewhetherthetransition578
occursover50yearsor200years.BecausethelossesofCO2fromtheatmosphere579
(equation4a)areproportionaltotheamountofCO2intheatmosphere,therelative580
amountsofCO2attheendofthetransitionaresimilartotheproportionsadded.Forthe581
sametransitionintervalalmostthesameproportionalamountsofCO2areremovedforall582
scenarios.Thusthefractionalsubstitute‐gasreductioninCO2intheatmosphereatthe583
endofallthetransitionintervalsremains44.1%althoughtherearesomevariationsinthe584
seconddecimalplace.ThecurvesshowninFigure7intersectthey‐axis(0%gasleakage)585
atfractionsslightlydifferentfrom44.1%becausetheradiativeforcingisnon‐linearwith586
respecttoCO2concentration(equation5a).Thelongertransitionperiodsshowlargernon‐587
lineareffectsbecausetheyputmoreCO2intotheatmosphere.Thenearlydirect588
relationshipbetweenreductionsinthemassofCO2ventedandthedecreaseinglobal589
warmingisapowerfulconceptualsimplificationthatisparticularlyusefulbecauseitisso590
easytocalculate,apointmadebyAllen(2009).591
Theglobalwarmingreductionfromswappinggasfortheotherfossilfuelsofcourse592
decreasesasmethaneleakageincreases.Butatlowleakagerates,thebenefitof593
substitutingnaturalgasremainscloseto40%.Inthecontextofswappinggasforcoal,the594
28
extramethaneemittedbylowlevelsofleakagehassuchatrivialclimateeffectthatitneed595
notbeconsideredatall.596
Sulfurdioxideadditionsarenotafactorinouranalysisbecausethesubstitute‐gasandlow‐597
carbon‐fastscenariosreducetheburningofcoaloverthegrowthperiodinanidentical598
fashion.ThusbothintroduceSO2identically,andthesmallwarmingeffectsoftheSO2,599
whichwilloccurnomatterhowcoalisretired,cancelinthecomparison.Intherealworld600
the“aerosolbenefit”ofcoalmustberemovedeventually(unlesswearetoburncoal601
forever),andthesooneritisremovedthebetterbothbecausethesmallwarmingits602
removalwillcausewillhavelessimpactwhentemperaturesarecooler,and,muchmore603
importantly,becausereplacingcoalsoonwillreduceCO2emissionsandleadtomuchless604
globalwarminginthelongerterm.605
Wigley’s(2011)decreaseingreenhousewarmingforthenaturalgassubstitutionhe606
definesissimilartothatwecomputehere.At0%leakage,Wigley(2011,hisFigure3)607
calculatesa0.35°Ccoolingwhichwouldbea0.45°CcoolingabsentthereducedSO2608
emissionsheconsiders.Wecalculateacoolingof~0.62°Cfor0%leakage.Ourcoolingis609
greaterthanhisatleastinpartbecauseourgassubstitutionscenarioreducestheCO2610
emissionsmorethanhis.Fromnearlythesamestart,ourgassubstitutionreducesCO2611
emissionsfromthebusiness‐as‐usual200yeartransitioncycleby743GtCwhereasWigley612
reducesCO2by425GtC.613
Thereareofcourseuncertaintiesinthekindofcalculationscarriedouthere,butthese614
uncertaintiesareunlikelytochangetheconclusionsreached.Carbondioxideisalmost615
certainlynotremovedfromtheatmosphereexactlyasdescribedbyequation(3).The616
uptakeofCO2maywellslowastheclimatewarms.Carbondioxideislesssolubleinwarm617
waterandthehalinecirculationmayslowastheseasurfacetemperatureincreases.The618
increaseinterrestrialCO2uptakefromCO2fertilizationmaybereducedbynitrogen619
limitations.AgooddiscussionoftheseissuesisprovidedinNRC(2011).Ebyetal.(2009)620
havesuggestedbasedonsophisticatedcoupledglobalmodelsthat~50%oftheintroduced621
CO2mayberemovedwithatimeconstantof130yearsand50%withanexponentialtime622
constantof2900years.Modificationsofequation(3)thatreduceCO2uptakeastheclimate623
29
warmswillmakethebenefitsofnotputtingCO2intotheatmosphere,forexampleby624
substitutinggasforcoal,evengreater,andtheargumentspresentedherestronger.625
Thetransmissionofheatfromthemixedtothedeeplayeroftheoceansisanunknown626
whichhasastrongimpactontransientglobalwarming.Forexample,ifheatenteredthe627
deeplayerwith10%oftheeasewithwhichitentersitfromtheatmospheresothat6281
s ~0.1,thedeeplayerwouldlargelylooseitscoolingeffectiveness(e.g.,ainequation11629
wouldhaveavalueof0.91).ThetransientresponsetoCO2forcingwouldberapid(occur630
at0.91mix),andtheoceanwouldreducetheequilibriumglobaltemperaturechangeby631
only9%.Therelativeratesatwhichheatistransferredintothemixedlayerandoutofit632
intothedeeplayerwouldappeartobeanimportantareaforfurtherinvestigation,633
especiallybecauseitimpactsourabilitytoinferpropervaluesintheequilibriumclimate634
forcing(seediscussioninNRC,2011).Oceanheatexchangedoesnotaffectthe635
comparativebenefitofsubstitutinggas,souncertaintiesintheoceanheatexchangeaernot636
ofconcerntotheconclusionswereachhere.637
ThecalculationsmadehereavoidtheuseofGWPfactors.ThedeficienciesintheGWP638
approacharediscussedwellbySolomonetal.(2011).Asisapparentfrom(13),theGWP639
metricrequiresthatthetimeperiodofcomparisonbespecified.Forashorttimeperiod,a640
shortlivedgaslikemethanehasahighGWP(e.g.,itis72timesmorepotentintermsof641
globalwarmingthanCO2whencomparedovera20year).Thenotionthatmethane642
emissionshave72timestheglobalwarmingimpactofCO2wouldtempteliminating643
methaneemissionsimmediately,andworryingaboutreducingCO2emissionslater.Onthe644
otherhandfora500yearperiod,theglobalwarmingimpactofakilogramofvented645
methaneisonly7.6thatofakilogramofCO2(GWPCH4=7.6,seeTable4),andthislow646
impactwouldsuggestdealingwithCO2emissionsfirstandthemethaneemissionslater,647
perhapsevensubstitutinggasforcoalandoil.AsSolomonetal.pointouttheGWPmetric648
speaksonlytothetimeperiodforwhichitiscalculatedandshedsnolightonthewhether649
CO2orCH4shouldbereducedfirst.650
30
100 500
time [years]200 300 400
0.5
1
1.5
2
Tem
pera
ure
Chan
ge[C
]
00
39.8%
10%leakage
nofo
ssil
fuel
s
Business as UsualSubstitute Gas
Low Carbon Fast
Cd/Cm=20, mix=5 yrsCH4
651
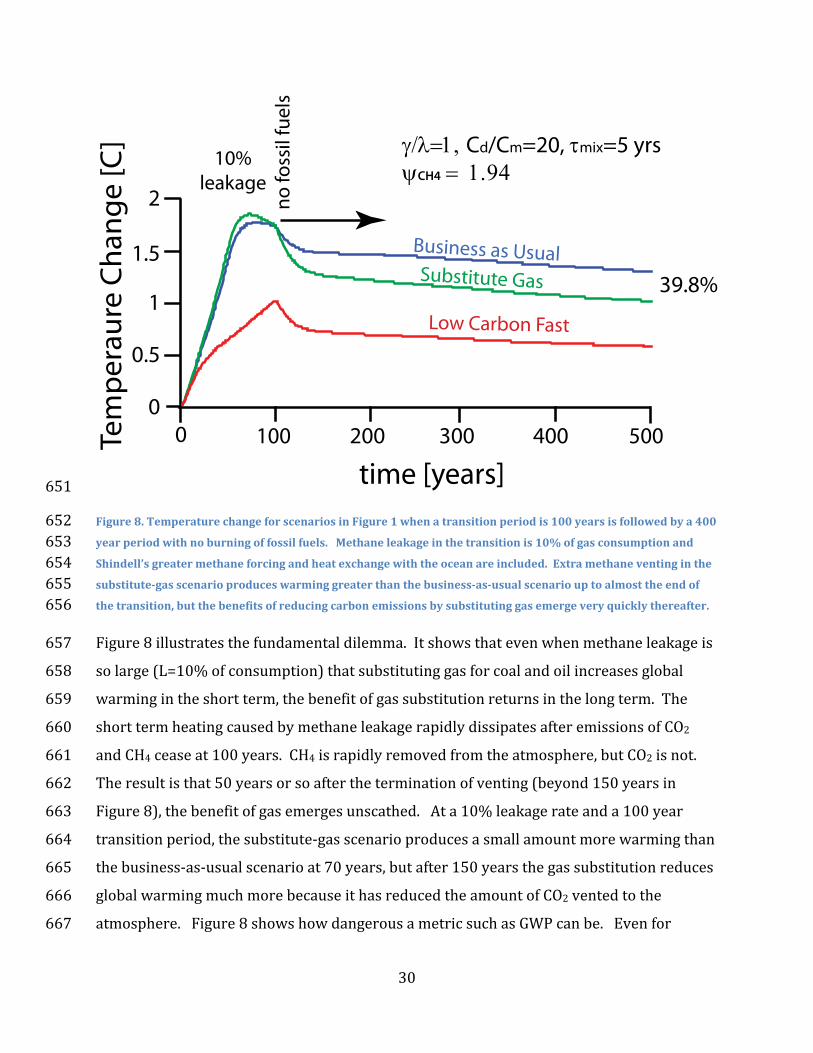
Figure8.TemperaturechangeforscenariosinFigure1whenatransitionperiodis100yearsisfollowedbya400652yearperiodwithnoburningoffossilfuels.Methaneleakageinthetransitionis10%ofgasconsumptionand653Shindell’sgreatermethaneforcingandheatexchangewiththeoceanareincluded.Extramethaneventinginthe654substitute‐gasscenarioproduceswarminggreaterthanthebusiness‐as‐usualscenariouptoalmosttheendof655thetransition,butthebenefitsofreducingcarbonemissionsbysubstitutinggasemergeveryquicklythereafter.656
Figure8illustratesthefundamentaldilemma.Itshowsthatevenwhenmethaneleakageis657
solarge(L=10%ofconsumption)thatsubstitutinggasforcoalandoilincreasesglobal658
warmingintheshortterm,thebenefitofgassubstitutionreturnsinthelongterm.The659
shorttermheatingcausedbymethaneleakagerapidlydissipatesafteremissionsofCO2660
andCH4ceaseat100years.CH4israpidlyremovedfromtheatmosphere,butCO2isnot.661
Theresultisthat50yearsorsoaftertheterminationofventing(beyond150yearsin662
Figure8),thebenefitofgasemergesunscathed.Ata10%leakagerateanda100year663
transitionperiod,thesubstitute‐gasscenarioproducesasmallamountmorewarmingthan664
thebusiness‐as‐usualscenarioat70years,butafter150yearsthegassubstitutionreduces665
globalwarmingmuchmorebecauseithasreducedtheamountofCO2ventedtothe666
atmosphere.Figure8showshowdangerousametricsuchasGWPcanbe.Evenfor667
31
methaneemissionsof9%ofproductionandShindell’sforcings,substitutinggasforcoalis668
worthwhileinthelongterm.AnalysesthatrelyonlyonGWPfactors,suchasthatof669
Howarthetal.(2011),missthismixofimpactscompletely,andseeonlythedamageof670
extramethaneemissionsintheshorttermorthebenefitsofgassubstitutioninthelong671
term,dependingontheGWPintervalselected.Fortunatelyitisveryeasytocarryoutthe672
necessaryconvolutionintegrals(equations5and11)asdonehereandavoidGWPmetrics673
altogether.AsstatedbySolomonetal.(2011)andotherswhotheycite,GWPfactors674
shouldsimplynotbeusedtoevaluatefuelconsumptionscenarios.675
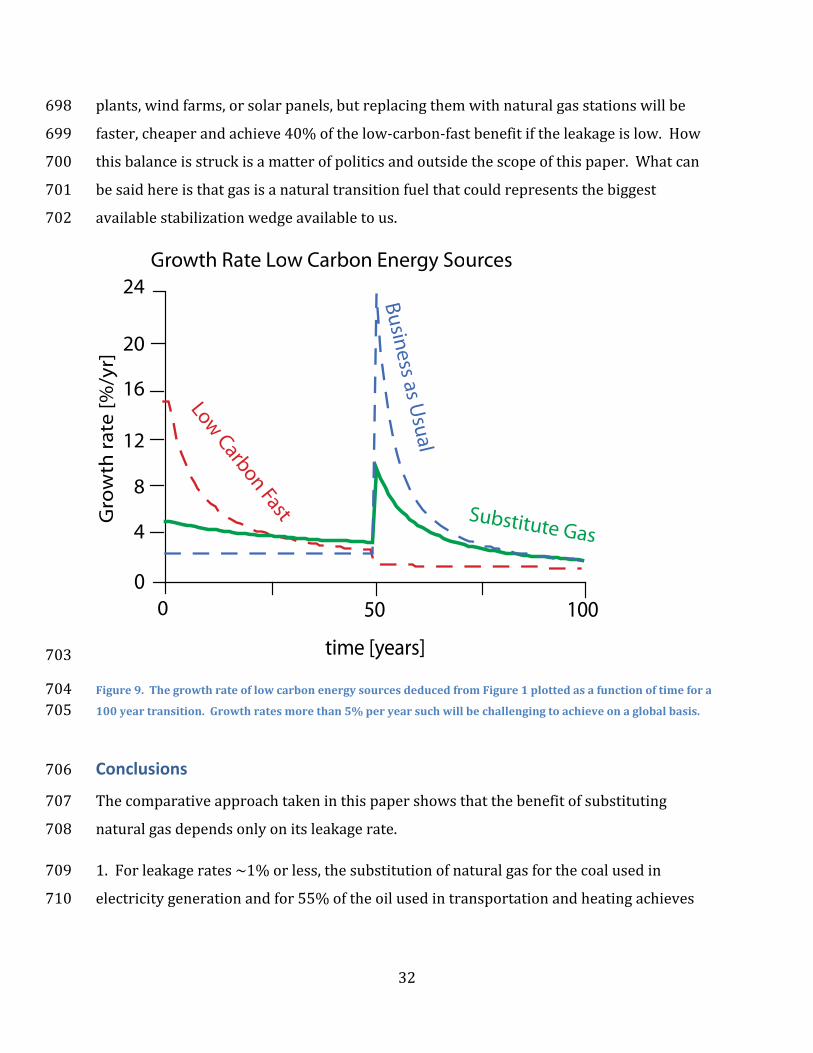
Finally,framingthefuelusescenariosintermsofexponentialgrowthanddeclineaswe676
havedonehereallowsthefeasibilityofimplementingthevariousscenariostobeexamined677
inapreliminaryfashion.Figure9showstherateofgrowthoflowcarbonenergyresources678
thatisrequiredbythefuelhistoriesinFigure1fora100yeartransition.Growthatmore679
than5%peryearwouldbechallenging.Figure9showsthatthelow‐carbon‐fastscenario680
inFigure1requiresanimmediate~16%peryear(butrapidlydeclining)growthinlow681
carbonenergysources.Thegrowthrateoflowcarbonenergysourcesattheendofthe682
growthperiodofthebusiness‐as‐usualscenarioisanevengreater24%peryear.Because683
thereistimetoplan,thiscouldbereducedbyphasinginlowcarbonenergysourcestoward684
theendofthefossilfuelgrowthperiod.Thesubstitute‐gasscenariohasamuchlower685
growthrequirementatthisstage,whichwouldmakethisscenariosubstantiallyeasierto686
accommodate.687
Anydecisiontosubstitutegasforcoalandoilofcourseinvolveseconomicandsocial688
consideration,aswellasclimateanalysis.Naturalgascanenablethetransitiontowindor689
solarenergybyprovidingthesurgecapacitywhenthesesourcesfluctuateandbackup690
whenthesesourceswane.Becauseofitswideavailabilityandlowcost,economicfactors691
willencouragegasreplacingcoalinelectricitygenerationandoilinsegmentsof692
transportation.ItisafueltheU.S.andmanyothercountriesneednotimport,soits693
developmentcouldincreaseemployment,nationalsecurity,andamorepositivebalanceof694
payments.Ontheotherhand,cheapandavailablegasmightunderminetheeconomic695
viabilityoflowcarbonenergysourcesanddelayatransitiontolowcarbonsources.Froma696
greenhousepointofviewitwouldbebettertoreplacecoalelectricalfacilitieswithnuclear697
32
plants,windfarms,orsolarpanels,butreplacingthemwithnaturalgasstationswillbe698
faster,cheaperandachieve40%ofthelow‐carbon‐fastbenefitiftheleakageislow.How699
thisbalanceisstruckisamatterofpoliticsandoutsidethescopeofthispaper.Whatcan700
besaidhereisthatgasisanaturaltransitionfuelthatcouldrepresentsthebiggest701
availablestabilizationwedgeavailabletous.702
50 100
time [years]
Gro
wth
rate
[%/y
r]
00
20
24
4
8
12
16
Business as Usual
LowCarbon Fast Substitute Gas
Growth Rate Low Carbon Energy Sources
703
Figure9.ThegrowthrateoflowcarbonenergysourcesdeducedfromFigure1plottedasafunctionoftimefora704100yeartransition.Growthratesmorethan5%peryearsuchwillbechallengingtoachieveonaglobalbasis.705
Conclusions 706
Thecomparativeapproachtakeninthispapershowsthatthebenefitofsubstituting707
naturalgasdependsonlyonitsleakagerate.708
1.Forleakagerates~1%orless,thesubstitutionofnaturalgasforthecoalusedin709
electricitygenerationandfor55%oftheoilusedintransportationandheatingachieves710
33
40%ofthereductionthatcouldbeattainedbyanimmediatetransitiontolow‐carbon711
energysources.712
2.This40%reductiondoesnotdependonthedurationofthetransition.A40%reduction713
isattainedwhetherthetransitionisover50yearsor200years.714
3.Forleakagerates~1%orless,thereductionofgreenhousewarmingatalltimesis715
relateddirectlytothemassofCO2putintotheatmosphere,andthereforetoreduce716
greenhouseforcingwemustreducethisCO2input.ComplexitiesofhowCO2isremoved717
andreductionsinSO2emissionsandincreasesincarbonblackandthelikedonotchange718
thissimpleimperativeandshouldnotbeallowedtoconfusethesituation.719
4.Atlowmethaneleakagerates,substitutingnaturalgasisalwaysbeneficialfroma720
greenhousewarmingperspective,evenforforcingsashighashavebeensuggestedby721
Shindelletal.(2009)andusedbyHowarthetal.(2011).Underthefastesttransitionthatis722
probablyfeasible(our50yeartransitionscenario),substitutionofnaturalgaswillbe723
beneficialiftheleakagerateislessthanabout7%ofproduction.Foramorereasonable724
transitionof100years,substitutinggaswillbebeneficialiftheleakagerateislessthan725
~19%ofproduction(Figure7).Thenaturalgasleakagerateappearstobepresentlyless726
than2%ofproductionandprobably~1.5%ofproduction.727
5.Evenifthenaturalgasleakageratewerehighenoughtoincreasegreenhousewarming728
(e.g.,theleakagewas10%ofmethaneconsumptionor9%ofmethaneproduction),729
substitutinggaswouldstillhavebenefitsbecausethereductionofCO2emissionswould730
leadtoagreaterreductioningreenhousewarminglater(Figure8).731
6.Gasisanaturaltransitionfuelbecauseitssubstitutionreducestherateatwhichlow732
carbonenergysourcesmustbelaterintroduced(Figure9)andbecauseitcanfacilitatethe733
introductionoflowcarbonenergysources.734
Thepolicyimplicationsofthisanalysisare:(1)reducetheleakageofnaturalgasfrom735
productiontoconsumptionsothatitis~1%ofproduction,(2)encouragetherapid736
substitutionofnaturalgasforcoalandoil,and(3)encourageasrapidaconversiontolow737
carbonsourcesofenergyaspossible.738
34
Acknowledgements 739
Thispaperwasgreatlyimprovedbythreeexcellentreviews,twoanonymousandoneby740
RayPierrehumbert.Raypointedouttheimportanceofoceanmixing,suggestedcasting741
fueluseintermsofexponentialgrowthanddecline,anddrewmyattentiontoimportant742
references(asdidtheotherreviewers).Iamindebtedtomypriorco‐authorsinthis743
subject(MiltonTaam,LarryBrown,andAndrewHunter)forcontinuingveryhelpful744
discussions,andtomembersofthegasindustrywhopointedoutdataandhelpedme745
understandthecomplexitiesofgasproduction.MiltonTaamdrewmyattentiontothe746
MAGICCprogramandshowedmehoweasyitwastouse,andalsopushedpersistentlyfor747
thebroaderviewofmethanesubstitutionshowninFigure8.Thepaperwouldnotbewhat748
itiswithoutthecontributionoftheseindividualsandIthankthemfortheirinput.749
References 750
Allen,MR,FrameDJ,HuntingforC,JonesCD,LoweJA,MeinshauseM,andMeinshausenN751
(2009)Warmingcausedbycumulativecarbonemissionstowardsthetrillionthtonne,752
Nature,458(7242),1163–1166,doi:10.1038/nature08019.753
CathlesLM,(2012)PerspectivesontheMarcellusgasresource:Whatbenefitsandrisksare754
associatedwithMarcellusgasdevelopment?,755
http://blogs.cornell.edu/naturalgaswarming/756
CathlesLM,BrownL,TaamM,HunterH(2012a)Acommentaryon“thegreenhouse‐gas757
footprintofnaturalgasinshaleformations”byRWHowarth,RSantoro,andAIngraffea,758
ClimaticChange,DOI:10.1007/s10584‐011‐0333‐0.759
http://www.springerlink.com/content/x001g12t2332462p/760
CathlesLM,BrownL,HunterA,andTaamM(2012b)Pressrelease:responsetoHowarthet761
al.’sreply(February29,2012),762
http://www.geo.cornell.edu/eas/PeoplePlaces/Faculty/cathles/Natural%20Gas/Respo763
nse%20to%20Howarth's%20Reply%20Distributed%20Feb%2030,%202012.pdf764
ClarkeLE,EdmondsJA,JacobyHD,PitcherH,ReillyJM,RichelsR(2007)Scenariosof765
GreenhouseGasEmissionsandAtmosphericConcentrations.Sub‐report2.1aof766
35
SynthesisandAssessmentProduct2.1.AReportbytheClimateChangeScienceProgram767
andtheSubcommitteeonGlobalChangeResearch,Washington,DC,154pp768
EbyM,ZickfeldK,MontenegroA,ArcherD,MeissnerKJ,andWeaverAJ(2009)Lifetimeof769
anthropogenicclimatechange:millennialtimescalesofpotentialCO2andsurface770
temperatureperturbations.JournalofClimate22(10):2501‐2511,771
DOI:10.1175/2008JCLI2554.1.772
EIA(2011)InternationalEnergyOutlook2011,Worldtotalenergyconsumptiontables,773
http://www.eia.gov/oiaf/aeo/tablebrowser/#release=IEO2011&subject=1‐774
IEO2011&table=1‐IEO2011®ion=0‐0&cases=Reference‐0504a_1630.775
EPA(2005)Compillationofairpollutionemissionfactors,vol.1,Stationarypointandand776
areasources:ReportAP‐42,OfficeofAirandRadiation,U.S.EPA,ResearchTriangel777
Park,NC27711.778
EPA(2010).GreenhouseGasEmissionsReportingfromthePetroleumandNaturalGas779
Industry.BackgroundTechnicalSupportDocument.U.S.EnvironmentalProtection780
Agency,WashingtonDC.781
http://www.epa.gov/climatechange/emissions/downloads10/Subpart‐W_TSD.pdf782
EPA(2011)Inventoryofgreenhousegasemissionsandsinks1990‐2009,EPA430‐R‐11‐783
005,55p,http://epa.gov/climatechange/emissions/usinventoryreport.html784
FultonM,MellquistN,KitaseiS,andBluesteinJ(2011)Comparinggreenhousegas785
emissionsfromnaturalgasandcoal.25Aug2011.WorldwatchInstitute/DeutscheBank.786
http://lockthegate.org.au/documents/doc‐305‐comparing‐life‐cycle‐greenhouse‐gas‐787
db.pdf788
GRI‐EPA(1997)MethaneEmissionsfromthenaturalgasindustry,ProjectSummary,789
HarrisonNR,ShiresTM,WesselsJK,andCowgillRM,EPA/600/SR‐96/080.790
http://www.docstoc.com/docs/19963708/Methane‐Emissions‐from‐the‐Natural‐Gas‐791
Industry.792
36
HarrisonM(2012)RevisedAttachment3:Gaswellcompletionemissionsdata,URS793
CorporationReport(akatheURSDevonStudy),http://anga.us/media/241555/anga‐794
axpc%20nsps%20memo%20revised.pdf795
HayhoeK,KheshgiHS,JainAK,WuebblesDJ(2002)Substitutionofnaturalgasforcoal:796
climaticeffectsofutilitysectoremissions.ClimaticChange54:107–139.797
HowarthR,SantoroT,andIngraffeaA(2011)Methaneandthegreenhousegasfootprintof798
naturalgasfromshaleformations,ClimaticChange,DOI10.1007/s10584‐011‐0061‐5.799
http://www.springerlink.com/content/e384226wr4160653/800
HowarthRW,SantoroR,andIngraffeaA(2011).Methaneandthegreenhousegasfootprint801
ofnaturalgasfromshaleformations.ClimaticChangeLetters,doi:10.1007/s10584‐802
011‐0061‐5.http://www.springerlink.com/content/e384226wr4160653/803
HughesD(2011)Lifecyclegreenhousegasemissionsfromshalegascomparedtocoal:an804
analysisfromtwoconflictingstudies,PostCarbonInstitute,21p,805
http://www.postcarbon.org/report/390308‐life‐cycle‐greenhouse‐gas‐emissions‐from.806
HultmanN,ReboisD,ScholtenM,andRamigC(2011).Thegreenhouseimpactof807
unconventionalgasforelectricitygeneration.Environ.Res.Lett.6:044008,808
doi:10.1088/1748‐9326/6/4/044008.http://iopscience.iop.org/1748‐809
9326/6/4/044008/810
IPCC(1990),HoughtonJT,JenkinsGJ,andEphraumsJJ(eds.),Reportpreparedfor811
IntergovernmentalPanelonClimateChangebyWorkingGroupI,CambridgeUniversity812
Press,Cambridge,GreatBritain,NewYork,NY,USAandMelbourne,Australia,410p.813
http://www.ipcc.ch/publications_and_data/publications_and_data_reports.shtml814
IPCC(1996),HoughtonJT,MeiraFilhoLG,CallanderBA,HarrisN,KattenbergA,and815
MaskellK,ed.,ClimateChange1995:TheScienceofClimateChange,Contributionof816
WorkingGroupItotheSecondAssessmentReportoftheIntergovernmentalPanelon817
ClimateChange,CambridgeUniversityPress,ISBN0‐521‐56433‐6(pb:0‐521‐56436‐0)818
http://www.ipcc.ch/publications_and_data/publications_and_data_reports.shtml819
37
IPCC(2001),HoughtonJT,DingY,GriggsDJ,NoguerM,vanderLindenPJ,DaiX,MaskellK,820
andJohnsonCA,ed.,ClimateChange2001:TheScientificBasis,ContributionofWorking821
GroupItotheThirdAssessmentReportoftheIntergovernmentalPanelonClimate822
Change,CambridgeUniversityPress,ISBN0‐521‐80767‐0,823
http://www.grida.no/publications/other/ipcc%5Ftar/?src=/climate/ipcc_tar/wg1/ind824
ex.htm(pb:0‐521‐01495‐6).825
http://www.ipcc.ch/publications_and_data/publications_and_data_reports.shtml826
IPCC(2007)ClimateChange2007:ThePhysicalScienceBasis.ContributionofWorking827
GroupItotheFourthAssessmentReportoftheIntergovernmentalPanelonClimate828
Change[Solomon,S,QinD,ManningM,ChenZ,MarquisM,AverytKB,TignorM,and829
MillerHL(eds.)].CambridgeUniversityPress,Cambridge,UnitedKingdomandNew830
York,NY,USA.831
http://www.ipcc.ch/publications_and_data/publications_and_data_reports.shtml832
MooreB(2011),Re:Oilandnaturalgassectorconsolidatedrulemaking,DocketIDNo.833
EPA‐HQ‐QAR‐2010‐0505(withattacheddatasetdocumentinggasleakagefrom834
unconventionalgaswellsof7companies).835
NRC(2011)Climatestabilizationtargets:Emissions,concentrations,andimpactsover836
decadestomillennia,NationalAcadamiesPress,Washington,D.C.,285p.837
http://www.nap.edu/catalog.php?record_id=12877838
PetronG,FrostGJ,MillerBRand27others(2012)Hydrocarbonemissionscharacterization839
intheColoradoFrontRange‐apilotstudy,Jour.Geophys.Res.,840
doi:10.1029/2011JD016360.841
http://www.agu.org/journals/jd/jd1204/2011JD016360/2011JD016360.pdf842
SaghafiA,WilliamsDJ,andLamaRD(1997)WorldwideMethaneEmissionsfrom843
UndergroundCoalMining,Proceedingsofthe6thInternationalMineVentilation844
Congress‐May17‐22,Chapter69MethaneDrainage,CSIRO,p441‐445.845
38
Schwartz,SE(2007)Heatcapacity,timeconstant,andsensitivityoftheEarth’sclimate846
system,JournalofGeophysicalResearch,112,D24S05,12p.,847
doi:10.1029/2007JD008746848
ShindellDT,FaluvegiG,KochDM,SchmidtGA,UngerN,BauerSE(2009)Improved849
attributionofclimateforcingtoemissions.Science326:716–718.850
SkoneTJ(2011)“LifeCycleGreenhouseGasAnalysisofNaturalGasExtraction&Delivery851
intheUnitedStates”,oralpresentationatCornellUniversity,May12,2011,852
http://cce.cornell.edu/EnergyClimateChange/NaturalGasDev/Documents/PDFs/SKONE853
_NG_LC_GHG_Profile_Cornell_12MAY11_Final.PDF854
SolomonS,PierrehumbertR,MatthewsDandDanielJS(2011)Atmosphericcomposition855
irreversibleclimatechangeandmitigationpolicy,WorldClimateResearchProgramme,856
39p.,http://conference2011.wcrp‐climate.org/positionpapers.html857
VenkateshA,JaramilloP,GriffinWM,andMatthewsHS(2011)Uncertaintyinlifecycle858
greenhousegasemissionsfromUnitedStatesnaturalgasendusersanditseffectson859
policy,Environ.Sci.Technol.,45,8182‐8189.860
http://pubs.acs.org/doi/abs/10.1021/es200930h861
WigleyTML(2011)Coaltogas:theinfluenceofmethaneleakage,ClimaticChange,DOI862
10.1007/s10584‐011‐0217‐3.863
WigleyTML(2011)MAGICC/SCIGEN,http://www.cgd.ucar.edu/cas/wigley/magicc/864