assessing the effect of the transition to ifrs on equity
TRANSCRIPT
Accounting in Europe, Vol. 3, 2006
Assessing the Effect of the Transitionto IFRS on Equity: The Case of theFTSE 100
^SALLY AISBITT
The Open University Business School, Milton Keynes, UK
ABSTRACT The paper presents the results of an analysis of the reconciliations of equitypresented as part of the transition from UK Generally Accepted Accounting Principles(UK GAAP) to Intemational Financial Reporting Standards (IFRS) by the largest UKcompanies. While the overall effect on equity is not significant, the effect of the changein convention on individual line items could have important consequences for financialanalysis and contractual obligations. The level of variability between companies meansthat this change will demand attention to detail by users of financial statements. Thepaper provides a benchmark for comparison with companies from other accountingtraditions making the transition to IFRS.
1. Introduction
The transition to Intemational Financial Reporting Standards (IFRS) has beenexercising (mainly listed) companies in the European Union (FU) and beyondfor accounting periods beginning on or after 1 January 2005. Controversies sur-rounding individual standards, for example, IAS 39, have been widely reported(e.g. Walton, 2004) and there have been discussions of the extent to which compa-nies (e.g. PricewaterhouseCoopers, 2004) and analysts (e.g. KPMG, 2005) are pre-pared for the change. One criticism of IFRS is that they are likely to make earningsmore volatile (e.g. in July 2003 Jacques Chirac complained to the president of theEuropean Commission that the excessive use of market values would increase vola-tility in the economy), however, it is still too soon to find evidence to support this.Perhaps more critical in the short term is the effect on equity and balance sheet lineitems. Ormrod and Taylor (2004) pointed out the consequences for contractualobhgations of changing the methods of arriving at year end balances and therehave been instances of companies needing to restructure their financing to ensureobligations can still be met when financial accounts are produced under IFRS.
0963-8180 Pdnt/06/030117-17 © 2006 European Accounting AssociationPublished by Routiedge Journals, Taylor & Francis, on behalf of the EAA

118 S. Aisbitt
This paper provides an assessment of the effect of the change to IFRS on thefigures for equity reported by some ofthe UK's (and the EU's) largest companiesin their consolidated accounts. The impact of the move to IFRS is quantified on asystematic basis and reasons are put forward to explain the variations betweencompanies. This information is informative for other UK companies who arenow permitted to use IFRS in unlisted and individual financial statements. Italso provides a comparator for studies being conducted elsewhere on the effectof changing from other national Generally Accepted Accounting Principles(GAAP).
The remainder of this paper is organised as follows. Section 2 describes thebackground and justification for this paper and the research questions generated;the data and methods employed in this research are set out in Section 3 and theresults are presented in Section 4. The paper concludes with a discussion of thefindings and some indications of future developments.
2. Background and Research Questions
In July 2002 the European Union approved a Regulation (EU, 2002) that requiredlisted companies to present their consolidated financial statements in accordancewith IFRS' for accounting periods beginning on or after 1 January 2005. Thiswas part of a wider global move towards convergence on a single set of accountingstandards that had become ever stronger in the previous decade, when the Inter-national Organization of Securities Commissions (IOSCO) had been working onits 'global passport' for stock exchange listing. The Norwalk agreement betweenthe Financial Accounting Standards Board (FASB) and the International Account-ing Standards Board (IASB) in November 2002 increased the momentum. Thenumber of countries permitting or requiring IFRS increased from this point andover 100 countries permitted or required the use of IFRS in the 2005 financial state-ments of some or all companies (www.iasplus.com/country/uesias.htm updated 22March 2006).
Prior to this point the literature on IFRS has concentrated on (a) the desirability(or otherwise) of standardisation, harmonisation and convergence of regulations(e.g. Mueller, 1967, p. 224; Briston, 1978, 1989; Cairns, 1997; Flower, 1997);and (b) compliance with IFRS by companies that had already implementedthem (e.g. Street et al., 1999; Street and Bryant, 2000; Cairns, 2001; Street andGray, 2001; Sucher and Alexander, 2002). In Europe some companies' processesfor making the transition to IFRS have been exposed in the 'grey' literature (e.g.Como and Silvestri, 2001; Hutten, 2005). However, this does not capture thebigger picture and/or allow for generalisation. Some of the professional firms(e.g. reports on any of the Big 4's websites) and the professional publications(e.g. Company Reporting has regular updates) have considered the effect of thechange on particular companies and/or particular areas of the financial state-ments. Nobes (forthcoming) identified a need to document the starting point ofthe change to IFRS, as choices made at the transition can have a long-term

The Case of the FTSE 100 119
effect on IFRS financial statements. This paper aims to provide that documenta-tion for the UK.
The greater use of fair values in financial statements than under some otherconventions (including former UK practice) is expected to make earnings morevolatile. However, the extent of that volatility cannot be measured until thereis a longer time series of data available. In the meantime, there are some concernsabout the effect of the transition to IFRS on balance sheet figures. The firstresearch question addressed is to establish the effect that the change to IFRShas on reported net assets/equity (Ql).
Changes in balance sheet figures have consequences not only for the analysts'or investors' perceptions of companies' financial position, but also for compa-nies' contractual obligations. Ormrod and Taylor (2004) highlighted that thechange in accounting basis to IFRS could have unexpected consequences forreported figures that were unrelated to changes in the company's circumstances.In turn these new figures could lead to a company being in breach of the terms ofloan covenants. Ormrod and Taylor (2004) provide an example of the need toincrease the level of provision for deferred tax (on revalued buildings) underIFRS compared with UK practice. This could have a significant effect on a com-pany's liabilities and associated ratios. For this reason the research has sought toidentify the effect ofthe change to IFRS on individual balance sheet line items (Q2).
As part of the transition to IFRS, the Committee of European Stock ExchangeRegulators (CESR) recommended (CESR, 2003) that companies should explainthe process of transition in their annual reports and should provide informationabout the major differences identified under existing accounting policies andIFRS. This recommendation was given mandatory status by the London StockExchange. In this paper the question is asked as to whether the areas of differenceidentified match those about which users were forewarned in previous annualreports (Q3).
Discussions in the professional press have tended to centre on particular stan-dards (notably IAS 39) and the effect that they might have on financial state-ments. Consequently, the final research question assesses the effect ofindividual standards on the balance sheet (Q4). This provides additional infor-mation to that derived from answering the second research question as itfocuses on the effect of changes in recognition and measurement, whereas Q2necessarily also captures changes in classification.
3. Data and Methods
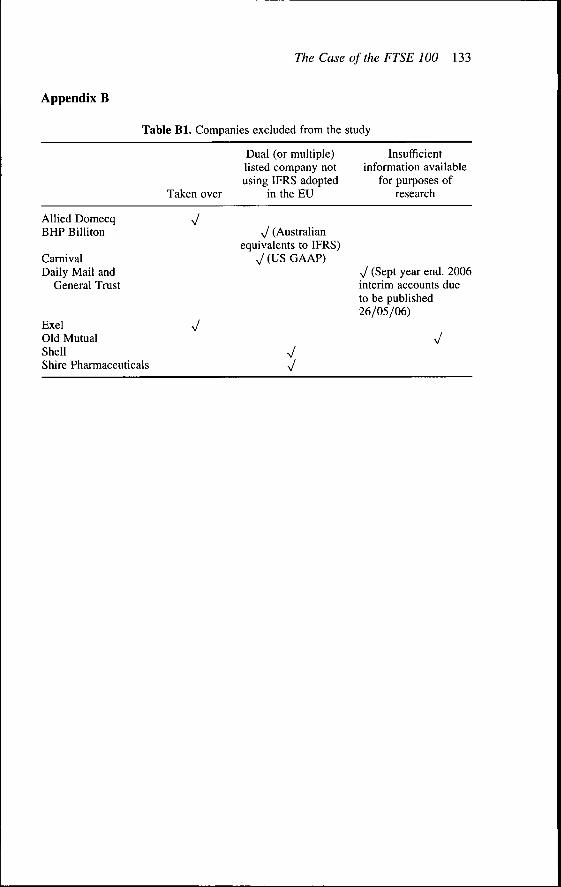
The paper concerns the companies that formed the UK's FTSE 100 index at 1January 2005.^ Companies included in the research are listed in AppendixA. Some companies were excluded from the analysis (Appendix B) due to alack of suitable data. The investigation was based on the published reconcilia-tions of balance sheets published under UK rules to the balance sheets restated
120 S. Aisbitt
under IFRS that will become the comparative figures in the first IFRS financialstatements. These reconciliations were published in a number of different ways:
Accompanying the annual report (12)Accompanying Interim Reports (7)Separate IFRS transition document/press release/presentation (73).
Due to the variation in the source of the data and the other issues discussedbelow, data were 'hand collected' from the reconciliations and transferred to aspreadsheet as the basis for further analysis.
The most detailed source of infonnation available was used, giving preferenceto 'audited' over unaudited information.^ In a number of instances more detailedinformation was published in the course of the research and/or information inreconciliations was amended as companies conducted more detailed analyses.The reconciliations reported on in this paper were the most up to date publishedat the beginning of May 2006.
Although a number of different sources were used, they were all providing thesame information - a reconciliation of the previously published UK GAAPbalance sheet to the IFRS balance sheet that will be the comparative figuresfor the first IFRS financial statements. Sensitivity analysis did not suggest thatthe different sources affected the data or the conclusions drawn from them.
In common with other aspects of financial statements prepared under IFRS (seeHoogendoom, 2006), the reconciliations were not prepared to a standard format,which presented some challenges for the researchers. Most companies had (even-tually!) provided reconciliations by line item and by standard. The researchsought to replicate this split in our research. Where information was not presentedin this format, it was deduced as well as possible from the information that wasavailable. Each company's information was examined independently by tworesearchers and a consensus found.
Not all companies distinguish between adjustments caused by changes due todifferences in measurement and changes due to differences in presentation. Bothkinds of adjustment were captured in the analysis as both will affect the newfigures. Financial companies were analysed separately for some research ques-tions due to the specialised nature of their business and the way balances arereported.
Most companies used pounds, but some had reported in US dollars or euros.Where the analysis required a common currency, balances were converted atthe rate on the balance sheet date.
In the UK companies can choose the date of their year end, so information waspublished gradually according to the different year ends. Another consequence ofthe differing year ends is that companies may not all be moving from or imple-menting precisely the same standards, due to variations in the effective dates. Inaddition, companies took different approaches to the exemptions available underIFRS 1, for example, some companies incorporated the effect of IAS 32/9 in the
The Case of the FTSE 100 121
restated comparatives, while others delayed the implementation of those stan-dards until the first IFRS financial statements.
The detail provided by companies in their reconciliations varied, so thisresearch is based on the most detailed level of analysis available. For the purposesof this paper most standards were considered individually, but the effects ofadjustments related to the following standards were combined:
IAS 27/36/38 and IFRS 3IAS 19 and IFRS 2IAS 28/31IAS 32/39.
4. Results
The results are presented in accordance with the research questions that wereposed.
Ql Effect on Equity
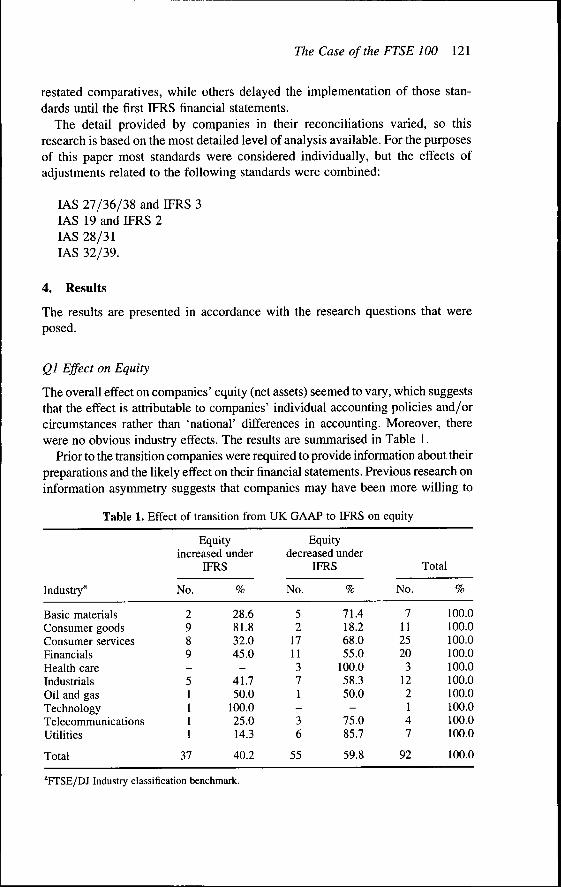
The overall effect on companies' equity (net assets) seemed to vary, which suggeststhat the effect is attributable to companies' individual accounting policies and/orcircumstances rather than 'national' differences in accounting. Moreover, therewere no obvious industry effects. The results are summarised in Table 1.
Prior to the transition companies were required to provide information about theirpreparations and the likely effect on their financial statements. Previous research oninformation asymmetry suggests that companies may have been more willing to
Table 1. Effect of transition from UK GAAP to IFRS on equity
Industry"
Basic materialsConsumer goodsConsumer servicesFinancialsHealth careIndustrialsOil and gasTechnologyTelecommunicationsUtilities
Total
Equityincreased under
No.
2989_51111
37
IFRS
%
28.681.832.045.0
_41.750.0
100.025.014.3
40.2
Equitydecreased under
No.
52
1711371-36
55
IFRS
%
71.418.268.055.0
100.058.350.0
-75.085.7
59.8
No.
7112520
3122147
92
Tolal
%
100.0100.0100.0100.0100.0100.0100.0100.0100.0100.0
100.0
"FTSE/DJ Industry classification benchmark.

122 5. Aisbitt
discuss the positive aspects of change (e.g. Clatworthy and Jones, 2003), which maybe related to the evidence suggesting markets respond more rapidly to 'bad news'than 'good news' (e.g. Basu, 1997). We compared the change in equity with thelevel of disclosure regarding the transition to IFRS in the annual report for theyear immediately preceding the first IFRS report. Companies were awarded asimple score of 1-3 based on the following criteria:
1. Perfunctory: mentioning the transition but giving no indication of whichrecognition and measurement issues were likely to affect tbe company.2. Adequate: individual recognition and measurement issues identified.3. Detailed: individual issues identified and also a discussion as to what theproblems were and possible impacts (usually with some quantification ofthese).
However, this was inconclusive, as the results in Table 2 demonstrate. Thisseems to suggest that the level of disclosure provided prior to the transitiongives little indication of the overall effect of the change of accounting convention.
The companies' net assets under the two accounting conventions were com-pared using a two-tailed Student's ?-test for paired samples. The result of0.8842 indicates that the net assets reported under IFRS are not significantlydifferent from those reported under UK GAAP. Nevertheless, while this maybe true for the overall effect of the transition, it is worth examining the analysisin greater detail.
Table 2. Relationship between change in equity and level of disclosure regarding tran-sition in 2004-2005 annual report
Financial Non-financial All companies
Correlation between 0.200 0.013 0.014level of disclosure in2004 accounts andchange in net assetsas a % of UK GAAPnet assets figure
Correlation between 0.222 0.001 0.076level of disclosure in2004 accounts andchange in net assetsin absolute terms''
"Square of Pearson product moment correlation coefiScient.''Exchange rates used to convert:US$ to £ 31 December 2004 1.9199USS to £ 31 March 2005 1.8896€ to £ 31 December 2004 1.4125.
The Case of the FTSE 100 123
Q2 Effect on Individual Line Items
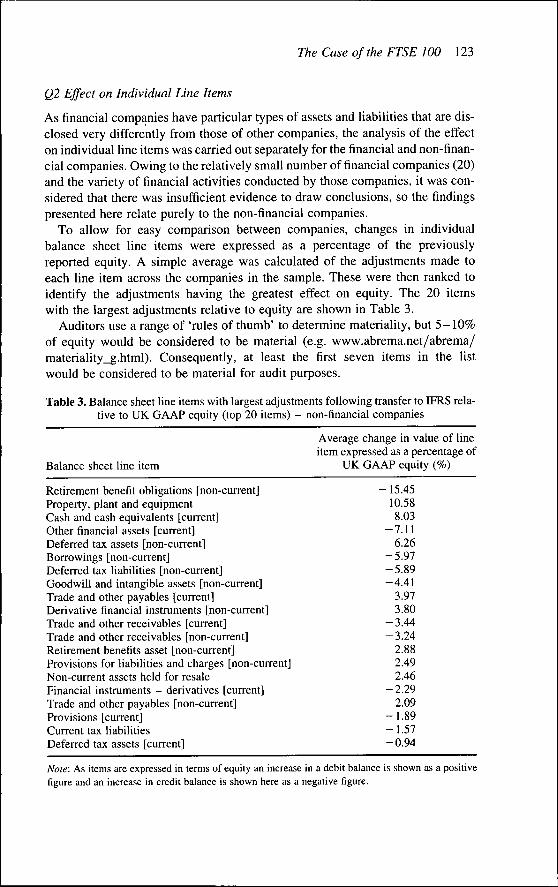
As financial companies have particular types of assets and liabilities that are dis-closed very differently from those of other companies, the analysis of the effecton individual line items was carried out separately for the financial and non-finan-cial companies. Owing to the relatively small number of financial companies (20)and the variety of financial activities conducted by those companies, it was con-sidered that there was insufficient evidence to draw conclusions, so the findingspresented here relate purely to the non-financial companies.
To allow for easy comparison between companies, changes in individualbalance sheet line items were expressed as a percentage of the previouslyreported equity. A simple average was calculated of the adjustments made toeach line item across the companies in the sample. These were then ranked toidentify the adjustments having the greatest effect on equity. The 20 itemswith the largest adjustments relative to equity are shown in Table 3.
Auditors use a range of 'rules of thumb' to determine materiality, but 5 -10%of equity would be considered to be material (e.g. www.abrema.net/abrema/materiality_g.html). Consequently, at least the first seven items in the listwould be considered to be material for audit purposes.
Table 3. Balance sheet line items with largest adjustments following transfer to IFRS rela-tive to UK GAAP equity (top 20 items) - non-financial companies
Average change in value of lineitem expressed as a percentage of
Balance sheet line item UK GAAP equity (%)
Retirement benefit obligations [non-current] - 15.45Property, plant and equipment 10.58Cash and cash equivalents [current] 8.03Other financial assets [current] —7.11Deferred tax assets [non-current] 6.26Borrowings [non-current] —5.97Deferred tax liabilities [non-current] —5.89Goodwill and intangible assets [non-current] -4.41Trade and other payables [current] 3.97Derivative financial instruments [non-current] 3.80Trade and other receivables [current] —3.44Trade and other receivables [non-current] —3.24Retirement benefits asset [non-current] 2.88Provisions for liabilities and charges [non-current] 2.49Non-current assets held for resale 2.46Financial instruments - derivatives [current] -2.29Trade and other payables [non-current] 2.09Provisions [current] —1.89Current tax liabilities — 1.57Deferred tax assets [current] — 0.94
Note: As items are expressed in terms of equity an increase in a debit balance is shown as a positivefigure and an increase in credit balance is shown here as a negative figure.

124 S. Aisbitt
The issues most affected by tbe change in convention are also interesting.In some instances (e.g. cash and cash equivalents and short-term investments)we seem to be picking up changes in the way in which items are being classifiedand presented. In others (e.g. property, plant and equipment) there seems to be achange in the measurement basis (perhaps with greater use of revaluations).The substantial changes in the retirement benefit obligation seem to be largelyassociated with an amendment to the basis of recognition - the habilities topay post-retirement benefits to employees are now been recognised in full inthe balance sheet of the company that employed them during their workinglife. (Previously such liabilities would have been in a note to the accountsand/or restricted to the financial statements of the company's pension fund.)
It is important to be aware that the above discussion is based on averages, somay not hold for all companies. A separate analysis of the standard deviation ofthe adjustments adds further to the debate. The key findings from that exami-nation are summarised in Table 4.
This demonstrates that for some of the issues with the highest level of changereported in Table 3, there was also the greatest level of variability noted inTable 4. This is important because it demonstrates the risks of drawing conclusionsfrom overall averages and the importance of considering each company's financial
Table 4. Balance sheet line items with largest variance in adjustments following transfer toIFRS relative to UK GAAP equity (top 20 items) - non-financial companies
Standard deviation of changein value of line item
expressed as a percentage ofUK GAAP equity (%)
Goodwill and intangible assets [non-current] 112.88Property, plant and equipment 79.41Cash and cash equivalents [current] 61.43Other financial assets [current] 59.13Trade and other payables [current] 47.98Derivative financial instruments [non-current] 39.23Borrowings [non-current] 34.99Retirement benefit obligations [non-current] 29.70Retirement benefits asset [non-current] 21.80Trade and other receivables [non-current] 21.18Trade and other payables [non-current] 14.45Trade and other receivables [current] 13.37Deferred tax liabilities [non-current] 13.17Financial instruments - derivatives [current] 12.78Deferred tax assets [non-current] 12.43Non-current assets held for resale 11.62Provisions for liabilities and charges [non-current] 10.50Borrowings [current] 7.78Current tax liabilities 7.10Inventories [current] 7.09
The Case of the FTSE 100 125
positioti individually. Goodwill and intangible assets appears in Table 4 altbougb itdid not feature in Table 3. Tbis is interesting as goodwill was one of tbe issuesmentioned frequently in earlier narrative disclosures, althougb the effect on tbereconciliations is clearly variable.
Q3 Comparison of Line Items Affected with Previous Narrative Disclosures
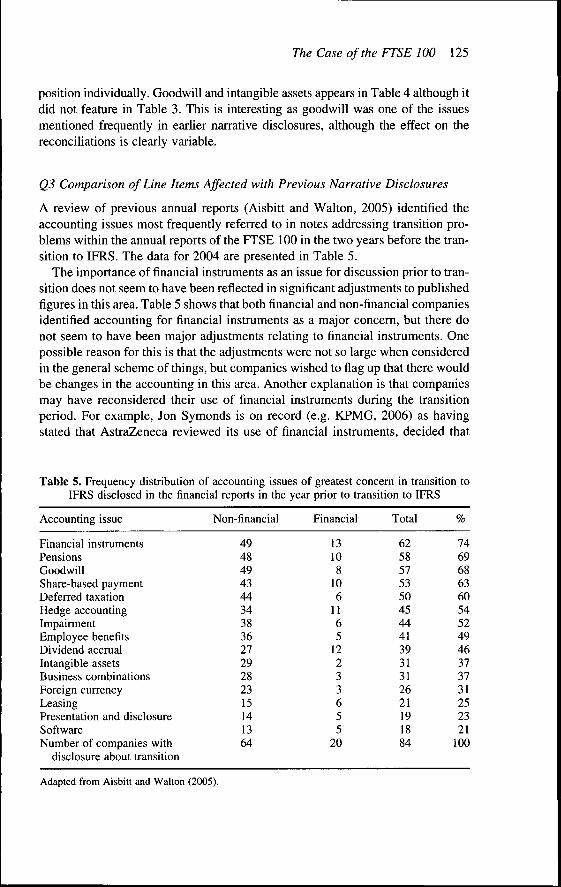
A review of previous annual reports (Aisbitt and Walton, 2005) identified tbeaccounting issues most frequently referred to in notes addressing transition pro-blems witbin tbe annual reports of tbe FTSE 100 in tbe two years before tbe tran-sition to IFRS. Tbe data for 2004 are presented in Table 5.
Tbe importance of financial instruments as an issue for discussion prior to tran-sition does not seem to bave been refiected in significant adjustments to publisbedfigures in tbis area. Table 5 sbows tbat botb financial and non-financial companiesidentified accounting for financial instruments as a major concern, but tbere donot seem to bave been major adjustments relating to financial instruments. Onepossible reason for tbis is tbat tbe adjustments were not so large wben consideredin tbe general scbeme of tbings, but companies wisbed to fiag up tbat tbere wouldbe cbanges in tbe accounting in tbis area. Anotber explanation is that companiesmay bave reconsidered their use of financial instruments during the transitionperiod. For example, Jon Symonds is on record (e.g. KPMG, 2006) as havingstated that AstraZeneca reviewed its use of financial instruments, decided that
Table 5. Frequency distribution of accounting issues of greatest concern in transition toIFRS disclosed in the financial reports in the year prior to transition to IFRS
Accounting issue
Financial instrumentsPensionsGoodwillShare-based paymentDeferred taxationHedge accountingImpairmentEmployee benefitsDividend accrualIntangible assetsBusiness combinationsForeign currencyLeasingPresentation and disclosureSoftwareNumber of companies with
disclosure about transition
Non-financial
49484943443438362729282315141364
Financial
13108
106
1165
12233655
20
Total
62585753504544413931312621191884
%
746968636054524946373731252321
100
Adapted from Aisbitt and Walton (2005).
126 S. Aisbitt
they were not necessary from a strategic point of view, discontinued their use andthus avoided the need to apply IAS 39.
The fact that only a relatively small proportion of companies mentioned eventhese most popular areas of adjustments prior to the publication of the reconcilia-tions seems to be an indicator of the variabihty of reconciliations as discussedabove rather than any indicator of a lack of thorough preparation.
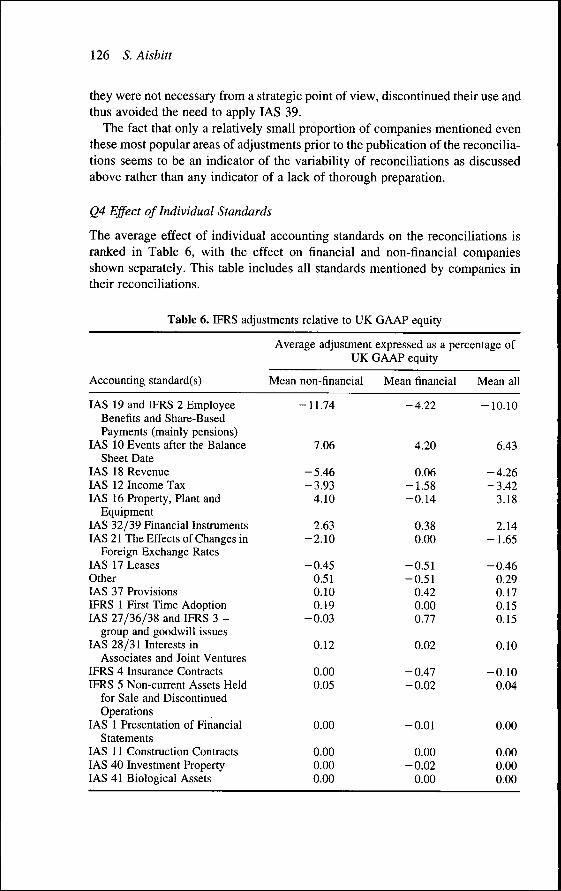
Q4 Effect of Individual Standards
The average effect of individual accounting standards on the reconciliations isranked in Table 6, with the effect on financial and non-financial companiesshown separately. This table includes all standards mentioned by companies intheir reconcihations.
Table 6. IFRS adjustments relative to UK GAAP equity
Average adjustment expressed as a percentage ofUK GAAP equity
Accounting standard(s)
IAS 19 and IFRS 2 EmployeeBenefits and Share-BasedPayments (mainly pensions)
IAS 10 Events after the BalanceSheet Date
IAS 18 RevenueIAS 12 Income TaxIAS 16 Property, Plant and
EquipmentIAS 32/39 Financial InstrumentsIAS 21 The Effects of Changes in
Foreign Exchange RatesIAS 17 LeasesOtherIAS 37 ProvisionsIFRS 1 First Time AdoptionIAS 27/36/38 and IFRS 3 -
group and goodwill issuesIAS 28/31 Interests in
Associates and Joint VenturesIFRS 4 Insurance ContractsIFRS 5 Non-current Assets Held
for Sale and DiscontinuedOperations
IAS 1 Presentation of FinancialStatements
IAS 11 Construction ContractsIAS 40 Investment PropertyIAS 41 Biological Assets
Mean non-financial
-11.74
7.06
-5.46-3.93
4.10
2.63-2.10
-0.450.510.100.19
-0.03
0.12
0.000.05
0.00
0.000.000.00
Mean financial
-4.22
4.20
0.06-1.58-0.14
0.380.00
-0.51-0.51
0.420.000.77
0.02
-0.47-0.02
-0.01
0.00-0.02
0.00
Mean all
-10.10
6.43
-4.26-3.42
3.18
2.14-1.65
-0.460.290.170.150.15
0.10
-0.100.04
0.00
0.000.000.00

The Case of the FTSE 100 111
While this table reinforces the importance of adjustments in some areas (e.g.pensions and property plant and equipment) that were identified in the lineitem analysis, it also adds to the information by highlighting other areas. Theadjustments classified under IAS 10 are usually the reversal of the accrual forthe final dividend to be paid out of the current year's profit. Such accruals arenot made under IFRS as (a) the proposed dividend does not meet the Frameworkdefinition of a liability (there is no past event that acts as a trigger) and (b) IAS 37requires there to be a legal or constructive obligation, and the IASB does not con-sider 'economic compulsion' (i.e. investors expect a dividend) as a constructiveobligation.
The importance of differences between the UK and IFRS regulations onrevenue (IAS 18) are picked up in Table 6, although this was less obvious inTable 3. Given the discussion above and the more general controversy aboutIAS 32 and 39, the effect on these financial statements is perhaps less thanmight have been anticipated. Nevertheless, these standards were less contentiousin the UK than in some other countries, such as France; and the UK's AccountingStandards Board supported application of the full standard rather than the EU's'carved out' version. Notwithstanding this, there is a noticeable differencebetween the financial and non-financial companies.
As with the analysis of the adjustments by line item, it is worth considering thevariance of the adjustments for particular accounting standards. These are pre-sented in Table 7.
Once again this information provides a richer picture of the reconciliations andhighlights the level of variability between companies. It is perhaps unsurprisingthat the level of changeability is less among financial companies than among thefull sample.
It is worth reiterating at this stage that a limiting factor on the analysis was thelevel of disclosures provided by companies. The recognition and subsequentremeasurement of goodwill seemed to be an important factor for a number ofcompanies, but the level of infonnation published limited the extent of analysisthat could be performed here. The figures in Tables 6 and 7 are also affected by'noise' from adjustments related to licences and other intangible assets inaddition to the lack of distinction between original recognition and subsequentremeasurement issues.
5. Conclusion
The paper has provided information about the effect on equity of the transitionto IFRS from UK GAAP. While the change to the final net assets figure is notsignificant, the effect on individual line items in the balance sheet warrantscareful examination of financial statements prepared under IFRS instead of UKGAAP. These changes can be explained by the effect of particular accountingstandards.

128 S. Aisbitt
Table 7. Adjustments with largest variance following transfer to IFRS relative to UKGAAP equity
Standard deviation of adjustments expressed as apercentage of UK GAAP equity
Accounting standard(s)Standard deviation
non-financialStandard deviation
financialStandard
deviation all
IAS 27/36/38 and IFRS 3 -group and goodwilladjustments
IAS 18 RevenueIAS 19 and IFRS 2 Employee
Benefits and Share-BasedPayments (mainlypensions)
IAS 16 Property, Plant andEquipment
IAS 10 Events after theBalance Sheet Date
IAS 32/39 FinancialInstruments
IAS 21 The Effects ofChanges in ForeignExchange Rates
IAS 12 Income TaxOtherIAS 17 LeasesIAS 28/31 Interests in
Associates and JointVentures
IAS 37 ProvisionsIFRS 1 First Time AdoptionIFRS 4 Insurance ContractsIFRS 5 Non-current Assets
Held for Sale andDiscontinued Operations
IAS 1 Presentation ofFinancial Statements
IAS 40 Investment PropertyIAS 41 Biological AssetsIAS 11 Construction
Contracts
47.08
0.02
4.10
0.06
41.63
34.8428.26
26.95
25.26
22.96
18.74
8.643.532.322.24
0.651.350.000.49
0.246.87
0.51
2.88
3.38
0.00
5.982.561.140.08
2.760.001.320.07
30.8625.35
23.87
22.38
20.36
16.58
8.173.362.111.98
1.391.190.630.44
0.03
0.000.040.02
0.070.000.00
0.030.030.02
UK accounting practice is generally regarded as coming from a similar modelof development to IFRS (the 'Anglo-Saxon' model), so users may not expectcompanies to make high levels of adjustments to their reported figures. Thispaper has demonstrated that such complacency would be misplaced. Followingfrom that logic, companies from the 'Continental European' tradition of financial

The Case ofthe FTSE 100 129
reporting might be expected to make greater changes in their financial reports tomeet the requirements of IFRS. This paper provides a 'benchmark' against whichother companies can be compared to establish whether they are indeed makinggreater or lesser adjustments.
The lack of generalisable results from this study highlights the importance ofcareful examination of individual financial statements. While some of thechanges to IFRS affect most companies (e.g. the change in the convention regard-ing accruing final dividends), it seems that the significance of most adjustmentsand the effects of particular accounting standards are related to the circumstancesof individual companies.
Acknowledgements
The author is grateful to the assistance of Dr Jackie Fry, Rose Gibson, FridaKylestorp and Jennie Larsson in collecting data for this paper, and for the com-ments of two referees.
Notes
' IFRS here is used to encompass all International Accounting Standards, Intemational FinancialReporting Standards and associated interpretations.
^The FTSE 100 consists of the largest 100 UK companies by full market value, subject to eli-gibility criteria associated with trading records. The constituents of the index are reviewedon a quarterly basis. Further information on the index rules can be found at www.ftse.com/Indices/UK_Indices/Index_Rules/Review_Process/index.jsp
''Audited' may include a 'special purpose audit report' or review rather than a full statutoryaudit report.
References
Aisbitt, S. and Walton, P. (2005) Preparing for IFRS in the UK: FTSE 100 companies, mimeo.Accounting and Finance Research Unit, Open University.
Basu, S. (1997) The conservatism principle and the asymmetric timeliness of earnings. Journal ofAccounting and Economics, 24, pp. 3-37.
Briston, R. (1978) The evolution of accounting in developing countries. International Journal ofAccounting, Fall, pp. 105-120.
Briston, R. (1989) Wider still and wider: the intemational expansion of the accounting profession.Accountant's Magazine, August, pp. 16-17.
Caims, D. (1997) The future of the IASC and the implications for UK companies, in: ICAEW (Ed.)Financial Reporting Today, pp. 115-152 (Accountancy Books).
Caims, D. (2001) Intemational Accounting Standards Survey 2000 (Intemational FinancialReporting).
CESR (2003) European regulation for the application of IFRS in 2005: recommendation for additionalguidance regarding the transition to IFRS, December, CESR/03-323e.
Clatworthy, M. and Jones, M. (2003) Financial reporting of good news and bad news: evidence fromaccounting narratives. Accounting and Business Research, 33(3), pp. 171 — 185.
Como, F. and Silvestri, M. (2001) Introducing IAS within European companies, Intemational Work-shop on Accounting and Regulation, Siena, September.

130 S Aisbitt
EU (2002) Regulation of the European Parliament and of the Council on the application of inter-national accounting standards, Brussels.
Hower, J. (1997) The future shape of harmonization: the EU versus the IASC versus the SEC,European Accounting Review, 6(2), pp. 281-303.
Hoogendoom, M. (this issue) Intemational accounting regulation and IFRS implementation inEurope and beyond - experiences with first-time adoption in Europe, Accounting in Europe, S3,pp. 23-26.
Hutten, C. (2005) Financial reporting challenges in a global regulatory environment - the case of SAP,Workshop on Accounting in Europe Beyond 2005, University of Regensburg, Germany, September.
KPMG (2005) Introduction of IFRS: Analyst Research Survey (KPMG IFRG Ltd).KPMG (2006) International Financial Reporting Standards: Views on a Financial Reporting Revolu-
tion (KPMG Intemational).Mueller, G. G. (1967) International Accounting (New York: Macmillan).Nobes, C. (forthcoming) The survival of intemational differences under IFRS: towards a research
agenda. Accounting and Business Research.Ormrod, P. and Taylor, P. (2004) The impact ofthe change to International Accounting Standards on
debt covenants: a UK perspective. Accounting in Europe, 1, pp. 71-94.PricewaterhouseCoopers (2004) Ready for Take-off? (PwC).Street, D. L. and Bryant, S. M. (2000) Disclosure level and compliance with IASs: a comparison of
companies with and without US listings and filings, Intemational Joumal of Accounting,35(3), pp. 305-329.
Street, D. L. and Gray, S. J. (2001) Observance of Intemational Accounting Standards: FactorsExplaining Non-compliance, ACCA Research Report No. 7 (London: ACCA).
Street, D. L. et al. (1999) Acceptance and observance of International Accounting Standards: anempirical study of companies claiming to comply with IASs, Intemational Joumal of Accounting,34(1), pp. 11-48.
Sucher, P. and Alexander, D. (2002) IAS: Issues of Country, Sector and Audit Firm Compliance inEmerging Economies (London: Centre for Business Performance of the Institute of CharteredAccountants in England and Wales).
Walton, P. (2004) IAS 39: where different accounting models collide. Accounting in Europe, SI,pp. 5-16.
Appendix A
Table Al. Companies included in the study
FTSE/DJ Industryclassification
benchmark - industryFirst annual report
under IFRS
Anglo-AmericanAntofagastaBOCCorus GroupJohnson MattheyRio TintoXstrataAssociated British FoodBritish American TobaccoCadbury-Schweppes
Basic materialsBasic materialsBasic materialsBasic materialsBasic materialsBasic materialsBasic materialsConsumer goodsConsumer goodsConsumer goods
31/12/200531/12/200530/09/200631/12/200531/03/200631/12/200531/12/200517/09/200631/12/200531/12/2005
(Table continued)

The Case of the FTSE 100 131
Table Al. Continued
FTSE/DJ Industryclassification
benchmark - industryFirst annual report
under IFRS
DiageoGailaher GroupImperial TobaccoReckitt Benckiser picSABMillerScottish & NewcastleTate & LyleUnileverAlliance UnichemBootsBritish AirwaysBritish SkyCompass GroupDaily Mail and General TrustDixons Group [name change to DSG
Intemational pic Sept 05]EmapEnterprise InnsGusHilton Group [hotels sold, group name
change to Ladbrokes]IntercontinentalITV picKingfisherMarks & SpencerMorrisonNEXT picPearsonReed Elsevier picReuters GroupSainsbury JTescoWhitbreadWilliam HillWPP GroupYell Group3i GroupAlliance & LeicesterAmvescapAvivaBarclaysBritish LandFriends ProvidentHBOS
Consumer goodsConsumer goodsConsumer goodsConsumer goodsConsumer goodsConsumer goodsConsumer goodsConsumer goodsConsumer servicesConsumer servicesConsumer servicesConsumer servicesConsumer servicesConsumer servicesConsumer services
Consumer servicesConsumer servicesConsumer servicesConsumer services
Consumer servicesConsumer servicesConsumer servicesConsumer servicesConsumer servicesConsumer servicesConsumer servicesConsumer servicesConsumer servicesConsumer servicesConsumer servicesConsumer servicesConsumer servicesConsumer servicesConsumer servicesFinancialsFinancialsFinancialsFinancialsFinancialsFinancialsFinancialsFinancials
30/06/200631/12/200530/09/200631/12/200531/03/200631/12/200531/03/200631/12/200531/12/200531/03/200631/03/200630/06/200630/09/200630/09/200630/04/2006
31/03/200630/09/200631/03/200631/12/2005
31/12/200531/12/200528/01/20063/04/2006
30/01/200629/01/200631/12/200531/12/200531/12/200525/03/200628/02/20063/03/2006
31/12/200531/12/200531/03/200631/03/200631/12/200531/12/200531/12/200531/12/200531/03/200631/12/200531/12/2005
(Table continued)

132 S Aisbitt
Table Al. Continued
HSBC HoldingsLand SecuritiesLegal and GeneralLibertyLloyds TSBMAN GroupNorthern RockPrudential picRoyal & Sun AllianceRoyal Bank of ScotlandSchroders picStandard Chartered picAstraZenecaGlaxoSmithKlineSmith & NephewBAABAE SystemsBunzlCapita GroupHansonHaysICIRentokil InitialRexamRolls-RoyceSmiths GroupWolseleyBG GroupBPSage GroupBTCable & Wireless02 [wholly owned subsidiary of
Telefonica SA]Vodafone GroupCentricaIntemational PowerNational GridScottish & Southem Energy picScottish PowerSevem Trent picUnited Utilities
FTSE/DJ Industryclassification
benchmark - industry
FinancialsFinancialsFinancialsFinancialsFinancialsFinancialsFinancialsFinancialsFinancialsFinancialsFinancialsFinancialsHealth careHealth careHealth careIndustrialsIndustrialsIndustrialsIndustrialsIndustrialsIndustrialsIndustrialsIndustrialsIndustrialsIndustrialsIndustrialsIndustrialsOil and gasOil and gasTechnologyTelecommunicationsTelecommunicationsTelecommunications
TelecommunicationsUtilitiesUtilitiesUtilitiesUtilitiesUtilitiesUtilitiesUtilities
First annual reportunder IFRS
31/12/200531/03/200631/12/200531/12/200531/12/200531/03/200631/12/200531/12/200531/12/200531/12/200531/12/200531/12/200531/12/200531/12/200531/12/200531/03/200631/12/200531/12/200531/12/200531/12/200530/06/200631/12/200531/12/200531/12/200531/12/200531/07/200631/07/200631/12/200531/12/200530/09/200631/03/200631/03/200631/03/2006
31/03/200631/12/200531/12/200531/03/200631/03/200631/03/200631/03/200631/03/2006
The Case of the FTSE 100 133
Appendix B
Table Bl. Companies excluded from the study
Allied DomecqBHP Billiton
CamivalDaily Mail and
General Trust
ExelOld MutualShellShire Pharmaceuticals
Taken over
V
Dual (or multiple)listed company notusing IFRS adopted
in the EU
y/ (Australianequivalents to IFRS)
V (US GAAP)
VV
Insufficientinformation available
for purposes ofresearch
7 (Sept year end. 2006interim accounts dueto be published26/05/06)
V
