assessing the effect of partial replacement of coarse
TRANSCRIPT

i
ASSESSING THE EFFECT OF PARTIAL REPLACEMENT OF
COARSE AGGREGATE IN CONCRETE WITH RECYCLED
PLASTIC-WASTE PALATES.
FINAL YEAR PROJECT REPORT
SUBMITTED TO KAMPALA INTERNATIONAL UNIVERSITY IN PARTIAL
FULLFILMENT OF THE REQUIRRMENT OF THE AWARD OF A DEGREE
OF
BACHELOR OF SCIENCE IN CIVIL ENGINEERING
BY
NAME REG. NO
KULE SURGEON BSCE/43968/143/DU
Project supervisor: Mr NISIIMA EMMANUEL
DEPARTMENT OF CIVIL ENGINEERING
SCHOOL OF ENGINEERING AND APPLIED SCIENCES
AUGUST 2018

ii
DECLARATION
I hereby declare that this project report is our original piece of work and it has never been
submitted to any other institution of higher learning for any academic award,being presented
in the School of Engineering and Applied Science, Department of Civil Engineering, as partial
fulfilment of the requirements for the award of the Bachelor of Science degree in Civil
Engineering of Kampala International University.
KULE SURGEON
Signed……………………………… Date…………………………….

iii
APPROVAL
This final year project report has been prepared under my supervision and is ready for
submission
Supervisor: Mr NISIIMA EMMANUEL
Signature: …………………………
Date: ………………………….

iv
DEDICATION
I dedicate this report to the almighty GOD for his everlasting love and provision to
our lives.
I further dedicate this report to my beloved mum the late Mrs KABANZA VANISI
MUSUMBA. I am always great full for the best parental care you gave me and all the
tireless efforts towards my education mama. May your soul rest in eternal peace
mama.

v
ACKNOWLEDGEMENTS
I would like to express special thanks of gratitude to our project supervisor Mr NISIIMA
EMMANUEL who gave us the opportunity and guidedus to do this wonderful projectwith a
theme “ASSESSING THE EFFECT OF PARTIAL REPLACEMENT OF COARSE AGGREGATES IN
CONCRETE USED IN SUSPENDED SLABS WITH RECYCLED PLASTIC-WASTE PALATES,”
which also helped us to know about the alternatives to coarse aggregates in concrete.
I would also like to thank our parents who laboured tirelessly as regards financing this
project at all costs.
Finally, an applause goes to all my well-wishers and friends who helped us a lot in finalizing
this projectreport within the required time.

vi
ABSTRACT
The project was toassessing the effect of partial replacement of coarse aggregates in concrete
used in suspended slabs with recycled plastic-waste palates. The properties of concrete
studied include both fresh and hardened properties. The independent variable in this project
is the partial replacement of course aggregate with plastic palates. The dependent variable in
this case are the properties of concrete such as workability, compressive strength and the
weight of the cubes at different percentage replacement. Since it was a partial replacement,
the replacement of coarse aggregates with plastic palate was from 0% to 75%. The results
of the project were as follows. The average weight of concrete cubes at 28days was 7.894Kg
for 0% replacement and 5.904Kg for 75% replacement of coarse aggregates with the plastic
waste palates. The decrease in the weight of the concrete with the increase in the replacement
of the coarse aggregates with plastic waste palates could have been due to the fact that the
plastic palates were not as heavy as the natural course aggregate. The workability of the
concrete was 50mm at 0%, 53mm at 25%, 56mm at 50% and 60mm at 75% replacement of
coarse aggregates with plastic palate.The results showed an increase in slump with the
increase the replacement of coarse aggregates with plastic palate which could be due to the
fact that plastic waste palates had less or no absorption of water in the concrete mix which
increased the water content in the mix that resulted into a high workability. The plot
compressive strength against plastic percentage replacement shows steady decrease in
compressive strength between 0 and 50% and later drastically decreases with increase in
plastic replacement. This could have been due to the fact that in the process of preparing the
plastic palate aggregate, the palates were cut with shape and smooth which hindered the
adequate bonding with the other concrete constituents hence lowering the compressive
strength.The plastic percentage of 50% with compressive strength of 11.2kN/mm2and weight
of 6.370Kg is our optimum percentage replacement of course aggregates with plastic waste
palates because the weight had reduced but the compressive strength was not so much
compromised.

vii
TABLE OF CONTENTS
DECLARATION .......................................................................................................................... ii
APPROVAL ............................................................................................................................... iii
Dedication ................................................................................................................................ iv
ACKNOWLEDGEMENTS ........................................................................................................... v
ABSTRACT ................................................................................................................................ vi
TABLE OF CONTENTS ................................................................................................. vii
LIST OF ACRONYMS ............................................................................................................... ix
Chapter 1 INTRODUCTION .................................................................................................... 1
1.1 Background ...................................................................................................................... 1
1.2 Problem Statement ........................................................................................................... 2
1.3 Objectives ........................................................................................................................ 2
1.3.1 Main Objective .......................................................................................................... 2
1.3.2 Specific Objectives ................................................................................................... 2
1.4 Justification and significance. .......................................................................................... 2
1.5 Project Scope ................................................................................................................... 3
1.5.1 Geographical Scope .................................................................................................. 3
1.5.2. content scope ........................................................................................................... 3
1.5.3. Time scope ............................................................................................................... 3
Chapter 2 LITERATURE REVIEW ........................................................................................... 4
2.1 INTRODUCTION ........................................................................................................... 4
2.2 Concrete Constituents ...................................................................................................... 9
2.2.1 Binders .................................................................................................................... 10
2.2.2 Concrete Aggregates ................................................................................................... 11
2.3 properties of concrete ................................................................................................. 16
2.3.1 Properties of fresh concrete .................................................................................... 16
2.3.2 Properties of hardened concrete ......................................................................... 19
2.4 The properties of HDPE are: ................................................................................. 21
CHAPTER 3: METHODOLOGY ........................................................................................ 23
3.1 Making of plastic aggregate ........................................................................................... 23
3.2 Casting the mix .............................................................................................................. 26

viii
3.2.1 The slump test ......................................................................................................... 26
3.2.2 Casting of specimens .............................................................................................. 27
3.2.3 Curing ..................................................................................................................... 29
3.2.4 Weights of the specimen cubes .......................................................................... 29
3.3 Compressive strength test .............................................................................................. 31
CHAPTER 4: RESULTS AND DISCUSSION ......................................................................... 32
4.1 Slump test results and analysis .................................................................................. 32
4.2 Analysis of weight results of concrete cubes ................................................................. 33
4.2 Compressive strength results ..................................................................................... 35
CHAPTER 5 : CHALLENGES, CONCLUSIONS AND RECOMMENDATIONS ..................... 39
5.1 Challenges. ................................................................................................................ 39
5.2 Conclusions ............................................................................................................... 39
5.2.1 Slump test........................................................................................................... 39
5.2.2 Compressive strength ......................................................................................... 40
5.3 Recommendations ..................................................................................................... 40
REFERENCES .......................................................................................................................... 41

ix
LIST OF ACRONYMS
ACI American Concrete Institute
ACV Aggregate Crushing Value
ASTM American Society for Testing and Materials
BS British Standard
GGBS Ground granulated blast furnace slag
HDPE High Density Polyethylene
MSW Municipal Solid Waste
NCA Natural coarse aggregates
OPC Ordinary Portland cement
PCA Plastic coarse aggregate
PPE Personal Protective Equipment
SCC Self-Consolidating Concrete.
USCS Unified Soil Classification System

1
CHAPTER 1 INTRODUCTION
1.1 Background
Concrete is a construction material composed of cement, aggregates,water, and admixtures.
The aggregates may be classified as fine or course aggregates basing on the particle size from
the sieve analysis. It offers stability and design flexibility for the residential marketplace and
environmental advantages through every stage of manufacturing and use. There are many
advantages of concrete as a building materials such as built-in fire resistance, high
compressive strength and low maintenance(Praveen, 2013).
The importance of using the right type and quality of aggregates should be given much
consideration since they provide the compressive strength of concrete. The fine and coarse
aggregates generally occupy 60% to 75% of the concrete volume (70% to 85% by mass) and
strongly influence the concrete’s freshly mixed and hardened properties, mixture proportions
and economy. Coarse aggregates consist of one or a combination of gravels or crushed stone
with particles predominantly larger than 5 mm and generally between 9.5 mm and 37.5 mm.
Natural gravel and sand are usually dug or dredged from a pit, river, lake, or seabed. Crushed
stone is produced by crushing quarry rock, cobbles, or large-size gravel. Crushed air-cooled
blast-furnace slag is also used as fine or coarse aggregate. The aggregates are usually washed
and graded at the pit or plant. Some variation in the type, quality, cleanliness, grading,
moisture content, and other properties is expected. Ghernouti, Y., &Rabehi. (2011).
Naturally occurring concrete aggregates are a mixture of rocks and mineral and are a non-
renewable source that has to be partially or completely replaced with a material that has
almost the same properties in the construction industry before its depletion from the natural
reserves.
Today, you can hardly look around you and not spot some item that is made entirely from
plastic or has some plastic ingredient. This only proves that from its inception up to now plastic
has managed to become a popular material with millions of useful items, but it is not perfect.
Plastic has become a nuisance to the environment and has created the need for its use in the
construction industry as a way of controlling its negative effects on the environment. Since it
takes long to get biodegraded, the partial replacement of aggregates of concrete used in the
construction of suspended slabs with plastics will help to save our environment from this non-
biodegradable element.

2
1.2 Problem Statement
The aggregates in concrete are quite expensive and contribute greatly to the self-weight of
the concrete members in any concreting works. Therefore, their replacement with lighter
plastic palates from the abundant waste plastic materials in the environment would reduce
the self-weight of the concrete used in suspended slabs and to provide an environmental
friendly plastic waste management strategy(Ramesan,2015).
1.3 Objectives
1.3.1 Main Objective
To assess the effect of partially replacement of coarse aggregates in concrete with recycled
plastic-waste palates.
1.3.2 Specific Objectives
i. To study the effect of replacing natural aggregate with plastic palates on workability
of concrete.
ii. To study the effect of replacing natural aggregate with plastic palates on the
compressive strength of concrete.
iii. To study the effect of replacing natural aggregate with plastic palate on weight of
concrete.
iv. To compare and analyze the results
v. To give recommendations based on the results.
1.4 Justification and significance.
Due to rapid increase of the population in the world, the amount of waste products such as
waste plastic is also increasing rapidly and these wastes remain in the environment for
hundreds of years. The inclusion of this waste plastic in concrete may reduce the
environmental problems up to a certain extent. It’s a possibility of disposal of these wastages
in mass concrete such as in heavy mass concreting in PCC in pavements where the strength
of concrete is not a major criterion under consideration(Ghernouti & Rabehi, 2011).
The waste plastic is one component of Municipal Solid Waste (MSW). The disposal of the
waste plastic which cause the big problems to the environment because the plastic is very low
biodegradable material (Singh, 2007). As from many years the research concern that the use
of by-products from industry may augment the properties of concrete. In the modern decades,
the use of by-products such as silica fume, glass culvert, fly ash, ground granulated blast

3
furnace slag (GGBS) etc., efforts have been made to use in civil construction. The use of these
waste plastic in concrete can control the environmental problems or constraints if safe disposal
of these products.
The aggregates in concrete are quite expensive and take up a relatively high percentage of
the total concrete unit cost on all concrete projects. They also largely contribute to the weight
of concrete that greatly influences the self-weight of a concrete members e.g. beams,
columns, slabs among others, and the overall weight of the entire concrete structure, its
transportation and many other properties.
The use of plastics as a concrete constituent would greatly save the environment from the
accumulation of plastic material owing to the fact that they are not bio-degradable. Besides,
the replacement of the coarse aggregates with plastic would save both the consulting and
contracting engineers the trouble and costs of carrying out various tests on aggregates such
as Aggregate Crushing value test, Flakiness tests, and water absorption test among others.
1.5 Project Scope
1.5.1 Geographical Scope
The tests were conducted at Bugolobi waste water treatment plant project using the site
laboratory for Cementers which is the main contractor for the project. The plastic used to
make plastics palates were collected from the different disposal areas around Bugolobi and
the natural aggregates used were machine crushed from the Muyenga quarry.
1.5.2. Content scope
The project studied the effect of replacing course aggregates with the plastic waste palate on
the properties of concrete. Properties include both fresh and hardened properties. The
independent variable in this project is the partial replacement of course aggregate with plastic
palates. The dependent variable in this case are the properties of concrete such as workability,
compressive strength and the weight of the cubes at different percentage replacement.
1.5.3. Time scope
The data of the project was collected from August 2017 to May 2018

4
CHAPTER 2 LITERATURE REVIEW
2.1 INTRODUCTION
The effect of the replacement of coarse aggregates with various percentages (0% to 40%) of
plastic aggregate on behaviour of concrete was experimentally investigated by (Anju
Ramesan, 2015) and the optimum replacement of coarse aggregate was found to be at 25%.
The results showed that the addition of plastic aggregate to the concrete mixture improved
the properties of the resultant mix. The present study investigated the partial replacement of
the coarse aggregates in concrete used in suspended slabs with recycled plastic waste
palatesat percentages of 0%, 25%, 50% and 75% to create an in-depth study and
investigation on the optimum replacement of the coarse aggregates by plastics in the
concrete. The plastics used in the study were waste plastic and the concrete mixing ratios
used was (1:2:4).
According to (Aginam C. H. Nwakaire C, 2016) a study was carried out about the suitability of
quarry dust as a partial replacement of coarse aggregates in concrete making. Samples of
concrete cubes were made with varying proportions of quarry dust replacing the coarse
aggregate. Some physical properties of the concrete constituent materials that are relevant
to the experiments were determined. The mix design of 1:2:4 by volume was adopted and
two brands of Ordinary Portland cement (OPC) were used for comparative purposes. Particle
size distribution analysis, slump test, and compressive strength test were carried out on the
materials, the fresh concrete, and the cured concrete cubes respectively. The results disclosed
that replacing 10% of the required amount of gravel with quarry dust and using the Ibeto
brand of Portland cement yielded the highest amount of compressive strength of 32.3N/mm2.
It was also observed that using the Ibeto brand of OPC, the concrete cubes made with
inclusion of quarry dust up to 25% all performed better than the zero-replacement level in
terms of their compressive strengths. The strengths achieved with the Dangote brand of OPC
were satisfactory up to 15% replacement level. This suggests that the quarry dust can be
utilized as a partial replacement of the coarse aggregates in concrete within the satisfactory
levels. However, this study looked at the partial replacement of the coarse aggregates in
concrete with plastic palates from the recycles plastic wastes.
One of the new waste materials used in the concrete industry is recycled plastic. For solving
the disposal of large amount of recycled plastic material, reuse of plastic in Concrete industry
is considered as the most feasible application. Recycled plastic can be used as coarse
aggregate in concrete. However, it is important to underline that re-using of wastes is not yet
5
economically advantageous, due to the high costs of transport and its effect on the total costs
of production. Moreover, it is important not to neglect other costs, directly referable to the
kind of wastes, due, in particular, to the need of measuring gas emission, during firing, and
the presence of toxic and polluting elements.
In recent years, the concept of using old concrete pavements, buildings, and other structures
as a source of aggregate has been demonstrated on several projects, resulting in both material
and energy savings.
The procedure involves
Breaking up and removing the old concrete,
crushing in primary and secondary crushers
removing reinforcing steel and other embedded items
Grading and washing
Finally stockpiling the resulting coarse and fine aggregate.
Dirt, gypsum board, wood, and other foreign materials should be prevented from
contaminating the final product. Recycled concrete is simply old concrete that has been
crushed to produce aggregate. Recycled-concrete aggregate is primarily used in pavement
reconstruction. It has been satisfactorily used as an aggregate in granular sub-bases, lean-
concrete sub-bases, soil-cement, and in new concrete as the only source of aggregate or as
a partial replacement of new aggregate. Recycled-concrete aggregate generally has a higher
absorption and a lower specific gravity than conventional aggregate. This results from the
high absorption of porous mortar and hardened cement paste within the recycled concrete
aggregate.
That is enough evidence that research was being carried out and replacements for aggregates
being slowly discovered as an effort to save the environment. However,there is lack of diverse
knowledge in Uganda about the suitability of plastics as a partial replacement for course
aggregates in concrete, which is going to be covered in this study.
According to (MamerySérifou, 26February2013), numerous studies show the potential of
recycling aggregates such as ceramics, rubber, glass and demolition wastes (bricks and
concrete).
Due to the high amount of concrete from demolition wastes, this material was studied as
substitution of natural aggregates by several authors. However, these aggregates are highly
porous and contain a high amount of impurities. Limited studies were conducted on the

6
potential of fresh concrete waste (FCW). These aggregates are mainly composed of over
ordered fresh concrete. The advantage of this waste is that it contains limited amount of
impurities in comparison with other recycled aggregates. Recycling this material is of particular
interest because its use can considerably reduce the problem of waste storage, and
simultaneously it helps in the preservation of natural aggregate resources. Recent successful
studies on the use of FCW as aggregates in concrete have been reported and the results of
these studies showed that the compressive strength and the slump decreased with increasing
the FCW aggregates percentage.
The compressive strengths for all mixes of 1, 14, and 28days of curing were presented and
the results were showing that the higher the replacement by recycled aggregates, the lower
the compressive strength for all the curing durations. In conclusion, the substitution of natural
aggregates with 25%, 50%, and 100% of recycled aggregates decreases the compressive
strength by about 15%, 25%, and 32% decreases the compressive strength of the concrete.
The research was aimed at saving the environment by reducing the waste concrete being land
filled, the replacement was at 25%, 50% and 100%. However, for this study the replacement
was at 0%, 25%, 50%, and 75% partial replacement with plastic waste.
Recycling of concrete is needed from the viewpoint of environmental preservation and
effective utilization of resources. At present, utilization of recycled aggregate is limited mainly
to sub bases of roads and backfill works. A large portion of concrete waste ends up at disposal
sites. It is anticipated that there will be an increase in the amount of concrete waste, a
shortage of disposal sites, and depletion in natural resources especially. These lead to the use
of recycled aggregate in new concrete production, which is deemed to be a more effective
utilization of concrete waste. However, information on concrete using recycled aggregate is
still insufficient, and it will be advisable to get more detailed information about the
characteristics of concrete using recycled aggregate. (RAVI PATEL, 2013)
An experimental study by (Manjunath, 2015) was made on the utilization of E-waste particles
as fine and coarse aggregates in concrete with a percentage replacement ranging from 0 %,
20% to 30% on the strength criteria of M20 Concrete. Compressive strength, Tensile strength
and Flexural strength of concrete with and without E- waste plastic as aggregates was
observed which exhibited a good strength. The compressive strength was investigated for
Optimum Cement Content and 10% E-plastic content in mix and yielded stable and a very
good compressive strength of 53 grade cement. The management and recycling of E plastic
waste is rapidly growing as it is a valuable resource of IT industries and it is very hazardous

7
substances and with low recycling rate. The Utilization of e plastic waste materials is a partial
solution to environmental and ecological problems which is aimed at conserving the
environment by reducing on the stone aggregates being mined from the earth, however for
the case of this study it is aimed at solving the nuisance of plastics that are equally dangerous
to the environment.
According to (Manjunath, 2015), the management and recycling of E plastic waste is rapidly
growing as it is a valuable resource of IT industries and it is very hazardous substances and
with low recycling rate. The Utilization of Eplastic waste materials is a partial solution to
environmental and ecological problems. As the use of E plastic waste will reduce the Aggregate
cost and provides a good strength for the structures and roads. It will reduce the landfill cost
and it is energy saving. The E plastic waste consists of discarded plastic waste from the old
computers, TVs, refrigerators, radios; these plastics are non-biodegradable components of E
plastic waste as a partial replacement of the coarse or fine aggregates.
Advantages of using the plastics in concrete:
The growth in the use of plastic is due to its beneficial properties, which include:
Extreme versatility and ability to be tailored to meet specific technical needs.
Lighter weight than competing materials reducing on the section size of concrete
members.
Durability and longevity.
Resistance to chemicals, water and impact.
Excellent thermal and electrical insulation properties.
Comparatively lower production cost.
The following are the main disadvantages of using the plastics in concrete:
Plastics are having low compressive strength than aggregates therefore when used in
concrete the compressive strength may be reduced.
Its melting point is low so that it cannot be used in furnaces because it gets melt as
its comes in contact with the heat at high temperature.
According to (Praveen Mathew, 2013) research, the initial questions arising of the bond
strength and the heat of hydration regarding plastic aggregate were solved. Tests were
conducted to determine the properties of plastic aggregate such as density, specific gravity
and aggregate crushing value.

8
As 100% replacement of natural coarse aggregate (NCA) with plastic coarse aggregate (PCA)
is not feasible, partial replacement at various percentage were examined. The percentage
substitution that gave higher compressive strength was used for determining the other
properties such as modulus of elasticity, split tensile strength and flexural strength. Higher
compressive strength was found with 20% NCA replaced concrete. Heat resisting behaviour
of the PCA concrete was also discussed in that study.
The density of aggregate particles used in mixture proportioning computations (not including
voids between particles) is determined by multiplying the relative density (specific gravity) of
the aggregate times the density of water. An approximate value of 1000 kg/m3 (62.4 lb/ft3)
is often used for the density of water. The densities of aggregate, along with more accurate
values for water density, are provided in ASTM C 127 (AASHTO T 85) and ASTM C 128
(AASHTO T 84). Most natural aggregates have particle densities of between 2400 and 2900
kg/m3 (150 and 181 lb/ft3). (Design and control of concrete mixtures EB001).
The plastics collected from the disposal area were sorted to get the superior one. These were
crushed into small fraction and washed to remove the foreign particles. Then it was heated at
a particular temperature so that the necessary brittleness was obtained. After extrusion the
molten plastic was cooled down and collected in boulders of 100 mm size approximately.
These plastic boulders were crushed down to the sizes of aggregates. The cubes were
prepared to determine the different properties.
Table 2-1 Properties of Aggregates
Property NCA PCA
Specific gravity 2.74 0.9
Crushing value 28 2
Density 3.14 0.81
(Praveen Mathew, 2013)

9
2.2 Concrete Constituents
According to (Sika Concrete), there are three main constituents that actually enough to
produce concrete:
Binder (cement)
Aggregate
Water
Due to continually increasing demands for the concrete quality (mainly durability) and huge
advances in admixture and concrete technology, it is now possible to produce many different
kinds of concrete as shown in table 2-2.
Table 2-2 Properties of different types of concrete
Standard concrete Concrete with a maximum particle
diameter > 8 mm Density (kiln dried)
> 2000 kg/m³, maximum 2600 kg/m³
Heavyweight concrete Density (kiln dried) > 2600 kg/m³
Lightweight concrete Density (kiln dried) > 800 kg/m³ and < 2000
kg/m³
Fresh concrete Concrete, mixed, while it can still be worked
and compacted
Hardened concrete Concrete when set, with measurable
strength
“Green” concrete Newly placed and compacted, stable, before
the start of detectable setting (green
concrete is a pre-casting industry term)
Other terms in use are shot-concrete, pumped concrete, craned concrete etc. They define the
placement into the formwork, working and/or handling to the point of installation.

10
2.2.1 Binders
Cement is a binder that is to say hardening when combined with water which is used to
produce concrete. Cement paste (cement mixed with water) sets and hardens by hydration,
both in air and under water.
The main base materials, e.g. for Portland cement, are limestone, marl and clay, which are
mixed in defined proportions to give different concrete strength. This raw mix is burned at
about 1450°C to form clinker which is later ground to the well-known fineness of cement.
Types of Cement
The different types of cement are based on the rate of hardening of the cement and therefore
majorly five types as defined below. The application of the cement in the field also may be
different basing of rate of hardening required or specified. These include
Ordinary Portland cement
Rapid hardening cement
Low heat cement
Blast-furnace cement
Sulfate resistant cement
Ordinary Portland cement was the type of cement used for the project.
Major components of cement
Cement is a composite of a number of chemical elements in different percent’s. The
percentage of various ingredients for the manufacture of Portland cement should be as
follows;
No Ingredient Proportion
1Lime CaO60 – 65%
2 Silica SiO2 20 – 25%
3Alumina Al2O34 – 8%
4Iron oxide FeO3 2 – 8%
5Magnesium oxide MgO1 – 3%
6Sulphur trioxide<1.75%

11
Minor components
These are mainly selected inorganic natural mineral materials originating from clinker
production, or components as described (unless they are already contained in the cement as
a major constituent).
Cement strengths
Cements are divided into 3 strength classes according to the standard mortar compressive
strength after 28 days. The levels represent the required minimum compressive strengths of
32.5/42.5/52.5 N/mm². Cements with a high 2-day compressive strength have the additional
designation “R”.
Detailed information on the individual constituents is given in EN 197-1: Chapter 5:
2.2.2 Concrete Aggregates
Gravels, stone and sands form the granular structure, which must have its voids filled as
completely as possible by the binder glue. They make up approximately 80% of the weight
and 70–75% of the volume. Optimum use of the aggregate size and quality improves the
concrete quality. Aggregates can occur naturally (fluvial or glacial); for high-quality concrete
they are cleaned and graded in industrial facilities by mechanical processes such as mixing
together, crushing, screening and washing. (Mechanical preparation)
Suitable as concrete aggregates are materials which do not interfere with the cement
hardening, have a strong enough bond with the hardened cement paste and do not put the
resistance of the concrete at risk.
Table 2-3 Standard and special aggregates
Standard aggregates Density 2.2–3
kg/dm³
From natural deposits, e.g. river
gravel, moraine gravel etc. Material
rounded or crushed (e.g. excavated
tunnel)
Heavyweight
aggregates
Density > 3.0 kg/dm³ Such as barytes, iron ore, steel
granulate. For the production of heavy
concrete (e.g. radiation shielding
concrete)

12
Lightweight
aggregates
Density < 2.0 kg/dm³ Such as expanded clay, pumice,
polystyrene. For lightweight concrete,
insulating concretes
Hard aggregates Density > 2.0 kg/dm³ Such as quartz, carborundum; e.g. for
the production of granolithic concrete
surfacing
Recycled granulates Density approx. 2.4
kg/dm³
From crushed old concrete, etc.
Standard aggregates
In Europe aggregates are defined in standard EN 12620. This standard is very comprehensive
and to give more details than in the list below would be outside the scope of this document.
Important terms from the standard (with additional notes):
i. Natural aggregate
Comes from mineral deposits; it only undergoes mechanical preparation and/or washing.
ii. Aggregate mix
Aggregate consisting of a mixture of coarse and fine aggregates (sand).
An aggregate mix can be produced without prior separation into coarse and fine aggregates
or by combining coarse and fine aggregates (sand).
iii. Recycled aggregate
Aggregate made from mechanically processed inorganic material previously used as a
building material (i.e. concrete).
iv. Filler (rock flour)
Aggregate predominantly passing the 0.063 mm sieve and which is added to obtain specific
properties.
v. Particle size group Designation of an aggregate by lower (d) and upper (D) sieve size,
expressed as d/D.
vi. Fine aggregate (sand)
Designation for smaller size fractions with D not greater than 4 mm. Fine aggregates can be
produced by natural breakdown of rock or gravel and/or crushing of rock or gravel, or by the
processing of industrially produced minerals.

13
vii. Coarse aggregate
Designation for larger size fractions with biggest diameter not less than 4 mm and smallest
diameter not less than 2 mm.
viii. Naturally formed aggregate 0/8 mm
Designation for natural aggregate of glacial or fluvial origin with D not greater than 8 mm
(can also be produced by mixing processed aggregates).
ix. Fines
Proportion of an aggregate passing the 0.063 sieve.
x. Granulometric composition
Particle size distribution, expressed as the passing fraction in percent by weight through a
defined number of sieves.
Passing fraction, particle size distribution curves
The particle size is expressed by the hole size of the test sieves just passed by the particle
concerned as shown in table 2-6 below.
According to EN 933-2, sieves with square holes must be used.
Table 2-4 Sieve types specified
Hole sizes < 4mm Metal wire mesh
Hole sizes > 4mm Perforated metal plate
The hole sizes of the individual sieves (sieve sizes) are described in ISO 3310-1 & 2. A standard
section from the main series R20 can be taken as an example. The following sieve sizes are
required (hole sizes in mm):

14
Figure 2-1Particle size distribution curve (EN:480-1, 1994)
Aggregate mix 0–32 mm: 0.063 / 0.125 / 0.25 / 0.50 / 1.0 / 2.0 / 4.0 / 8.0 / 16.0 / 31.5
Table 2-5 Particle size distribution (grading curve range to EN 480-1)
Constituent Particle size in mm Content in mix in %
Powdered limestone 0–0.25 2.5
Round sand 0–1 18.0
Round sand 1–4 27.5
Round gravel 4–8 12.0
Round gravel 8–16 20.0
Round gravel 16–32 20.0

15
In this case, the sands and gravels are washed, therefore filler is added to improve
consistence.
Optimum grain shape, crushed/round
Cubic/spherical shapes have proved more suitable than linear forms, which can affect the
consistence. Crushed aggregate has a slightly higher water requirement for the same
consistence because of its larger specific surface area, but higher concrete compressive and
particularly tensile strengths can be obtained due to better interlocking.
Predominantly crushed aggregates
The surface of crushed materials from rock, large blocks etc. consists only of broken surfaces,
while the surface of crushed round material also includes natural rounded areas. Crushed rock
material is now mainly used in tunnelling, the motto being: “Extraction point = installation
point”.
Quarry sands
These are angular and also longish or flattish depending on the rock. They are not conducive
to a good consistence and their water requirement is generally higher.
Harmful contaminants
Loam, humus, marl, clay, gypsum and aggregates containing sulphates, chlorides and alkalis
are all potentially harmful and their presence and possible consequences must be clarified.
Physical requirements for aggregates
Standard EN 12620 divides coarse aggregates into categories covering:
Resistance to splitting
Resistance to wear
Resistance to polishing and abrasion
Particle density and water absorption
Bulk density
Durability

16
N.B: In the designation of concrete mix C, refers to the mix and the number to the specified
compressive strength of 150 mm size cube at 28 days, expressed in N/mm2. For concrete of
compressive strength greater than M 55, design parameters given in the stand may not be
applicable and the values may have to be obtained from specialized literatures and
experimental results.
2.3 properties of concrete
2.3.1 Properties of fresh concrete
i. Workability
This is the ease of placing, consolidating, and finishing freshly mixed concrete. It can also be
defined as the degree to which concrete resists segregation. Concrete should be workable,
but the ingredients should not separate during transport and handling. Workability is also
associated with flow characteristics used in high-performance concrete mixtures which
include: unconfined flow-ability, called the filling ability; and confined flow-ability, called the
passing ability. Dynamic stability is the ability to resist separation during transport and
placement. Static stability is the ability to maintain a uniform distribution of all mixture
components after the fluid concrete has stopped moving.
Table 2-6 Properties of Fresh concrete (Praveen Mathew, 2013)
Particulars Slump in mm Compaction factor
NCA 33 0.93
20% replaced with PCA 36 0.95
Tests were conducted to determine the fresh and hardened properties of both NCA( natural
course aggregates) and PCA (plastic coarse aggregates concrete). Slump and compaction
factor was determined as per the Indian standards and the values are tabulated in Table 2-
12. It shows that the workability of 20% PCA concrete is superior to NCA concrete which is
due to the lower water absorption rate of plastic aggregates.
ii. Consistency
Consistency is considered a close indication of workability. If the consistency is too dry and
harsh, the concrete will be difficult to place and compact and larger aggregate particles may
separate from the mixture. However, it should not be assumed that a wetter, more fluid

17
mixture is necessarily more workable. Segregation, honeycombing, and reduced hardened
properties can occur if the mixture is too wet.
iii. Bleeding
Bleeding is the development of a layer of water at the top or surface of freshly placed concrete.
It is caused by settlement of solid particles and the simultaneous upward migration of water.
Some bleeding is normal and it should not diminish the quality of properly placed, finished,
and cured concrete. Excessive bleeding increases the water-cement ratio near the top surface
which creates a weak top layer with poor durability, particularly if finishing operations take
place while bleed water is present. A water pocket or void can develop under a prematurely
finished surface (which can cause a future surface delamination). The most effective means
of reducing bleeding in concrete include:
- Reduce the water content, water to cementitious material ratio, and slump
- increase the amount of cement resulting in a reduced water-cement ratio
- use finer cementitious materials
- increase the number of fines in the sand
- use or increase the amount of supplementary cementing materials such as fly ash,
slag cement, or silica fume
- use blended hydraulic cements
- use chemical admixtures that permit reduced water to cementitious materials ratios or
provide other means capable of reducing the bleeding of concrete
- Use air-entrained concrete.
iv. Air content
Air entrainment is recommended for nearly all exterior concretes, principally to improve freeze-
thaw resistance when exposed to freezing water and reactive chemicals. A small amount of
entrained air is sometimes useful for concrete that does not require freeze-thaw protection
because it reduces bleeding and increases plasticity. While minimum air contents are well
established for durability, there is also a reason to consider setting a maximum air content to
control strength and potential surface delamination/peel off. As cement content increases, the
air content decreases for a fixed dosage of air-entraining admixture per unit of cement within
the normal range of cement contents is always recommended

18
Uniformity
Uniformity is a measure of the homogeneity of the concrete. This measurement includes
within-batch uniformity and between batching of concrete mixtures. If the within-batch
uniformity is low, this is indicative of inadequate or inefficient mixing. Samples of concrete are
taken at two locations within the batch to represent the first and last portions on discharge.
Uniformity of concrete is typically achieved by consolidation. Vibration sets into motion the
particles in freshly mixed concrete, reducing friction between them and giving the mixture the
mobile qualities of a thick fluid. Consolidation of coarser as well as stiffer mixtures results in
improved quality and economy. On the other hand, poor consolidation results in porous, weak
concrete with poor durability.
v. Hydration, setting and hardening
The binding quality of Portland cement paste is due to the chemical reaction between the
cement and water, called hydration. The engineering properties of concrete which include;
setting and hardening, strength, and dimensional stability depend primarily on calcium silicate
hydrate. As concrete hardens, its gross volume remains almost unchanged, but hardened
concrete contains pores filled with water and air that have no strength. The strength resides
in the solid part of the paste, mostly in the calcium silicate hydrate and crystalline compounds.
The less porous the cement paste, the stronger the concrete. When mixing concrete,
therefore, no more water than is absolutely necessary to make the concrete plastic and
workable should be used.
Setting and hardening
The setting and hardening of Portland cement can be explained using a simple model showing
anhydrite cement grains dispersed in water. Time starts when the water is first added to the
cement. Upon the addition of water, a chemical reaction occurs between the water and cement
called hydration. The solid products resulting from hydration occupy a greater volume than
the original cementitious materials and consequently some of the space between the cement
grains is filled in. Eventually the hydration products will connect adjacent grains and a
continuous solid network is formed. This is referred to as initial set.
Between the addition of water and just before initial set occurs, the paste has little rigidity.
This is referred to as the dormant period. During the dormant period the paste is still plastic
and the concrete can still be handled and placed. As the cement continues to hydrate, more
hydration products are formed and the solid matrix becomes denser and rigid. This period is

19
called the setting or transition period as it represents the period during which the paste
transforms from a fluid to a solid. Eventually the paste can be considered a rigid and solid
material with mechanical properties such as strength and stiffness.
2.3.2 Properties of hardened concrete
i. Curing
When the relative humidity within the concrete drops to about 80% or the temperature of the
concrete drops below 10°C (50°F), hydration and strength gain virtually stop.If concrete is re-
saturated after a drying period, hydration is resumed and strength will again increase.
However, it is best to moist-cure concrete continuously from the time it is placed until it has
attained the desired quality. Once concrete has dried it is difficult to re-saturate.
Increase in strength with age continues provided;
- Un-hydrated cement is still present
- The concrete remains moist or has a relative humidity above approximately 80%
- The concrete temperature remains favorable
- Sufficient space is available for hydration products to form.
ii. Strength
The compressive strength of concrete is a fundamental physical property frequently used in
design calculations for bridges, buildings, and other structures. Compressive strength is the
measured maximum resistance of a concrete specimen to axial loading. It is generally
expressed in mega Pascals (MPa) or pounds per square inch (psi) at an age of 28 days though
other test ages are also used. However, it is important to realize the relationship between the
28-day strength and other test ages. Seven-day strengths are often estimated to be about
75% of the 28-day strength while 56-day and 90-day strengths are about 10% to 15% greater
than 28-day strengths.
iii. Density
Conventional concrete, normally used in pavements, buildings, and other structures, has a
density (unit weight) in the range of 2200 to 2400 kg/m3. The density of concrete varies
depending on;
- The amount and density of the aggregate
- The amount of air that is entrapped or purposely entrained

20
- The water and cement contents, which in turn are influenced by the maximum size of
the aggregate.
For the design of reinforced concrete structures, the combination of conventional concrete
and reinforcing steel is commonly assumed to weigh 2400 kg/m3. There is a wide spectrum
of special concretes to meet various needs. Their densities range from lightweight insulating
concretes with a density of as little as 240 kg/m3 to heavyweight concrete with a density of
up to 6000 kg/m3 used for counterweights or radiation shielding.
iv. Permeability and water tightness
Concrete used in water-retaining structures or exposed to weather or other severe exposure
conditions must be of low permeability or watertight. Water tightness is the ability of concrete
to hold back or retain water without visible leakage. Permeability refers to the amount of
water movement through concrete when the water is under pressure or to the ability of
concrete to resist penetration by water or other substances such as liquid, gas, or ions.
Generally, the same properties of concrete that make it less permeable also make it more
watertight and the overall permeability of concrete to water migration is a function of:
- The permeability of the paste
- The permeability and gradation of the aggregate
- The quality of the paste and aggregate transition zone
- The relative proportion of paste to aggregate.
v. Durability
The durability of concrete may be defined as the ability of concrete to resist weathering action,
chemical attack, and abrasion while maintaining its desired engineering properties. Concrete
is exposed to a greater variety of potentially harmful exposure conditions than any other
construction material. There are many causes of concrete deterioration and most of these
involve either the movement of moisture or the movement of species, such as chlorides and
sulphates, dissolved in the water. Generally, the greater the resistance of the concrete to the
movement of water, the lower its permeability and the greater its resistance to deterioration.
Deterioration due to freezing and thawing is a result of the expansive forces that are generated
when the water in saturated concrete freezes. Corrosion of embedded steel reinforcement is
the most prevalent form of deterioration of reinforced concrete structures, caused by chlorides

21
penetrating through the concrete cover and eventually reaching the embedded steel
reinforcement or by carbonation of the concrete.
2.4 The properties of HDPE are:
Excellent resistant (no attack) to dilute and concentrated acids, alcohols and bases.
Melting point:130oC - 180oC
Specific Gravity: 0.95
Water absorption: 0.001% - 0.010%
Chemical resistant
Impact and wear resistant
Can withstand relatively higher temperatures than most of the other plastics
2.5 TESTS ON CONCRETE
Fresh concrete
The slump test is carried out for consistence of concrete.
This test involves filling mixed concrete in the metallic cone in three layers each layer
compacted with 25 blows of a 16mm diameter tamping rod uniformly distributed. The steel
cone is carefully removed and inverted close next to the concrete. The tamping rod is placed
on the inverted cone. The slump is measured as the distance from top of concrete to the
inside of the rod.
Cubes preparations
Cubes are prepared from a representative sample of concrete in accordance with BS 1887
part 3: 1970.The moulds are evenly filled with fresh concrete in three layers and each layer
is compacted by not less than 35 blows uniformly distributed using a 16mm diameter and
600mm long tamping rod. The top layer on compaction is finished smooth and level with the
top of the mould levelled and covered to prevent
evaporation.
Curing
Test specimens are stored in a cool place free from vibrations at room temperature and of
relative humidity for 24 hours from the time of mixing. After the 24 hours, the specimens
are removed from the moulds and submerged into a curing tank with clean fresh water and
kept until testing time. It should be ensured that the
water into which the cubes are kept is at room temperature.

22
Hardened concrete
Compressive strength test on cubes
This involves the determination of the compressive strength of concrete using
150mm x150mm test specimens.
Compressive strength at 28 days is the maximum load at failure divided by the cross-
section area of the cube.
Testing of the specimens is done at intervals of 7, 14 and 28 days of age.

23
CHAPTER 3: METHODOLOGY
The successive steps that were followed to complete the study are as follows:
Collection of plastics materials.
Preparation of recycled plastic palate aggregate.
Casting of Concrete Cube with control mix using natural aggregate
Cubes casting for varying percentage replacement 0% to 75% of natural aggregate
by plastic aggregate.
Workability and the compressive strength tests.
Determining the weights of the concrete at different percentage replacement.
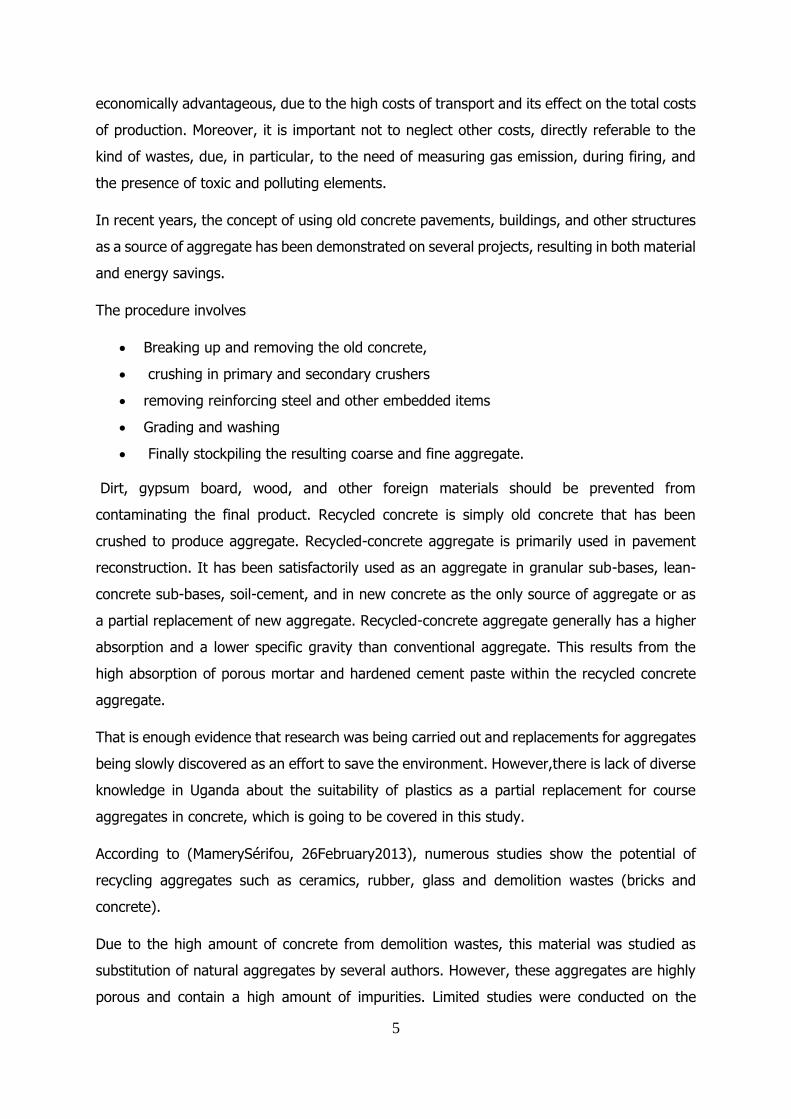
3.1 Making of plastic aggregate
Generally, the process involved use of a series of materials and equipment ranging from
fuel, cutting equipment among other apparatus as per the figure 3-1 below. The plastic
recycling was completed through 5 steps which included;
collecting
Sorting
Shredding
Washing
Heating and,
Molding as shown in figure 3-2.
Collecting: The plastics that were used and are ready for recycling were collected from
their respective and different places of disposal. They particularly included empty vegetable-
oil jerry-cans, water bottles and old plastic Tv sets.
Sorting: This was basically done for the plastic materials collected from areas of disposal
to sort the recycled plastic from the non-recycled that could have been collected from the
disposal areas.
Shredding: The plastic materials were prepared for melting by cutting them into small
pieces using knives.
Washing plastic: The residues of products contained in the plastic materials and various
other contaminants were removed by washing them out using any local detergents. These
residues ranged from vegetable oil to paints and soils.

24
Heating: This involved exposing the plastics to high temperatures till their melting point
using local charcoal stoves/fire place, briquettes/fire wood and saucepans.as shown in figure
3-1.
Moulding: This was the second last stage and it involved pouring the molten plastics into a
metallic mould and left to harden to form palates. The mould measured 300mm by 120mm
by 20mm for length, breadth and height respectively. The width was further sub-divided into
6 rows each of 20mm as compartments into which the molten plastic was poured. The
molten plastic was left to cool for about three hours after which it was removed from the
moulds by controlled re-heating of the mould as the plastic had a tendency of sticking to the
sides.
Briquette and firewood as fuel Saucepan and metallic mould
Figure 2-2Material and equipment used in making plastic pallets.
25
Figure 2-3 Processes involved in making plastic pallets.
Having removed the cold hardened plastic bars from the mould (the plastic bars measured
20x20x300mm), they were further cut into sizeable aggregate pieces with a hack saw whose
sizes approximated to 10x10x10mm each though the dimensions did not necessarily hold for
all pallets as some had varying dimensions as the final stage of their production. At that
level, the plastic is then rendered ready for use as coarse aggregate.
Heating of shredded plastic to
melting point
Pouring of molten plastic into the
metallic mould
Hardened plastic bars in a mould
cutting plastic bars to aggregate plastic pallet aggregates

26
3.2 Casting the mix
Casting the concrete mix involved preparing a control mix at 0% replacement and the
different percentage replacement. In this case, the concrete was batched by volume where
one part of cement was mixed with two parts of fine aggregates and four parts of fine
aggregates.
3.2.1 The slump test
Concrete slump test for determining the workability of the concrete mixes was carried out
according to BS 1881: Part 102: 1983 as per the steps below;
The mould was held firmly against the surface below with the funnel.
The funnel was filled with the sample concrete in three layers each approximately one-
third of the height of the mould when tamped.
Each layer was tamped with 25 strokes of the tamping rod, the strokes being
distributed uniformly over the cross-section of the layer.
The concrete was then heaped above the mould before the top layer is tamped.
After the top layer was tamped, the funnel was removed.
the top of the mould was levelled by sawing and rolling motion of the tamping rod.
With the mould still held down, the surface below was cleaned off any concrete which
had fallen onto it by leaking from the lower edge of the mould.
The mould was then removed from the concrete by raising it vertically, slowly and
carefully, in 5 s to 10 s, in such a manner as to impart minimum lateral or torsional
movement to the concrete.
Immediately after the mould was removed, the slump as measured to the nearest 5
mm using a rule to determine the difference between the height of the mould and of
the highest point of the specimen being tested. As per the figure 3-3 below and results
were recorded.

27
a) Slump equipment b) Taking of readings for the slump.
Figure 2-4 Equipment and procedure for Slump(Workability) test.
3.2.2 Casting of specimens
The specimen cubes were cast for varying percentage replacement of 0%, 25%, 50% and
75% of natural aggregate with plastic palate aggregates.
The specimen was basically prepared by batching and mixing of concrete constituents by
volume to the required consistency after which they were placed into oiled concrete mould
cubes that measured 150mm as per figure 3-4 below.
The simple procedure for determination of each required percentage of replacement was as
follows;
Each standard concreate mould was in position to hold six batch containers of course
aggregates excluding cement and sand (fine aggregates). So as per the stated class of
concrete, the constituents were mixed in the ratio 1:2:4 (batched by volume) for cement,
sand and coarse aggregate (either stone or plastic) respectively. The figure 3-4 shows the
batching process.

28
a) Batch container, mix tray and mould b) Coarse aggregates (stone)
a) Mixing constituents with 0% plastic
replacement
Mixing constituents at varying plastic %
replacement
Figure 2-4 Preparation of concrete cubes(specimen).
Now that in the ratio 1:2:4, the value “four” denotes coarse aggregate composition, the
table 3-1 below shows mode of determination of percentage replacements.
Table 2-3 Determination of plastic replacements during batching.
Stone
Aggregates
Plastic
pallets
Stone
composition %
Plastic
replacement %
Nu
mb
er
of
ba
tch
co
nta
ine
rs w
ith
dif
fere
nt
co
ars
e
ag
gre
ga
tes
4 0 4
4𝑥100 = 100
0
3 1 3
4𝑥100 = 75
25
2 2 2
4𝑥100 = 50
50
1 3 1
4𝑥100 = 25
75

29
For each percentage replacement, concrete cubes were cast prior to the compressive
strength test that was to be carried out after 7 and then 28days respectively of curing.
3.2.3 Curing
The cubes were soaked in water bath and cured for 7 and 28 days respectively as shown in
figure 3-5.
Figure 3-5, Curingthe cubes in a water bath
3.2.4 Weights of the specimen cubes
The specimen cubes had to be weighed individually on a digital scale and have all their
individual weights recorded at 7 and 28 days of curing as shown in figures 3-6 and 3-7.
a) At 0% replacement b) At 25% replacement b) At50%replacement

30
c) At75%
replacement
Figure 2-5 Weight readings after 7days for different representative cubes.
At 0% replacement
At 25% replacement
At 50%
replacement
At 75% replacement
Figure 2-6 Weight readings after 28 days for different representative cubes.
31
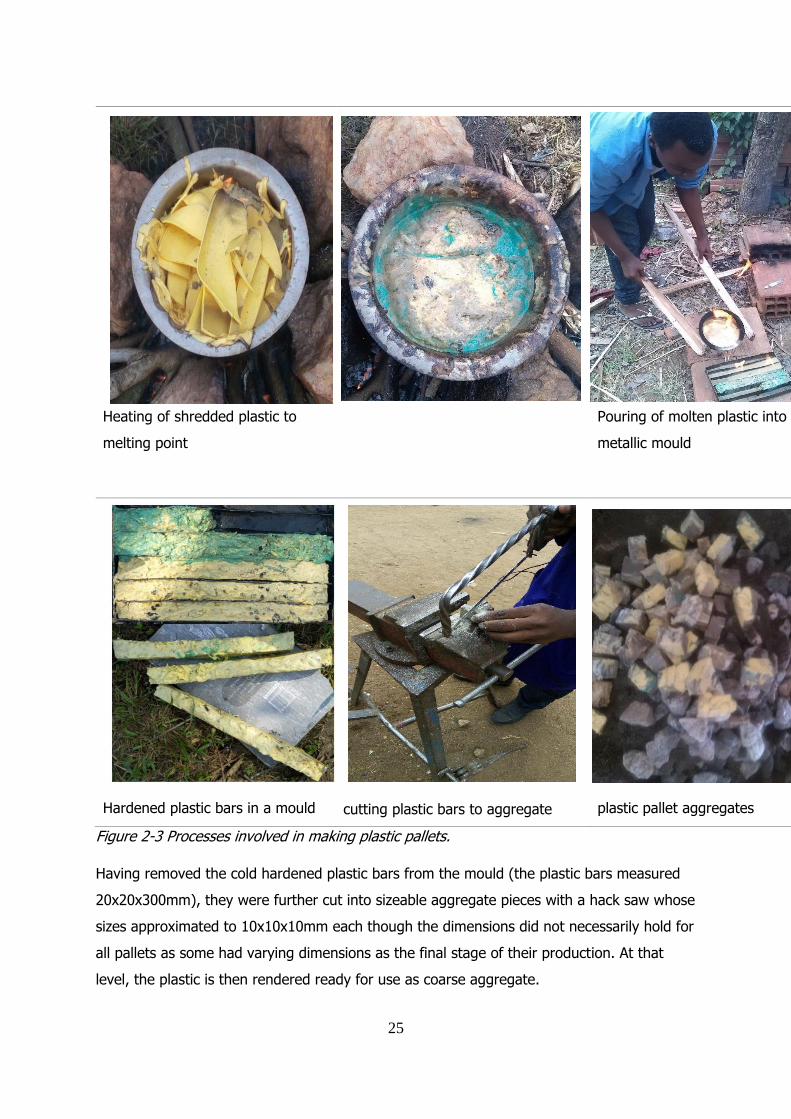
3.3 Compressive strength test
This test was done to determine the compressive strength of the concrete according to BS
4550-3.4: 1978 on the cubes after their respective days of curing. It involved the following
steps;
The specimen blocks were removed from the water after the specified curing time and
the excess water wiped away from the surface.
The dimensions of the specimens were taken to the nearest 0.2m
The bearing surface of the testing machine was cleaned
The specimen was placed in the machine in such a manner that the load was applied
to the opposite sides of the cube cast.
The specimen was aligned centrally on the base plate of the machine.
The movable portion of the machine was rotated gently by hand so that it touched the
top surface of the specimen.
The load was applied gradually without shock and continuously at the rate of
140kg/cm2/minute till the specimen failed
The maximum load was recorded and noted.
The steps as shown as per the figure 3-8
mfi compression machine Cube in compression chamber
At 50% replacenent
75% replacement
Figure 2-7 Compressive strength test equipment and some readings

32
CHAPTER 4:RESULTS AND DISCUSSION
4.1 Slump test results and analysis
Slump tests at various percentage replacements were done and results tabulated as shown
in table 4-10 below.
Table 0-1 slump test results
Cube plastic composition
(%)
Slump (mm)
0 50
25 53
50 56
75 60
A trend of variation of workability of concrete with increasing plastic percentage replacement
was thus plotted as shown in the figure 4-5 below.
Figure 0-1 variation of workability with plastic replacement.
The trend in figure 4-5 shows a general increase in workability with increase in plastic
replacement. This can be explained in the sense that plastic has very low or completely no
water absorption capacity and therefore improving the rheological or workability of the
material with other constituents in concrete.

33
4.2 Analysis of weight results of concrete cubes
Consider the tables 4-1 and 4-2 below with results of weights of the concrete cube weights
at 7 and 28 days of curing respectively
Table 0-2 Weights of the various concrete cubes after 7 days of curing.
Cube plastic
composition
(%)
Cube weights in kg at 7 days of curing (1 week)
Average weight
of the
cubes(Kg) Sample I Sample II Sample III
0 8.088 7.264 7.624 7.659
25 7.428 7.528 7.498 7.485
50 6.83 6.648 6.694 6.724
75 6.01 6.135 6.214 6.120
Table 0-3 Weights of the various concrete cubes after 28 days of curing.
Cube plastic
composition
(%)
Cube weights in kg at 28 days of curing (4 weeks)
Average weight
of the
cubes(Kg) Sample I Sample II Sample III
0 8.008 7.862 7.811 7.894
25 7.158 7.032 7.122 7.104
50 6.74 6.038 6.332 6.370
75 5.89 6.012 5.81 5.904
The average values of weights of the concrete cubes were used to calculate the average
densities considering a volume of 0.003375m3 for the 150mm cubes as shown in the table
4-3 overleaf.

34
Table 0-4 Average densities of the cubes at 7 and 28 days of curing
Cube plastic
composition
(%)
Average Cube weights in kg Average density of the
cubes(Kg/m3)
7 days 28days 7 days 28days
0 7.659 7.894 2269.3 2339.0
25 7.485 7.104 2217.8 2104.9
50 6.724 6.370 1992.3 1887.4
75 6.120 5.904 1813.3 1749.3
These average density values in table 4-3 above were used to obtain a trend of variation of
density with percentage replacement as shown in figure 4-1 below.
Figure 0-2 Variation of Average density with plastic replacement.
A plot of concrete cube densities against the different percentage replacements generally
shows a decreasing trend in density with increasing plastic percentage replacement. This is
so because the plastic used is of a lower density compared to that of the natural stone
aggregates. Hence the more the percentage of plastic in a cube, the lower the density of
that cube.

35
4.2 Compressive strength results
The compressive loads and strengths at which the different cubes failed were as shown in
the tables 4-4 and 4-5 overleaf;
The value of compressive strength of each of the specimen cubes is given by the expression
below;
𝑐𝑜𝑚𝑝𝑟𝑒𝑠𝑠𝑖𝑣𝑒 𝑠𝑡𝑟𝑒𝑛𝑔𝑡ℎ =𝑀𝑎𝑥𝑖𝑚𝑢𝑚 𝑐𝑜𝑚𝑝𝑟𝑒𝑠𝑠𝑖𝑣𝑒 𝑙𝑜𝑎𝑑 (𝐾𝑔)
𝐶𝑟𝑜𝑠𝑠 − 𝑠𝑒𝑐𝑡𝑖𝑜𝑛𝑎𝑙 𝑎𝑟𝑒𝑎 𝑜𝑓 𝑠𝑝𝑒𝑐𝑖𝑚𝑒𝑛 (𝑐𝑚2)
In this case the standard moulds of 15cm were used giving cubes whose area was;
𝐴𝑟𝑒𝑎 = 15𝑥15 = 225𝑐𝑚2 (22500𝑚𝑚2)
Table 0-5 Compressive strengths after 7 days.
From the results in the table above, trends of variation of compressive strength with plastic
replacement were plotted and it was observed that there was a general decrease in
compressive strength with increase in plastic percentage in each cube as shown in figure 4-2
overleaf. This is due to the fact that natural aggregates have a higher crushing value than
HDPE plastic used in some cubes and this has an overall effect of decreasing strength of
concrete with increase in plastic replacement.
Plastic replacement
Maximum loads (kN) Compressive strengths (kN/mm2)
Average compressive
strength (kN/mm2)
Sample I Sample II Sample III
Sample I Sample II Sample III
0 120 125 125 5.3 5.6 5.6 5.5
25 80 95 60 3.6 4.2 2.7 3.5
50 75 90 80 3.3 4.0 3.6 3.6
75 70 75 65 3.1 3.3 2.9 3.1

36
Figure 0-3 Variation of compressive strength with plastic replacement at 7 days.
However, it was also observed that the trend first decreases between 0-25% then slightly
increases and finally gradually decreases for all the three samples. This can be explained in
the sense that concrete cubes tested at 7 days normally have an unusual and uncertain
behaviour in strength thus they cannot be considered to draw a conclusion about effect of
plastic on compressive strength.

37
Table 0-6 compressive strengths of concrete cubes after 28days.
Plastic replacement
Maximum loads (kN) Compressive strengths (kN/mm2) Average compressive
strength (kN/mm2)
Sample I
Sample II
Sample III
Sample I Sample II Sample III
0 310 200 300 13.8 8.9 13.3 12.0
25 290 285 280 12.9 12.7 12.4 12.7
50 240 260 255 10.7 11.6 11.3 11.2
75 140 145 140 6.2 6.4 6.2 6.3
From the results in the table above, trends of variation of compressive strength with plastic
replacement were plotted and it was observed that there was a general decrease in
compressive strength with increase in plastic percentage in each cube as shown in figure 4-3
overleaf.
Figure 0-4 Variation of compressive strength with plastic replacement at 28 days

38
A plot of compressive strength against plastic percentage replacement shows steady decrease
in compressive strength between 0 and 50% and later drastically decreases with increase in
plastic replacement.This could have been due to the fact that in the process of preparing the
plastic palate aggregate, the palates were cut with shape and smooth which hindered the
adequate bonding with the other concrete constituents hence lowering the compressive
strength.
Furthermore, in comparison to the trends obtained at 7 days of compressive strength test,
there are no anomalies of a rapid decrease between 0-50% at 28 days of curing. This could
be explained in a way that concrete at 28 days of curing has or has almost attained the
required strength and at this point, a conclusion can be drawn on the best percentage for
replacement of natural stone aggregate. For this matter therefore, plastic percentage of 50%
with compressive strength of 11.2kN/mm2and the weight 6.370 at 28days is our optimum
percentage replacement of coarse aggregates with plastic waste palates which varied from
the control mix of 0% by 0.8kN/mm2in compressive strength and 1.524Kg in the cube weight.

39
CHAPTER 5 :CHALLENGES, CONCLUSIONS AND RECOMMENDATIONS
5.1 Challenges.
Quite a number of obstacles were faced during execution of this project ranging from finance,
time, hands-on execution of works among others as outlined below.
1. The project was so demanding since it involved collecting plastic materials from the
different disposal points. Also costs of transportation of sand, cement, and naturally
existing stone aggregates was so tedious.
2. There was a challenge of a tedious slow process of making plastic pallets to be used
in concrete. It involved operation in risky environment of hot temperatures which at
times caused painful burns despite the personal protective equipment PPE used during
the venture.
3. There was no machinery to use for quickly making plastic pallets. This slowed the rate
at which the project activities progressed.
4. During lab tests, we encountered a financial problem to facilitate the testing of the
cubes for compressive strength and weights using commercial laboratory.
5. In addition to the above we were not allowed to conduct the tests with the laboratory
technicians.
5.2 Conclusions
5.2.1 Slump test.
Basing on the results obtained from the slump test, the concrete mix is completely workable
at all percentage replacements. The slump test results ranged from 50mm to 62mm at 0%
and 100% respectively. Generally, the slump tests showed an increasing trend in workability
as more plastic palates were used instead of natural stone aggregates which is due to the
limited absorption of water by the plastic pallet. According to research, the medium
workability, is between 50-90mm and thus the obtained workability at 25% plastic
replacement which is 53mm can be used for normal reinforced concrete placed with vibration

40
5.2.2 Compressive strength
It was generally observed that the compressive strength decreased with increase in plastic
replacement. Considering the compressive strength of the cubes after 28 days of curing, it
can be observed that at 25% plastic replacement, the value of compressive strength
(12.7𝑘𝑁𝑚𝑚−2) does not vary greatly from the compressive strength at 0% replacement
(12.0𝑘𝑁𝑚𝑚−2) which in this case was our reference. It is further observed that at 50% plastic
replacement, a compressive strength of 11.2𝑘𝑁𝑚𝑚−2 is also a close value to the compressive
strength at 0%. Conclusively, a plastic replacement between the range of 0% and 51% will
give the required strength. For this particular experiment, we considered a 50% plastic
replacement which was of compressive strength 11.2kN/mm2 and which is below the reference
by 0.8kN/mm2 .
5.3 Recommendations
Based on the compressive strength test, the concrete with 50% replacement of coarse
aggregates with plastic waste palates is recommended to be used in low strength concrete
like blinding and road solders.
I recommend carrying out the same test, that’s to say slump and compressive strength using
different forms of materials other than plastic like quarry dust but maintaining the same mixing
ratios.
I also recommend investigations on different mixing ratios with the different percentage
replacementof coarse aggregates with plastic palates waste.

41
REFERENCES
Aginam C. H. Nwakaire C, O. B. ( 2016). Quarry Dust as a Partial Replacement of Coarse
Aggregates in Concrete Production . Awka : IOSR Journal of Mechanical and Civil
Engineering (IOSR-JMCE) .
Akshay S. Shelke, K. R. (2014). Coconut Shell as Partial Replacement for Coarse Aggregate.
indian: Research India Publications .
Anju Ramesan, S. S. (2015, August). Performance of Light-Weight Concrete with Plastic
Aggregate. ISSN: 2248-9622, Vol. 5, Issue 8, (Part - 5), pp. 105-110 .
BS4550-3.4. (1978). British standards. Britain.
Ghernouti, Y., & Bahia Rabehi. (2011). modern concrete technology. Retrieved from
http://www.theconstructor.net
IS 9103. (n.d.). In Indian standards.
IS:2386 PART 4. (n.d.). In Indian standards. India.
IS1199. (n.d.). Idian Standards.
IS456. (2000). Indian standards.
Konstantin Kovler, N. R. (2011, july). Properties of fresh and hardened concrete . cement and
concrete research.
MamerySérifou, Z. M. (26February2013). A Study of Concrete Made with Fine and Coarse
Aggregates Recycled from Fresh Concrete Waste. Hindawi Publishing Corporation
Journal of Construction Engineering .
Manjunath, A. (2015). Partial replacement of E-plastic Waste as Coarse-aggregate in Concrete.
India: International Conference on Solid Waste Management, 5IconSWM 2015.
Md Meraj(Asst Prof), M. H. (2015). EXPERIMENTAL STUDY ON UTILIZATION OF WASTE
PLASTIC AS AGGREGATE IN CEMENT MORTAR. INTERNATIONAL JOURNAL OF
ENGINEERING SCIENCES & RESEARCH TECHNOLOGY.
Nabajyothi, & Jeorge. (2012). Techniques in modern construction.
P.Vignesh Kumar, R. R. (2014). AnExperimental Study on Partial Replacement of Coarse
Aggregate byIron Slag with Polypropylyne Fiber . International Journal of Science and
Research (IJSR) .