assessing the economic impact of competition: findings
TRANSCRIPT
Assessing the Economic Impact of Competition:
Findings from Kenya
Karen Ellis, Rohit Singh & David Ong‟olo
July 2010
Overseas Development Institute 111 Westminster Bridge Road
London SE1 7JD www.odi.org.uk

ii
Acknowledgements
This research was financed by the UK Department for International Development (DFID). However, the views presented in this paper are those of the authors and do not necessarily represent the views of DFID or the UK Government.
The authors wish to thank all those who provided information and data, comments and other inputs into this report, especially John Davies who participated in the country mission. The authors take full responsibility for any errors or omissions the report may contain.

iii
Contents Tables and charts ........................................................................................................... iv
Executive Summary ........................................................................................................ v
1. Introduction .............................................................................................................. 1
2. Overview of competition policy framework ................................................................ 2
3. The cement market .................................................................................................. 3
4. The beer market ....................................................................................................... 7
5. The sugar market ................................................................................................... 10
6. The mobiles market ................................................................................................ 13
7. Conclusion ............................................................................................................. 19
Bibliography .................................................................................................................. 20

iv
Tables and charts
Table 1: Cement market structure across the 5 case study countries .............................. 3
Table 2: Beer market structure across the 5 case study countries ................................... 8
Table 3: Sugar market structure across the 5 case study countries ............................... 10
Table 4: Average mobile tariffs (calls to the same network) in Kshs (nominal terms) ..... 14
Table 5: Market structure and regulatory information about the 5 markets .................... 14
Chart 1: Retail Cement Price Per 50kg Bag 2007/08 (USD) ............................................ 4
Chart 2: Cement: percentage change in price between 2007 and 2010 .......................... 4
Chart 3: Average beer price per 500ml 2007/08 (USD) .................................................. 9
Chart 4: Average Sugar Production (Tonnes/Hectare) in Case Study Countries 2007 (or closest year for which data available) ............................................................................ 10
Chart 5: Number of mobile subscribers in Kenya 1999 - 2008 ....................................... 13
Chart 6: Average per minute mobile tariff (USD) ........................................................... 15
Chart 7: Mobile subscribers per 100 inhabitants ............................................................ 15
Chart 8: Telecoms investment per inhabitant 2006 (USD) ............................................. 16

v
Executive Summary The Overseas Development Institute has been conducting research examining:
how the policy framework (such as the existence of a competition authority, degree of state ownership, openness to trade etc.) affects the degree of competition present in a given product market; and
how the degree of competition affects market outcomes such as prices, competitiveness, innovation and access to services.
The policy framework and economic performance has been compared in four product markets (sugar, cement, beer and mobile phone services) across five countries (Zambia, Kenya, Ghana, Vietnam and Bangladesh). This paper summarises the findings from Kenya. A synthesis of the broader findings based on the results from all five countries has been published in an ODI Research Report1. Key findings from Kenya are as follows:
Kenya suffers from a relatively high degree of concentration in its cement and beer industries, and a number of competition problems and anti-competitive practices have been identified in both. Kenya‟s Competition Authority, the Monopolies and Prices Commission (MPC), has been monitoring both sectors, though many problems remain. Ongoing monitoring of these sectors, and publication of evidence on the costs of competition problems, could help to build public demand and support for reform.
Kenya has three cement manufacturers, but the dominant firm has ownership stakes in both the others, giving it some degree of influence over the other firms (e.g. with joint Directorship), which could potentially result in reduced competition between the three firms. Anecdotal evidence suggests that this happened after a price war which started soon after a new (third) entrant came into the market in the mid 1990s. It was reported by market participants that the price of a 50kg bag of cement fell from KSh450 to KSh250 at that time, and that exclusive distribution arrangements with the incumbents prevented the new entrant‟s product being stocked by dealers. The weaknesses of the competition law and lack of effective review of mergers and acquisitions may have allowed this to happen.
The Kenyan beer market is essentially a monopoly where the dominant firm has a market share of at least 90%. Previous competition studies in the sector have found many anti-competitive practices including territorial allocation, exclusive dealership and price fixing.
A second large beer producer attempted to enter the market, and this resulted in a ferocious price war where prices fell dramatically. Eventually, the new entrant withdrew from the market citing problems in accessing barley. But the retreating company also signed a share swap agreement with the incumbent, which
1 “Assessing the Economic Impact of Competition”, Ellis & Singh (2010) available from: www.odi.org.uk/bdp

vi
allowed it to maintain a stake in the Kenyan market. At the same time the Kenyan incumbent closed its plant in Tanzania, but retained its investment in that country by taking a shareholding in a Tanzanian beer company that was owned by the retreating firm. This agreement ended direct competition between the two firms in both markets, potentially allowing greater profits to be made in both and to be shared, to the benefit of both parties. Such a regional carve-up is anti-competitive and can only be tackled by regional competition authorities.
The mobile telephony market in Kenya is fairly well regulated, and is performing
relatively well. It has been fairly highly concentrated until recently, and has exhibited relatively high prices. The recent introduction of two new operators has helped to increase competition, and prices have dropped dramatically – by around 50% - since then, though this is due in part also to regulatory changes.
The state led sugar industry is one of the most inefficient of the countries studied. Our calculations show that in Kenya 3.28 tonnes of sugar are produced per hectare under cultivation, whereas in Zambia over 15 tonnes are produced per hectare. In addition, independent statistics suggest that the average cost to produce one metric tonne of sugar in Kenya is $415 compared to the global
average of $263.
Kenya´s sugar industry is struggling to survive, and this will be exacerbated by further liberalisation required under the COMESA agreement. Thus the sector urgently needs reform, but this is likely to be opposed by strong vested interests, as it means that some state owned sugar mills are likely to go out of business. The best way to overcome this may be to establish and facilitate coordination amongst other interest groups who stand to gain from reform. The competition authority and consumer organisations may be able to help achieve this, by establishing and coordinating such groups, publicising the issue and providing evidence of the benefits of reform.
The Monopolies and Prices Commission (Kenya‟s Competition Authority) plays a valuable role in monitoring possible anti-competitive practices in the sectors reviewed, identifying and highlighting problems, influencing government decisions and building a culture of competition. However, it faces challenges in tackling competition problems when there are powerful vested interests, including in the Government, opposed to reform. The influence and impact of the MPC could be greatly strengthened through reform (e.g. to make it operationally independent, strengthen capacity, and update the Competition Law).
Overall, the results of the study showed that markets characterised by more competition, with more players, more dynamic entry and exit, and more intense rivalry for customers (e.g. through price promotions, special offers, and marketing campaigns etc.) tend to deliver better market outcomes. These outcomes include lower prices and better service for consumers, as well as more internationally competitive production, which can generate increased exports, foreign exchange, jobs and industrial growth. It also showed that the introduction of competition – or indeed even the prospect of increased competition - can have a significant and immediate impact on prices. However, the research has also shown that competition is often constrained, for various reasons. Problems such as market dominance and anti-competitive practices are very
vii
common in some markets, including the cement and beer industries. Thus competition authorities have an important role to play in monitoring, publicising and tackling such behaviour. However, it is also clear that government policy and state involvement is very important in determining competition and market outcomes, whether it be through regulation and privatisation, state ownership, price controls, subsidisation, import protection, industrial policy or simply self-serving business deals. Although some of these wider policies may reflect other important policy objectives, it also suggests that the potential competition impact of these wider economic policies should be given consideration wherever possible, in order to ensure a good understanding of the overall costs and benefits. Through comparison with the other countries studied, (which either do not have competition authorities, or have only recently introduced one), it seems the competition authorities in Zambia and Kenya have contributed to the development of a culture of competition, by raising the profile and understanding of competition issues, and by building awareness of the costs of competition problems. This is helping to arm the consumer movement with the evidence it needs to demand improved market outcomes. Competition authorities have also played an important role in monitoring market behaviour. Simply the existence of a competition authority, and the knowledge that it can monitor and publish details of any problems, can serve to constrain anti-competitive practices or abuse of dominance by firms, who fear the consequences (which may be bad publicity at the very least), if they infringe the law. Although competition authorities may sometimes suffer from political interference when trying to tackle competition problems involving vested interests opposed to reform, they can still provide an important counterweight in government against vested interests wishing to pursue corrupt or self-serving business policies at the expense of consumers and the wider economy. Ultimately, competition is fundamental to a well-functioning market economy, and appropriate competition policies and the establishment a competition authority can help to ensure markets work more efficiently and effectively. Competition can help undermine corruption, and facilitates international competitiveness, private sector development, and employment creation, which are in turn crucial for achieving the wider economic growth that is needed to lift developing countries out of poverty.

1
1. Introduction The Overseas Development Institute has been conducting a research project investigating the impact of competition in four product markets (sugar, cement, beer and mobile phone services) in five countries (Kenya, Zambia, Ghana, Vietnam and Bangladesh). This paper summarises the findings from Kenya. The findings from all the countries have been synthesised and published in an ODI Research Report2. The paper first provides a brief overview of the competition policy framework, then discusses the key competition issues that were identified in relation to each of the 4 product markets, and draws some comparisons with the findings from other countries – it does not provide comprehensive analysis of each of the markets. Where limited published or independent information is available, the findings are based largely on interviews which were undertaken during a field mission that took place in June 2008. The paper has subsequently been updated to discuss any major developments that have taken place in the markets since then.
2 Ellis & Singh, 2010.

2
2. Overview of competition policy framework
Currently, the national competition law is mainly embodied in the Restrictive Trade Practices, Monopolies and Price Control Act (MPCA), Cap.504 of the Laws of Kenya, which established the Monopolies and Prices Commission (MPC), within the Finance Ministry. It seems that the current Kenyan competition law was meant to be a transitional measure to move the country from a price control regime to one based on free market principles. The Government of Kenya established a Task Force to review the law in May 2005. The Team submitted a report to the Minister, and in March 2009, a draft Competition Bill was published and presented for discussion in the National Assembly. The Bill has gone through 2 readings in Parliament and is currently being discussed by the Finance, Planning and Trade Committee.3. Administrative deficiencies in the law have been highlighted in the voluntary peer review on competition policy conducted by UNCTAD in Kenya4. These deficiencies have also been re-iterated in a recent speech made in an important international competition conference by Peter Kanyi of the MPC5. Interviewees for this project cited such concerns as ambiguities in the application of the law, and the lack of provision for the MPC to clear mergers by default or otherwise fast-track mergers that are essentially unobjectionable, which meant that monitoring mergers was very time consuming and crowded out other activities. The Kenyan competition authority has limited formal independence in that it is an integral part of the Ministry of Finance, its budget is within the Ministry‟s budget and the Minister appoints its Commissioner. The MPC has limited powers of its own, and to some extent appears to operate as an advisory body to the Minister. The Minister is not bound to accept its advice, but it seems that Ministers have generally been reluctant to reject advice publicly, though we understand that there have sometimes been discussions around the need for the MPC to alter its advice. In addition, investigations into unwarranted market concentration cannot be independently initiated by the MPC – only on the instructions of the Minister. For prosecution of breaches of the law, the MPC has no powers but relies upon the criminal justice system. A prosecution would have to be initiated by the Attorney General‟s office. The Act established a restricted practices appeal tribunal, appointed by the Minister of Finance and headed by a judge. In practice, it seems this tribunal has seen little activity. The MPC itself rarely reaches formal decisions, generally relying on consent for agreements to, for example, terminate restrictive practices. In short, the current Act (Cap.504) departs from what is increasingly considered desirable in terms of international best practice. Best practice would be to include measures in the act which ensure the autonomy of the competition agency, separate the responsibilities for investigation and adjudication, and enable the competition agency to impose sanctions at a level which act as an effective deterrent. A new Competition Bill, (2009) has been presented to parliament and may be passed in the near future. This Bill does seem to address a number of the current deficiencies in the law.
3 Based on interview with MPC
4 United Nations Conference on Trade and Development (2005)
5 Peter Kanyi (3
rd September 2009)

3
3. The cement market The cement sector is one that is often highly concentrated, and thus suffers from limited competition and has been a source of concern for competition authorities in many countries across the world. However, the five countries in our study have very different market structures, as shown in Table 1Error! Reference source not found. below, which facilitates some interesting comparisons: Table 1: Cement market structure across the 5 case study countries
Country No. of firms 2008
State Ownership
Estimated market shares of leading firm
Head of population
(millions) per cement
company6
Kenya 3, but with joint ownership
1 SOE 65% 13.6
Zambia 2 No 85% 4.42
Ghana 2 No 64% 12.2
Vietnam 90
33 SOEs 40% 0.99
Bangladesh 34 1 SOE 12% 4.8 Source: ODI, United Nations Population Division
The retail cement price across the 5 countries is shown in chart 1 below. While other country-specific factors will also of course affect prices, such as input costs, and the costs of doing business, it is interesting that prices are highest in the most concentrated markets, and lowest in the least concentrated markets. Zambia (which has a near monopoly with an 85% market share held by the leading firm as shown in Table 1 in 2008), has the highest price, while Vietnam (which has 90 cement producers), has the lowest price. The high costs of doing business in Zambia, which is landlocked, compared to coastal Vietnam, which has abundant clinker deposits, should also be recognised. However, it seems likely that market structure and competition are important determinants of price. A large new privately-owned plant commenced production in Zambia in late 20097, breaking up the previous monopoly, and Figure 6 shows that prices have dropped by almost ten percent since 2007, while prices in other countries have risen, as Chart 2 shows.
6 Population data from United Nations Population Division: http://esa.un.org/unpp/index.asp
7 http://www.laurencepaul.com/index.php?option=com_content&view=article&id=177:zambezi-portland-
cement-begins-operations&catid=1:Latest%20News&Itemid=54

4
Chart 1: Retail Cement Price Per 50kg Bag 2007/08 (USD)
Source: ODI research
Chart 2: Cement: percentage change in price between 2007 and 2010
Source: ODI research
Kenya‟s cement market is between these two extremes. In 2008, at the time of the study team‟s visit to the country, Kenya had 3 cement manufacturers, and the dominant cement player had an estimated market share of around 65%. By 2010 a new firm had entered the market, and we were told that the market share of the largest firm had decreased to around 50%.
5
Although in 2008 Kenya had three cement manufacturers, it was also the case that the largest firm had ownership stakes in both the others. This could potentially mean that they had some degree of influence over the other firms (e.g. through joint Directorship), or knowledge about their competitive strategies, which could potentially result in reduced competition between the three firms. It was also suggested that there was a degree of price leadership, with the other firms following the largest firm. Anecdotal evidence suggests that this happened after a price war which started soon after a new (third) entrant came into the market in the mid 1990s. It was reported by market participants that the price of a 50kg bag of cement fell from KSh450 to KSh250 at that time, and that exclusive distribution arrangements with the incumbents prevented the new entrant‟s product being stocked by dealers. We were told that during this period, the new entrant built up considerable debts and was facing potential closure, until the market leader acquired a share in its business, in return for settling some of its debts. If this was the case, it is possible that anti-competitive practices such as predatory behaviour, permitted this joint ownership to happen in the first place. The weaknesses of the competition law and lack of effective review of mergers and acquisitions (which covers partial cross ownership linkages) has also allowed this to happen. Further efforts seem to have been made to consolidate the pattern of joint ownership. One of the cement companies is still partially state owned, although the government has been attempting to privatise it for several years. But in 2000 the MPC blocked the sell-off of these shares to the largest (private) firm, as it would have obtained a majority stake, and resulted in an even higher degree of joint ownership. Rumours of a possible merger between the two firms arose again in 20078, but the competition authority has informally said to the ODI study team that such a merger is unlikely to be approved. Thus the MPC appears to date at least, to have succeeded in blocking a merger that could potentially reduce competition in the cement market, and which could in turn have resulted in higher prices. Since the time of the study team‟s visit to Kenya It is understood that the market leading firm has now divested from the smallest firm, thereby decreasing the level of cross-ownership in the sector. This bodes well for competition. In terms of market structure, the most interesting comparison to make is with the Bangladesh and Vietnam markets, which are the least concentrated and probably the most competitive of the five cement markets we studied. In comparison with the other countries, there appeared to be a much greater degree of both price & non-price competition. Chart 1 shows that they enjoyed the lowest prices of all the countries, and we also observed significant non-price competition, with cement firms trying to attract customers by offering credit, technical support and various promotions. The larger number of players in these countries cannot simply be explained by their larger market size in terms of population, as Table 1 shows that the population divided by the number of cement firms is considerably lower in these two countries than in the African countries studied. This suggests it could be economically feasible to increase the number of cement firms producing in African countries too. In any case, the scope to export cement means that domestic market size should not necessarily constrain the number of cement firms that can viably operate within a country. Indeed Kenya already
8 Business Daily Africa (15th August 2007)

6
exports significant volumes of cement, which could potentially be increased, creating more jobs and yielding greater foreign exchange. In any case, there has been significant growth in demand for cement within Kenya, and projections for continued growth. There is evidence that the inflow of imported cement from Egypt is also increasing, which is likely to be increasing competitive discipline on the producers. The domestic cement producers are increasing capacity, and other new entrants are poised to enter the market over the next few years so the cement market in Kenya may become more competitive going forward. Market entry by new independent cement producers bodes well for competition in the market, and may result in lower prices, resulting in cheaper construction and infrastructure development, and more jobs and exports, all of which contribute to growth.

7
4. The beer market For this study we focused on the market for formally produced clear beers, though there are also local brews of different sorts produced in each of the countries. We considered the local brews to be operating in a separate market, as they are usually purchased and consumed in different ways, and thus do not appear to be close substitutes for clear beer. In Kenya, the clear beer market is essentially a monopoly, with one player holding over 90% market share, and with some small, high end players and imported premium beers accounting for the rest of the market. We were told that in the late 1990s, another large beer producer attempted to enter the market, and that this resulted in a ferocious price war, in which prices fell dramatically9. In the end the new entrant withdrew, citing difficulties in accessing barley. (We were told that the sourcing of barley is controlled by the dominant beer producer in Kenya, which if true, would be a potential source of market power, given that there is an import tax on barley, which would create a price disadvantage for any firm forced to import it)10. But the retreating company also signed a share swap agreement with the incumbent, which allowed it to maintain a stake in the Kenyan market. At the same time the Kenyan incumbent closed its plant in Tanzania, but retained its investment in that country by taking a shareholding in a Tanzanian beer company that was owned by the retreating firm. This agreement would thus end direct competition between the two firms in both markets, potentially allowing greater profits to be made in both and to be shared, to the benefit of both parties11. There is no law preventing this kind of cross-border arrangement, and many multinationals compete on a regional basis in this way. Where this results in reduced competition in individual countries, this may be detrimental to that country, but it is not within the power of a national competition authority to examine cross-border activities for any possible competition concerns. However, regional competition laws and authorities, such as the new COMESA competition authority, may have the power to examine these kinds of arrangements. Thus regional competition authorities can complement national competition authorities and play a very important role in policing the activities of multinationals that operate across borders, and ensuring consumers‟ interests are protected. A study by Kenya‟s Monopolies and Prices Commission (MPC) and UNCTAD/UNDP (2005)12 found evidence of a number of anti-competitive practices taking place in the beer market in Kenya, including:
9 Evenett & Jenny (2004)
10 Export Processing Zones Authority (2005)
11 http://www.allbusiness.com/africa/1130729-1.html
12 United Nations Conference on Trade and Development 2005

8
territorial allocation (where each distributor operates only within a specific area precluding direct competition);
exclusive dealership (preventing dealers from contracting with any other beer producers);
price fixing (whereby the wholesale price of beer which distributors must charge is fixed by the producer); and There is also evidence that the incumbent beer monopolist provided coolers to bars, as long as they are only used for their own products. In fact, some sources suggest that bar owners faced automatic withdrawal of the facility any time they if they were found to
put rival products in the coolers.13 The MPC noted the absence of adequate provisions to tackle these problems in the market. This suggests a review and strengthening of the competition law could help the MPC to tackle these kinds of practices in future, which could have benefits for consumers. Table 2: Beer market structure across the 5 case study countries
Country No. of firms 2008
State Ownership
Estimated market
shares of leading firm
Imports as % domestic
consumption
Kenya 1 No 90-100% <5% (premium end)
Zambia 1 No 85-90% 4% (premium end)
Ghana 2 No 60% 4% (premium end)
Vietnam 7 (of which, 3 are large
with combined
market share of
60%)
Yes, majority of firms are SOEs incl. 2 of largest 3
31% <5%(premium end)
Source: ODI, various sources
13
Ong‟olo (2004)
9
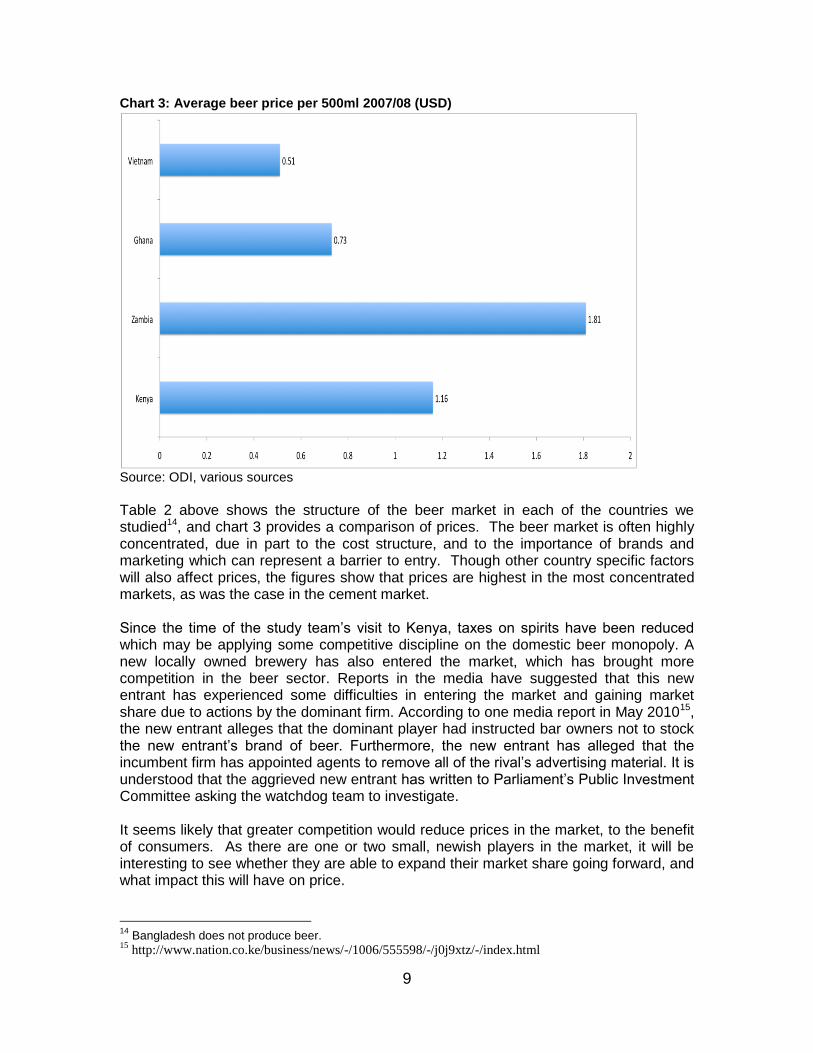
Chart 3: Average beer price per 500ml 2007/08 (USD)
Source: ODI, various sources
Table 2 above shows the structure of the beer market in each of the countries we studied14, and chart 3 provides a comparison of prices. The beer market is often highly concentrated, due in part to the cost structure, and to the importance of brands and marketing which can represent a barrier to entry. Though other country specific factors will also affect prices, the figures show that prices are highest in the most concentrated markets, as was the case in the cement market. Since the time of the study team‟s visit to Kenya, taxes on spirits have been reduced which may be applying some competitive discipline on the domestic beer monopoly. A new locally owned brewery has also entered the market, which has brought more competition in the beer sector. Reports in the media have suggested that this new entrant has experienced some difficulties in entering the market and gaining market share due to actions by the dominant firm. According to one media report in May 201015, the new entrant alleges that the dominant player had instructed bar owners not to stock the new entrant‟s brand of beer. Furthermore, the new entrant has alleged that the incumbent firm has appointed agents to remove all of the rival‟s advertising material. It is understood that the aggrieved new entrant has written to Parliament‟s Public Investment Committee asking the watchdog team to investigate. It seems likely that greater competition would reduce prices in the market, to the benefit of consumers. As there are one or two small, newish players in the market, it will be interesting to see whether they are able to expand their market share going forward, and what impact this will have on price.
14
Bangladesh does not produce beer. 15
http://www.nation.co.ke/business/news/-/1006/555598/-/j0j9xtz/-/index.html

10
5. The sugar market Table 3 below provides an overview of the market structures across the countries, showing how differently the sugar market is structured in each of the countries. Table 3: sugar market structure across the 5 case study countries
Country No. of firms 2008
State ownership
Market shares of
leading firm
Imports as % domestic
consumption
Kenya 7 Yes, the State owns nearly all
mills
54% (firm with most
private sector participation)
15%
Zambia 3 No 93% 0%
Ghana 0 N/A N/A 100%
Vietnam 40 Yes, high degree of
state ownership
9% 4%
Bangladesh 16 SOE mills & 4 private refiners
Yes, State owns nearly
all mills
47% 10%
Chart 4: Average Sugar Production (Tonnes/Hectare) in Case Study Countries 2007 (or closest year for which data available)
Source: ODI, various sources
In Kenya, the competitiveness of the sugar sector is affected more by the comparatively high degree of state involvement in the sector, than by the practices of private firms. There were 7 operating sugar mills at the time of the mission (8 by 2010), all except one of which have some degree of state ownership. The company with the biggest market share, and most efficient production, is the one with the least degree of state ownership (20% ownership) compared with the others (with the exception one new but small, fully private mill).

11
Our research has highlighted that Kenya has very inefficient sugar production compared with Zambia, which has 3 privately owned sugar producers. Our calculations show that in Kenya 3.28 tonnes of sugar are produced per hectare under cultivation, whereas in Zambia over 15 tonnes are produced per hectare (see chart 4 above). In addition, independent statistics suggest that the average cost to produce one metric tonne of sugar in Kenya is $415 compared to the global average of $26316. It appears that the relatively poor production and efficiency levels can largely be explained by the high degree of state ownership and intervention in the market. Although pricing has been liberalised to some degree, the government still intervenes in price setting intermittently (e.g. to hold prices down when there are sugar shortages due to a poor harvest during which the price would otherwise rise). This creates financial difficulties for state owned mills who are forced to price below cost. As a result many face high levels of debt, and have been unable to invest in upgrading plant and machinery, which over time has made them increasingly uncompetitive. Thus at least some of the state owned sugar mills appear to be struggling to survive. There is a continuing decline in productivity of the industry because the production technology used is becoming increasingly obsolete. At the mill level, crushing of cane into sugar is inefficient due to out of date technology and frequent breakdowns. At the farm level, cane yields are low because smallholder farmers have little incentive to increase their output (e.g. by using faster ripening seed varieties) as it would require higher maintenance, and they would not be able to sell their extra produce in any case, due to limited milling capacity. In addition, mills often owe money to farmers, who cannot be sure if or when they will receive payment. As a result, farmers often fail to repay loans made to them by their out-grower associations. This apparent sector-wide tolerance of non-payment may be exacerbated by the bailouts that are sometimes given to sugar mills by the government. Furthermore, farmers are generally paid for the amount of sugarcane they deliver to the mills in terms of weight, rather than sucrose content. This does not incentivise farmers to improve the quality of the cane they produce, which in turn reduces the efficiency of the mills. The Government has been resisting changes to import tariffs and quotas that are due to be phased out under agreed COMESA trading arrangements. Given the uncompetitiveness of the sector, many bankruptcies and job losses could result from such liberalisation. However, come 2012, Kenya is required to remove all protection from sugar imports of COMESA origin. It seems likely that some of the existing sugar mills will struggle to survive when that happens, unless the Government succeeds in obtaining further extensions to the date when the market must be liberalised. Even if further extensions are obtained, the ongoing subsidisation of losses and price setting by the Government is not sustainable in the long run. This is of considerable concern given that 6 million livelihoods currently rely on the sugar sector in Kenya. There are several new entrants to the market who are hoping to obtain the necessary approvals to start up, and would potentially operate on a very large scale. However, their entry into the market may again jeopardise the survival of the existing, inefficient, operators, so they may face political barriers to entry.
16
LMC International Ltd (2005)

12
Significant privatisation and restructuring are needed to secure the industry‟s future. Although privatisation is currently an aim of the government, many sugar mills are not commercially attractive, given their high levels of debt, and the extensive investment in plant and equipment that is needed to bring it up to modern day productivity levels. Thus it seems likely that at least some of the mills in Kenya will need to close if the sugar industry is restructured. To increase competition would also require changes to subsidies, regulatory controls, ownership structures, mill governance, trade restrictions and research (e.g. into higher yielding varieties of cane), development and extension. However, given:
the number of livelihoods that are currently dependent on the existing sugar mills, (and the fact that the new entrants in the sugar market are unlikely to establish in the same areas as the existing mills);
that many electoral constituencies in Kenya are dominated by sugar growers who would strongly oppose such restructuring;
and that, historically, the sugar sector was established by the government to promote employment and growth in rural areas, not as a commercial venture; undertaking the required reform is likely to be very challenging politically. The problem is that those who are likely to lose from the reform are much more easily identifiable, and often have a lot more to lose as individuals, are likely to be more concentrated and well organised, and hence lobby more effectively and vociferously than those who stand to gain from reform, who in this case would be both household and industrial consumers who would obtain sugar more cheaply, and those people who would gain from the new jobs created in a more healthy, dynamic sector and economy. However, at the current time, the high degree of state intervention in the sector, unhealthy market dynamics, lack of competitiveness, and vested interests against reform that this generates, is clearly undermining investment and growth in the sector.

13
6. The mobiles market The mobiles market is one where liberalisation and the introduction of competition have had clear benefits in terms of falling prices and increasing coverage over time across the world. Kenya is no exception; the introduction of new entrants has coincided with falling prices and rising mobile penetration. Mobile services started in 1992 with the Government-owned mobile operator offering analogue services. During this initial period services were so expensive that it resulted in a mobile subscriber base of less than 20,000 for a period of seven years (from 1993 – 1999)17. The enactment of the Kenya Communications Act, 1998 led to the introduction of competition in the cellular mobile industry. This started in 1999, when a 40% stake in the state owned incumbent operator along with management control was sold to a major international mobile services provider, and two new licenses were tendered in 2000 and 2003. It was only after competition was introduced that penetration increased, as can be clearly seen in chart 5 below. Prices have also been coming down as shown in Table 4, which may be due to the increase in the number of operators. Chart 5: Number of mobile subscribers in Kenya 1999 - 2008
Source: Communications Commission of Kenya (2008)
17
http://www.cck.go.ke/market_information-telecommunications/

14
Table 4: Average mobile tariffs (calls to the same network) in Kshs (nominal terms)
Year 2004 2005 2006 2007 Q1 2008/9
Q2 2008/9
Q1 2009/10
Q2 2009/10
Average Tariff
20.18 19.23 18.89 16.17 16.43 8.98 5.6 6.33
Source: Communications Commission of Kenya Reports (http://www.cck.go.ke/resc/statcs.html)
However, at the time we visited Kenya, there were only two operators in the market, - making it relatively highly concentrated compared with the other countries (see table 5) - including the previously state owned enterprise which had been privatised in 2008, and which continued to dominate the market, with a market share of around 77%. However, since then, two new entrants have entered the market. Tariffs subsequently fell in the market by around 50%, as shown in table 4, though this is also due in part to the decrease in the regulated termination charge implemented by the telecommunications regulator in 2007. Table 5: Market structure and regulatory information about the 5 markets,
Country Number of
operators 2008
Est. Market
share of leading operator
(%)
When mobile service
provision started
Telco regulator
operationally independent?
Telco regulator financially
independent?
USO fund
exists?
USO fund
active?
Kenya 2 77 1992 Yes Yes No, maybe coming
up
No
Zambia 3 80 1995 No Yes Yes No
Ghana 4 50 1993 Yes Yes Yes Yes
Vietnam 6 30 1996 No No Yes No
Bangladesh 6 46 1992 Yes No No No Source: ODI, various sources
Chart 6 shows that in 2007, Kenya‟s prices were relatively high, as compared with the other countries studied, and as compared with Sub-Saharan Africa as a whole. However, mobile tariffs have fallen significantly between 2007 and 2008, as discussed above, such that Kenya is now more in line with the Sub-Saharan African average, though still more expensive than the other case study countries except Zambia.

15
Chart 6: Average per minute mobile tariff (USD)
Source: ITU data, ODI Analysis
Kenya performed moderately well in terms of mobile penetration, as can be seen in chart 7 below. Chart 7: Mobile subscribers per 100 inhabitants
0 10 20 30 40 50 60 70 80 90
Kenya
Zambia
Ghana
Vietnam
Bangladesh
Mobile subscribers per 100 inhabitants
2008
2007
Source: ITU data, ODI Analysis
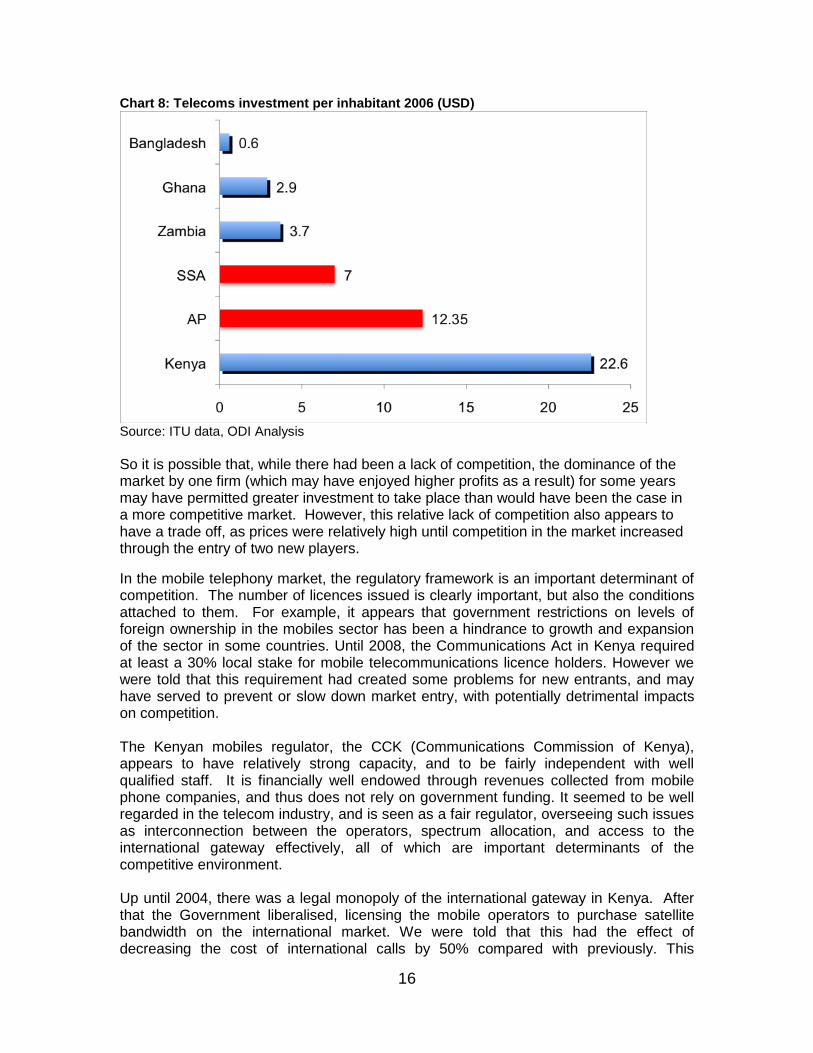
Kenya performed very well in terms of investment per head of population, as shown in chart 8 below.
16
Chart 8: Telecoms investment per inhabitant 2006 (USD)
Source: ITU data, ODI Analysis
So it is possible that, while there had been a lack of competition, the dominance of the market by one firm (which may have enjoyed higher profits as a result) for some years may have permitted greater investment to take place than would have been the case in a more competitive market. However, this relative lack of competition also appears to have a trade off, as prices were relatively high until competition in the market increased through the entry of two new players.
In the mobile telephony market, the regulatory framework is an important determinant of competition. The number of licences issued is clearly important, but also the conditions attached to them. For example, it appears that government restrictions on levels of foreign ownership in the mobiles sector has been a hindrance to growth and expansion of the sector in some countries. Until 2008, the Communications Act in Kenya required at least a 30% local stake for mobile telecommunications licence holders. However we were told that this requirement had created some problems for new entrants, and may have served to prevent or slow down market entry, with potentially detrimental impacts on competition. The Kenyan mobiles regulator, the CCK (Communications Commission of Kenya), appears to have relatively strong capacity, and to be fairly independent with well qualified staff. It is financially well endowed through revenues collected from mobile phone companies, and thus does not rely on government funding. It seemed to be well regarded in the telecom industry, and is seen as a fair regulator, overseeing such issues as interconnection between the operators, spectrum allocation, and access to the international gateway effectively, all of which are important determinants of the competitive environment. Up until 2004, there was a legal monopoly of the international gateway in Kenya. After that the Government liberalised, licensing the mobile operators to purchase satellite bandwidth on the international market. We were told that this had the effect of decreasing the cost of international calls by 50% compared with previously. This
17
compares favourably with the situation in Zambia, in which the international gateway remains a monopoly, and which appears to explain at least in part the relatively high prices of international calls in Zambia. Liberalising the international gateway can remove one of the bottlenecks that can choke African businesses as they seek to compete in a global market, and thus can have significant knock-on benefits across the economy. The regulation of interconnection tariffs also affects the extent to which new entrants can gain market share. In the absence of regulated interconnection tariffs, dominant firms are likely to charge high prices for connecting calls from other networks. Moreover, sometimes dominant operators can refuse or delay interconnection with other operators. This can effectively limit competition, as most people will probably be making regular calls to subscribers on the largest network, so if the costs of doing that are very high, they will subscribe to the dominant provider, rather than any small player or new entrant. In Kenya, termination charges have been regulated only since 2007. The regulated termination charges are around KSh5 per minute. According to CCK, implementation of interconnection rates follows a glide path that requires operators to continuously sign new agreements, and submit them to the regulator. Furthermore, during the study team‟s visit, we were told that CCK was considering a new proposal that would see new entrants to the market given preferentially low rates to enable them to gain a foothold in the sector. The may signal a more proactive stance against dominant players who, new entrants say, are eroding their profit margins and pigeon-holing subscribers on one network. Previous interconnection agreements have apparently led to price falls and also affected inter-network (calls within the same network) calling rates. An aspect of regulation which is gaining importance in developing countries is related to “infrastructure sharing.” This is where different operators share telecommunication infrastructure in order to provide services to different parts of a country. The key advantage of such an approach is that it decreases the duplication of investment, reducing capital and operational expenditure for market players. In so doing, infrastructure sharing may facilitate the expansion of coverage into previously un-served geographic areas and reduce tariffs. Infrastructure sharing is also increasingly being used in congested urban centres where new site acquisition is difficult18. In 2009, the regulator CCK developed a “Code of Practice for the siting of infrastructure19" via a multi-stakeholder process. Thus telecommunication firms are now required to share masts where this is possible.
Another important issue is the potential role of regulation in encouraging wider rollout of mobile services in underserved areas. Large parts of the country remain unserviced by mobile phone providers, and in 2006, the Government mooted the establishment of a Universal Access Communications Development Fund, to be paid for by telecommunications companies. Universal Service Funds or Universal Access Funds (UAFs) typically go towards funding the roll out of telecommunications services in remote and unprofitable areas. There was thus a proposal to increase the fees payable by telecoms licensees from 0.5% of turnover to 1% to fund universal service. However, operators were opposed to such a levy. They argued that the large investments in infrastructure that they had already made to increase coverage negates the need for such regulation. Where there are areas where providing services will remain
18
www.gsmworld.com/documents/gsma.pdf 19
http://allafrica.com/stories/200906300949.html

18
unprofitable, this kind of policy can be used by governments to incentivise operators to roll out to areas that would not otherwise be served. One example of this from our case study countries is the Ghana Investment Fund for Telecommunication development (GIFTEL), which has been running since 2005, and has the aim of improving access to ICT services in non-served and under-served parts of the country. One percent of net earnings of all mobile operators go towards the GIFTEL fund. Funds are used by GIFTEL to construct common telecommunication facilities in underserved areas. GIFTEL pays for full construction of the mast, including site acquisition and fencing. We were told that in the past four years GIFTEL has completed a total of thirty-nine Common Telecom Facilities and enabled telecoms operators to extend their services to about 273 communities. The scheme is becoming increasingly popular with the operators, so this policy appears to be working well in Ghana, which has the best penetration of all the countries we studied. However, universal access funds need to be implemented carefully to avoid distortions, where the State may inadvertently subsidise service roll out in what could be commercially profitable areas. It can be difficult to identify the threshold where service will be unprofitable without additional incentives or subsidy. Research carried out for the World Bank in 24 sub-Saharan African nations, found that only a very small proportion of the population would likely remain unserved by 2015 given expected market investments over the next few years20. Over-regulation, or the imposition of a levy can itself reduce commercial incentives for rollout. So governments must be careful to avoid undermining the market solution, which has delivered significant benefits so far. There is strong evidence from across the world of the various development benefits associated with mobile phone services including significant reductions in the cost of doing business, and improvements in connectivity which make it easier for businesses to link up with suppliers, existing customers, and potential new customers. This improves the investment climate, catalyses private sector development, and stimulates growth. Thus a well-performing and competitive mobiles sector, with low prices and wide coverage, can have significant knock-on benefits for the economy as a whole.
20
World Bank (2007)

19
7. Conclusion In sum, our research suggests that:
The MPC plays a valuable role in monitoring possible anti-competitive practices in the sectors reviewed, identifying and highlighting problems and influencing government decisions. However, its influence and impact could be greatly strengthened through reform;
Regional competition frameworks such as the new COMESA competition law can help to tackle cross-border competition issues than go beyond the jurisdiction of national competition authorities;
Competition has been relatively limited in the cement and beer sectors, as is often the case across the world, so ongoing monitoring by the MPC will be important;
The mobile telephony market in Kenya is relatively well regulated, and is performing relatively well. The introduction of more competition through new entry could help reduce prices going forward.
The sugar market urgently needs reform, but this is likely to be opposed by strong vested interests. The best way to overcome this may be to establish and facilitate coordination amongst other interest groups who stand to gain from reform. Competition authorities and consumer groups may be able to help achieve this, by establishing and coordinating such groups, publicising the issue and providing evidence of the benefits of reform.

20
Bibliography Business Daily Africa (15th August 2007), “ EAPC, Bamburi Seek Merger Approval” http://www.marsgroupkenya.org/multimedia/?print&storydate=2007-08-15&StoryID=189882 Communications Commission of Kenya (2008) “ Communications Statistics Report” http://www.cck.go.ke Ellis & Singh (2010), “Assessing the Economic Impact of Competition”, ODI Research Report, May 2010 Export Processing Zones Authority (2005), “The Kenyan Beer Industry 2005” Evenett & Jenny (2004), “Anticompetitive practices in sub-saharan Africa: Myth, Reality and Perspectives” Presentation given at the CRC 3rd International Conference: Pro-Poor Regulation And Competition: Issues, Policies and Practices” Capetown 7 – 9 September 2004 LMC International Ltd (2005) “The LMC World Wide Survey of Sugar and HFCS Production Costs” Ong‟olo, David (2004) “Distribution Restraints: Experiences in the Beer and Soft drinks Industries in Africa” April 2004. Training Workshop report prepared for WTO Peter Kanyi (3rd September 2009), “ Overview of Competition law and policy in Kenya” Speech given at the Third Annual Competition Conference held at the Competition Commission of South Africa http://www.compcom.co.za/third-annual-competition-conference/ World Bank (2007) „Costing ICT Infrastructure Investment Needs for Africa‟. Study by Winrock International and Pyramid Research, October. United Nations Conference on Trade and Development (2005), “Voluntary peer review on competition policy: Kenya” http://www.allbusiness.com/africa/1130729-1.html http://www.cck.go.ke/market_information-telecommunications/ http://esa.un.org/unpp/index.asp