assessing the accumulation of construction waste generation during residential building construction...
TRANSCRIPT
F
Ad
PAa
Ab
C
a
ARRA
KCEEMCP
1
ispaop32so1r
(
h0
Resources, Conservation and Recycling 93 (2014) 67–74
Contents lists available at ScienceDirect
Resources, Conservation and Recycling
jo ur nal home p age: www.elsev ier .com/ locate / resconrec
ull length article
ssessing the accumulation of construction waste generationuring residential building construction works
aola Villoria Sáeza,∗, Mercedes del Río Merinoa, César Porras-Amoresb,licia San-Antonio Gonzáleza
Departamento de Construcciones Arquitectónicas y su Control, Escuela Técnica Superior de Edificación, Universidad Politécnica de Madrid,vda. Juan de Herrera 6, 28040 Madrid, SpainDepartamento de Construcción y Vías Rurales, Escuela Técnica Superior de Ingenieros Agrónomos, Universidad Politécnica de Madrid,iudad Universitaria s/n, 28040 Madrid, Spain
r t i c l e i n f o
rticle history:eceived 5 May 2014eceived in revised form 10 October 2014ccepted 12 October 2014
eywords:onstruction and demolition wastevolutionstimationanagement
a b s t r a c t
The difficulty of dealing with construction and demolition waste (CDW) on construction sites is not newand continues to be an environmental problem. Understanding the waste generated in a constructionwork is essential to optimize CDW management. Therefore, any tool used for establishing an estimationof the CDW that will be generated should be considered as an alternative to achieve real solutions pursu-ing sustainability. This paper presents the evolution of CDW flow generation in the construction of newresidential buildings, and has identified that the construction activity is increasing the waste generation.In an attempt to find some solutions and provide improved alternatives, several building sites have beenanalysed in order to quantify the estimation of CDW generated. Results show that when using plaster-board walls the CDW generation, per m2 of built surface can be reduced up to 15.94% compared to the use
onstruction activityrevention
of traditional brick partitions. In addition, a model describing the accumulation of CDW throughout theproject duration is proposed. This model states that CDW mainly accumulates in the middle stages of theproject. This study allows an estimation of the amount of CDW to be generated in a building construc-tion site, helping to plan the number and size of containers required at any moment of the constructionprocess, as well as the space required for a proper CDW management.
© 2014 Elsevier B.V. All rights reserved.
. Introduction
Currently, a social awareness of environmental impact is anncreasing concern in our society due to all the phenomena whichhow the rising damage our environment is suffering; i.e. airollution, soil and groundwater contamination, global warmingnd conservation of natural resources. One of the main causesf environmental impact is the uncontrolled waste generation, inarticular from the construction sector since it is responsible for0% of the total waste generated in Europe (European Commision,013). The Symonds Report, published in 1990, was the first reporthowing Europe’s CDW generation and established that about 40%
f the CDW produced in Europe was reused or recycled. From990 to today, data showing Europe’s CDW generation or recyclingates are very limited, especially in terms of their evolution∗ Corresponding author. +34 913367576.E-mail addresses: [email protected], [email protected]
P. Villoria Sáez).
ttp://dx.doi.org/10.1016/j.resconrec.2014.10.004921-3449/© 2014 Elsevier B.V. All rights reserved.
over time (Monier et al., 2011). Currently, according to theEuropean Commission statistics, the total volume of CDW gener-ated in Europe is around 890 million tones (European Commision,2013) and only around 54% of it becomes isactually recycled orrecovered (Böhmer et al., 2009; Fischer et al., 2009). This EU averageis far from achieving the goals set by 2020 in the Waste FrameworkDirective. Therefore, new sustainable construction patterns shouldbe adopted in order to promote a rational use of natural resourcesand a proper management of CDW (Tam, 2008). In particular Spaingenerated 40 million tons of CDW in 2010, representing around28% of the total waste generated in Spain and being responsible forseveral significant environmental impacts (European Commision,2013). In addition, according to the 2nd Spanish National Plan ofCDW for the period 2007–2015, the percentage of CDW recycledis lower than 18% of total waste generated (Spanish Government,2008a). This circumstance is originated by the waste collection
system used in building construction, as it is performed in a decen-tralized manner by each sub-contracted company. This means thatthe principle of reducing waste is not applied in practice, it is notconsidered as an activity in the planning of construction works (del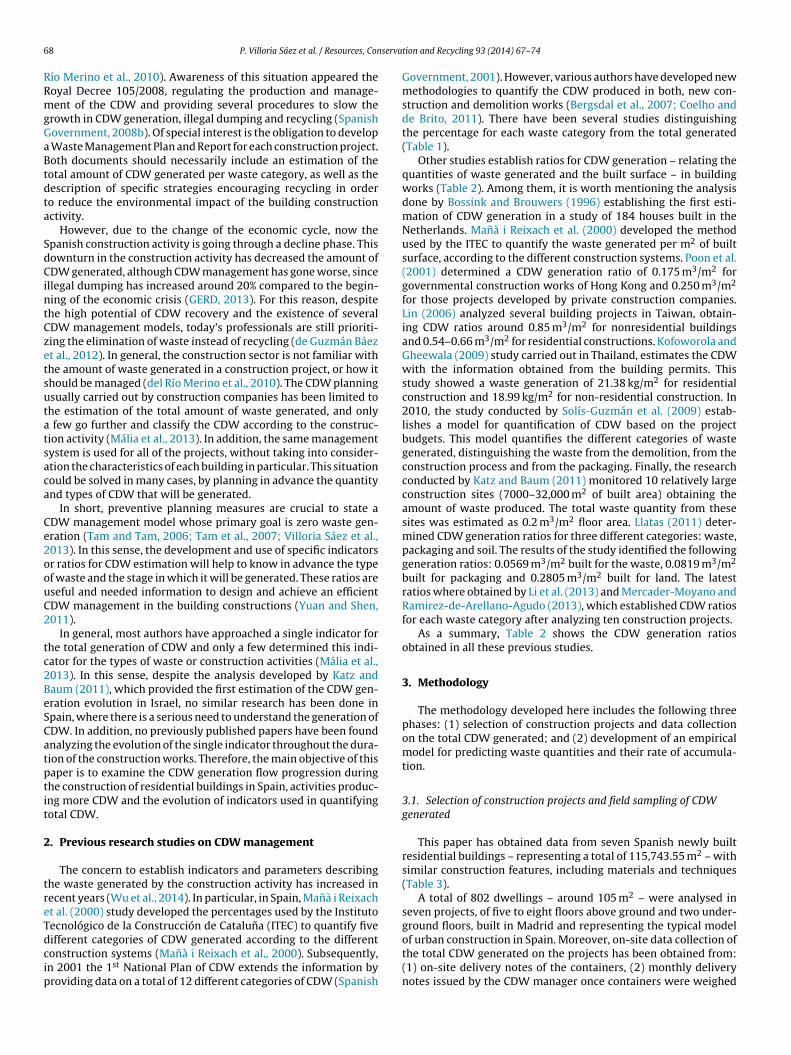
6 serva
RRmgGaBtdta
SdCintCzetsutatsaca
Ce2oouC2
tc2BeSCatptit
2
treTdcip
8 P. Villoria Sáez et al. / Resources, Con
ío Merino et al., 2010). Awareness of this situation appeared theoyal Decree 105/2008, regulating the production and manage-ent of the CDW and providing several procedures to slow the
rowth in CDW generation, illegal dumping and recycling (Spanishovernment, 2008b). Of special interest is the obligation to develop
Waste Management Plan and Report for each construction project.oth documents should necessarily include an estimation of theotal amount of CDW generated per waste category, as well as theescription of specific strategies encouraging recycling in ordero reduce the environmental impact of the building constructionctivity.
However, due to the change of the economic cycle, now thepanish construction activity is going through a decline phase. Thisownturn in the construction activity has decreased the amount ofDW generated, although CDW management has gone worse, since
llegal dumping has increased around 20% compared to the begin-ing of the economic crisis (GERD, 2013). For this reason, despitehe high potential of CDW recovery and the existence of severalDW management models, today’s professionals are still prioriti-ing the elimination of waste instead of recycling (de Guzmán Báezt al., 2012). In general, the construction sector is not familiar withhe amount of waste generated in a construction project, or how ithould be managed (del Río Merino et al., 2010). The CDW planningsually carried out by construction companies has been limited tohe estimation of the total amount of waste generated, and only
few go further and classify the CDW according to the construc-ion activity (Mália et al., 2013). In addition, the same managementystem is used for all of the projects, without taking into consider-tion the characteristics of each building in particular. This situationould be solved in many cases, by planning in advance the quantitynd types of CDW that will be generated.
In short, preventive planning measures are crucial to state aDW management model whose primary goal is zero waste gen-ration (Tam and Tam, 2006; Tam et al., 2007; Villoria Sáez et al.,013). In this sense, the development and use of specific indicatorsr ratios for CDW estimation will help to know in advance the typef waste and the stage in which it will be generated. These ratios areseful and needed information to design and achieve an efficientDW management in the building constructions (Yuan and Shen,011).
In general, most authors have approached a single indicator forhe total generation of CDW and only a few determined this indi-ator for the types of waste or construction activities (Mália et al.,013). In this sense, despite the analysis developed by Katz andaum (2011), which provided the first estimation of the CDW gen-ration evolution in Israel, no similar research has been done inpain, where there is a serious need to understand the generation ofDW. In addition, no previously published papers have been foundnalyzing the evolution of the single indicator throughout the dura-ion of the construction works. Therefore, the main objective of thisaper is to examine the CDW generation flow progression duringhe construction of residential buildings in Spain, activities produc-ng more CDW and the evolution of indicators used in quantifyingotal CDW.
. Previous research studies on CDW management
The concern to establish indicators and parameters describinghe waste generated by the construction activity has increased inecent years (Wu et al., 2014). In particular, in Spain, Manà i Reixacht al. (2000) study developed the percentages used by the Institutoecnológico de la Construcción de Cataluna (ITEC) to quantify five
ifferent categories of CDW generated according to the differentonstruction systems (Manà i Reixach et al., 2000). Subsequently,n 2001 the 1st National Plan of CDW extends the information byroviding data on a total of 12 different categories of CDW (Spanishtion and Recycling 93 (2014) 67–74
Government, 2001). However, various authors have developed newmethodologies to quantify the CDW produced in both, new con-struction and demolition works (Bergsdal et al., 2007; Coelho andde Brito, 2011). There have been several studies distinguishingthe percentage for each waste category from the total generated(Table 1).
Other studies establish ratios for CDW generation – relating thequantities of waste generated and the built surface – in buildingworks (Table 2). Among them, it is worth mentioning the analysisdone by Bossink and Brouwers (1996) establishing the first esti-mation of CDW generation in a study of 184 houses built in theNetherlands. Manà i Reixach et al. (2000) developed the methodused by the ITEC to quantify the waste generated per m2 of builtsurface, according to the different construction systems. Poon et al.(2001) determined a CDW generation ratio of 0.175 m3/m2 forgovernmental construction works of Hong Kong and 0.250 m3/m2
for those projects developed by private construction companies.Lin (2006) analyzed several building projects in Taiwan, obtain-ing CDW ratios around 0.85 m3/m2 for nonresidential buildingsand 0.54–0.66 m3/m2 for residential constructions. Kofoworola andGheewala (2009) study carried out in Thailand, estimates the CDWwith the information obtained from the building permits. Thisstudy showed a waste generation of 21.38 kg/m2 for residentialconstruction and 18.99 kg/m2 for non-residential construction. In2010, the study conducted by Solís-Guzmán et al. (2009) estab-lishes a model for quantification of CDW based on the projectbudgets. This model quantifies the different categories of wastegenerated, distinguishing the waste from the demolition, from theconstruction process and from the packaging. Finally, the researchconducted by Katz and Baum (2011) monitored 10 relatively largeconstruction sites (7000–32,000 m2 of built area) obtaining theamount of waste produced. The total waste quantity from thesesites was estimated as 0.2 m3/m2 floor area. Llatas (2011) deter-mined CDW generation ratios for three different categories: waste,packaging and soil. The results of the study identified the followinggeneration ratios: 0.0569 m3/m2 built for the waste, 0.0819 m3/m2
built for packaging and 0.2805 m3/m2 built for land. The latestratios where obtained by Li et al. (2013) and Mercader-Moyano andRamirez-de-Arellano-Agudo (2013), which established CDW ratiosfor each waste category after analyzing ten construction projects.
As a summary, Table 2 shows the CDW generation ratiosobtained in all these previous studies.
3. Methodology
The methodology developed here includes the following threephases: (1) selection of construction projects and data collectionon the total CDW generated; and (2) development of an empiricalmodel for predicting waste quantities and their rate of accumula-tion.
3.1. Selection of construction projects and field sampling of CDWgenerated
This paper has obtained data from seven Spanish newly builtresidential buildings – representing a total of 115,743.55 m2 – withsimilar construction features, including materials and techniques(Table 3).
A total of 802 dwellings – around 105 m2 – were analysed inseven projects, of five to eight floors above ground and two under-ground floors, built in Madrid and representing the typical model
of urban construction in Spain. Moreover, on-site data collection ofthe total CDW generated on the projects has been obtained from:(1) on-site delivery notes of the containers, (2) monthly deliverynotes issued by the CDW manager once containers were weighed
P. Villoria Sáez et al. / Resources, Conservation and Recycling 93 (2014) 67–74 69
Table 1Percentage of each waste category from the total generated.
CDW category Percentage (%)
Manà i Reixachet al. (2000)
SpanishGovernment(2001)
Costa andUrsella(2003)
Bergsdalet al. (2007)
Mercader-Moyano andRamirez-de-Arellano-Agudo(2013)
Coelho and deBrito (2011)
Llatas(2011)
Soil and rocks not containinghazardous substances
– 9.0 – – 0.2 – 67.0
Mixed concrete and ceramicmat.
85.0 66.0 84.3 67.2 95.6 82.9 33.0
Concrete – 12.0 – – 85.1 –Tiles and ceramic material – 54 – – 10.5 –
Mixed CDW – – – – 0.1 –Wood 11.2 4.0 – 14.6 0.6 –Paper and cardboard packaging – 0.3 – – 0.9 1.2Plastic 0.2 1.5 – – 0.7 0.2Plaster – 0.2 – – 0.8 6.4Glass – 0.5 – – – –Metals 1.8 2.5 0.1 3.6 0.7 4.5Asphalt – 5.0 6.8 – – 4.2Other 1.8 11.0 8.8 14.6 0.4 –
Table 2CDW generation ratios obtained in previous studies for newly built residential constructions.
Author Country Year Ratio Units
Mana i Reixach et al. Spain 2000 0.73–0.97 m3/m2
Poon et al. Hong Kong 2001 0.18–0.25 m3/m2
Lin Taiwan 2006 0.54–0.66 m3/m2
Spanish Government Spain 2008 120.00 kg/m2
Kofoworola and Gheewala Thailand 2009 21.38 kg/m2
Solis-Guzmán et al. Spain 2009 255.49 kg/m2
Katz and Baum Israel 2010 0.20 m3/m2
Llatas Spain 2011 115.29 kg/m2
ic
--
-
-
-
-
TM
Villoria Sáez et al. Spain
Mercader-Moyano and Ramirez-de-Arellano-Agudo Spain
Li et al. China
n the plant and (3) the dates of the following construction certifi-ations:
First certification of the project. (Initial month) Last certification of structure. Including: previous works, earth-works, drainage, foundation and structure.
First and last certification of masonry works. Including: exteriorwalls, thermal insulation, interior partitions, holes, chases, andplastering.
First certification of finishes I: when tiling starts. Includes: tiling,flooring, paving ceiling, external glazing, etc.
First certification of finishes II: when painting starts. Includes:painting, flooring, baseboards, wood doors, decorating, garden-ing, urban furniture, etc.
Last certification of the project. (Last month)
able 3ain characteristics of the selected projects.
Project No. dwelings floor área per dweling (m2) Total floor á
O226 226 67 23,569.00
O192 192 89 17,617.00
O156 156 119 30,759.68
O105 105 115 20,435.24
O59 59 128 11,395.71
O32A 32 111 5983.46
O32B 32 111 5983.46
2012 0.07 m3/m2
2013 0.08 t/m2
2013 40.70 kg/m2
In total, more than 8000 data of daily CDW generation werecollected—both in volume and weight. An example on how the datawas obtained can be seen in Fig. 1.
3.2. Calculation
The relation of CDW quantities with the total built surface ofeach project has been analysed, using Eq. (1), in order to achievethe CDW total indicator.
i1x = QCDW
m2(1)
built
where x is the construction site analysed (x = 1, 2, 3, 4, 5, 6, 7), QCDWis the total quantity of waste generated in the x construction site(kg or m3), m2
built is the total built area of the project (m2), i1x is the
rea (m2) Main characteristics
Reinforced concrete structure. Flat roof. Brick fac ade, thermalinsulation and interior brick partition wall.Reinforced concrete structure. Flat roof. Brick fac ade, thermalinsulation and interior partition of plasterboardReinforced concrete structure. Flat roof. Brick fac ade, thermalinsulation and interior partition of plasterboardReinforced concrete structure. Flat roof. Brick fac ade, thermalinsulation and interior brick partition wallReinforced concrete structure. Flat roof. Brick fac ade, thermalinsulation and interior partition of plasterboardReinforced concrete structure. Flat roof. Brick fac ade, thermalinsulation and large format brick partition wallReinforced concrete structure. Flat roof. Brick fac ade, thermalinsulation and large format brick partition wall
70 P. Villoria Sáez et al. / Resources, Conservation and Recycling 93 (2014) 67–74
le of d
rb
oape
3a
ttBwntoatqp
D
wwDp
Fig. 1. Examp
atio relating total amount of waste generated per 1 m2 of the totaluilt surface for each construction project (normalized value).
The final ratio (i1m) has been calculated with the mean valuef the i1x values obtained from the seven projects analysed. Also,
comparison between the ratios obtained with brick interiorartition wall projects and those built with plasterboard, is alsoxplored.
.3. Estimation of CDW quantities evolution and its rate ofccumulation
In addition, a model describing the accumulation of CDW vs.he project duration using normalized parameters was studied. Forhis, the methodology developed in the research work of Katz andaum (2011) was followed. As the project duration of the studiedorks varies from site to site, transforming the data obtained toormalized values enables data analysis to be on a common basis. Inhis sense, the normalized project duration, describes the durationf the entire construction work from start (0.00) to finish (1.00);nd the normalized quantity of waste, describes the instantaneousotal waste (kg or m3) per 1 m2 built surface, as if the total wasteuantity was generated at that very moment. The normalizedroject duration (%) is calculated using the following equation:
ˆ =
(dj
Dt
)× 100 (2)
here dj is the day number, since the beginning of the constructionorks, when the CDW container (j) leaves the site (dj = 1, 2, 3, . . .),
t is the total duration of the project, in days, D is the normalizedroject duration (%).
ata collection.
The normalized CDW quantity is calculated using the followingequation:
Ratio 1i = QCDWi/m2
built
D(3)
where QCDWiis the daily amount of waste measured in the ith day
(kg or m3), m2built is the total built area of the project (m2)
The trend of the CDW generation throughout the constructionwork has been studied for all the construction projects analysed.Further, linear regressions – using SPSS software – were used toobtain the relation between accumulation of CDW and the projectduration. Moreover, values of coefficient of determination (R2) areshown in order to find the model fitting degrees with the data.
4. Results
The CDW quantification obtained from the delivery notes ofseven projects analysed allows for a first approach to obtain a ratiorelating the weight of the waste generated and built area.
4.1. Quantification of the total waste generated
The total quantities, both in weight and volume, of CDW gener-ated in each construction project and the i1 ratio obtained using Eq.(1), are shown in Table 4. From the results of the seven construc-tion projects, an average indicator (i1m) is obtained, allowing foran estimation of the total waste generated once the built surfaceof the project is known—in building constructions with the samecharacteristics as the ones studied.
Results show that construction projects having plasterboardpartition walls have smaller generation ratios. In particular, i1 ratiofor building projects with interior brick partition walls is calcu-lated to be around 131.01 kgCDW /m2
builtand 0.192 m3
CDW /m2built
,

P. Villoria Sáez et al. / Resources, Conservation and Recycling 93 (2014) 67–74 71
Table 4Relationship between total CDW generated in the construction work and the built surface (Ratio i1).
Project Interior partition wall Total built area (m2) kg CDW m3 CDW i1 weight (kgCDW/m2built
) i1 volume (m3CDW
/m2built
)
O226 Brick 23,569.00 2969,425.00 5034 125.99 2.14E − 01O192 Plasterboard 26,692.00 3132,780.00 5646 117.37 2.12E − 01O156 Plasterboard 30,760.00 2934,829.00 5200 95.41 1.69E − 01O105 Brick 20,435.00 2370,680.00 3437 116.01 1.68E − 01O59 Plasterboard 11,045.30 1438,400.00 2025 126.22 1.78E − 01
92.00
20.00
w1wtb
4
gtgtt
lsf
4
bsc
O32A Brick 5983.00 978,3O32B Brick 5983.00 709,2
hile for plasterboard interior partition projects it is set around13.00 kgCDW/m2
built and 0.186 m3CDW /m2
built. This means building
orks generate 15.94–3.04% less, in weight and volume, respec-ively, when using plasterboards than when using traditionalricks.
.2. Evolution of construction and demolition waste flow
It is important to know, not only the total amount of waste to beenerated, but also its evolution during the construction process. Inhis sense, data obtained in Fig. 2 determine the percentage of wasteenerated in each construction activity. Thus, it can be observedhat masonry and finishings execution generate more than 30% ofhe total CDW generated.
Also, it can be assumed that on large projects the period of over-apping activities is longer, therefore in large scale projects, mixedtages such as “masonry works and finishings II”, can be easilyound.
.3. Construction and demolition waste accumulation
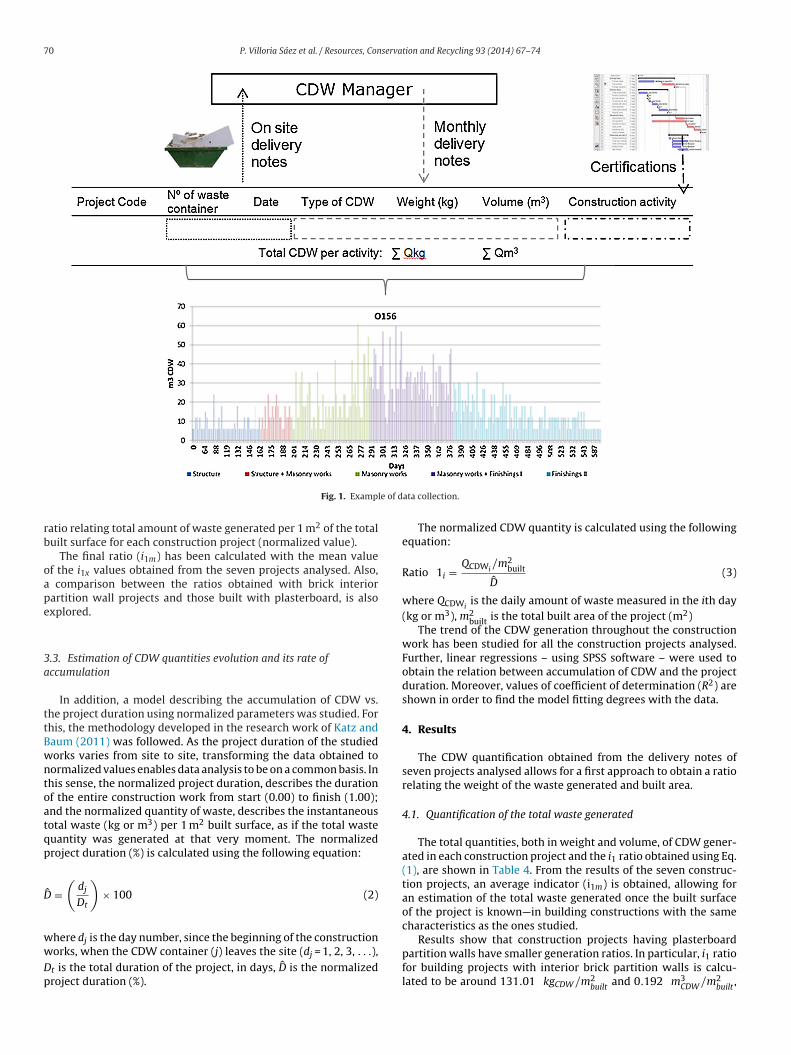
It is observed that CDW volume flow accumulation since theeginning of the work, follows a polynomial expression in all theeven projects analysed (Fig. 3). From the results shown in Fig. 3 itan be seen that relatively small amounts of waste are accumulated
Fig. 2. Percentage of CDW generated in each con
1290 163.52 2.16E − 011020 118.53 1.70E − 01i1m 123.29 1.90E − 01
in the early stages of the construction. In particular, during thefirst 25% of the project duration, between 10 and 20% of the totalCDW is generated. It can be assumed that waste accumulatedduring the early work stages is related to the preliminary andstructural frame works, whereas waste accumulated during thefinal stages of the construction is related to the late finishing worksonly.
In turn, towards the last days of the construction works (>75%of the project duration) six of the seven works studied alreadygenerated more than 85% of their total waste, except for projectO32A, whose CDW accumulation remained around 70%. Further-more, when reaching 85% of the total project duration more than95% of the total waste was already generated in all the projectsstudied. In addition, the percentage of CDW accumulated duringthe middle stage of the construction work (25–75% of the totalduration) varies significantly from site to site (Fig. 3).
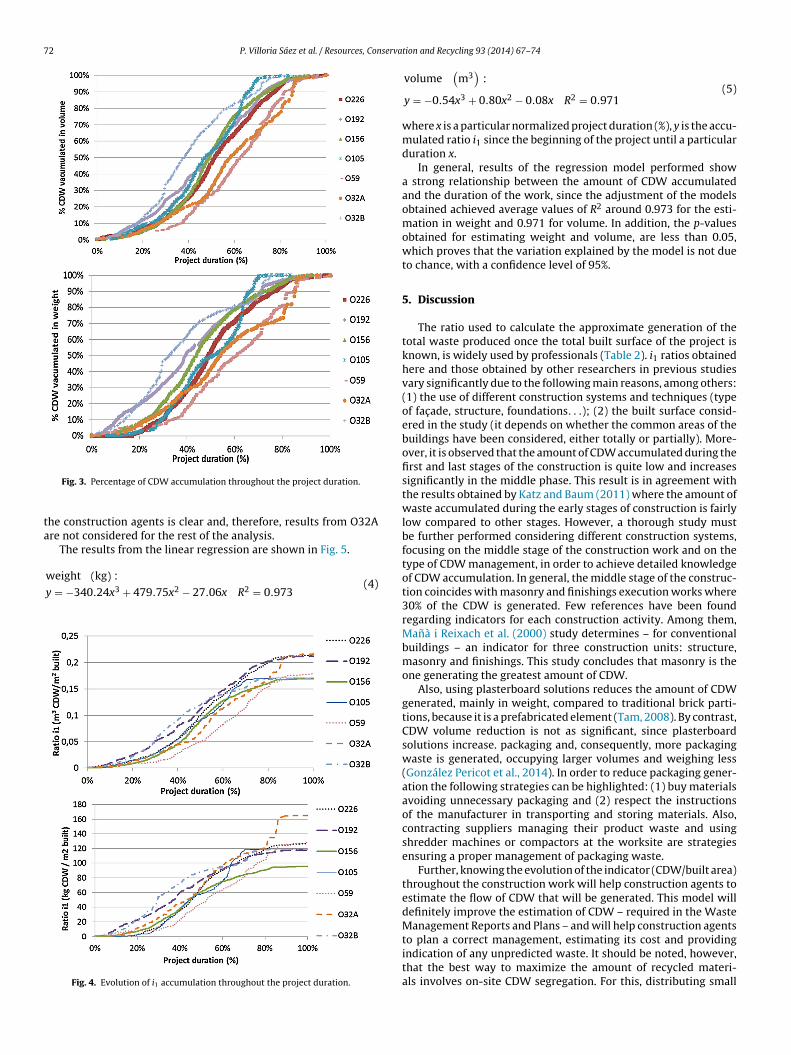
In general, as shown on Fig. 4, the waste ratio per built areaaccumulates more or less constantly for all the projects analyzedexcept for O32A. It can be noted on O32A project that when reaching80% of the total duration the ratio increases significantly until theend. Moreover, O32A and O32B works are the same project built
by different agents, thus the observed increase in O32A may bedue to the CDW management carried out on site, i.e. waste wasaccumulated on-site and was removed in a short space of time. Inthis sense, the importance of the CDW management carried out bystruction activity from the total generated.
72 P. Villoria Sáez et al. / Resources, Conserva
ta
Fig. 3. Percentage of CDW accumulation throughout the project duration.
he construction agents is clear and, therefore, results from O32Are not considered for the rest of the analysis.
The results from the linear regression are shown in Fig. 5.
weight (kg) :
y = −340.24x3 + 479.75x2 − 27.06x R2 = 0.973(4)
Fig. 4. Evolution of i1 accumulation throughout the project duration.
tion and Recycling 93 (2014) 67–74
volume(
m3)
:
y = −0.54x3 + 0.80x2 − 0.08x R2 = 0.971(5)
where x is a particular normalized project duration (%), y is the accu-mulated ratio i1 since the beginning of the project until a particularduration x.
In general, results of the regression model performed showa strong relationship between the amount of CDW accumulatedand the duration of the work, since the adjustment of the modelsobtained achieved average values of R2 around 0.973 for the esti-mation in weight and 0.971 for volume. In addition, the p-valuesobtained for estimating weight and volume, are less than 0.05,which proves that the variation explained by the model is not dueto chance, with a confidence level of 95%.
5. Discussion
The ratio used to calculate the approximate generation of thetotal waste produced once the total built surface of the project isknown, is widely used by professionals (Table 2). i1 ratios obtainedhere and those obtained by other researchers in previous studiesvary significantly due to the following main reasons, among others:(1) the use of different construction systems and techniques (typeof fac ade, structure, foundations. . .); (2) the built surface consid-ered in the study (it depends on whether the common areas of thebuildings have been considered, either totally or partially). More-over, it is observed that the amount of CDW accumulated during thefirst and last stages of the construction is quite low and increasessignificantly in the middle phase. This result is in agreement withthe results obtained by Katz and Baum (2011) where the amount ofwaste accumulated during the early stages of construction is fairlylow compared to other stages. However, a thorough study mustbe further performed considering different construction systems,focusing on the middle stage of the construction work and on thetype of CDW management, in order to achieve detailed knowledgeof CDW accumulation. In general, the middle stage of the construc-tion coincides with masonry and finishings execution works where30% of the CDW is generated. Few references have been foundregarding indicators for each construction activity. Among them,Manà i Reixach et al. (2000) study determines – for conventionalbuildings – an indicator for three construction units: structure,masonry and finishings. This study concludes that masonry is theone generating the greatest amount of CDW.
Also, using plasterboard solutions reduces the amount of CDWgenerated, mainly in weight, compared to traditional brick parti-tions, because it is a prefabricated element (Tam, 2008). By contrast,CDW volume reduction is not as significant, since plasterboardsolutions increase. packaging and, consequently, more packagingwaste is generated, occupying larger volumes and weighing less(González Pericot et al., 2014). In order to reduce packaging gener-ation the following strategies can be highlighted: (1) buy materialsavoiding unnecessary packaging and (2) respect the instructionsof the manufacturer in transporting and storing materials. Also,contracting suppliers managing their product waste and usingshredder machines or compactors at the worksite are strategiesensuring a proper management of packaging waste.
Further, knowing the evolution of the indicator (CDW/built area)throughout the construction work will help construction agents toestimate the flow of CDW that will be generated. This model willdefinitely improve the estimation of CDW – required in the WasteManagement Reports and Plans – and will help construction agents
to plan a correct management, estimating its cost and providingindication of any unpredicted waste. It should be noted, however,that the best way to maximize the amount of recycled materi-als involves on-site CDW segregation. For this, distributing small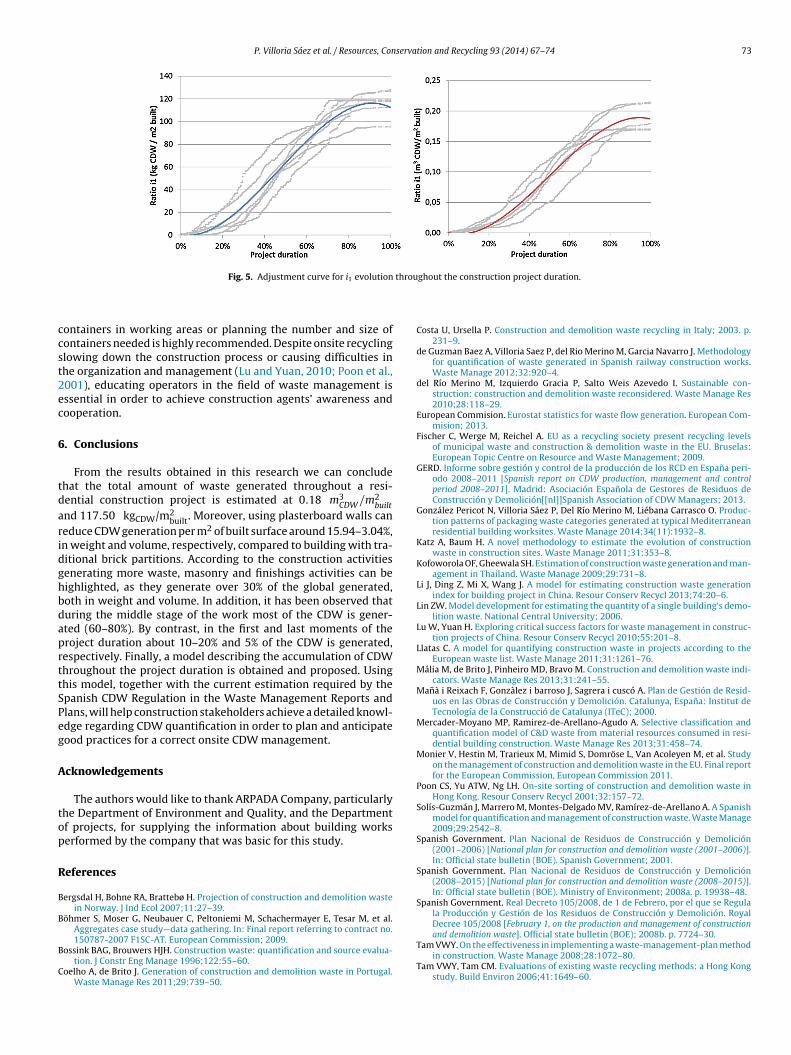
P. Villoria Sáez et al. / Resources, Conservation and Recycling 93 (2014) 67–74 73
throu
ccst2ec
6
tdaridghbdaprttSPeg
A
top
R
B
B
B
C
Fig. 5. Adjustment curve for i1 evolution
ontainers in working areas or planning the number and size ofontainers needed is highly recommended. Despite onsite recyclinglowing down the construction process or causing difficulties inhe organization and management (Lu and Yuan, 2010; Poon et al.,001), educating operators in the field of waste management isssential in order to achieve construction agents’ awareness andooperation.
. Conclusions
From the results obtained in this research we can concludehat the total amount of waste generated throughout a resi-ential construction project is estimated at 0.18 m3
CDW /m2built
nd 117.50 kgCDW/m2built. Moreover, using plasterboard walls can
educe CDW generation per m2 of built surface around 15.94–3.04%,n weight and volume, respectively, compared to building with tra-itional brick partitions. According to the construction activitiesenerating more waste, masonry and finishings activities can beighlighted, as they generate over 30% of the global generated,oth in weight and volume. In addition, it has been observed thaturing the middle stage of the work most of the CDW is gener-ted (60–80%). By contrast, in the first and last moments of theroject duration about 10–20% and 5% of the CDW is generated,espectively. Finally, a model describing the accumulation of CDWhroughout the project duration is obtained and proposed. Usinghis model, together with the current estimation required by thepanish CDW Regulation in the Waste Management Reports andlans, will help construction stakeholders achieve a detailed knowl-dge regarding CDW quantification in order to plan and anticipateood practices for a correct onsite CDW management.
cknowledgements
The authors would like to thank ARPADA Company, particularlyhe Department of Environment and Quality, and the Departmentf projects, for supplying the information about building workserformed by the company that was basic for this study.
eferences
ergsdal H, Bohne RA, Brattebø H. Projection of construction and demolition wastein Norway. J Ind Ecol 2007;11:27–39.
öhmer S, Moser G, Neubauer C, Peltoniemi M, Schachermayer E, Tesar M, et al.Aggregates case study—data gathering. In: Final report referring to contract no.
150787-2007 F1SC-AT. European Commission; 2009.ossink BAG, Brouwers HJH. Construction waste: quantification and source evalua-tion. J Constr Eng Manage 1996;122:55–60.
oelho A, de Brito J. Generation of construction and demolition waste in Portugal.Waste Manage Res 2011;29:739–50.
ghout the construction project duration.
Costa U, Ursella P. Construction and demolition waste recycling in Italy; 2003. p.231–9.
de Guzman Baez A, Villoria Saez P, del Rio Merino M, Garcia Navarro J. Methodologyfor quantification of waste generated in Spanish railway construction works.Waste Manage 2012;32:920–4.
del Río Merino M, Izquierdo Gracia P, Salto Weis Azevedo I. Sustainable con-struction: construction and demolition waste reconsidered. Waste Manage Res2010;28:118–29.
European Commision. Eurostat statistics for waste flow generation. European Com-mision; 2013.
Fischer C, Werge M, Reichel A. EU as a recycling society present recycling levelsof municipal waste and construction & demolition waste in the EU. Bruselas:European Topic Centre on Resource and Waste Management; 2009.
GERD. Informe sobre gestión y control de la producción de los RCD en Espana peri-odo 2008–2011 [Spanish report on CDW production, management and controlperiod 2008–2011]. Madrid: Asociación Espanola de Gestores de Residuos deConstrucción y Demolición[[nl]]Spanish Association of CDW Managers; 2013.
González Pericot N, Villoria Sáez P, Del Río Merino M, Liébana Carrasco O. Produc-tion patterns of packaging waste categories generated at typical Mediterraneanresidential building worksites. Waste Manage 2014;34(11):1932–8.
Katz A, Baum H. A novel methodology to estimate the evolution of constructionwaste in construction sites. Waste Manage 2011;31:353–8.
Kofoworola OF, Gheewala SH. Estimation of construction waste generation and man-agement in Thailand. Waste Manage 2009;29:731–8.
Li J, Ding Z, Mi X, Wang J. A model for estimating construction waste generationindex for building project in China. Resour Conserv Recycl 2013;74:20–6.
Lin ZW. Model development for estimating the quantity of a single building’s demo-lition waste. National Central University; 2006.
Lu W, Yuan H. Exploring critical success factors for waste management in construc-tion projects of China. Resour Conserv Recycl 2010;55:201–8.
Llatas C. A model for quantifying construction waste in projects according to theEuropean waste list. Waste Manage 2011;31:1261–76.
Mália M, de Brito J, Pinheiro MD, Bravo M. Construction and demolition waste indi-cators. Waste Manage Res 2013;31:241–55.
Manà i Reixach F, Gonzàlez i barroso J, Sagrera i cuscó A. Plan de Gestión de Resid-uos en las Obras de Construcción y Demolición. Catalunya, Espana: Institut deTecnología de la Construcció de Catalunya (ITeC); 2000.
Mercader-Moyano MP, Ramirez-de-Arellano-Agudo A. Selective classification andquantification model of C&D waste from material resources consumed in resi-dential building construction. Waste Manage Res 2013;31:458–74.
Monier V, Hestin M, Trarieux M, Mimid S, Domröse L, Van Acoleyen M, et al. Studyon the management of construction and demolition waste in the EU. Final reportfor the European Commission, European Commission 2011.
Poon CS, Yu ATW, Ng LH. On-site sorting of construction and demolition waste inHong Kong. Resour Conserv Recycl 2001;32:157–72.
Solís-Guzmán J, Marrero M, Montes-Delgado MV, Ramírez-de-Arellano A. A Spanishmodel for quantification and management of construction waste. Waste Manage2009;29:2542–8.
Spanish Government. Plan Nacional de Residuos de Construcción y Demolición(2001–2006) [National plan for construction and demolition waste (2001–2006)].In: Official state bulletin (BOE). Spanish Government; 2001.
Spanish Government. Plan Nacional de Residuos de Construcción y Demolición(2008–2015) [National plan for construction and demolition waste (2008–2015)].In: Official state bulletin (BOE). Ministry of Environment; 2008a. p. 19938–48.
Spanish Government. Real Decreto 105/2008, de 1 de Febrero, por el que se Regulala Producción y Gestión de los Residuos de Construcción y Demolición. RoyalDecree 105/2008 [February 1, on the production and management of construction
and demolition waste]. Official state bulletin (BOE); 2008b. p. 7724–30.Tam VWY. On the effectiveness in implementing a waste-management-plan methodin construction. Waste Manage 2008;28:1072–80.
Tam VWY, Tam CM. Evaluations of existing waste recycling methods: a Hong Kongstudy. Build Environ 2006;41:1649–60.

7 serva
T
V
4 P. Villoria Sáez et al. / Resources, Con
am VWY, Tam CM, Zeng SX, Ng WC. Towards adoption of prefabrication in con-struction. Build Environ 2007;42:3642–54.
illoria Sáez P, del Río Merino M, San-Antonio González A, Porras-Amores C. Bestpractice measures assessment for construction and demolition waste manage-ment in building constructions. Resour Conserv Recycl 2013;75:52–62.
tion and Recycling 93 (2014) 67–74
Wu Z, Yu AT, Shen L, Liu G. Quantifying construction and demolition waste: ananalytical review. Waste Manage 2014;34:1683–92.
Yuan H, Shen L. Trend of the research on construction and demolition waste man-agement. Waste Manage 2011;31:670–9.