assessing the ability of pedestrians to safely hear ... · 6 sound & vibration/october 2017...
TRANSCRIPT
www.SandV.com6 SOUND & VIBRATION/OCTOBER 2017
Assessing the Ability of Pedestrians toSafely Hear Approaching Electric Vehicles
Hybrid and electric vehicles (HVs and EVs) have demonstrated low noise levels relative to their internal combustion engine (ICE) counterparts, particularly at low speeds. As the number of HVs/EVs on the road increases, so does the need for data quantifying auditory detectability by pedestrians, in particular, those who are vision impaired. Manufacturers have started implementing additive noise solutions designed to increase vehicle detectability while in electric mode or when traveling below a certain speed. A detailed description of the real-time acoustic measurement system, the corresponding vehicular data, developing an immersive noise field, and experimental methods pertaining to a recent evalua-tion of candidate vehicles is provided here. Listener testing was completed by 24 legally blind test subjects for four vehicle types: an EV and HV with different additive noise approaches, an EV with no additive noise, and a traditional ICE vehicle. The primary results examined the distances at which subjects detected each oncoming vehicle and the corresponding acoustical measurements upon detection. Vehicle approach scenarios included two levels of steady-state speed: 10 kph and 20 kph. Participants were seated on a closed-test track and asked to identify auditory detection of each oncoming vehicle within the presence of continuous, spatially distributed, spectrally shaped noise at 55 dBA and 60 dBA. The spectrum of the noise matched that of typical average urban background noise. The acoustic data were collected using measurement-grade microphones positioned directly above each participant’s head. Findings suggest that although mean detec-tion distances trend higher for vehicles with an additive noise component, they aren’t significantly different from the traditional EV at speeds of 10 kph. Moreover, all EV/HVs were detected at significantly shorter distances relative to the ICE vehicle when traveling at 10 kph. At 20 kph these differences become nearly indistinguishable.
As the adoption of hybrid and electric vehicles (HVs and EVs) increases, concerns have emerged regarding their relative quietness with respect to pedestrian detectability. Although all pedestrians face a possible increase in risk due to the lower operating noise associated with HVs and EVs, the visually impaired community faces an even greater potential for risk due to their reliance on hearing as an assessment for when it is safe to cross.
To address these concerns, vehicle manufacturers have begun implementing additive noise solutions designed to enhance vehicle detectability while in electric mode or when traveling below a certain speed.
Standards and RegulationsThe United Nations Economic Commission of Europe (UNECE)
has developed a method for assessing these various additive vehicle noise solutions.1 EVs and HVs tend to be quieter than internal combustion engine (ICE) vehicles, particularly when operating at low speeds when road and wind noise is lessened. As such, these vehicle types pose a greater potential risk to pedestrians, particularly those who are visually impaired, when operating at low speeds.
To assist in detecting EVs and HVs, the 2010 Pedestrian Safety Enhancement Act (PSEA) required that the National Highway Traf-fic Safety Administration (NHTSA) issue a performance standard to ensure that these quiet vehicles emit a sound that meets certain minimum requirements so that they are recognizable as a motor
vehicle in operation.2 A notice of proposed rulemaking (NPRM) was subsequently issued, announcing a proposal to establish Federal Motor Vehicle Safety Standard (FMVSS) No.141, which would require “hybrid and electric passenger cars, light trucks and vans (LTVs), medium and heavy duty, trucks, and buses, low-speed vehicles (LSVs), and motorcycles to produce sounds meeting the requirements of this standard.”3
The aforementioned NPRM highlights the three phases of re-search conducted by NHTSA from 2009 to the present. Phase 1 activities included identifying and investigating scenarios where visually impaired or blind pedestrians may be at risk; documenting EV, HV, and ICE acoustic measurements, as well as ambient noise levels within pedestrian roadway crossing environments where sound may be the only indicator of a vehicle’s presence; examin-ing auditory detectability of EVs, HVs, and ICEs in scenarios of concern; and examining potential countermeasures.
Phase 2 built on the results of Phase 1 by developing potential specifications for additive vehicle noise using the psychoacoustic modeling and human testing from Phase 1. Phase 2 research found that synthetic sounds for EVs and HVs that resembled ICE sounds produced similar detection distances, and the results suggested, “Synthetic sounds that contained only the fundamental combustion noise are relatively ineffective.” Of note, this research found that visual impairment, or lack thereof, did not have a significant impact on the ability of participants to detect vehicle approach sounds.
Phase 3 used data from Phases 1 and 2 to develop “an objec-tive, repeatable test procedure and objective specifications” for EV and HV minimum sound requirements for additive sounds to be “detectable and recognizable as a motor vehicle.” The recom-mendations from this proposal to increase recognition include thresholds for amplitude modulation and total tonal power, mul-tiple harmonics equal to ICE frequency, high-amplitude first or second harmonics coupled with as low as possible frequency in the lowest harmonic, and increase of amplitude as a function of speed.
As of this writing, a new proposed regulation, Federal Motor Vehicle Safety Standard No. 141 by NHTSA8 has been announced to provide guidelines or minimum EV noise emission. NHTSA characterizes these “simple” noises as two or four tones between 315 and 5000 hertz, separated in one-third-octave intervals. Addi-tionally, the volume must go up by three decibels for every 6-mph increase in speed. Electric cars must make the sounds between 47 and 67 decibels.
Related WorkSome related studies considered the presence of ambient noise
and sought to perform experiments within a controlled environ-ment under specified ambient noise conditions. In Reference 4, we conducted a study on a closed-test-track facility that included controlled, low, ambient sound. Vehicles were driven across a pedestrian crossing path at a target velocity of 15 kph (note the dataset included velocity errors up to > 5 kph and acceleration < 1.5 kph/sec).
The study found that the peak sound pressure level (SPL) at the location of the participants was directly related to the velocity of the vehicles driving by. In addition, the SPL at the participants’ location was in direct relation to the distance between the ap-proaching vehicles and the participants’ location.
Finally, we found that at the time of detection, “approaching vehicles had the most acoustic energy above ambient levels in the 1,000 and 2,000 Hz 1/1-octave bands.”4 Ambient noise level patterns in4 were evaluated in addition to examining the timing and performance of visually impaired pedestrians’ critical street-
Michael J. Roan and Luke Neurauter, Virginia Tech, Blacksburg, VirginiaDouglas Moore and Dan Glaser, General Motors, Pontiac, Michigan
Based on a paper presented at the SAE Noise and Vibration Conference, Grand Rapids, MI, July 2017.
www.SandV.com SOUND & VIBRATION/OCTOBER 2017 7
crossing decisions.6 A variety of residential, major or minor, and signalized intersections were selected for this study. Mean overall sound levels, with noticeable fluctuations, were measured and used for analysis.
We determined that ambient noise plays a significant role in detecting quiet vehicles, indicating that fewer risky decisions were made to cross the street when the ambient noise level was lower. However, note that the determination of participants’ greater or lesser risky behavior was based on the assumption that the one sighted experimenter made reasonably accurate decisions in all trials. At residential and major-minor unsignalized street intersec-tions, participants made the majority of their crossing decisions during “all quiet” periods, or periods when the ambient sound level was below the 25th percentile and gaps in traffic occurred.
Furthermore, “the percentage of risky crossing decisions was significantly lower when the decisions were made at ambient sound levels below the 25th percentile.” Note that visually im-paired pedestrians often attempted to compare ambient sound just prior to the “surge” of near parallel traffic to determine whether an intersection was safe to cross; therefore, “the ambient sound level at a signalized intersection may not be the most appropriate measure of background sound level for determining how loud a target vehicle should be at these intersections.”
To fully understand the impact of ambient sound levels in a variety of roadway environments, we suggest that a comprehensive set of orientation and mobility tasks be tested “at a larger number of intersections with different environmental characteristics.” The study in Reference 4 was done in a controlled, low-ambient noise environment and suggested that further testing be conducted under higher ambient noise levels. Testing in Reference 5 was conducted under real-world conditions in an uncontrolled higher ambient noise level environment.
The authors in Reference 6 also conducted testing in various environments under real-world conditions, resulting in fluctuat-ing ambient noise levels. The last two studies discussed provided insight into typical higher ambient sound level environments; however, both had to take into account fluctuations in sound levels. In addition, these studies might not have reflected the traffic and surrounding noise that can be found in deep urban environments; rather, the figures provided indicate that they could have taken place in a more suburban setting, with relatively low traffic density and little noise from surrounding activities. As such, further testing in a controlled environment in which higher ambient noise level conditions would remain steady across the study, and in particular, across each test scenario, is still warranted.
In regard to additive noise solutions to aid detection, the study in Reference 5 tested five artificial sounds emanating from the vehicle’s front bumper against an ICE vehicle and a set of Chevro-let Volts operating in “quiet mode” in a real world, uncontrolled intersection. Results from this study indicate that it is not the characteristics of artificially added sound but the interaction of the artificially added sounds with the ambient background noise that impact blind pedestrians’ performance of orientation and mobility tasks. The study determined that ambient sound energy between 500 - 1,000 Hz hinders detection of vehicle noise.5
The project discussed here was conducted with the goal of evaluating the UNECE’s proposed method, as well as assessing listener responses to four vehicles:• Two different EVs with additive noise solutions.• One EV with no additive noise solution• A traditional internal combustion engine
These listener tests were conducted in a controlled environment in the presence of artificially generated background noise at 55 and 60 dBA with a spectrum that was shaped to match average urban background noise.2 Twenty-four legally blind subjects were instructed to push a button when they detected the approach of oncoming vehicles.
The final study design accommodated three within-subject fac-tors including vehicle-type (4 levels), approach speed (3 levels), and background noise level (2 levels). This 4 × 3 × 2 design pro-vided 24 unique configurations, each repeated across three separate trials, for a total presentation of 72 scenarios per data collection
session. The focus of this article is on the acoustical measurements of the vehicles and the acoustic aspects of the listener testing. Results from the study concerning the analysis of the mean detec-tion distances is detailed in Reference 7. The article is organized as follows: First, the overall experimental method is discussed, which includes properties of the test site chosen, acoustic data acquisition hardware and software, and acoustical measurements of vehicle drive-byes as per UNECE. An analysis of the average detec-tion distances and corresponding average overall sound pressure levels, and corresponding one-third octave band results follows.
Experimental MethodTest Site Selection. Since the primary focus of this evaluation
was based on vehicle detection within a noise-controlled environ-ment, selecting an appropriate site location to support both the benchmark vehicle noise testing and subsequent listener evalua-tions was critical. Under ideal circumstances, this location would provide the following:• A safe (controlled) environment conducive to testing with pe-
destrians seated on or near the roadway.• Low ambient noise levels.• A level roadway.• A road surface representative of typical roadways.• A site length appropriate for dynamic maneuvers.
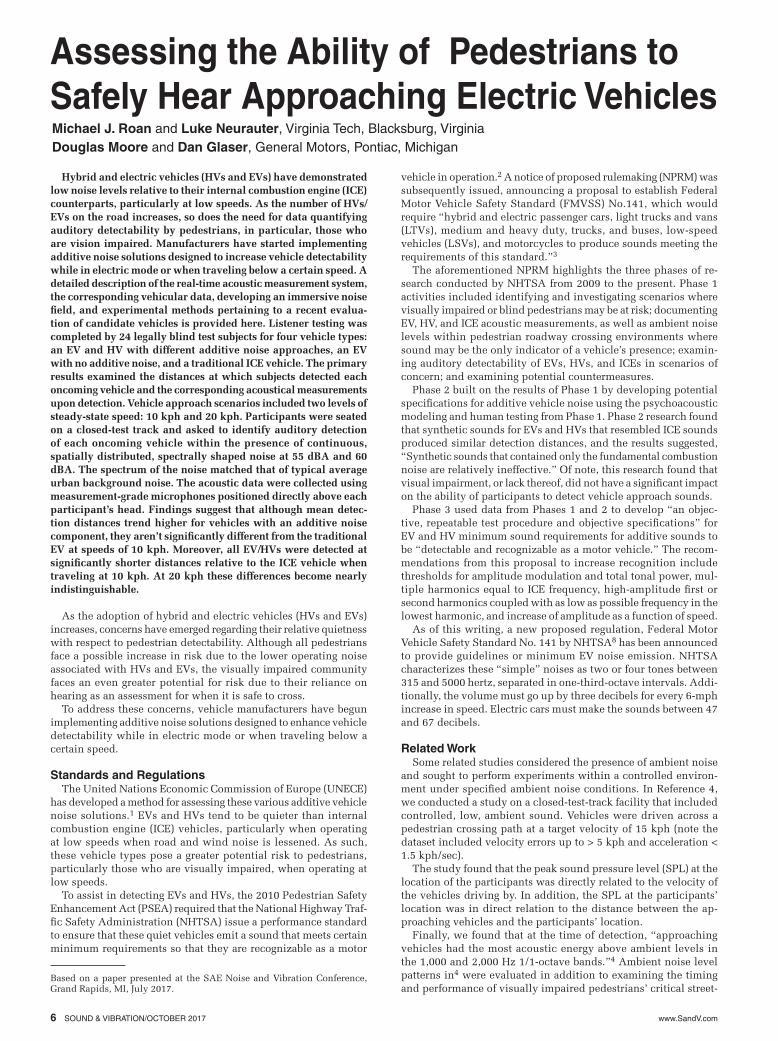
The research team identified and conducted benchmark ve-hicle noise testing at multiple sites before selecting the section of roadway near the lower turnaround of the Virginia Smart Road, a closed test bed adjacent to the Virginia Tech Transportation In-stitute (VTTI) in Blacksburg, Virginia (see shaded area in Figure 1). This location came closest to meeting the ideal requirements identified above.
Figure 1. Virginia smart-road test site.
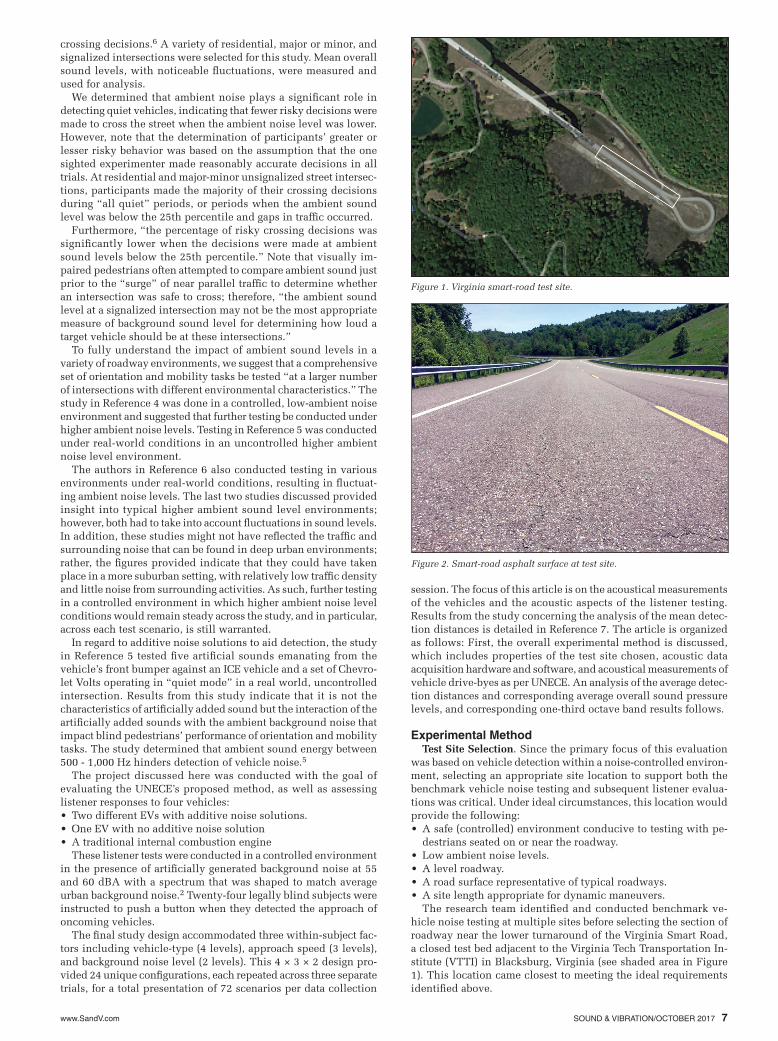
Figure 2. Smart-road asphalt surface at test site.
www.SandV.com8 SOUND & VIBRATION/OCTOBER 2017
Since smart road access is controlled, testing could be con-ducted with the guarantee that no other vehicles would enter the defined testing area. The noise levels at the selected site were the lowest of any measured site and were not directly impacted by any surrounding primary roadways. The roadway was relatively level (an approximate 1% grade) with sufficient distance to sup-port the maneuvers performed during listener testing. Finally, the condition of the roadway surface was representative of a typical asphalt-paved roadway throughout Virginia (Figure 2) but was not representative of new pavement.
Data Acquisition and Analysis System Acoustical Measurements. Three types of acoustical measure-
ments were recorded during the course of this project: acoustic pressure, overall A-weighted SPL and 1/3-octave-band SPLs (also A-weighted). The major components of the noise measurement data acquisition system (DAS) were as follows: • Four G.R.A.S. 46AQ half-inch TEDS Microphones • One National Instruments cDAQ USB data acquisition rack • One National Instruments NI 9234 analog-to-digital converter
module • A Dell Inspiron Desktop PC (8GB RAM 1 TB HD) running Matlab • National Instruments Labview • The National Instruments Labview Acoustics and Vibrations
Measurement Suite This hardware and software combination provides a Class 1
system that meets or exceeds the following standards: IEC 61260: 1995, Class 1, IEC 61672: 2002, Class 1, JIS C 1509-1: 2005, JIS C 1514: 2002, ANSI S1: 11 - 2004, Class 1, ANSI S1.4: 1983, ANSI S1.42: 1986, ISO 8041: 2005(E), ISO 532: 1975, DIN 45631: 1991, DIN 45631/A: 2008.
Data provided by the microphones were sampled at 50 kHz and saved so that all raw pressure measurements were logged for all tests. Simultaneously recorded with the raw pressure measure-ments, data were passed through an A-weighting filter before being split and passed to a sound level meter to calculate overall SPL (0.125 sec exponential averaging, or fast setting) and 1/3-octave-band sound pressure levels. Overall SPL and 1/3-octave-band calculations were logged on the PC and transmitted over Ethernet to the separate VTTI DAS at a rate of 10 Hz.
Before and during all testing, each microphone was calibrated using a G.R.A.S. 42AA pistonphone calibrator. The 42AA (114 dB at 250 Hz) complies with all the requirements of International Electrotechnical Commission (IEC) Standard 942 (1988) Sound Calibrators Class 1, and was corrected with G.R.A.S. ZC0002K barometer.
The data acquisition and analysis system described was used for both the vehicle noise tests (using only two microphones) and for the listener testing (using four microphones).
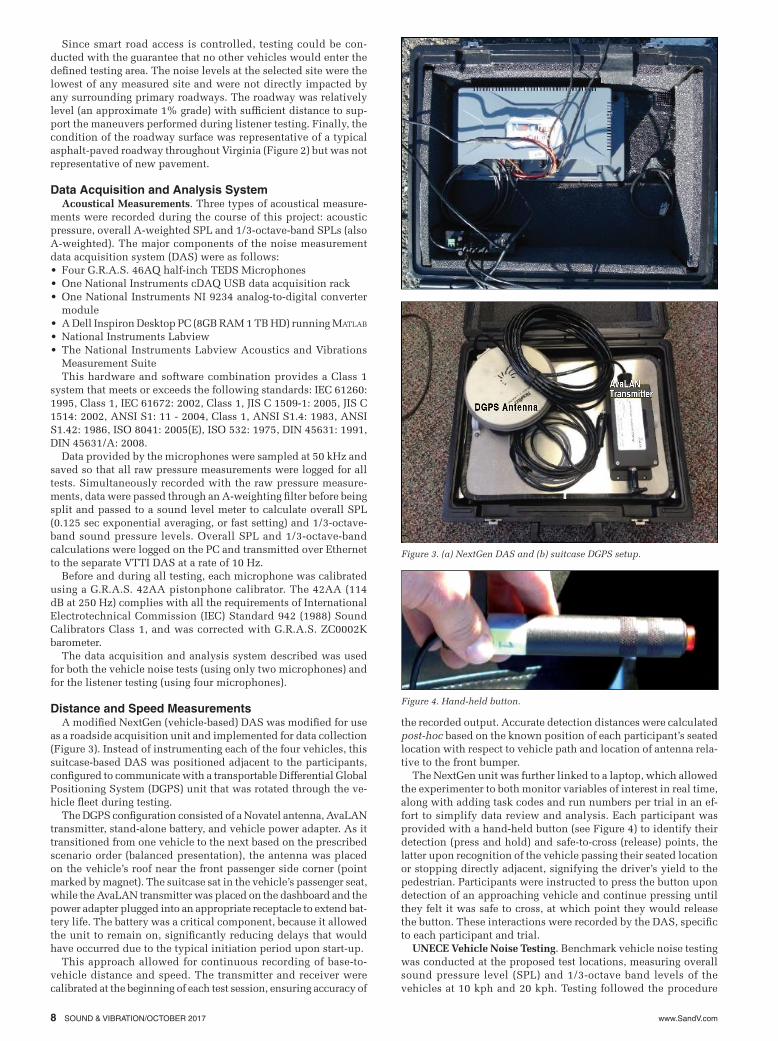
Distance and Speed MeasurementsA modified NextGen (vehicle-based) DAS was modified for use
as a roadside acquisition unit and implemented for data collection (Figure 3). Instead of instrumenting each of the four vehicles, this suitcase-based DAS was positioned adjacent to the participants, configured to communicate with a transportable Differential Global Positioning System (DGPS) unit that was rotated through the ve-hicle fleet during testing.
The DGPS configuration consisted of a Novatel antenna, AvaLAN transmitter, stand-alone battery, and vehicle power adapter. As it transitioned from one vehicle to the next based on the prescribed scenario order (balanced presentation), the antenna was placed on the vehicle’s roof near the front passenger side corner (point marked by magnet). The suitcase sat in the vehicle’s passenger seat, while the AvaLAN transmitter was placed on the dashboard and the power adapter plugged into an appropriate receptacle to extend bat-tery life. The battery was a critical component, because it allowed the unit to remain on, significantly reducing delays that would have occurred due to the typical initiation period upon start-up.
This approach allowed for continuous recording of base-to-vehicle distance and speed. The transmitter and receiver were calibrated at the beginning of each test session, ensuring accuracy of
the recorded output. Accurate detection distances were calculated post-hoc based on the known position of each participant’s seated location with respect to vehicle path and location of antenna rela-tive to the front bumper.
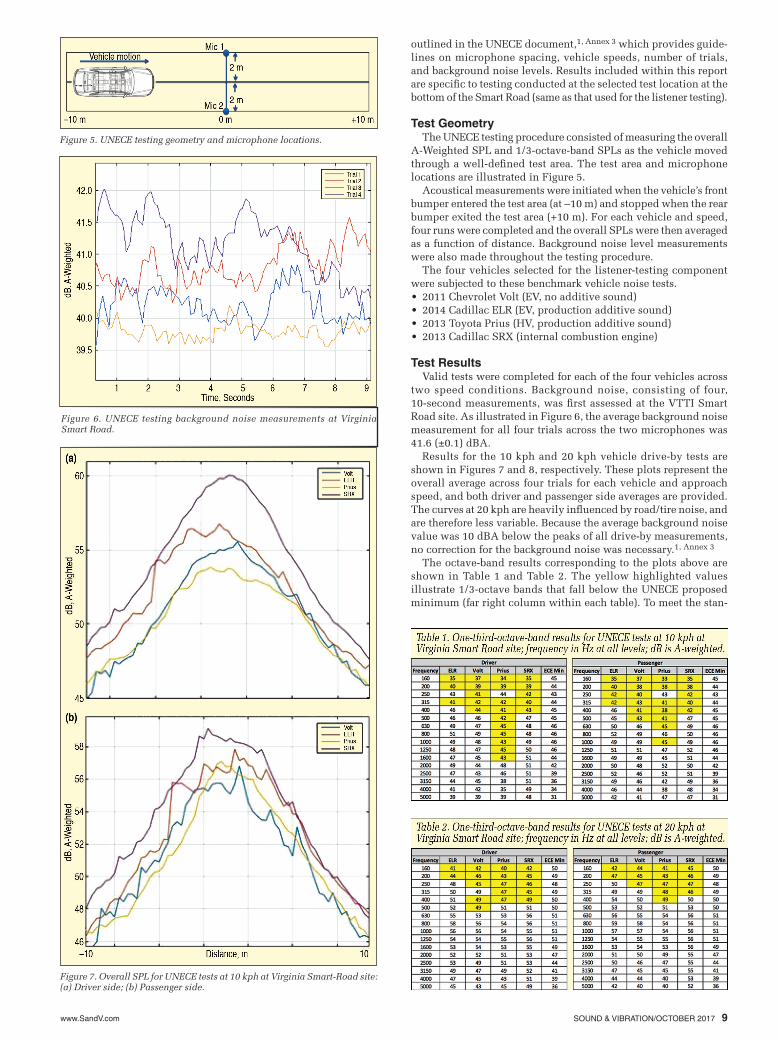
The NextGen unit was further linked to a laptop, which allowed the experimenter to both monitor variables of interest in real time, along with adding task codes and run numbers per trial in an ef-fort to simplify data review and analysis. Each participant was provided with a hand-held button (see Figure 4) to identify their detection (press and hold) and safe-to-cross (release) points, the latter upon recognition of the vehicle passing their seated location or stopping directly adjacent, signifying the driver’s yield to the pedestrian. Participants were instructed to press the button upon detection of an approaching vehicle and continue pressing until they felt it was safe to cross, at which point they would release the button. These interactions were recorded by the DAS, specific to each participant and trial.
UNECE Vehicle Noise Testing. Benchmark vehicle noise testing was conducted at the proposed test locations, measuring overall sound pressure level (SPL) and 1/3-octave band levels of the vehicles at 10 kph and 20 kph. Testing followed the procedure
Figure 3. (a) NextGen DAS and (b) suitcase DGPS setup.
Figure 4. Hand-held button.
www.SandV.com SOUND & VIBRATION/OCTOBER 2017 9
outlined in the UNECE document,1, Annex 3 which provides guide-lines on microphone spacing, vehicle speeds, number of trials, and background noise levels. Results included within this report are specific to testing conducted at the selected test location at the bottom of the Smart Road (same as that used for the listener testing).
Test GeometryThe UNECE testing procedure consisted of measuring the overall
A-Weighted SPL and 1/3-octave-band SPLs as the vehicle moved through a well-defined test area. The test area and microphone locations are illustrated in Figure 5.
Acoustical measurements were initiated when the vehicle’s front bumper entered the test area (at –10 m) and stopped when the rear bumper exited the test area (+10 m). For each vehicle and speed, four runs were completed and the overall SPLs were then averaged as a function of distance. Background noise level measurements were also made throughout the testing procedure.
The four vehicles selected for the listener-testing component were subjected to these benchmark vehicle noise tests.• 2011 Chevrolet Volt (EV, no additive sound)• 2014 Cadillac ELR (EV, production additive sound)• 2013 Toyota Prius (HV, production additive sound)• 2013 Cadillac SRX (internal combustion engine)
Test ResultsValid tests were completed for each of the four vehicles across
two speed conditions. Background noise, consisting of four, 10-second measurements, was first assessed at the VTTI Smart Road site. As illustrated in Figure 6, the average background noise measurement for all four trials across the two microphones was 41.6 (±0.1) dBA.
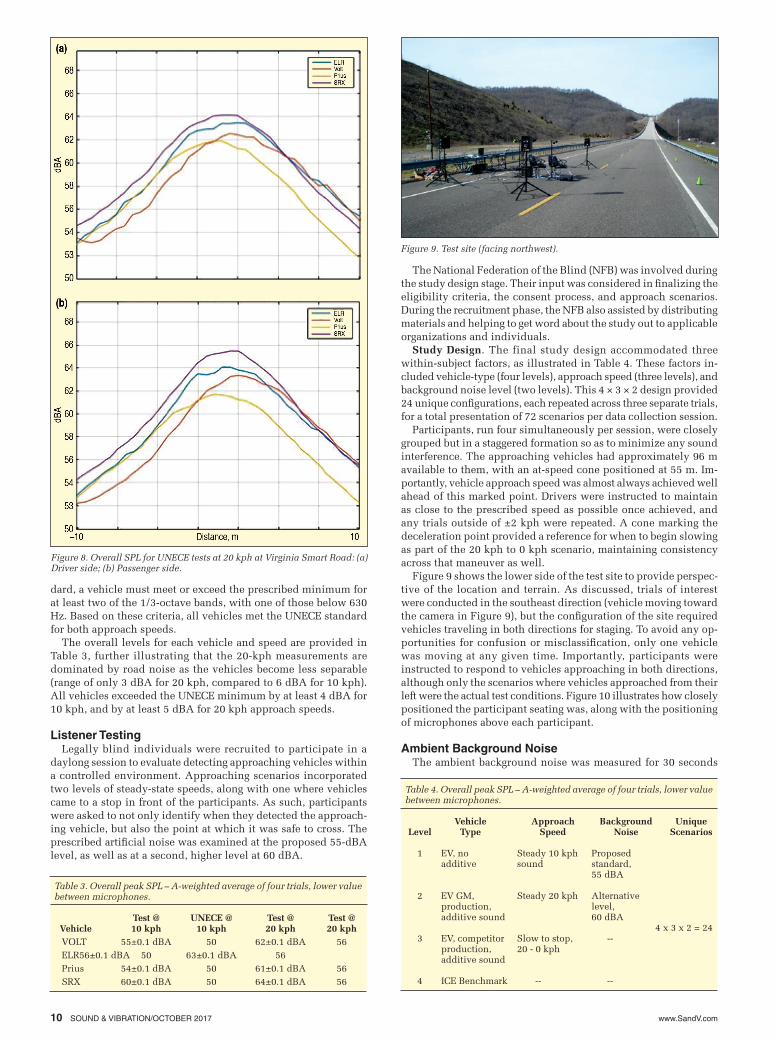
Results for the 10 kph and 20 kph vehicle drive-by tests are shown in Figures 7 and 8, respectively. These plots represent the overall average across four trials for each vehicle and approach speed, and both driver and passenger side averages are provided. The curves at 20 kph are heavily influenced by road/tire noise, and are therefore less variable. Because the average background noise value was 10 dBA below the peaks of all drive-by measurements, no correction for the background noise was necessary.1, Annex 3
The octave-band results corresponding to the plots above are shown in Table 1 and Table 2. The yellow highlighted values illustrate 1/3-octave bands that fall below the UNECE proposed minimum (far right column within each table). To meet the stan-
Figure 5. UNECE testing geometry and microphone locations.
Figure 6. UNECE testing background noise measurements at Virginia Smart Road.
Figure 7. Overall SPL for UNECE tests at 10 kph at Virginia Smart-Road site: (a) Driver side; (b) Passenger side.
www.SandV.com10 SOUND & VIBRATION/OCTOBER 2017
dard, a vehicle must meet or exceed the prescribed minimum for at least two of the 1/3-octave bands, with one of those below 630 Hz. Based on these criteria, all vehicles met the UNECE standard for both approach speeds.
The overall levels for each vehicle and speed are provided in Table 3, further illustrating that the 20-kph measurements are dominated by road noise as the vehicles become less separable (range of only 3 dBA for 20 kph, compared to 6 dBA for 10 kph). All vehicles exceeded the UNECE minimum by at least 4 dBA for 10 kph, and by at least 5 dBA for 20 kph approach speeds.
Listener TestingLegally blind individuals were recruited to participate in a
daylong session to evaluate detecting approaching vehicles within a controlled environment. Approaching scenarios incorporated two levels of steady-state speeds, along with one where vehicles came to a stop in front of the participants. As such, participants were asked to not only identify when they detected the approach-ing vehicle, but also the point at which it was safe to cross. The prescribed artificial noise was examined at the proposed 55-dBA level, as well as at a second, higher level at 60 dBA.
The National Federation of the Blind (NFB) was involved during the study design stage. Their input was considered in finalizing the eligibility criteria, the consent process, and approach scenarios. During the recruitment phase, the NFB also assisted by distributing materials and helping to get word about the study out to applicable organizations and individuals.
Study Design. The final study design accommodated three within-subject factors, as illustrated in Table 4. These factors in-cluded vehicle-type (four levels), approach speed (three levels), and background noise level (two levels). This 4 × 3 × 2 design provided 24 unique configurations, each repeated across three separate trials, for a total presentation of 72 scenarios per data collection session.
Participants, run four simultaneously per session, were closely grouped but in a staggered formation so as to minimize any sound interference. The approaching vehicles had approximately 96 m available to them, with an at-speed cone positioned at 55 m. Im-portantly, vehicle approach speed was almost always achieved well ahead of this marked point. Drivers were instructed to maintain as close to the prescribed speed as possible once achieved, and any trials outside of ±2 kph were repeated. A cone marking the deceleration point provided a reference for when to begin slowing as part of the 20 kph to 0 kph scenario, maintaining consistency across that maneuver as well.
Figure 9 shows the lower side of the test site to provide perspec-tive of the location and terrain. As discussed, trials of interest were conducted in the southeast direction (vehicle moving toward the camera in Figure 9), but the configuration of the site required vehicles traveling in both directions for staging. To avoid any op-portunities for confusion or misclassification, only one vehicle was moving at any given time. Importantly, participants were instructed to respond to vehicles approaching in both directions, although only the scenarios where vehicles approached from their left were the actual test conditions. Figure 10 illustrates how closely positioned the participant seating was, along with the positioning of microphones above each participant.
Ambient Background NoiseThe ambient background noise was measured for 30 seconds
Table 3. Overall peak SPL – A-weighted average of four trials, lower value between microphones.
Test @ UNECE @ Test @ Test @ Vehicle 10 kph 10 kph 20 kph 20 kph
VOLT 55±0.1 dBA 50 62±0.1 dBA 56ELR 56±0.1 dBA 50 63±0.1 dBA 56Prius 54±0.1 dBA 50 61±0.1 dBA 56SRX 60±0.1 dBA 50 64±0.1 dBA 56
Figure 8. Overall SPL for UNECE tests at 20 kph at Virginia Smart Road: (a) Driver side; (b) Passenger side.
Table 4. Overall peak SPL – A-weighted average of four trials, lower value between microphones.
Vehicle Approach Background Unique Level Type Speed Noise Scenarios
1 EV, no Steady 10 kph Proposed additive sound standard, 55 dBA
2 EV GM, Steady 20 kph Alternative production, level, additive sound 60 dBA 4 x 3 x 2 = 24 3 EV, competitor Slow to stop, -- production, 20 - 0 kph additive sound
4 ICE Benchmark -- --
Figure 9. Test site (facing northwest).
www.SandV.com SOUND & VIBRATION/OCTOBER 2017 11
six different times during the listener tests. To capture the full 24 participants, listener testing was spread out over six days. Table 5 provides the average daily background noise for each day of testing. All days had quite low noise levels primarily due to the surrounding terrain that shields the test site from major highways and industrial sound sources. Since the highest-level day (day five) is more than 15 dB below the artificial background noise, the effects of ambient background noise on the test results can be considered negligible.
Generating Artificial Background Noise To provide a constant, steady background noise for the listener
testing, artificial background noise was generated at two levels: 55 and 60 dBA. The noise spectrum as determined by NHTSA2 is illustrated in Figure 11.
The noise was generated in a commercially available digital audio workstation. The first step was to use a standard plugin – white noise to generate white, Gaussian noise. The noise was then filtered using a standard equalizer. The low frequencies required a significant boost so that when this signal was A-weighted, the spectrum would match the NHTSA profile.
The noise signal was broadcast over five JBL LSR308 loudspeak-ers and one JBL LSR 310S subwoofer. These speakers were posi-tioned around the sides and to the rear of the participants, creating a sound envelope within which the noise was evenly dispersed. All speaker output was routed through a Focusrite Scarlett 18i20 USB audio interface (see Figure 12), which also shows a corresponding image of the on-road arrangement.
Also pictured in Figure 10 are the four microphones that were placed directly above each participant’s seated position. Four
G.R.A.S. 46AQ, half-inch, TEDS microphones (omni-directional) were used, with a sensitivity of 50 mV/Pa, a frequency range from 3.15 Hz to 12.5 KHz, and a dynamic range of 17 to 138 dBA. This provided accurate sound pres-sure levels and 1/3-octave-band measurements through-out the experiment.
This equipment was all
Figure 10. Positioning of participant chairs and microphones.
Figure 11. Background noise spectrum.
connected through a National Instruments cDAQ USB data ac-quisition rack and a National Instruments 9234 analog-to-digital converter module to a PC running customized LabView software that recorded all relevant acoustic measures for each task. Output was also directly routed to the DAS for collection in parallel with the time-stamped DGPS measurements.
Noise verification was conducted throughout listener testing as well. During periods where vehicles were parked and not running, measurements were recorded and the 1/3-octave-band spectra were averaged over all trials to determine the actual signal spectrum received at the microphones. Output is provided for the 55 dBA
Figure12. (a) Background noise generation signal path; (b) actual arrange-ment.
Figure 13. Average background noise spectrum for (a) 55 dBA and (b) 60 dBA.
Table 5. Average daily background noise at test site.
Avg Bkgnd (4 MicsTest Day SPL - dBA
1 33.0±0.4 2 33.0±0.5 3 33.7±0.4 4 34.1±0.9 5 37.0±0.9 6 36.5±1.3
www.SandV.com12 SOUND & VIBRATION/OCTOBER 2017
Figure 14. Mean detection distance and overall SPL for each vehicle with 55 dBA background noise.
Figure 15. Mean detection distance and overall SPL for each vehicle with 60 dBA background noise.
and 60 dBA levels in Figure 13. The area under the curve for the 55-dBA spectrum matches the target spectrum in Figure 11 within 3%. There is a dip in the spectrum at 180 Hz, where the LSR308 speakers drop in their response and the subwoofer is unable to counter the loss.
Listener Test ResultsAs discussed, participants were instructed to press the button
when they detected the approach of an oncoming vehicle. This was done in the presence of the 55 dBA and 60 dBA background noise levels discussed in the section above. Figures 14 and 15 provide
the average distance and SPL results over all trials for each vehicle type, along with the NHTSA detection criteria by approach speed for reference.
Figures 14 and 15 show that mean detection distance within both approach speeds exceeds the NHTSA criteria proposed for each travel speed (5 m at 10 kph, and 11 m at 20 kph). The average sound pressure levels are above but within 1 dBA of the artificial background noise.
When focusing solely on the 10-kph approach speed, significance (F(3,69) = 12.662, p < 0.001) is observed across the sample, since a clear separation emerges with respect to the detection advantage of the traditional ICE vehicle (SRX) relative to its EV and HV counter-parts. Ultimately, the SRX elicits a significantly greater detection advantage compared to the other three vehicles, none of which are significantly different from each other.
Mean detection distances by vehicle for the solid orange curves in Figures 14 and 15 illustrate the 20-kph steady approach. Detec-tion distances increase dramatically relative to those observed for 10 kph, indicative of the additional road noise provided by the tires at higher speeds. The advantage held earlier by the ICE vehicle relative to the quieter vehicles disappears, except for the Prius. Statistically, the Prius elicited significantly shorter mean detec-tion distances relative to each of the other three vehicles (F(3,69) = 7.609, p < 0.001). The Prius was equipped with the narrowest tires of the group, likely playing a role in these results. Regard-less, mean detection distances for each vehicle are well above the NHTSA minimum criteria.
As expected, detection distances were negatively impacted with an increase in background noise from 55 to 60 dBA. How-ever, the two figures illustrate how trends observed across both the 10-kph and 20-kph steady approach scenarios under the 55 dBA background noise remain relatively stable with the increase to 60 dBA, albeit reduced proportionally. Across the sample as a whole, detection distances fell approximately 33% for the 10-kph approach, ranging from a low of 29% for the SRX to a high of 36% for the ELR. Similarly, the overall percentage drop in detection distances for 20 kph was approximately 29%, with a low of 21% for the SRX and a high of 35% for the Volt.
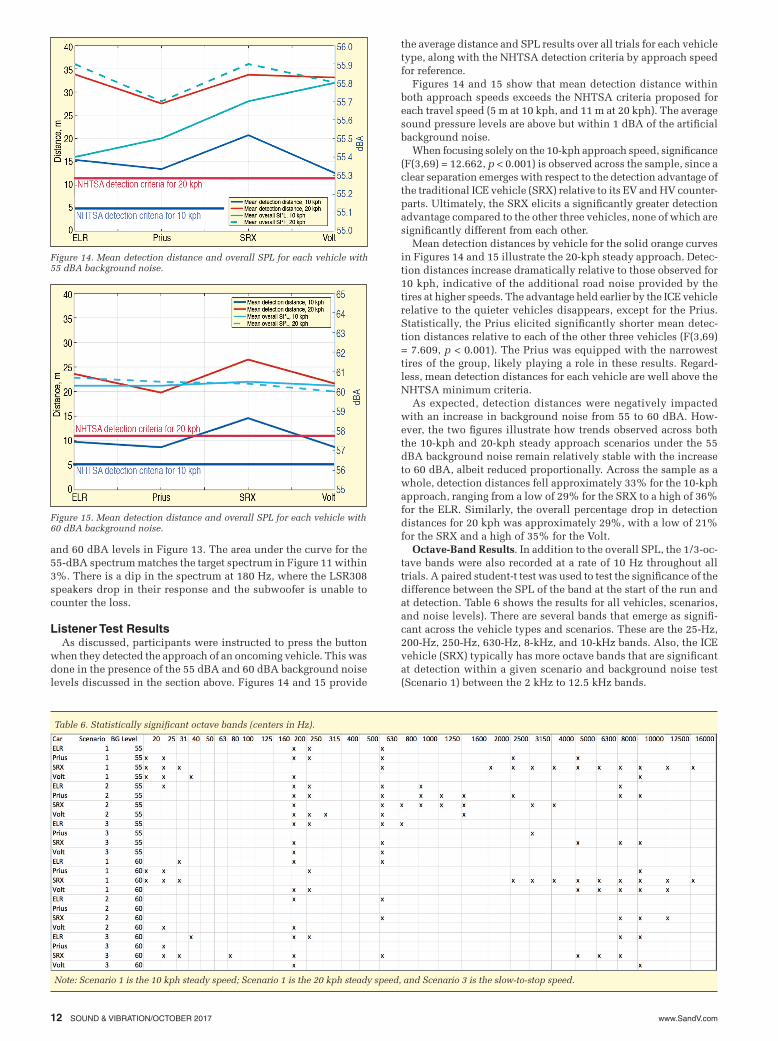
Octave-Band Results. In addition to the overall SPL, the 1/3-oc-tave bands were also recorded at a rate of 10 Hz throughout all trials. A paired student-t test was used to test the significance of the difference between the SPL of the band at the start of the run and at detection. Table 6 shows the results for all vehicles, scenarios, and noise levels). There are several bands that emerge as signifi-cant across the vehicle types and scenarios. These are the 25-Hz, 200-Hz, 250-Hz, 630-Hz, 8-kHz, and 10-kHz bands. Also, the ICE vehicle (SRX) typically has more octave bands that are significant at detection within a given scenario and background noise test (Scenario 1) between the 2 kHz to 12.5 kHz bands.
Table 6. Statistically significant octave bands (centers in Hz).
Note: Scenario 1 is the 10 kph steady speed; Scenario 1 is the 20 kph steady speed, and Scenario 3 is the slow-to-stop speed.
www.SandV.com SOUND & VIBRATION/OCTOBER 2017 13
Summary/ConclusionsThe overall objective of this research effort was to examine the
appropriateness of the proposed UNECE test methodology for evaluating detectability of quiet (non-ICE) vehicles. Ultimately, this study provided a number of key findings within the targeted constraints.
As expected, the background noise level greatly impacted participants’ ability to detect approaching vehicles. Notably, the degradation observed when increasing background noise from 55 dBA to 60 dBA applied to all vehicles by an average of about 30%. When evaluating mean detection distances across the sample, both background noise levels still elicited detection distances above NHTSA’s desired threshold. We emphasize that this desired detection distance is based on the assumption that the driver is attentive and ready to respond in an urgent manner. As such, the greater the perceived detection, the better chance both the driver and pedestrians have at avoiding any potential conflict. With these results in mind, characterization of background noise levels within typical intersection environments would greatly benefit the appropriateness of the selected evaluation criteria within the study parameters.
Demonstrated differences across the steady-state approach speeds also met expectations, as tire-road noise increases directly with speed. Detection distances were vastly improved when in-creasing speeds from 10 kph to 20 kph. This higher road noise essentially eliminated differences in detection between the ELR and Volt relative to the ICE-benchmark SRX. The Prius’ detec-tion difference, although still greatly improved from 10 kph, was significantly lower relative to the other three vehicles. Riding on the narrowest tires within the group likely contributed to this finding. Ultimately, these trends held relatively stable across both noise levels. For both approach speeds, detection distances for all vehicles comfortably exceeded the current NHTSA minimum suggested detection criteria. These findings provide more evidence that proposed testing standards can limit testing to speeds at or below 20 kph. The author can be reached at: [email protected].
AcknowledgmentsThe authors would like to acknowledge the support of The
General Motors Corporation in funding the study. We would also like to acknowledge the support of The National Federation of the Blind for advice and help in recruiting test subjects.
References1. UN:ECE. (2015), Proposal for a new regulation concerning the approval of
quiet road transport vehicles (QRTV) (ECE/TRANS/WP.29/GRB/2015/9). Retrieved from http://www.unece.org/fileadmin/DAM/trans/doc/2015/wp29grb/ECE-TRANS-WP.29-GRB-2015-09e.pdf
2. National Highway Traffic Safety Administration. (2011), Minimum sound requirements for hybrid and electric vehicles-Draft environmental assess-ment, Docket Number NHTSA-2011-0100. Washington, DC, US Depart-ment of Transportation.
3. United States Department of Transportation, (2013), Minimum sound re-quirements for hybrid and electric vehicles. Federal Motor Vehicle Safety Standard, Docket No. NHTSA-2011-0148, Notice of proposed rulemaking (NPRM).
4. Pliskow, J., Naghshineh, K., Emerson, R. W., Kim, D., & Myers, K., (2011), Detection of hybrid and quiet vehicles by blind and visually impaired pedestrians (SAE Technical Paper 2011-01-1725). Warrendale, PA; SAE International. doi:10.4271/2011-01-1725.
5. Emerson, R. W., Kim, D. S., Naghshineh, K., & Myers, K., (2012). Blind pedestrians and quieter vehicles: How adding artificial sounds impacts travel decisions. Paper presented at the Proceedings of Internoise Confer-ence 2012, New York.
6. Kim, D. S., Emerson, R. W., Naghshineh, K., & Myers, K. (2014), Influence of ambient sound fluctuations on the crossing decisions of pedestrians who are visually impaired: Implications for setting a minimum sound level for quiet vehicles, Journal of Visual Impairment & Blindness (Online), 108(5), 368
7. Neurauter, M. L., Roan, M., Song, M., Harwood, L., Moore, D., and Glaser, D., (2017), Electric Vehicle Detectability by the Vision Impaired: Quan-tifying Impact of Vehicle Generated Acoustic Signatures on Minimum Detection Distances, 25th International Technical Conference on the Enhanced Safety of Vehicles (ESV), Detroit, MI.
8. National Highway Traffic Safety Administration, 49 CFR Part 571 and 585 Docket No. NHTSA-2016-xxxx RIN 2127-AK93, Federal Motor Ve-hicle Safety Standards, Minimum Sound Requirements for Hybrid and Electric Vehicles.