assessing quality of an irrigation canal ecosystem, … quality of an irrigation canal ecosystem,...
TRANSCRIPT

Assessing quality of an irrigation canal ecosystem, through water and
sediment environmental parameters. A case study in Thessaly region,
Greece
AUGOUSTINOS AUGOUSTISa, MARIANTHI HATZIIOANNOUb, SAVAS PAPADOPOULOSc,
DIMITRIOS KATERISa, CHRISTOS NEOFYTOU
b, DIMITRIOS VAFIDIS
b
a Department of Biosystems Engineering, Technological Education Institution of Larissa
41110 Larissa, GREECE
[email protected] b School of Agricultural Sciences, Department of Ichthyology and Aquatic Environment
Fytoko Street, 38446 N. Ionia Magnisias, GREECE
c PEGEAL Central Greece Prefecture of Larissa
Ioanninon and Avlonos, 41334 Larissa, GREECE
Abstract: - This study aimed to record and evaluates the physicochemical parameters (Na+, K+, Cℓ-, Ca2+, Mg2+,
electrical conductivity, SO42-
, total alkalinity, CO32-
and HCO3-
) and give heavy metals (Cr, Pd, Ni, Cu, and Cd)
in sediment Asmaki canal in order to assess the quality of irrigation water used and the nature of pollution
along the canal in relation the Sodium Absorption Radio (SAR), the percentage Sodium (Na %) with the help
of the Piper diagram. Samples were collected and analyzed bimonthly in May, July and September, at twelve
sampling sites along the irrigation-drainage Asmaki canal for two consecutive years (2008 – 2009). We observed increased concentrations of nutrients due to anthropogenic inputs, mainly because of the discharged
contaminating waters from the large industrial and agricultural activity.
Key-Words: - Water quality, Sodium Absorption Radio, Sodium percentage, Piper diagramme
1 Introduction This paper reveal the results of a two-year survey on
specific water quality parameters of the Asmaki
(Thessaly, Greece) irrigation canal in order to
monitor changes caused by the seasonal
hydrological cycle and assess the contribution of
urban, agricultural and industrial activities.
For Pinios River and its tributaries, there are
several studies which demonstrate the degradation
of surface water due to extensive use of fertilizers
and pesticides and the presence of heavy metals in
some places [1,2,3]. With regard to Asmaki
irrigation canal, which runs across part of the
Thessaly basin, there are only few studies [4]
showing the pollution of the surface waters.
The values of Sodium Absorption Radio (SAR)
found by Stamatis (1999) [5], showed the water of
Pinios river is suitable for irrigation Loukas (2010)
[6]. They ranged around 0.3 and only in very few
cases it reached up to 1.10. Conductivity values
mostly ranged from 200 to 700 mS/cm and only in
certain cases it was higher than 1000 mS/cm. This
means that there is low salinity hazard by the use of
such irrigation water. Papadopoulou-Mourkidou
(2002) [7] found increased concentrations of sodium
and SAR values in other rivers of Greece such as of
Evros and Strimonas. Singh (2002) [8] evaluated the
quality of both surface and underground waters of the Damodar river basin in India and found that
taking into account both SAR values and the risk of
sodium (Na%) the quality of surface waters of the
basin found to excellent. Venugopal et al. (2008)
[9], evaluated the water quality of Adyar River in
India in two different seasons of the year and found
that roughly most samples had high salinity levels.
This involves a high or very high risk for crops. On
the other hand the Na percentages (%) indicate a
minimal use risk and this allows unrestricted use of
that irrigation water in almost all types of soils with
regard to development of high ESP values.
The values of heavy metals found by Fytianos et al.
(2002) [2], shoed that the mean concentrations of
the examined heavy metals (Cd, Cu, Pb, Cr, Ni)
show little variations between different sampling
sites, suggesting influence from geologic factors
rather than from point sources. In general, dissolved
metal concentrations at all sampling sites were low
[10]. The values of heavy metals found by Calmano
W. and Forstner, U. (1983) [11] showed the
sediment of river in central Europe is there was not
a significant burden of heavy metals. Venugopal et
al. (2008) [9], evaluated the water quality of Adyar
River in India in two different seasons of the year
and found that heavy metals ranges (addition of Cu)
to normal levels ranged.
WSEAS TRANSACTIONS on ENVIRONMENT and DEVELOPMENT
Augoustinos Augoustis, Marianthi Hatziioannou, Savas Papadopoulos, Dimitrios Kateris, Christos Neofytou, Dimitrios Vafidis
E-ISSN: 2224-3496 23 Issue 1, Volume 8, January 2012

2 Materials and Methods
2.1 Study area The research area (Figure 1) extends from the north-
eastern side of the city of Larissa, up to a region of
the former and now in recovery Lake Karla. This is
basically a flat area used for growing mostly one-
year crops with cotton holding the first place with about 70%, corn in second place with about 20%
and various seasonal and other tree crops holding
the rest 10% (Pinios Local Land Reclamation
Agency - T.O.E.V). Asmaki is the central canal (8T)
and while it was designed as a drainage ditch, now it
is primarily one of the main irrigation ditches in the area. According to available data, the Asmaki canal
is supplied with water from Pinios River and the
surrounding mountains and is connected to canal
"1T" constructed in the period during which the
Lake Karla was drained. The "1T" artificial canal
leads to the tunnel opening that was created along
with the drying of Lake Karla, the years 1961-62, to
drain water in the Pagasetike Gulf.
For the purposes of this study 12 sampling sides
were selected (S1 to S12) (Table 1, Figure 1),
starting from the tunnel which drains the water to
the Pagasetike Gulf (west of Lake Karla) (S2) and
extending to the vicinity of the slaughterhouse of
Gyrtoni village (S11) and Omorfochori village
(S12). Asmaki is still the primary recipient of waste
from industrial, agricultural, farming and urban
activities. The sources of pollution of Asmaki river
are distinguished in point, non-point and obscured
sources creating α large-scale organic pollution and
minor chemical pollution (eg. dyeworks, oily
sludge, production waste, use of greases, soaps,
disinfectants). The industrial units of the region are
a factory of treatment of alcohol (near S7 station), a
textile dyeworks (near to S8), a food production
industry (near to spots S9 and S10) and the
Slaughterhouses of Gyrtoni (near to S11). A lot of
livestock farming units of the region manage their
waste (eg. the waste of dairy plants and solid waste)
to the method of direct dispersion in fields, or in
streams. Significant pollution also occurs through
the leaching of crops due to the use of pesticides and
chemical fertilizers. The sampling side S1 was
chosen because it is outside the Asmaki canal
(Figure 1) but also because it is near to the cement
factory "Hercules". Finally S12 sampling spot is the
only one that receives water from Pinios River and
the only one with a cemented sublayer.
Fig. 1 - Map of study area with the sampling sites
WSEAS TRANSACTIONS on ENVIRONMENT and DEVELOPMENT
Augoustinos Augoustis, Marianthi Hatziioannou, Savas Papadopoulos, Dimitrios Kateris, Christos Neofytou, Dimitrios Vafidis
E-ISSN: 2224-3496 24 Issue 1, Volume 8, January 2012

Table 1 - Sampling sites
Sampling sites Latitude Longitude
1 Near Hercules cement plant 39ο 24΄.085 22ο 46΄.951
2 Karla Tunnel (1T) 39ο 27΄.044 22ο 48΄.608
3 Bridge Stefanovikeio village(1Τ) 39ο 28΄.825 22ο 46΄.816
4 Kalamaki (1Τ) 39ο 33΄.418 22ο 43΄.390
5 Plasia (contribution 1Τ και 8Τ) 39ο 38΄.539 22ο 39΄.036
6 Bidge Eleftherio village (8Τ) 39ο 39΄.756 22ο 32΄.342
7 Near the alcohol industry (bypass 8Τ) 39ο 39΄.627 22ο 29΄.709
8 Near Pelasgis – washing, dyeing fabrics (bypass 9Τ) 39ο 41΄.103 22ο 29΄.424
9 Area of food industry (bypass 9t) 39ο 41΄.814 22ο 29΄.905
10 Gentiki 9Τ 39ο 42΄.289 22ο 29΄.987
11 Close slaughterhouse Gyrtoni (9Τ) 39ο 44΄.288 22ο 28΄.226
12 Omorfochorio (6Τ) 39ο 39΄.897 22ο 29΄.267
2.1 Water sampling - Chemical analysis The water sampling was carried out bimonthly,
during the irrigation season which lasts from May to
September, for two consecutive years (2008 –
2009). The samples of water (1lt) were collected in
PVC bottles from the middle of flow of the aquatic
stream and as long as this was possible from its
means of depth and was stored in refrigerator (at
4oC), in the dark until chemical analysis that
followed immediately after each sampling. The
sampling and analytical protocols used were in
accordance with Standards Methods for the
Examination of Water and Wastewater [12].
Water temperature, pH, electrical conductivity
(EC) and total alkalinity were measured by standard
electrochemical methods [13]. The concentrations of
sodium (Na+) and potassium (K
+) cations were
determined by flame photometry [14] while those of
calcium (Ca2+
) and magnesium (Mg2+
) were
measured by flame atomic absorption method,
modified Varian solution in CaCl3 environment
[15]. To determine the concentration of chlorine
anions (Cℓ-) Mohr method was applied [16] while
for carbonates (CO32-
) and bicarbonates (HCO3-)
potentiometry was used [17]. The concentrations of
ammoniac (NH4) and sulphate (SO42-
) ions were
evaluated according to Standards Methods for the
Examination of Water and Wastewater [12,13].
A sediment sample was taken once to determine
the organic matter concentration and five heavy
metals (cadmium, chromium, lead, nickel, copper)
in the sediment. These samples were held on July
29, 2009 at 11 out of 12 sampling spots because in
station S12 the substrate is concrete. Three samples
of surface sediment were taken (to a depth of 5 cm)
from each spot, quantity of 100 - 200g. Stones and
foreign matter were removed from the samples
before the later being transported to the laboratory.
Air drying of samples followed, with periodic
shaking to constant weight and final moisture
content from 0 to 7%, drying in an oven at 40°C to
constant weight. Then after the three samples of
each sampling sides were mixed, grinding and
sieving followed (sieve of 2 mm2) in accordance
with ASTM C 999 (2010) [18]. Samples were
placed in polyethylene containers and stored in a
desiccator. Organic matter was determined using
Walkley and Black method. For the determination
of metals the samples were treated with 4M HNO3
[19]. Total metals Cd, Cr, Pb, Ni and Cu, were determined by using atomic absorption (VARIAN
220 FS). All water and sediment tests were
conducted in the laboratories of Regional
Laboratory of Agricultural Extension and Fertilizer
Analysis [20].
For all water samples SAR value (Sodium
Absorption Ratio) was calculated which expresses
the activity of sodium ions and determines their
ability to rotate with cations such as Ca and Mg
adsorbed by soil colloids. Based on S.A.R. value
four categories of risk of salinisation of irrigation
water are distinguished for electrical conductivity
100mmho cm-1, according to the classification of
US Salinity Laboratory, (1954) [21]. When the
index takes values:
<10, Category 1 (low risk of sodium)
10 - 18, Category 2 (sodium average risk)
18 - 26, Category 3 (high risk of sodium)
> 26, Category 4 (very high risk of sodium)
WSEAS TRANSACTIONS on ENVIRONMENT and DEVELOPMENT
Augoustinos Augoustis, Marianthi Hatziioannou, Savas Papadopoulos, Dimitrios Kateris, Christos Neofytou, Dimitrios Vafidis
E-ISSN: 2224-3496 25 Issue 1, Volume 8, January 2012

Another classification was made according to the
classification of US Salinity Laboratory, (1954) [21]
and took into account the measured values of EC
(electrical conductivity) and SAR (Sodium
Absorption Ratio) focusing on the irrigation period.
The % Na content in irrigation water was
determined as the ratio of Na+ to the sum of cations
(sodium, potassium, calcium and magnesium)
expressed in meq ℓ-1
:
Water quality Νa% Conductivity (µs/cm)
Excellent <20 <250
Good 20-40 250-750
Acceptable 40-60 750-2000
Doubtful 60-80 2.000-3.000
Unsuitable > 80 > 3.000
To further investigate the hydrochemical condition
and the origin of water from aquifers in the study
area it was considered appropriate to make Piper
diagram in order to evaluate hydrochemical phase of
water [22].
3 Results and Discussion Increased organic matter (Figure 2a) in the sediment
was found at sapling sides 10, 3 and 7, while at the
S1 and S2 the proportion of organic matter was
much lower. Higher value (8.0%) was found at SS 10 which is associated with organic pollution, as
this sampling site is located in an area where the
textile dyeing plant is operating while the lower
value was found at S2 (0.5%) indicating that the soil
near Lake Karla is poor in organic matter.
The concentrations of 5 heavy metals (cadmium,
chromium, lead, nickel copper) in the sediment were
low (Figure 2b, 2c). The levels of heavy metals
found at 11 sampling sites are well below the
allowed limits set by the European legislation for
agricultural use [23]. This was largely expected as
there aren’t any large units in the area producing
wastes containing significant concentrations of
heavy metals.
Metals enter into river water through a variety of
sources, such as chemical weathering of rocks and
soils, dead and decomposing vegetation and animal
matter, wet and dry fallout of atmospheric
particulate matter and from man’s activities
including the discharge of various domestic and
industrial effluents [9]. Sampling sites 7 (Figure 2b)
where extensive farming is practiced shows high Cu
values and it is expected that Cu may enter into the
aquifers through agrochemicals. The value obtained
was lower than the permissible limits and hence
adverse effects from domestic use are not expected
as far as this metal is concerned. The S7 site is
found in an area where a factory producing alcohol
is operating which probably relates to the additional
CuSO4.5H2O. At this station increased organic
matter which strongly retains Cu was observed
(Figure 2a). Organic matter is one of the main
factors responsible for strong retention of elements
in the soil, because it forms stable soluble and
insoluble compounds [24].
0
1
2
3
4
5
6
7
8
9
S1 S2 S3 S4 S5 S6 S7 S8 S9 S10 S11
Sampling sites
Org
an
ic m
att
er (
%)
(a)
0
50
100
150
200
250
300
350
400
450
S1 S2 S3 S4 S5 S6 S7 S8 S9 S10 S11
Sampling sites
mg
/ K
g
Cr
Pb
Ni
Cu
(b)
0
0,1
0,2
0,3
0,4
0,5
0,6
S1 S2 S3 S4 S5 S6 S7 S8 S9 S10 S11
Sampling sites
mg
/ k
g
(c)
Fig. 2 - a) The organic matter (%) in the sediment,
b) measured values (copper, cadmium, lead nickel)
core of heavy metals in sludge chromium and
c) Cadmium (Cd) on September 21, 2009.
WSEAS TRANSACTIONS on ENVIRONMENT and DEVELOPMENT
Augoustinos Augoustis, Marianthi Hatziioannou, Savas Papadopoulos, Dimitrios Kateris, Christos Neofytou, Dimitrios Vafidis
E-ISSN: 2224-3496 26 Issue 1, Volume 8, January 2012
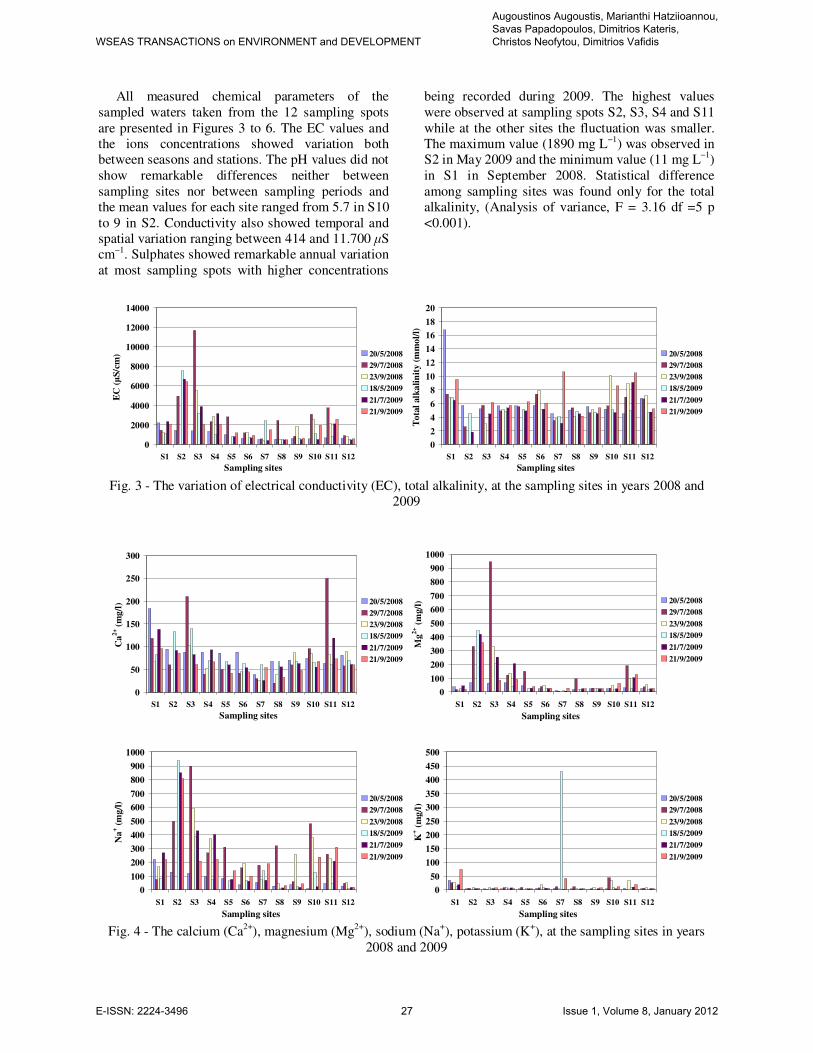
All measured chemical parameters of the
sampled waters taken from the 12 sampling spots
are presented in Figures 3 to 6. The EC values and
the ions concentrations showed variation both
between seasons and stations. The pH values did not
show remarkable differences neither between
sampling sites nor between sampling periods and
the mean values for each site ranged from 5.7 in S10
to 9 in S2. Conductivity also showed temporal and
spatial variation ranging between 414 and 11.700 µS
cm−1. Sulphates showed remarkable annual variation
at most sampling spots with higher concentrations
being recorded during 2009. The highest values
were observed at sampling spots S2, S3, S4 and S11
while at the other sites the fluctuation was smaller.
The maximum value (1890 mg L−1) was observed in
S2 in May 2009 and the minimum value (11 mg L−1
)
in S1 in September 2008. Statistical difference
among sampling sites was found only for the total
alkalinity, (Analysis of variance, F = 3.16 df =5 p
<0.001).
0
2000
4000
6000
8000
10000
12000
14000
S1 S2 S3 S4 S5 S6 S7 S8 S9 S10 S11 S12
Sampling sites
EC
(µ
S/c
m) 20/5/2008
29/7/2008
23/9/2008
18/5/2009
21/7/2009
21/9/2009
0
2
4
6
8
10
12
14
16
18
20
S1 S2 S3 S4 S5 S6 S7 S8 S9 S10 S11 S12
Sampling sites
To
tal
alk
ali
nit
y (
mm
ol/
l)
20/5/2008
29/7/2008
23/9/2008
18/5/2009
21/7/2009
21/9/2009
Fig. 3 - The variation of electrical conductivity (EC), total alkalinity, at the sampling sites in years 2008 and
2009
0
50
100
150
200
250
300
S1 S2 S3 S4 S5 S6 S7 S8 S9 S10 S11 S12
Sampling sites
Ca
2+ (
mg
/l) 20/5/2008
29/7/2008
23/9/2008
18/5/2009
21/7/2009
21/9/2009
0
100
200
300
400
500
600
700
800
900
1000
S1 S2 S3 S4 S5 S6 S7 S8 S9 S10 S11 S12
Sampling sites
Mg
2+ (
mg/l
) 20/5/2008
29/7/2008
23/9/2008
18/5/2009
21/7/2009
21/9/2009
0
100
200
300
400
500
600
700
800
900
1000
S1 S2 S3 S4 S5 S6 S7 S8 S9 S10 S11 S12
Sampling sites
Na
+ (
mg
/l) 20/5/2008
29/7/2008
23/9/2008
18/5/2009
21/7/2009
21/9/2009
0
50
100
150
200
250
300
350
400
450
500
S1 S2 S3 S4 S5 S6 S7 S8 S9 S10 S11 S12
Sampling sites
K+ (
mg
/l)
20/5/2008
29/7/2008
23/9/2008
18/5/2009
21/7/2009
21/9/2009
Fig. 4 - The calcium (Ca
2+), magnesium (Mg
2+), sodium (Na
+), potassium (K
+), at the sampling sites in years
2008 and 2009
WSEAS TRANSACTIONS on ENVIRONMENT and DEVELOPMENT
Augoustinos Augoustis, Marianthi Hatziioannou, Savas Papadopoulos, Dimitrios Kateris, Christos Neofytou, Dimitrios Vafidis
E-ISSN: 2224-3496 27 Issue 1, Volume 8, January 2012

0200400600800
1000120014001600180020002200240026002800
S1 S2 S3 S4 S5 S6 S7 S8 S9 S10 S11 S12
Sampling sites
Cl- (
mg
/l)
20/5/2008
29/7/2008
23/9/2008
18/5/2009
21/7/2009
21/9/2009
0
200
400
600
800
1000
1200
1400
1600
1800
2000
S1 S2 S3 S4 S5 S6 S7 S8 S9 S10 S11 S12
Sampling sites
SO
42
- (m
g/l
) 20/5/2008
29/7/2008
23/9/2008
18/5/2009
21/7/2009
21/9/2009
0
1
2
3
4
5
6
S1 S2 S3 S4 S5 S6 S7 S8 S9 S10 S11 S12
Sampling sites
CO
3(m
g/l
) 20/5/2008
29/7/2008
23/9/2008
18/5/2009
21/7/2009
21/9/2009
0
1
2
3
4
5
6
7
8
9
10
11
12
S1 S2 S3 S4 S5 S6 S7 S8 S9 S10 S11 S12
Sampling sites
HC
O3(m
g/l
) 20/5/2008
29/7/2008
23/9/2008
18/5/2009
21/7/2009
21/9/2009
Fig. 5 - The Chlorine (Cℓ
-), sulphates (SO4
2-), carbonates (CO3
2-) and bicarbonates (HCO3
-), at the sampling
sites in years 2008 and 2009
0
10
20
30
40
50
60
70
80
90
100
S1 S2 S3 S4 S5 S6 S7 S8 S9 S10 S11 S12
Sampling sites
ES
P(%
)
20/5/2008
29/7/2008
23/9/2008
18/5/2009
21/7/2009
21/9/2009
01234
56789
10
111213
S1 S2 S3 S4 S5 S6 S7 S8 S9 S10 S11 S12
Sampling sites
SA
R
20/5/2008
29/7/2008
23/9/2008
18/5/2009
21/7/2009
21/9/2009
Fig. 6 - The Percentage Alternative Solution (ESP), Sodium Absorption Radio (SAR), at the sampling sites in
years 2008 and 2009
Measured values show considerable variation
from year to year, mainly due to large differences in
climatic conditions that occurred both between 2008
and 2009, and between months, but also due to a
number of other factors, such was the influx of
water from the Pinios, the fertilization of crops, the
hydraulic characteristics of the recipient.
The nature and type of water can be evaluated by
plotting the concentration of major cations and
anions in the piper diagram (Figure 7). As for the
anions sampling sites were classified into two
categories in year 2008, the chloride, where 8
sampling sites belong (S1, S2, S3, S4, S5, S6, S8
and S10) and the sulphuric where the 4 remaining
sites are included. The same results apply to the
irrigation season of 2009 with the difference that
station 4 was classified into the sulphuric. Αs far as
the cations are concerned 4 stations were classified
in Na-K waters in 2008 and 3 stations in 2009 as
shown in the diagram. The magnesium cations
prevailed in 2 sampling stations and in both
irrigation seasons. Most sampling spots (9 in 2008
and 6 in 2009) were classified in the fourth
category, in which no ion is predominant. As for the
cations only sampling sites S1 and S9 were
classified similarly in both years.
WSEAS TRANSACTIONS on ENVIRONMENT and DEVELOPMENT
Augoustinos Augoustis, Marianthi Hatziioannou, Savas Papadopoulos, Dimitrios Kateris, Christos Neofytou, Dimitrios Vafidis
E-ISSN: 2224-3496 28 Issue 1, Volume 8, January 2012

In order to assess the water suitability for
irrigation, sodium percentage, SAR and Wilcox
diagrams (Figure 8) are evaluated. Wilcox (1955)
[25] used % sodium and electric conductivity in
evaluating the suitability of water for irrigation. For
each station Na% and averaged SAR of the 3
seasonal samplings are given in Table 2. During
2008, 9 of 12 sampling sites (75%) appear to be
good to permissible for irrigation; only S4 are
classified between doubtful and unsuitable and two
sampling sites (S2 and S3) fall under the unsuitable
level. The results for 2009 irrigation period show
that the sampling site S8 has excellent to good
classification, S8 of S12 sites (66.67%) have good
to permissible for irrigation, the S4 is characterized
doubtful to unsuitable; and two sampling sites (S1
and S2) are classified under the unsuitable level.
The results for both years demonstrate that 75% of
the water show good to permissible quality; 8% are
between doubtful and unsuitable; 17% of the water
is unsuitable for irrigation. The results reveal that
the water near the Pinios River is good for irrigation
while contamination occurs higher near Karla Lake.
This may be due to the increased values of electrical
conductivity due to soil composition in the
particular [2].
(a) (b)
Fig. 7 a,b - Piper diagram representing hydrochemical types [22]
(a) (b)
Fig. 8 – a) Rating of water samples in relation to salinity and SAR [21] and b) Specific conductance and Na%
relation for rating irrigation water [25]
WSEAS TRANSACTIONS on ENVIRONMENT and DEVELOPMENT
Augoustinos Augoustis, Marianthi Hatziioannou, Savas Papadopoulos, Dimitrios Kateris, Christos Neofytou, Dimitrios Vafidis
E-ISSN: 2224-3496 29 Issue 1, Volume 8, January 2012
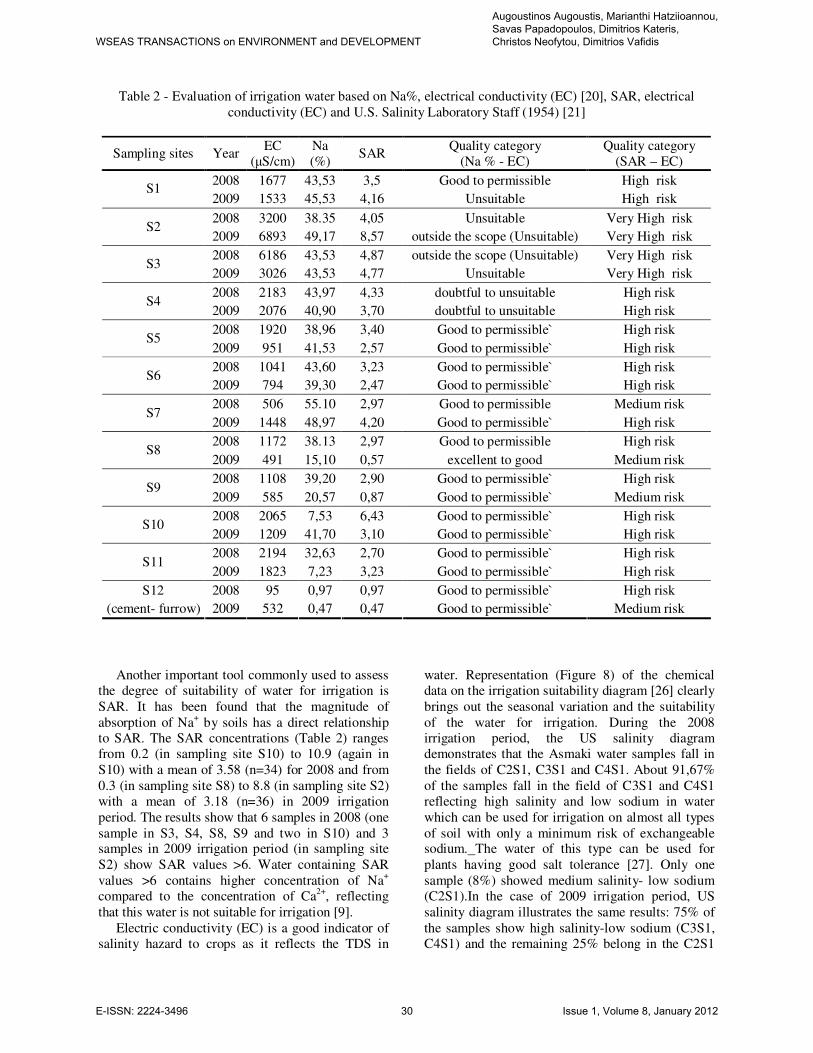
Table 2 - Evaluation of irrigation water based on Na%, electrical conductivity (EC) [20], SAR, electrical
conductivity (EC) and U.S. Salinity Laboratory Staff (1954) [21]
Sampling sites Year EC
(µS/cm)
Na
(%) SAR
Quality category
(Na % - EC)
Quality category
(SAR – EC)
2008 1677 43,53 3,5 Good to permissible High risk S1
2009 1533 45,53 4,16 Unsuitable High risk
2008 3200 38.35 4,05 Unsuitable Very High risk S2
2009 6893 49,17 8,57 outside the scope (Unsuitable) Very High risk
2008 6186 43,53 4,87 outside the scope (Unsuitable) Very High risk S3
2009 3026 43,53 4,77 Unsuitable Very High risk
2008 2183 43,97 4,33 doubtful to unsuitable High risk S4
2009 2076 40,90 3,70 doubtful to unsuitable High risk
2008 1920 38,96 3,40 Good to permissible` High risk S5
2009 951 41,53 2,57 Good to permissible` High risk
2008 1041 43,60 3,23 Good to permissible` High risk S6
2009 794 39,30 2,47 Good to permissible` High risk
2008 506 55.10 2,97 Good to permissible Medium risk S7
2009 1448 48,97 4,20 Good to permissible` High risk
2008 1172 38.13 2,97 Good to permissible High risk S8
2009 491 15,10 0,57 excellent to good Medium risk
2008 1108 39,20 2,90 Good to permissible` High risk S9
2009 585 20,57 0,87 Good to permissible` Medium risk
2008 2065 7,53 6,43 Good to permissible` High risk S10
2009 1209 41,70 3,10 Good to permissible` High risk
2008 2194 32,63 2,70 Good to permissible` High risk S11
2009 1823 7,23 3,23 Good to permissible` High risk
2008 95 0,97 0,97 Good to permissible` High risk S12
(cement- furrow) 2009 532 0,47 0,47 Good to permissible` Medium risk
Another important tool commonly used to assess
the degree of suitability of water for irrigation is
SAR. It has been found that the magnitude of
absorption of Na+ by soils has a direct relationship
to SAR. The SAR concentrations (Table 2) ranges
from 0.2 (in sampling site S10) to 10.9 (again in
S10) with a mean of 3.58 (n=34) for 2008 and from
0.3 (in sampling site S8) to 8.8 (in sampling site S2)
with a mean of 3.18 (n=36) in 2009 irrigation
period. The results show that 6 samples in 2008 (one
sample in S3, S4, S8, S9 and two in S10) and 3 samples in 2009 irrigation period (in sampling site
S2) show SAR values >6. Water containing SAR
values >6 contains higher concentration of Na+
compared to the concentration of Ca2+
, reflecting
that this water is not suitable for irrigation [9].
Electric conductivity (EC) is a good indicator of
salinity hazard to crops as it reflects the TDS in
water. Representation (Figure 8) of the chemical
data on the irrigation suitability diagram [26] clearly
brings out the seasonal variation and the suitability
of the water for irrigation. During the 2008
irrigation period, the US salinity diagram
demonstrates that the Asmaki water samples fall in
the fields of C2S1, C3S1 and C4S1. About 91,67%
of the samples fall in the field of C3S1 and C4S1
reflecting high salinity and low sodium in water
which can be used for irrigation on almost all types
of soil with only a minimum risk of exchangeable sodium. The water of this type can be used for
plants having good salt tolerance [27]. Only one
sample (8%) showed medium salinity- low sodium
(C2S1).In the case of 2009 irrigation period, US
salinity diagram illustrates the same results: 75% of
the samples show high salinity-low sodium (C3S1,
C4S1) and the remaining 25% belong in the C2S1
WSEAS TRANSACTIONS on ENVIRONMENT and DEVELOPMENT
Augoustinos Augoustis, Marianthi Hatziioannou, Savas Papadopoulos, Dimitrios Kateris, Christos Neofytou, Dimitrios Vafidis
E-ISSN: 2224-3496 30 Issue 1, Volume 8, January 2012

classification, clearly demonstrating the seasonal
variation and the adequate drainage required for
irrigation. In September 2008 there was no flow at
sites S2 and S5, so no water at all. 2008 was a year
of drought while 2009 was a rainy season, there was
more flow and more dilute, so the salinity showed
lower values. Overall, in 2009 water quality is
presented better than in 2008.
Based on the Na% irrigation water was suitable
for farming. The combination, however, Na% and
salinity has about 10% water Excellent to good,
50% Good to permissible, and 20% water Doubtful
to unsuitable and unsuitable respectively. The rates
shall be divided equally for the years 2008 and
2009. The Na% showed lower rates in 2009.
The evaluation of water quality was carried out
in order to identify its suitability for irrigation
purposes. The major factors that define the quality
of the water in the study area are agricultural
activities, anthropogenic activities and the leaching
of saline soils in the region. At sampling sites S2,
S3, S4, excessively high values of electrical
conductivity, were presented which may be due to
leaching of saline soils in the region. Increased
concentration values of Na+, ions, SAR and grade of
alkaliosis. (30.45% - 57.92%) occurred at the same
sites. High values of Cℓ -, sulfate (SO
4-). Ca
2 +, and
Mg2+ ions were also present in this field. In this part
of the ditch the above mentioned parameters classify
water as unfit for irrigation use. Berkant et al.
(2010) [28] also found similar results in the Rivers
Tigris and Euphrates. Conclusions are different for
the Pinios River [8], showing evidence acceptable
for irrigation purposes. Loukas, (2010), also found
that the SAR value for Pinios was <0.3 and only in
few cases reached up to 1.1 and the conductivity
ranged from 200 to 700 mS cm-1
, in few cases was
greater than 1000 mS cm-1
, which means that water
has a low probability on the occurrence of salinity,
if used for if it is used for irrigation purposes. If the
increased demand for irrigation water require its use
in future, in this section, leaching of soil should be
prevented along with any other method that
contributes to the phenomenon of salinization.
4 Conclusion Taking into account the Hydrochemical
classification of waters by Piper, the measured
conductivity values (EC), sodium adsorption ratio in
SAR (Sodium Absorption Ratio), the hazard of
sodium (Na%), chlorine (Cl), sulfate (SO4-), Ca
2+,
and Mg2+
ions and five basic heavy metals (Cd, Cr,
Pb, Ni and Cu), and focusing on irrigation season,
which is determined by the 5th to the 9th month of
each year, yields the following conclusions:
In regard to (EC) water and for two years was
found unsuitable for irrigation at a rate exceeding
90%, in the vicinity of Lake Karla in fact the rate of
salinity was very high. The SAR was a very large
percentage levels for irrigation. The combination,
however, salinity and SAR gave water to a large
extent unsuitable for irrigation. Based on the Na%
irrigation water was suitable for farming. The
combination, however, Na% and gives salinity
water suitable for irrigation by 50% for both years.
High values of Cℓ-, sulfate (SO4
-). Ca
2+, and
Mg2+
ions were also present in this field in most
sampling sites where the mentioned parameters
classify water as unfit for irrigation use. As regards
heavy metals (Cd, Cr, Pb, Ni and Cu), the results of
measurements showed that concentrations of heavy
metals in the sediment was significantly lower than
the limits for use of sludge in agriculture.
In terms of water quality it tends to become
prohibitive even for conventional crops, particularly
for high-quality crops especially in terms of salinity
and chlorine. Consequently, the pollution of Asmaki
is not only a cutting-edge environmental issue, but
mainly a problem of development and character, if
not only fails to support a reliable agricultural production, but rather undermines it. Consequently,
if we need to explore the future of agricultural
production, in the existence and operation of the
Asmaki we may need to revise some issues, such as:
i) The Asmaki should be left an open pipeline? ii)
Should it serve as an irrigation ditch, drainage ditch
and recipient of industrial waste all at the same
time? iii) Is it a reliable ecological function?
Acknowledgements We would like to thank Dr. Vassilia Artemiadou
from Department of Agricultural Development
Region of Thessalia and Dr Zisis Argyropoulos for
their comments on an earlier draft of this paper.
References:
[1] Dassenakis, M., Scoullos, M., Foufa, E.,
Krasakopoulou, E., Pavlidou, A., Kloukiniotou,
M. (1998) Effects of multiple source pollution
on a small Mediterranean river Applied
Geochemistry 13, 197–211.
[2] Fytianos, K., Siumka, A., Zachariadis, G.,
Beltsios, S. (2002) Assesment of the quality
characteristics of Pinios River, Greece. Water
air and soil pollution 136, 317-329.
[3] Bellos, D., Sawidis, T., Tsekos, I. (2004)
WSEAS TRANSACTIONS on ENVIRONMENT and DEVELOPMENT
Augoustinos Augoustis, Marianthi Hatziioannou, Savas Papadopoulos, Dimitrios Kateris, Christos Neofytou, Dimitrios Vafidis
E-ISSN: 2224-3496 31 Issue 1, Volume 8, January 2012

Nutrient chemistry of river Pinios (Thessalia,
Greece). Environment International 30 (1), 105
– 115.
[4] Bakopoulou, S., Kounkolos, A. (2004) Waste
management in Larissa prefecrive Greese. in
2hd International Conference on Waste
Management and the Environment, 549-558.
[5] Stamatis, G. (1999) The chemical composition
of the surface system of Peneos river,
Thessaly/Central Greece. Environmental
geology 38 (2), 126-140.
[6] Loukas, A. (2010) Surface water quantity and
quality assessment in Pinios River, Thessaly,
Greece Desalination 250, 266–273.
[7] Papadopoulou-Mourkidou E. (2002) Checklist
for Surface Water Quality in Macedonia-
Thraci-final report of results', Aristotle
University, 133.
[8] Singh, A.K. (2002) Quality assessment of
surface and subsurface water of Damodar River
basin. Indian Journal of Environmental Health
44 (1), 41-49.
[9] Venugopal, T., Giridharan, Ζ.L., Jayaprakash,
Ζ.P., Velmurugan, A. (2008) Comprehensive
Geochemical Evaluation of the Water Quality
of River Adyar, India. Bulletin of
Environmental Contamination and Toxicology 82, 211–217.
[10] Jones, B. and Turki, A. (1997)Distribution and
Speciation of Heavy Metals in Surficial
Sediments from the Tees Estuary, North-east
England, Marine pollution byletin volume 34,
768-779.
[11] Calmano, W. and Forstner, U. (1983) Chemical
extraction of heavy metals in polluted river
sediments in central Europe. The Science of the
Total Environment 28, 77-90.
[12] Eaton, D. A., Ganson, H. M. (2005) Standard
Methods for Examination Water and
Wastewater 21h Edition, 1917.
[13] EN 27888:1993, Water quality. Method for the
determination of electrical conductivity.
[14] ISO 9964-3:1993. Water quality --
Determination of sodium and potassium -- Part
3: Determination of sodium and potassium by
flame emission spectrometry.
[15] Varian, H. R. (1989). Chapter 10 Price
discrimination. Handbook of Industrial
Organization 1, 597-654.
[16] ISO 9297:1989, Water quality -- Determination
of chloride -- Silver nitrate titration with
chromate indicator (Mohr's method).
[17] ISO 9963-1:1996, Water quality.
Determination of alkalinity. Determination of
total and composite alkalinity).
[18] ASTM C999 - 05(2010) Standard Practice for
Soil Sample Preparation for the Determination
of Radionuclides.
[19] Spozito, G. L., Land, J., Chang, A. C. (1982)
Trace metal Chemistry in acid-zone Field soils
Amented with sewage studge. I. Gractionation
of Ni, Cu, Zn, Cd and Pd in solid phases.
Soil Science Society of America Journal 46,
260-264.
[20] ISO/IEC 17025:2005 General requirements for
the competence of testing and calibration
laboratories.
[21] U.S. Salinity Laboratory Staff (1954).
Diagnosis and improvement of saline and alkali
soils. Agric. Hanadb. No 60. USDA U.S.
Government Printing Office, Washington, D.C.
[22] Piper, A.M. (1994). A graphic procedure
interpretation of water analyses, Transactions
American Geophysical Union 25, 919-928.
[23] Directive 86/278/EEC of 12 June 1986 on the
protection of the environment, and in particular
of the soil, when sewage sludge is used in
agriculture.
[24] Adriano, D.C. 1986 Trace Elements in the
Terrestrial Environment. Springer- Verlag New
York Inc, 390-420.
[25] Wilcox, L.V. (1955) Classification and use of irrigation water. US Department of Agriculture,
Circ 696, Washington, DC.
[26] Richards L.A. (1954). Diagnosis and
improvement of saline alkali soils. US
Department of Agriculture, HandBook 60, pp
160.
[27] Karanth, K.R. (1989) Hydrogealogy McGraw-
Hill, New Delhi.
[28] Berkant, O., Mustafa, K. S., Fatih, E. (2010)
Quantifying long-term changes in water quality
and quantity of Euphrates and Tigris rivers,
Turkey. Environmental Monitoring and
Assessment 170 (1-4), 475-490.
WSEAS TRANSACTIONS on ENVIRONMENT and DEVELOPMENT
Augoustinos Augoustis, Marianthi Hatziioannou, Savas Papadopoulos, Dimitrios Kateris, Christos Neofytou, Dimitrios Vafidis
E-ISSN: 2224-3496 32 Issue 1, Volume 8, January 2012