assessing metacognition awareness of freshmen engineering
TRANSCRIPT
Paper ID #33631
Assessing Metacognition Awareness of Freshmen Engineering Students
Muhammad Dawood, New Mexico State University
Dr. Muhammad Dawood received his BE degree from the NED University of Engineering and Technol-ogy, Karachi, Pakistan, 1985, and his MS and Ph.D. degrees, the University of Nebraska-Lincoln, in 1998and 2001, respectively, both in electrical engineering. Dr. Dawood is involved in teaching both nationallyand internationally since 1995. At present, Dr. Dawood is an Associate Professor at the Klipsch Schoolof Electrical and Computer Engineering, New Mexico State University (NMSU), Las Cruces, New Mex-ico. Dr. Dawood’s research interests lie in the area of Engineering Education, EM Propagation throughDispersive media; radar; and Antennas; He is a member of IEEE.
Mr. Ehtesham Shareef, New Mexico State UniversityRachel Boren, New Mexico State University
Rachel Boren earned her Ph.D. in Educational Research, Statistics, and Evaluation from the University ofVirginia, where she was trained in program evaluation and research methods in education and the socialsciences. She has a diverse portfolio of training and experience with program evaluation and research ineducation and healthcare, most recently as an evaluator for the Provost’s Office at the University of Texasat El Paso and the Director of Evaluation for a 70 million-dollar National Institutes of Health funded centerbased at the University of Washington. She has experience assessing student learning and other outcomesfor K-12 and higher education populations, including both two and four- year college environments allover the country, and ensuring programs have strong evaluation plans and the necessary data for evidencebased decision-making.
Mr. Germain Degardin, New Mexico State University
Germain graduated from New Mexico State University with a Bachelor in Economics, a Master in Busi-ness and Administration, a Master in Curriculum and Instruction, and a secondary education teachinglicense. Germain currently works for the Southwest Outreach Academic Research (SOAR) Center asSenior Project Specialist evaluating and assessing the impact of educational outreach programs and othereducation-related projects.
Dr. Melissa J. Guynn, New Mexico State University
I am a cognitive psychologist with a primary research interest in human memory.
Dr. Patti Wojahn, New Mexico State University
As past Writing Program Administrator and current Interdisciplinary Studies Department Head, I haveworked closely with academic departments interested in supporting the writing, communication, and aca-demic abilities of students. For many years, I worked with Integrated Learning Communities for at-risk,entry-level engineering majors, overseeing development and use of a curriculum adapted specifically forthis group. I continue to analyze data from research studies exploring challenges and identifying at-risk characteristics among students in first-year writing courses. I also worked on an initiative focused onwriting in the disciplines as part of our university’s Higher Learning Commission 10-year re-accreditationcycle. As Borderlands Writing Project Director, I have worked with K-16 teachers to strengthen qualityin using writing in their courses to help students learn, regardless of discipline.
c©American Society for Engineering Education, 2021

Assessing Metacognition Awareness of Freshmen Engineering Students Abstract: An interdisciplinary team of researchers at a Southwest Hispanic-Serving Land-Grant University embarked on an National Science Foundation-funded study to provide workshops for first year engineering students to introduce them to metacognitive awareness learning strategies that have the potential to help their study skills, and in turn, their academic performance. To assess if these strategies were utilized and if they were helpful for students, we collected pre- and post-intervention surveys and reflective writing journals. The survey items came from the metacognitive awareness inventory (MAI) [1] to measure pre- and post-knowledge and regulation of cognition. These surveys were administered to the introductory level engineering classes at the beginning and end of their first semester in college in the required introduction to engineering course. In this paper, results pertaining to MAI scores and students’ performance on their first exam scores are presented. A shortened version of the original 52-item MAI survey, now called the Modified Metacognition Awareness Inventory (MMAI) is also statistically analyzed and discussed. Results will be useful for other educators and researchers in engineering who are looking to help students with effective learning strategies and study skills to foster their success in engineering courses and/or other subjects. Introduction Metacognition, often defined as “thinking about thinking,” is primarily about knowing, understanding, monitoring, and controlling one’s cognitive processes, leading to altered and ideally more productive behaviors [2-6]. The term “metacognition” itself is often attributed to John Falvell [7] who defined it as: “one's knowledge concerning one's own cognitive processes and products or anything related to them … Metacognition refers, among other things, to the active monitoring and consequent regulation and orchestration of these processes in relation to the cognitive objects or data which they bear, usually in the service of some concrete goal or objective.” Another early contributor, Ann Brown [8-9], classified metacognition as composed of two main parts: knowledge (K) of cognition and regulation (R) of cognition. Schraw and Dennison [1] provided further subclassifications subsumed within K and R: three dimensions for K, DK = Declarative Knowledge, CK = Conditional Knowledge, and PK = Procedural Knowledge; and five dimensions for R, P = Planning, IMS = Information Management Strategies, M = Monitoring, E = Evaluation, and DS = Debugging Strategies. Schraw and Dennison developed the metacognitive awareness inventory (MAI) to assess both metacognition knowledge and regulation. Metacognitive awareness can help students to recognize the limits of their current learning practices, and then take steps to remedy the situation; such awareness is valuable for learners at all ages [10]. Further, metacognitive strategies and practices can enhance learning and impact student achievement [11-16]. Recent studies have shown the impact of metacognition on

academic achievement in terms of grade point average increase [17] and math [18] and reading [1, 19] performance. Schraw and Dennison [1] reported a significant relationship between MAI scores and test performance of college students. Norehan [20] demonstrated that overall metacognition and students’ academic performance were correlated, and that metacognitive regulation rather than metacognitive knowledge was found to be significantly related to high school students’ academic performance. Motivation Although recent studies [2-3, 11-16, 21-23] indicate the effectiveness of metacognition in promoting student success in college science learning, it is difficult to measure metacognitive processes and the resulting impact on learning. It is of particular interest to quantify, if possible, what relationship or lack thereof exists between students’ grades and their metacognition awareness, and further, which instruments may be used to most effectively measure metacognition awareness. Methods A. Participants The participants in this study were all Fall 2016 freshmen enrolled in ENGR 100, Introduction to Engineering. The course is designed to acquaint students with various engineering majors; introduce them to the engineering-relevant aspects of various systems and devices; highlight relationships among engineering, mathematics, science, and society; and help students develop skills that will be needed later in the major and in the field. The entire cohort of engineering freshmen (~360) consisted of 12 sections, with 30 students on average per section. B. Instrument and Data Collection The instrument used to measure metacognitive awareness was the metacognitive awareness inventory (MAI) [1], a 52-item self-report survey, subdivided into two broader classes, Knowledge (K) of cognition and Regulation (R) of cognition. K and R are further divided along eight dimensions: three dimensions for K, DK = Declarative Knowledge, CK = Conditional Knowledge, and PK = Procedural Knowledge; and five dimensions for R, P = Planning, IMS = Information Management Strategies, M = Monitoring, E = Evaluation, and DS = Debugging Strategies. The MAI was administered to all 12 sections at the start of the semester just after Exam 1, about 6 weeks into the semester. A total of 268 students responded to the surveys. Each survey item
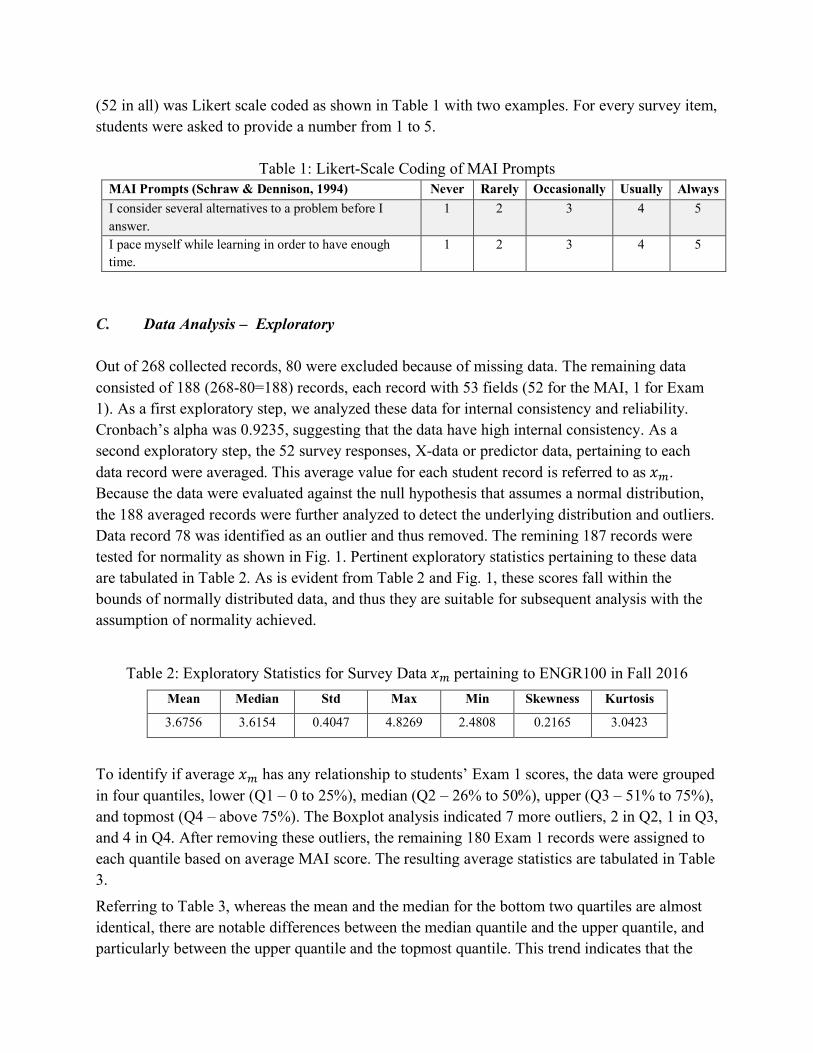
(52 in all) was Likert scale coded as shown in Table 1 with two examples. For every survey item, students were asked to provide a number from 1 to 5.
Table 1: Likert-Scale Coding of MAI Prompts MAI Prompts (Schraw & Dennison, 1994) Never Rarely Occasionally Usually Always I consider several alternatives to a problem before I answer.
1 2 3 4 5
I pace myself while learning in order to have enough time.
1 2 3 4 5
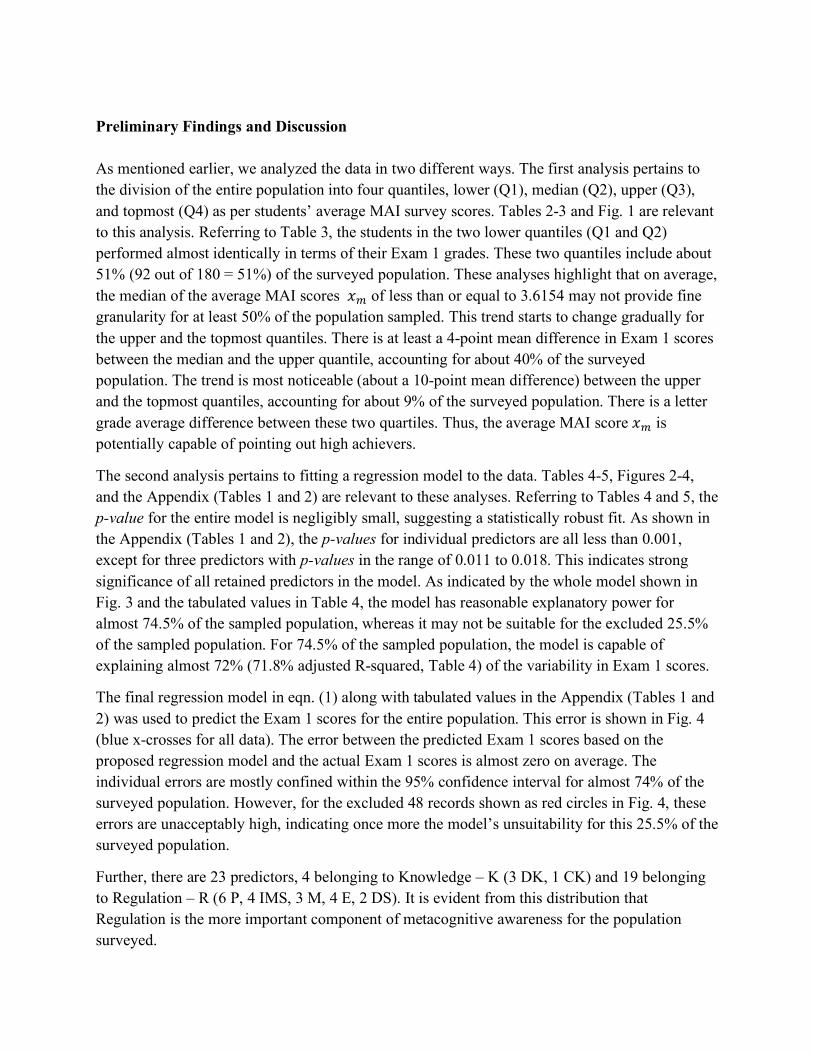
C. Data Analysis – Exploratory Out of 268 collected records, 80 were excluded because of missing data. The remaining data consisted of 188 (268-80=188) records, each record with 53 fields (52 for the MAI, 1 for Exam 1). As a first exploratory step, we analyzed these data for internal consistency and reliability. Cronbach’s alpha was 0.9235, suggesting that the data have high internal consistency. As a second exploratory step, the 52 survey responses, X-data or predictor data, pertaining to each data record were averaged. This average value for each student record is referred to as 𝑥𝑥𝑚𝑚. Because the data were evaluated against the null hypothesis that assumes a normal distribution, the 188 averaged records were further analyzed to detect the underlying distribution and outliers. Data record 78 was identified as an outlier and thus removed. The remining 187 records were tested for normality as shown in Fig. 1. Pertinent exploratory statistics pertaining to these data are tabulated in Table 2. As is evident from Table 2 and Fig. 1, these scores fall within the bounds of normally distributed data, and thus they are suitable for subsequent analysis with the assumption of normality achieved.
Table 2: Exploratory Statistics for Survey Data 𝑥𝑥𝑚𝑚 pertaining to ENGR100 in Fall 2016 Mean Median Std Max Min Skewness Kurtosis
3.6756 3.6154 0.4047 4.8269 2.4808 0.2165 3.0423
To identify if average 𝑥𝑥𝑚𝑚 has any relationship to students’ Exam 1 scores, the data were grouped in four quantiles, lower (Q1 – 0 to 25%), median (Q2 – 26% to 50%), upper (Q3 – 51% to 75%), and topmost (Q4 – above 75%). The Boxplot analysis indicated 7 more outliers, 2 in Q2, 1 in Q3, and 4 in Q4. After removing these outliers, the remaining 180 Exam 1 records were assigned to each quantile based on average MAI score. The resulting average statistics are tabulated in Table 3.
Referring to Table 3, whereas the mean and the median for the bottom two quartiles are almost identical, there are notable differences between the median quantile and the upper quantile, and particularly between the upper quantile and the topmost quantile. This trend indicates that the

MAI could be a useful tool to show a relationship between exam scores and metacognition. It was therefore worthwhile to further analyze these results to determine the impact and the relationship of individual MAI prompts (rather than in aggregate) to the Exam 1 scores.
Figure 1: Normal probability plot for average MAI survey data, averaged over 52 prompts for each student.
Table 3: Quantile statistics pertaining to average MAI and Exam 1 scores.
Quantiles
N, # of records in each quantile
Exam 1 Average MAI
𝒙𝒙𝒎𝒎 range Mean Median Std Max Min
Lower (Q1) 14 76.45 77.79 11.23 92 57 𝑥𝑥𝑚𝑚 ≤ 3.101
Median (Q2) 78 77.00 78.24 11.07 100 53 3.101 < 𝑥𝑥𝑚𝑚 ≤ 3.6154
Upper (Q3) 72 81.61 82.26 11.60 99 52 3.6154 < 𝑥𝑥𝑚𝑚 ≤ 4.1779
Topmost (Q4)
16 91.75 92.00 4.21 100 86 4.1779 < 𝑥𝑥𝑚𝑚
D. Data Analysis – Regression
The original 188 data records were further analyzed to fit a linear regression model to determine if the survey responses could serve as a predictor of exam scores. More specifically, X – data containing survey prompts 1 – 52 were used as predictor variables and Y – data containing
2 2.5 3 3.5 4 4.5 5
Average of survey data
0.005
0.05
0.1
0.25
0.5
0.75
0.9
0.95
0.995
Prob
abilit
y
Probability plot for Normal distribution

students’ Exam 1 scores were used as the predicted variable. These analyses were performed iteratively in two steps (explained below), first based on Cook’s distance (Cook, 1977) to identify outliers, and then the significance of each predictor variable based on the p-value.
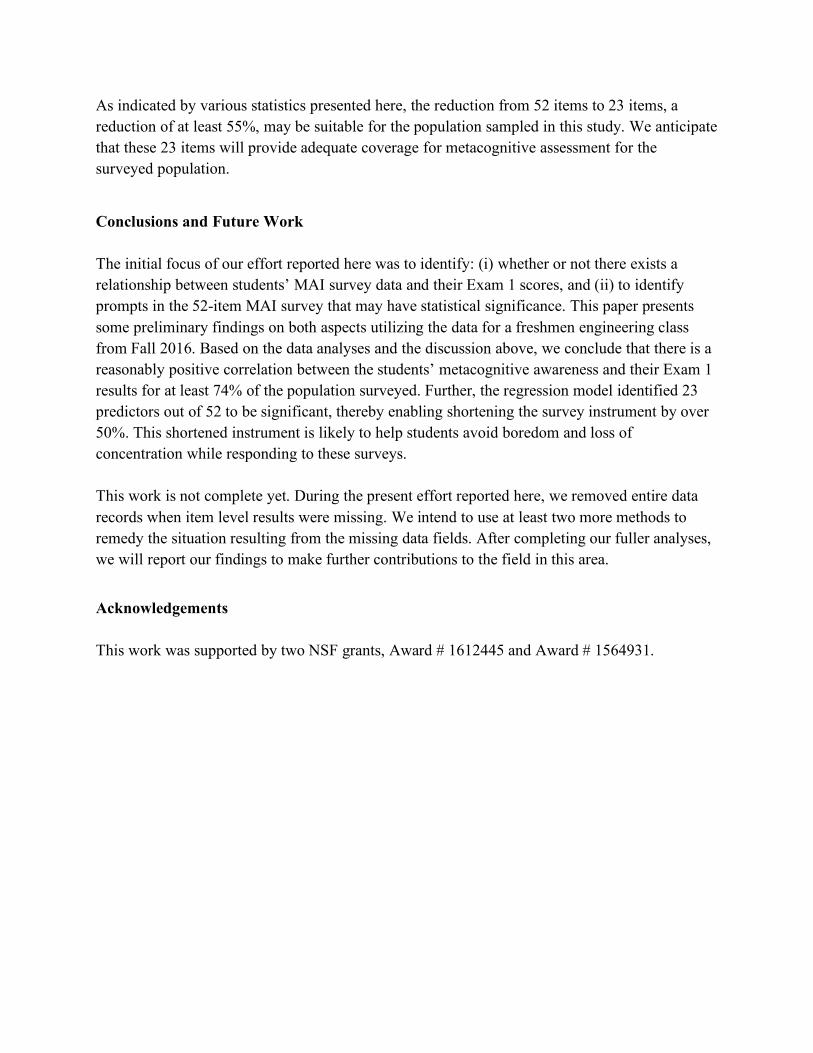
Cook’s Distance [24] is commonly used in statistics to identify the influence of outliers on regression fit. Generally, Cook’s distance larger than three times the mean Cook’s distance is considered an outlier. In the present study, this method was used iteratively to remove one data record at a time, checking and rechecking the fit statistics after each iteration. As an example, Fig. 2 shows a plot of Cook’s distance versus data record number during the first iteration. All data points above the horizontal blue dotted line in Fig. 2 are considered possible outliers. In first iteration, the highest outlier was identified and removed, Cook’s distance was recalculated, and the process was repeated. This iterative process resulted in the removal of 48 records, about 25.53% of the data.
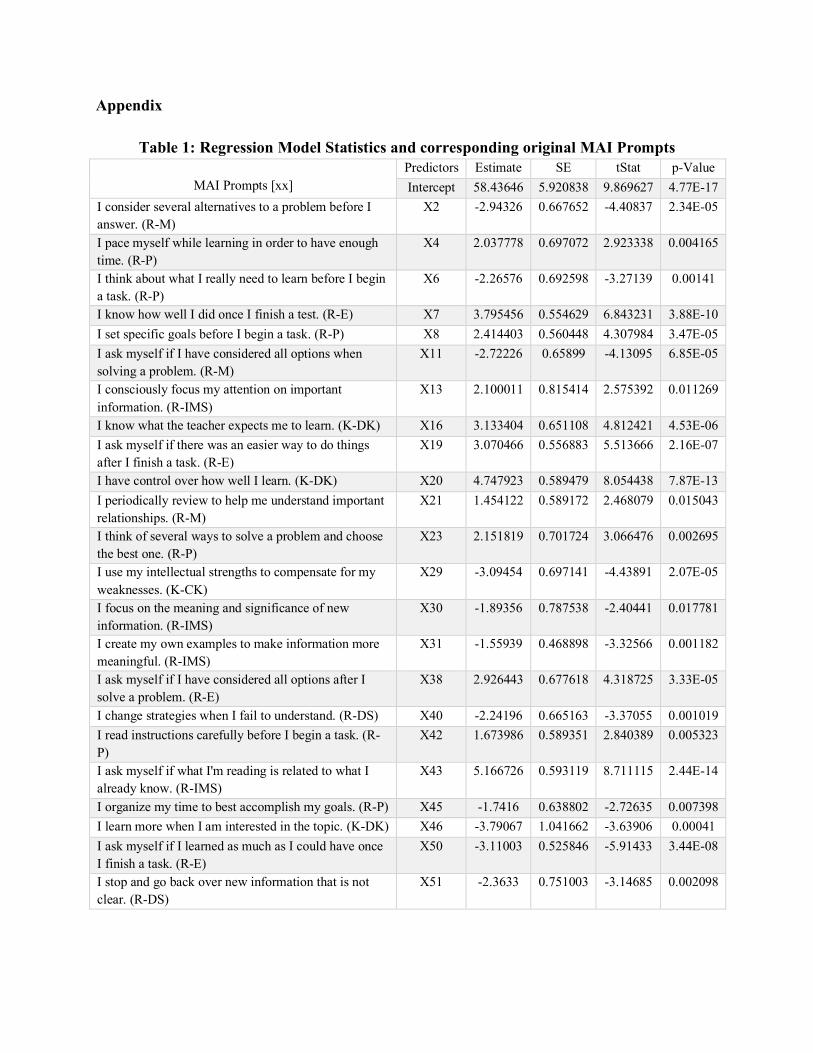
In statistical data analysis, the p-value is used to determine the significance of the results in evaluating the null hypothesis. Commonly used p-values in social science research are 0.01 and 0.05; the latter was used in the present analyses as a starting p-value. Adherence to this p-value resulted in 23 predictor variables retained out of 52, about 44% of the predictors originally included in the MAI. We now refer to this as the Modified Metacognition Awareness Inventory (MMAI). The final linear regression model for the MMAI shown in Eqn. (1) consists of 24 terms: 1 Intercept or constant term, and 23 predictors.
𝑦𝑦~𝛽𝛽0 + 𝛽𝛽1𝑥𝑥2 + 𝛽𝛽4𝑥𝑥4 + 𝛽𝛽6𝑥𝑥6 + 𝛽𝛽7𝑥𝑥7 + 𝛽𝛽8𝑥𝑥8 + 𝛽𝛽11𝑥𝑥11 + 𝛽𝛽13𝑥𝑥13 + ⋯+ 𝜖𝜖 (1)
In this equation, 𝛽𝛽𝑖𝑖, 𝑥𝑥𝑖𝑖, 𝑖𝑖 = 0, 2, 4, 6, 7, 8, 11, …., and ϵ, are, respectively, regression coefficient estimates, predictors listed in the Appendix (Tables 1 and 2), and the error term.
The p-value for the whole model is < 0 .001, indicating a robust fit. All relevant statistical parameters pertaining to this model are reported in the Appendix (Tables 1 and 2). Summary statistics and the analysis of variance (ANOVA) results are presented in Tables 4 and 5.
Table 4: Summary statistics pertaining to the whole regression model
N # of Observations
Error degrees of freedom
Root Mean Squared Error
R-squared
Adjusted R-
Squared
F-statistic vs. constant model
Model p-value
140 116 5.26 0.765 0.718 16.4 1.6624E-24

Figure 2: Cook’s Distance vs. data record number.
Table 5: ANOVA Summary statistics pertaining to the whole regression model SumSq DF MeanSq F p-Value
Total 13615 139 97.952
Model 10412 23 452.68 16.391 1.6624E-24
Residuals 3203.6 116 27.617
Further, Fig. 3 provides a visual depiction of the output of the model against the adjusted predictor variables for the entire model. It also shows the 95% confidence limits. It is clear from Fig. 3 that this model accounts for the relationship between students’ MAI scores and their Exam 1 scores. It is expected that on average, higher MAI scores predict better Exam 1 results.
Finally, we used this regression model to predict the students’ Exam 1 scores given their MAI survey scores. The error (Predicted Exam 1 – Actual Exam 1) is shown in Fig. 4, which also depicts the removed 48 records, shown with red circles. It is interesting to note that larger errors in predicting Exam 1 scores are mostly related to the removed data points.
0 50 100 150 200
Data Record Row Number
0
0.02
0.04
0.06
0.08
0.1
Coo
k's
dist
ance
Case order plot of Cook's distance

Figure 3: The Whole Regression Model linking predictors and the Exam 1 scores.
Figure 4: Error between predicted Exam 1 and actual Exam 1 for each data record. Also plotted
are errors pertaining to the removed data records (red circles) based on Cook’s distance.
0 0.5 1 1.5 2 2.5 3 3.5
Adjusted whole model
40
50
60
70
80
90
100Ad
just
ed y
Added variable plot for whole model
Adjusted data
Fit: y=13.7797*x
95% conf. bounds
0 50 100 150 200
Data Record Row Number
-40
-20
0
20
40
60
Erro
r=Pr
ed. E
xam
1-Ex
am1
All Data
Removed Data
Preliminary Findings and Discussion As mentioned earlier, we analyzed the data in two different ways. The first analysis pertains to the division of the entire population into four quantiles, lower (Q1), median (Q2), upper (Q3), and topmost (Q4) as per students’ average MAI survey scores. Tables 2-3 and Fig. 1 are relevant to this analysis. Referring to Table 3, the students in the two lower quantiles (Q1 and Q2) performed almost identically in terms of their Exam 1 grades. These two quantiles include about 51% (92 out of 180 = 51%) of the surveyed population. These analyses highlight that on average, the median of the average MAI scores 𝑥𝑥𝑚𝑚 of less than or equal to 3.6154 may not provide fine granularity for at least 50% of the population sampled. This trend starts to change gradually for the upper and the topmost quantiles. There is at least a 4-point mean difference in Exam 1 scores between the median and the upper quantile, accounting for about 40% of the surveyed population. The trend is most noticeable (about a 10-point mean difference) between the upper and the topmost quantiles, accounting for about 9% of the surveyed population. There is a letter grade average difference between these two quartiles. Thus, the average MAI score 𝑥𝑥𝑚𝑚 is potentially capable of pointing out high achievers.
The second analysis pertains to fitting a regression model to the data. Tables 4-5, Figures 2-4, and the Appendix (Tables 1 and 2) are relevant to these analyses. Referring to Tables 4 and 5, the p-value for the entire model is negligibly small, suggesting a statistically robust fit. As shown in the Appendix (Tables 1 and 2), the p-values for individual predictors are all less than 0.001, except for three predictors with p-values in the range of 0.011 to 0.018. This indicates strong significance of all retained predictors in the model. As indicated by the whole model shown in Fig. 3 and the tabulated values in Table 4, the model has reasonable explanatory power for almost 74.5% of the sampled population, whereas it may not be suitable for the excluded 25.5% of the sampled population. For 74.5% of the sampled population, the model is capable of explaining almost 72% (71.8% adjusted R-squared, Table 4) of the variability in Exam 1 scores.
The final regression model in eqn. (1) along with tabulated values in the Appendix (Tables 1 and 2) was used to predict the Exam 1 scores for the entire population. This error is shown in Fig. 4 (blue x-crosses for all data). The error between the predicted Exam 1 scores based on the proposed regression model and the actual Exam 1 scores is almost zero on average. The individual errors are mostly confined within the 95% confidence interval for almost 74% of the surveyed population. However, for the excluded 48 records shown as red circles in Fig. 4, these errors are unacceptably high, indicating once more the model’s unsuitability for this 25.5% of the surveyed population.
Further, there are 23 predictors, 4 belonging to Knowledge – K (3 DK, 1 CK) and 19 belonging to Regulation – R (6 P, 4 IMS, 3 M, 4 E, 2 DS). It is evident from this distribution that Regulation is the more important component of metacognitive awareness for the population surveyed.
As indicated by various statistics presented here, the reduction from 52 items to 23 items, a reduction of at least 55%, may be suitable for the population sampled in this study. We anticipate that these 23 items will provide adequate coverage for metacognitive assessment for the surveyed population.
Conclusions and Future Work
The initial focus of our effort reported here was to identify: (i) whether or not there exists a relationship between students’ MAI survey data and their Exam 1 scores, and (ii) to identify prompts in the 52-item MAI survey that may have statistical significance. This paper presents some preliminary findings on both aspects utilizing the data for a freshmen engineering class from Fall 2016. Based on the data analyses and the discussion above, we conclude that there is a reasonably positive correlation between the students’ metacognitive awareness and their Exam 1 results for at least 74% of the population surveyed. Further, the regression model identified 23 predictors out of 52 to be significant, thereby enabling shortening the survey instrument by over 50%. This shortened instrument is likely to help students avoid boredom and loss of concentration while responding to these surveys. This work is not complete yet. During the present effort reported here, we removed entire data records when item level results were missing. We intend to use at least two more methods to remedy the situation resulting from the missing data fields. After completing our fuller analyses, we will report our findings to make further contributions to the field in this area.
Acknowledgements This work was supported by two NSF grants, Award # 1612445 and Award # 1564931.
Appendix
Table 1: Regression Model Statistics and corresponding original MAI Prompts
MAI Prompts [xx] Predictors Estimate SE tStat p-Value Intercept 58.43646 5.920838 9.869627 4.77E-17
I consider several alternatives to a problem before I answer. (R-M)
X2 -2.94326 0.667652 -4.40837 2.34E-05
I pace myself while learning in order to have enough time. (R-P)
X4 2.037778 0.697072 2.923338 0.004165
I think about what I really need to learn before I begin a task. (R-P)
X6 -2.26576 0.692598 -3.27139 0.00141
I know how well I did once I finish a test. (R-E) X7 3.795456 0.554629 6.843231 3.88E-10 I set specific goals before I begin a task. (R-P) X8 2.414403 0.560448 4.307984 3.47E-05 I ask myself if I have considered all options when solving a problem. (R-M)
X11 -2.72226 0.65899 -4.13095 6.85E-05
I consciously focus my attention on important information. (R-IMS)
X13 2.100011 0.815414 2.575392 0.011269
I know what the teacher expects me to learn. (K-DK) X16 3.133404 0.651108 4.812421 4.53E-06 I ask myself if there was an easier way to do things after I finish a task. (R-E)
X19 3.070466 0.556883 5.513666 2.16E-07
I have control over how well I learn. (K-DK) X20 4.747923 0.589479 8.054438 7.87E-13 I periodically review to help me understand important relationships. (R-M)
X21 1.454122 0.589172 2.468079 0.015043
I think of several ways to solve a problem and choose the best one. (R-P)
X23 2.151819 0.701724 3.066476 0.002695
I use my intellectual strengths to compensate for my weaknesses. (K-CK)
X29 -3.09454 0.697141 -4.43891 2.07E-05
I focus on the meaning and significance of new information. (R-IMS)
X30 -1.89356 0.787538 -2.40441 0.017781
I create my own examples to make information more meaningful. (R-IMS)
X31 -1.55939 0.468898 -3.32566 0.001182
I ask myself if I have considered all options after I solve a problem. (R-E)
X38 2.926443 0.677618 4.318725 3.33E-05
I change strategies when I fail to understand. (R-DS) X40 -2.24196 0.665163 -3.37055 0.001019 I read instructions carefully before I begin a task. (R-P)
X42 1.673986 0.589351 2.840389 0.005323
I ask myself if what I'm reading is related to what I already know. (R-IMS)
X43 5.166726 0.593119 8.711115 2.44E-14
I organize my time to best accomplish my goals. (R-P) X45 -1.7416 0.638802 -2.72635 0.007398 I learn more when I am interested in the topic. (K-DK) X46 -3.79067 1.041662 -3.63906 0.00041 I ask myself if I learned as much as I could have once I finish a task. (R-E)
X50 -3.11003 0.525846 -5.91433 3.44E-08
I stop and go back over new information that is not clear. (R-DS)
X51 -2.3633 0.751003 -3.14685 0.002098

Appendix
Table 2: Analysis of Variance (ANOVA) Statistics for the model
Predictor SumSq DF MeanSq F p-Value X2 536.7036 1 536.7036 19.43375 2.34E-05 X4 236.013 1 236.013 8.545904 0.004165 X6 295.5582 1 295.5582 10.702 0.00141 X7 1293.303 1 1293.303 46.82982 3.88E-10 X8 512.5381 1 512.5381 18.55873 3.47E-05
X11 471.2797 1 471.2797 17.06478 6.85E-05 X13 183.1743 1 183.1743 6.632642 0.011269 X16 639.5952 1 639.5952 23.1594 4.53E-06 X19 839.5738 1 839.5738 30.40052 2.16E-07 X20 1791.63 1 1791.63 64.87397 7.87E-13 X21 168.2271 1 168.2271 6.091413 0.015043 X23 259.6912 1 259.6912 9.403278 0.002695 X29 544.165 1 544.165 19.70392 2.07E-05 X30 159.6594 1 159.6594 5.781183 0.017781 X31 305.4446 1 305.4446 11.05998 0.001182 X38 515.0969 1 515.0969 18.65138 3.33E-05 X40 313.7469 1 313.7469 11.3606 0.001019 X42 222.8094 1 222.8094 8.067808 0.005323 X43 2095.682 1 2095.682 75.88353 2.44E-14 X45 205.278 1 205.278 7.433007 0.007398 X46 365.7274 1 365.7274 13.24279 0.00041 X50 966.0268 1 966.0268 34.97931 3.44E-08 X51 273.4833 1 273.4833 9.902684 0.002098 Error 3203.583 116 27.61709
References
1. Schraw, G., and Dennison, R. S., (1994), “ Assessing Metacognitive Awareness,”
Contemporary Educational Psychology 19, pp. 460-475, 1994. 2. Cunningham Patrick, Matusovich M. Holly, Hunter N. Deirdre-Annaliese, Williams A.
Sarah, and Bhaduri Sreyoshi, 2017. “Beginning to Understand Student Indicators of Metacognition,” American Society for Engineering Education, 2017.
3. Cunningham Patrick, Matusovich M. Holly, and McCord E. Rachel, 2015. “Teaching Metacognition: Helping Engineering Students Take Ownership of Their Own Learning,” Frontiers in Education, IEEE Proceedings, October 21-24, 2015, Texas.
4. Falwell, J. H., (1979), “Metacognition and cognitive monitoring: A new area of cognitive developmental inquiry,” American Psychologist, 34, pp. 906-911, 1979.
5. Livingston, J. A., (1997), “Metacognition: An Overview,” 1997. Accessed at http://gse.buffalo.edu/fas/shuell/cep564/metacog.htm
6. Martinez, M. E., (2006), “What is Metacognition,” Phi Delta Kappan, pp. 696-699, May 2006.
7. Flavell, J. H. (1976). Metacognitive aspects of problem solving. In Resnick (Ed.), The Nature of Intelligence (pp. 231-235). Mahwah, NJ: Lawrence Erlbaum Associates.
8. Brown, A. L. (1977). Knowing when, where, and how to remember: a problem of metacognition. Technical report 47, Bolt, Beranek and Newman, Inc., Cambridge,Mass.
9. Brown, A. L. (1987). Metacognition, executive control, self-regulation, and other more mysterious mechanisms. In F. E. Weinert & R. H. Kluwe (Eds.), Metacognition, motivation, and understanding (pp. 65-116). Hillsdale, New Jersey: Lawrence Erlbaum Associates.
10. Bransford, J. D., Brown, A. L. and Cocking, R. R. (Eds) (2000). “How People Learn: Brain, Mind, Experience, and School,” National Academy Press, Washington, D.C. 2000.
11. Cook, E., Kennedy, E., and S.Y. McGuire, (2013), “Effect of Teaching Metacognitive Learning Strategies on Performance in General Chemistry Courses,” Journal of Chemical Education, 2013, 90, 961-7.
12. Credé, M., and Kuncel, N. R., (2008), “Study Habits, Skills, and Attitudes The Third Pillar Supporting Collegiate Academic Performance,” Perspectives on Psychology Science, Vol. 3, n. 6, pp. 425-453.
13. Elliott, Timothy R.; Godshall, Frank; Shrout, John R.; Witty, Thomas E. (1990), “Problem-solving appraisal, self-reported study habits, and performance of academically at-risk college students.” Journal of Counseling Psychology, Vol 37(2), Apr 1990, 203-207
14. Ogden, N., Evans, S., Thurlow, G. (2012), “Student Self-Efficacy and Attitudes Following Integration of Study Strategy Information into Course Content.” Paper 12, SoTL Commons Conference, March 7, 2012, available at <
http://digitalcommons.georgiasouthern.edu/cgi/viewcontent.cgi?article=1534&context=sotlcommons >
15. Wernersbach, Brenna M. (2011), “The Impact of Study Skills Courses on Academic Self-Efficacy”. Graduate Theses, Utah State University, Logan, Utah.
16. Zhao,N., Wardeska, G. J., McGuire,Y. S., and Cook, E.(2014) “ Metacognition: An Effective Tool to Promote Success in College Science Learning,” Journal of College Science Teaching, March/April 2014. See: http://digital.nsta.org/article/Metacognition%3A_An_Effective_Tool_to_Promote_Success_in_College_Science_Learning/1630723/196227/article.html
17. Everson, H. & Tobias, S (1998). The ability to estimate knowledge and performance in college: A metacognitive analysis. Instructional Science, 26, 65-79.
18. Maqsud, M. (1997). Effects of metacognitive skills and nonverbal ability on academic achievement of high school pupils. Educational Psychology, 17, 387-397.
19. Van Kraayenoord, C., & Schneider, W. (1999). Reading achievement, metacognition, reading self-concept and interest: A study of German students in grades 3 and 4. European Journal of Psychology of Education, 14, 305-324.
20. Norehan Metacognition and its Relationship with Students’ Academic Performance. The International Journal of Learning, 2009
21. Chen P., Omar C., Desmond C. Ong, and Brenda Gunderson, “Strategic Resource Use for Learning: A Self-Administered Intervention That Guides Self-Reflection on Effective Resource Use Enhances Academic Performance,” Psychological Science 2017, Vol. 28(6) 774–785.
22. Tanner D. Kimberly, “Promoting Student Metacognition,” CBE—Life Sciences Education, Vol. 11, 113–120, Summer 2012.
23. Williams A. Sarah, John Morelock, Holly M. Matusovich, and Patrick Cunningham, “Lessons in Transfer: Better understanding of engineering students’ metacognitive development,” Frontiers in Education, IEEE Proceedings, October 12-15, 2016.
24. Cook, R. (1977). “Detection of Influential Observations in Linear Regression. Technometrics, 19(1), 15-18, doi: 10.2307/1268249