assessing interchange effects in public transport: a case ...€¦ · world conference on transport...
TRANSCRIPT

ScienceDirect
Available online at www.sciencedirect.com
Transportation Research Procedia 25C (2017) 4023–4041
2352-1465 © 2017 The Authors. Published by Elsevier B.V.Peer-review under responsibility of WORLD CONFERENCE ON TRANSPORT RESEARCH SOCIETY.10.1016/j.trpro.2017.05.268
www.elsevier.com/locate/procedia
10.1016/j.trpro.2017.05.268
© 2017 The Authors. Published by Elsevier B.V.Peer-review under responsibility of WORLD CONFERENCE ON TRANSPORT RESEARCH SOCIETY.
2352-1465
Available online at www.sciencedirect.com
ScienceDirect Transportation Research Procedia 00 (2017) 000–000
www.elsevier.com/locate/procedia
2214-241X© 2017 The Authors. Published by Elsevier B.V. Peer-review under responsibility of WORLD CONFERENCE ON TRANSPORT RESEARCH SOCIETY.
World Conference on Transport Research - WCTR 2016 Shanghai. 10-15 July 2016
Assessing Interchange Effects in Public Transport: A Case Study of South East Queensland, Australia
Barbara T.H. Yena,*, Wen-Chun Tsengb, Corinne Mulleyc, Yu-Chiun Chioud, Matthew Burkea aUrban Research Program, Griffith University, 170 Kessels Road, Nathan, Brisbane, Queensland 4111, Australia;
bSchool of Engineering, University of South Australia; cInstitute of Transport and Logistics Studies; The University of Sydney, Australia;
dDepartment of Transportation and Logistics Management, National Chiao Tung University, Taiwan, ROC.
Abstract
Interchange or transfers for passengers in large multimodal public transport networks are more or less inevitable. A zone based fare system has the potential to ensure that there is no financial penalty for interchange. In South East Queensland (SEQ), Australia, there is a zone based fare system in place which does not penalize transfers within the same zone but does charge a full fare for an inter-zone transfer in a single journey. This research investigates the interchange effects from an analysis of passengers’ travel patterns using the smart card data from the automated fare collection system in place in SEQ. Latent class nested logit models are estimated with social demographic characteristics to measure transfer behaviour and are used to investigate the opportunity for better interchange policies to increase the network effect in the SEQ network. The results identified passengers' heterogeneous preferences towards travel alternatives with markedly different market segments. The empirical results identified passengers categorised into four segments of employees, students, wealthier people and seniors. The findings suggest that public transport network effects are most important to the employee segment with student and senior segments being more likely to choose direct alternatives over alternatives involving interchange. In order to enhance the public transport network effects, two policies to encourage transfers by passengers are investigated using simulations with the policy implications identified.. © 2017 The Authors. Published by Elsevier B.V. Peer-review under responsibility of WORLD CONFERENCE ON TRANSPORT RESEARCH SOCIETY.
Keywords:transfer fare policy, smart card data, travel behaviour, transfer behaviour; network effects
Corresponding author. Tel.: +61-7-37359247 E-mail address: [email protected]

4024 Barbara T.H. Yen et al. / Transportation Research Procedia 25C (2017) 4023–40412 Yen et al./ Transportation Research Procedia00 (2017) 000–000
1. Introduction
Transfers in large multimodal public transport networks are almost inevitable (Vuchic, 2006). One or more transfers are made for trips in many of the major cities around the world: 30% of trips in London, 80% in New York, 70% in Munich, 40% in Paris and 50% in Melbourne(NYMTC, 1998; Transport for London, 2001; GUIDE, 2000; Currie and Loader, 2010; Guoand Wilson, 2011). However, public transport users often link transfers with inconvenience. Inconvenient interchanges can disrupt passengers’ travel giving a negative travel experience and reduce public transport's competitiveness as compared to the car which provides a door-to-door service (Guo and Wilson, 2011). For example, passengers, particularly commuters and business users, select the fastest and most direct routes for their journeys (Conquest Research, 1977; Hine and Scott, 2000). An assessment of public transport transfer options and suggestions for the improvement of interchange within large multimodal networks can not only improve the quality of public transport but will enlarge its network effects.
Transfers are a fundamental issue in large multi-modal systems, but are largely overlooked in public transport
planning (Guo and Wilson, 2011). Often, a zonal based fare system is introduced to mitigate the impact on the user of having to interchange but little study has been made of how passengers behave in respect of intra-zonal versus inter-zonal transfers within an urban area where these transfers are treated differently by the fare system. This paper addresses this under developed research area to examine the current transfer behaviour and the impact of the fare system on transfer behaviour using South East Queensland (SEQ), Australia, as the case study. A zone based fare system is adopted in SEQ) such that there is no penalty for a transfer within the same zone, but a full fee is charged for an inter-zone transfer within a single journey with no separate transfer policy to encourage or integrate inter/intra-mode transfers in the zone based system. In many countries, a transfer discount policy has been shown to have positive effects on increasing public transport usage. For example, in Taiwan a different ticketing regime is in place. A discount of NT$8 (about US$0.25 which is equal to 50% discount of the transfer trip) is provided to each bus transit user transferring to or from the Taipei metro. This transfer discount has significantly raised commuters’ use of both the metro and the bus systems. A motivation of this paper is to understand transfer behaviour with a view to examining whether a specific transfer policy could increase public transport usage in SEQ.
The paper is structured as follows. The next section provides the literature context to transfer behaviour and this
is followed by a description of the SEQ transport study area together with a summary of the current fare system. The , methodology and data used in the paper are then described. The penultimate section provides the results together with interpretation. The paper concludes with a discussion and suggestions for further research.
2. The Literature context
The assessment of interchange can be considered from the operator or from the passenger perspective. There are many studies on public transport transfer from an operator's perspective, including inter-modal transfer facility design (Horowitz and Thompson, 1995; Smart et al., 2009; Hoeven et al., 2014; Harmer et al., 2014), location for transfers (Clever, 1997; Vassallo et al, 2012), unreliability (Abkowitz et al., 1987; Carey, 1994; Rietveld et al., 2001), network accessibility (Hine and Scott, 2000; Shafahi and Khani, 2010; Currie and Loader, 2010), and public transport coverage (Murray, 2001). This literature is extensive but has in common the tendency to treat passengers as if they are a homogeneous segment without consideration of the passengers' trip characteristics in evaluating transfer effects. The trip characteristics (e.g. travel time, travel cost, transfer waiting and walking time, transfer information, fare, safety and comfort, etc.) are identified to be the most significant factors for passengers in selecting travel with transfer or not (Atkins, 1990; Callaghan and Vincent, 2007; Iseki and Taylor, 2009; Chowdhury and Ceder, 2013; Chowdhury et al. 2015) and hence it would appear sensible to take these account in studying interchange behaviour. Although the travel behaviour literature has looked at the impact on users of some aspects of trip aspects such as the impact of transfer penalties on the value of time in travel (Iseki and Taylor, 2009; Guo and Wilson, 2011; Chowdhury et al., 2015). In addition Iseki and Taylor (2009) included a transfer penalty as part of the traveller’s total generalized cost of travel by classifying the most important users' factors, including transfer costs, time scheduling and transfer facility attributes (i.e. access; connection and reliability; information; amenities; and security

Barbara T.H. Yen et al. / Transportation Research Procedia 25C (2017) 4023–4041 4025 Yen et al./ Transportation Research Procedia 00 (2017) 000–000 3
and safety). Guo and Wilson (2011) extended this by including transfer costs based on both the operator's service supply and the customers' perceptions. Chowdhury and Ceder (2013) conducted a survey to understand passengers' perceptions on defined planned transfer that consist of five attributes (network integration, integrated time-transfer, integrated physical connection of transfers, information integration, and fare and ticketing integration).They found that public transport users' willingness to use transfer routes increases if a better connection between public transport modes is provided. Travel time has been found to be more significant than waiting and walking time in transfer, especially for commuters by a number of studies (Vande Walle and Steenberghen 2006; Xumei et al. 2011). This is enhanced by the results of Chowdhury et al. (2015) who explored commuters' perception of transfer using the two trip attributes of travel time and cost in New Zealand and found that for more ‘comfortable’ interchanges, users' valued these as a 25 % reduction in travel time and a 10 % reduction in travel cost. Other studies have shown that transfer waiting time is valued more highly than transfer walking time (Vande Walle and Steenberghen 2006; Iseki and Taylor 2009). The evidence is therefore mixed on transfer valuations.
In the field of travel behaviour much research has used traditional travel surveys to capture current and potential
change in travel behaviour (for example, Meyer, 1999; Garling et al., 2002; Hensher and Puckett, 2007). However, the major challenge for travel surveys is the validity of the survey (does the survey itself change travellers’ behaviour?, how do we account for differing response rates?, does different coding affect the results?) Questionnaire has been shown to make very big differences and there is always the difficult issue of whether or not participants are self-selected in the recruitment process with the consequential introduction of bias (Stopher et al., 2007). Therefore, this study utilizes an alternative data resource, public transport smart cards records, to precisely capture passengers' travel patterns. Many recent studies have used smart card data to evaluate public transport behaviour and has been shown to be a reliable source (Blythe, 2004; Bagchi and White, 2005; Trepanier and Morency, 2010), travel behaviour (Bagchi and White, 2004; Seaborn et al., 2009; Munizaga et al., 2010), operational performance (Morency et al., 2007), and fare policies (Pelletier et al., 2011). Smart cards typically provide more limited data than a questionnaire, for example it is rare to find information on trip purpose (Bagchi and White, 2004), but smart card data have the advantage of providing continuous trip data covering longer time periods thus providing the opportunity of evaluating transfer effects with accuracy.
Research has shown that travel behaviour is affected by a combination of instrumental, situational and personal
factors and that these will differ for distinct groups of people (Anable, 2005). In order to account for the heterogeneous preferences of users, market segmentation should be introduced into travel behaviour analysis (Hair et al. 1998; Wedel and Kamakara 1998; Psaraki and Abacumki, 2002; Anable 2005; Wen et al., 2012). The major purpose of market segmentation is to group different ‘types’ of people who share well defined characteristics into a manageable number of groups for analysis. In the previous research, different segment-specific parameters have been used, including trip purpose (Tsamboulas et al., 1992), a lifestyle variable (e.g. investment in car mobility) (Bekhor and Elgar, 2007), socio-economic variables (i.e. household income, type of accommodation, dependency factor, and occupation level of commuters) (Rastogi and Rao, 2009; Wen and Lai, 2010; Wen et al. 2012).
This paper will contribute to literature in two ways. First, the revealed preference data used in this paper, the
public transport smart card transaction data, has been adopted to objectively capture passengers' travel patterns. Second, a market segmentation concept has been introduced to measure the heterogeneous preferences of users (in this paper, public transport passengers). The results of this paper also suggest that the undertaking of a future case study would provide important further information into transfer behavior which is especially important for large multi-modal systems with zonal based fare systems. In summary, the contribution comes from the way in which this paper uses the objective measure of transaction data, as identified by the automated smart card fare collection in SEQ to explore the transfer effects from the passengers' travel patterns with a market segmentation scheme that incorporates parameters to differentiate between distinct groups of users. This allows the estimation of transfer effects for passengers and the subsequent use of these estimation results to investigate fare policy around transfer effects by simulating potential alternative interchange fare policies.

4026 Barbara T.H. Yen et al. / Transportation Research Procedia 25C (2017) 4023–40414 Yen et al./ Transportation Research Procedia00 (2017) 000–000
3. The SEQ transport system
As this paper considers the transfer behaviour of public transport users in SEQ, this section presents a brief outline of the current public transport modes. The SEQ region of Australia, which includes Brisbane, the Sunshine Coast and the Gold Coast, has merged into a 200 kilometre long city (Spearritt, 2009). SEQ's public transport system is made up of a network of trains, trams, buses and ferries. Figure 1 shows the public transport service network in SEQ as of January 2015.
Figure 1 SEQ's public transport network (Source: Australian Rail Maps)

Barbara T.H. Yen et al. / Transportation Research Procedia 25C (2017) 4023–4041 4027 Yen et al./ Transportation Research Procedia 00 (2017) 000–000 5
Train SEQ's rail network of over 200 kilometres connects to the Sunshine Coast and Gold Coast to Brisbane. Operated by a division of the Queensland Government, the CityRail network has relatively low ridership if considered on a world scale. The CityRail network has 11 lines and 214, mostly 3-car, vehicles in use (Soltani et al., 2015). Service frequencies are 30 minutes off-peak in the outer suburbs and 15minutes (or less) in the inner suburbs. The train network is entirely radial with eight lines connecting in the central business district (CBD). Though there has been fare-free transfers on the whole public transport network since 2004, very few stations are serviced by feeder buses, especially in the Brisbane City Council jurisdiction where its buses mostly head towards the busways and then onwards to the CBD. Bus The bus network is radial and CBD-oriented. Many of the bus services run on busways that are recognised as being one of the most successful Bus Rapid Transit (BRT) systems in the developed world. Brisbane's BRT systems deliver fast, comfortable, and cost-effective urban mobility through the provision of segregated right of-way infrastructure, rapid and frequent operations, and excellence in marketing and customer service (Golotta and Hensher, 2008). Many of the bus services run on dedicated busways that Hoffman (2008) described as ‘Quick-ways’ as they are fully segregated from other traffic, with average stop spacings of more than one kilometer. Ferry The ferry network is a linear passenger ferry system that provides relatively frequent services along rivers or parallel to shorelines, servicing multiple stops (Thompson et al., 2006; Tsai et al., 2014). The Brisbane CityCat, CityHopper and CityFerries combine to form a ferry system with 24 terminals. Tram The tram network, the Gold Coast light rail, only services a single 13-km route with 16 stations and began operation on 20 July 2014. The recent opening of this service means the data and the modelling in the following analysis does not include tram passengers.
TransLink, established in 2004, is a Queensland Government agency which manages public transport services covering Brisbane and SEQ. With the exception of taxis, public transport fares are integrated across all public transport modes in the SEQ region. In 2008, a smart card ticketing system branded the ‘Go-card was introduced, which allowed passengers to travel on all TransLink bus, train, ferry and tram services (Yen et al. 2015).
The Go-card system is a region-wide, zone-based scheme in which passengers use one card for all public transport modes. Figure 2 shows the TransLink South East Queensland service areas and fare zones. Fares are automatically collected based on the zones travelled. All Go-card passengers must tag on when boarding and tag off when alighting from buses or ferries, or when entering and leaving a train or tram station. Go-card readers are installed on-board or on platforms. As such, the Go-card provides origin and destination data records for each transaction (Soltani et al., 2015; Yen et al., 2015). Four types of Go-cards are in use: adult, child, senior and concession—the latter three types have a 50% fare reduction of the full adult fare.

4028 Barbara T.H. Yen et al. / Transportation Research Procedia 25C (2017) 4023–40416 Yen et al./ Transportation Research Procedia00 (2017) 000–000
Figure 2 TransLink South East Queensland service areas and zones (Source: TransLink)
4. Data acquisition and methodology
4.1. Data
In order to explore public transport interchange behaviour, this study examines differences in behaviour by categorizing passengers into different groups with specific user characteristics, i.e. young passengers (e.g. students), employed people (e.g. workers), high-income group, etc. A one month cross-sectional slice of Go-card (smart card)
Barbara T.H. Yen et al. / Transportation Research Procedia 25C (2017) 4023–4041 4029 Yen et al./ Transportation Research Procedia 00 (2017) 000–000 7
fare transaction data is used in combination with a set of neighbourhood variables derived from 2011 census data and used to capture social-demographic characteristics. The one month (March 2013)1 cross-sectional slice of Go-card transaction was provided by TransLink and has approximately 15 million data points. After cleaning the data, 15.7% of data records were removed due to inconsistent, missing or unusable data (i.e. trips where the passenger failed to tag-off their Go-cards or tagged on and off quickly at the same place) and then due to software constraints, the sample was reduced to a total of 25,842 trip based samples 2 randomly drawn from user ID. The trip characteristics are also derived from the Go-card data, including the travel zone number(s); travel cost3; travel time; whether a week day trip; peak hour trip4; 9 journey trip or commuter trip. In SEQ, a volume rebates policy is adopted so that the network is free to passengers who travel for more than 9 paid journey in a 7 day period, from Monday to Sunday, regardless of zones travelled. Among these variables, the 9 journey trip is used to identify the free trip within each travel journey. Commuter trips are identified using the Go-card ID base with those making a minimum of 24 trips per month are being viewed as commuters with all their trips being treated as commuter trips.
To capture the feeder bus service to train stations and the level of service quality associated with this service, data
is captured using Geographic Information System (GIS). A feeder bus station density within a 2 km buffer of the train stations is calculated and used as a proxy for the feeder bus service level on the basis that higher densities of feeder bus stops will be associated with a better frequency of feeder services.
Finally, in order to capture the passengers’ social demographic characteristics, a set of neighbourhood variables is
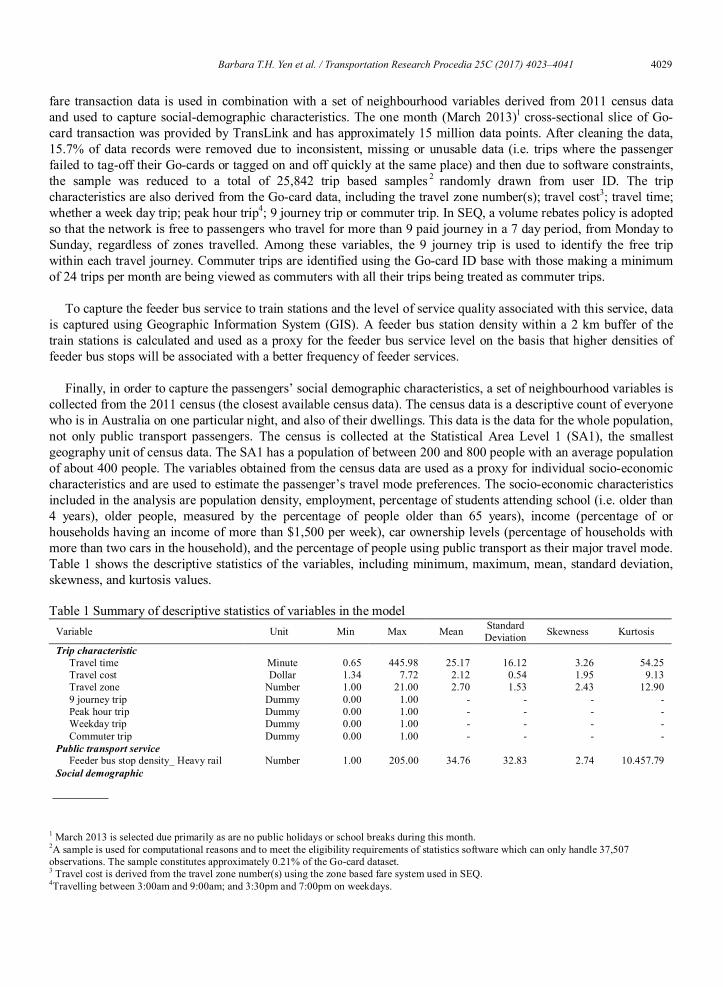
collected from the 2011 census (the closest available census data). The census data is a descriptive count of everyone who is in Australia on one particular night, and also of their dwellings. This data is the data for the whole population, not only public transport passengers. The census is collected at the Statistical Area Level 1 (SA1), the smallest geography unit of census data. The SA1 has a population of between 200 and 800 people with an average population of about 400 people. The variables obtained from the census data are used as a proxy for individual socio-economic characteristics and are used to estimate the passenger’s travel mode preferences. The socio-economic characteristics included in the analysis are population density, employment, percentage of students attending school (i.e. older than 4 years), older people, measured by the percentage of people older than 65 years), income (percentage of or households having an income of more than $1,500 per week), car ownership levels (percentage of households with more than two cars in the household), and the percentage of people using public transport as their major travel mode. Table 1 shows the descriptive statistics of the variables, including minimum, maximum, mean, standard deviation, skewness, and kurtosis values.
Table 1 Summary of descriptive statistics of variables in the model
Variable Unit Min Max Mean Standard Deviation Skewness Kurtosis
Trip characteristic Travel time Minute 0.65 445.98 25.17 16.12 3.26 54.25 Travel cost Dollar 1.34 7.72 2.12 0.54 1.95 9.13 Travel zone Number 1.00 21.00 2.70 1.53 2.43 12.90 9 journey trip Dummy 0.00 1.00 - - - - Peak hour trip Dummy 0.00 1.00 - - - - Weekday trip Dummy 0.00 1.00 - - - - Commuter trip Dummy 0.00 1.00 - - - -
Public transport service Feeder bus stop density_ Heavy rail Number 1.00 205.00 34.76 32.83 2.74 10.457.79
Social demographic
1 March 2013 is selected due primarily as are no public holidays or school breaks during this month. 2A sample is used for computational reasons and to meet the eligibility requirements of statistics software which can only handle 37,507 observations. The sample constitutes approximately 0.21% of the Go-card dataset. 3 Travel cost is derived from the travel zone number(s) using the zone based fare system used in SEQ. 4Travelling between 3:00am and 9:00am; and 3:30pm and 7:00pm on weekdays.
4030 Barbara T.H. Yen et al. / Transportation Research Procedia 25C (2017) 4023–40418 Yen et al./ Transportation Research Procedia00 (2017) 000–000
Population density People/10m2 0.02 398.50 23.17 23.99 9.79 134.43 Age (>65 years old) %* 0.00 99.00 9.34 0.09 2.94 16.59 Students (>4 years old) %* 0.00 94.00 25.09 0.12 3.13 13.49 Employment %* 0.90 100.00 58.69 12.37 -0.60 0.43 Public transport as main travel mode %* 0.00 50.00 18.90 0.09 0.38 0.05 Car number (more than 2) %* 0.00 100.00 30.88 0.21 0.52 -0.76 High income (>1,500/pw) %* 0.00 47.00 15.88 0.08 0.43 -0.10
*The percentage here is calculated by SA1 unit. For example, percentage of employments equals to all dependent numbers divided by the total population for each SA1.
Table 1 shows travel time, travel cost and travel zone are highly variable and this is because SEQ is a 200 km
linear city. The spatial characteristics of trips are captured by the travel zone, that is, the zone number(s) travelled by each cardholder. Travel time is used to present the temporal characteristics and it is expected to have a negative impact on utility with longer journeys yielding less utility for the passenger. A number of trip characteristics are used to facilitate policy discussions, e.g. peak hour trip, weekday trip and commuter trip, the 9 journey trip (capturing the effects of the volume rebate policy with an expected positive association with utilities). In terms of the public transport service variables, the density of feeder bus services to train stations is expected to have a positive impact on utility as well since it makes travel by train easier. The social demographic variables are included since they are expected to drive market segmentation.
4.2. Travel alternative choice model
As described above, the literature identifies that different travel behaviour can be associated with combinations of instrumental, situational and personal factors which differ for distinct groups of people (Anable 2005). However, in this case we cannot observe the underlying factors that might segment the market and so latent class models which allow subgroups to be identified on the basis of their behaviour are fundamental to this modelling. More specifically, a latent class nested logit (NL) model is used here as the constructed travel alternative choices can consider the effects of variable and alternatives homogeneity that cannot be captured by the simpler latent class MNL modelling. As Figure 3 shows, the standard MNL model assumes the same preference structure across individuals in addition to the independence of irrelevant alternatives (iia) and independent and identically distributed random variables assumptions. In the case examined here this standard MNL model would result in biased estimates and incorrect predictions if the suspected heterogeneous preference exist (Wen and Lai, 2010). Figure 3 shows the difference between an MNL and a nested approach. The latent class nested logit (NL) modelling used in this study is an extension of the latent class multinomial logit (MNL) model and defines the choice probability using a standard NL formulation (McFadden, 1978) which allows for the presence of individual preference heterogeneity. It is the individual preference heterogeneity that, according to the literature, is expected in travel behaviour that makes this approach a sound methodology.

Barbara T.H. Yen et al. / Transportation Research Procedia 25C (2017) 4023–4041 4031 Yen et al./ Transportation Research Procedia 00 (2017) 000–000 9
Figure 3 The evolution from the MNL to the latent class MNL and NL approach
There are six travel alternatives in this study, including journeys using a bus only; train only; ferry only; bus to bus; bus to train5; and bus to ferry. The latent class NL model groups travel alternatives into a nest, with inclusive value parameters that capture flexible substitution patterns. The latent class NL model uses the utility function as a starting point, assuming that decision-makers (passengers in this case) make rational choices to maximise utility by considering all travel alternatives and selecting the one that provides the greatest utility. The latent class NL model in this study divides the decision-makers’ preferences into a finite number of segments with homogeneity among the passengers’ preferences within each segment. The probability that a passenger chooses various travel alternatives can be divided into two parts: the probability of choosing the travel alternatives in a given segment and the probability that a passenger belongs to a given segment. Both are expressed by the formula for probability obtained using a logit model. The probability function of a passenger belonging to a given segment is assumed to be related to the passenger’s characteristics with the utility function of passenger i belonging to segment s for any travel mode mbeing expressed as:
simimssim εXβU (1)
where imX is a vector of passenger attributes, sβ is a vector of unknown segment-specific parameters, and simε is the error term that represents the random part of the utility.
If there are m travel modes then the probability that passenger i in segment s chooses travel alternative m is
expressed by the following equation:
m mis
imsi Xβexp
)Xβexp(smP (2)
5A trip with a transfer, including bus to bus, bus to train and bus to ferry trip, is measured without consideration of the link sequence. For example, if a journey consists of a bus transfer to a train and then a transfer to a bus, there are three trips within this journey, bus to train trip, train to train trip, and train to bus trip. All these trips are viewed as bus to train trips because the focus in this study is to measure transfer effects only.

4032 Barbara T.H. Yen et al. / Transportation Research Procedia 25C (2017) 4023–404110 Yen et al./ Transportation Research Procedia00 (2017) 000–000
where s is the parameter to be estimated in segment s and imX is the attribute of passenger i towards travel alternative m .
Kamakura et al (1996) identifies for segment s , the probability of passenger i choosing travel alternative m in nest n is ),( snmPi , and )( snPi represents the probability that passenger i is in nest n .
snNm
snmis
snims
i )λXβexp()λXβexp(,s)n(mP (3)
)Γexp(λ)Γexp(λs)(nP s
ninsn
sin
sn
t
(4)
In each nest, n, there are snN travel modes. The analysis provides a dissimilarity parameter for each nest n as s
n , and logsum variable for each nest within each segment s which is used for assessing goodness of fit and interpretation. The dissimilarity parameter captures the similarities between pairs of alternatives in the nest. Similar to the standard NL model, if the condition 0 < s
n for all s and n holds, the model is consistent with utility maximization for all possible values of the explanatory variables and will not yield counterintuitive results (Ortúzar and Willumsen, 2001; Train, 2003). The latent class MNL model is a restriction of the latent class NL model: when all the dissimilarity parameters in all segments are equal to one in the latent class NL model, the latent class NL model collapses to the latent class MNL model. Moreover, the standard NL model can be regarded as a special case in which the latent class NL has only one segment.
One of the benefits of latent class modelling is that it allows the determination of the number of segments. In this
case here the number of segments are determined through the use of the commonly used performance indicator, such as the Bayesian information criterion (BIC) and the constrained Akaike information criterion (AIC). The analysis determines the number of segments by starting with two segments and adding one at a time until the additional segment no longer significantly improves the model’s goodness-of-fit and this then reflects the optimal number of market segments. In practice, as the number of segments grow, it is less easy to improve the goodness of fit (Kemperman and Timmermans, 2009). The calculation methods used to identify the number of segments is as follows:
2K2LLAIC )( (5)
Kln(O)2LLBIC )( (6)
Where )(LL is the logarithmic likelihood function value, K is the number of parameters and O is the number of samples. Lower values of AIC and BIC signal better fit.
5. Results
5.1. Model formulation
As identified above, there are 6 different travel alternatives in this study. The investigation centred on three models, constructed as a latent class MNL model and two alternative latent class NL models, respectively as shown schematically in Figure 4 which is the result of investigating a number of different nested structures which can be behaviourally interpreted. The MNL model is inappropriate since it requires the independence of error terms which is likely to be violated because of the way in which it is expected that social demographic characteristics and personal preferences might influence individual's alternative selection. The latent class NL model 1 separates alternatives by modes irrespective as to whether interchange is required in contrast to the latent class model 2 which consists of one nest with direct travel alternatives, with alternatives requiring interchanges being included in another nest. After analysis, the results indicate that Model 2 provides the best model fit with the rejection of the alternative models at the 5% significance level, based on the likelihood ratio tests.

Barbara T.H. Yen et al. / Transportation Research Procedia 25C (2017) 4023–4041 4033 Yen et al./ Transportation Research Procedia 00 (2017) 000–000 11
Figure 4 Model structure for preferred choice model
5.2. Model results analysis
Revealed preference data, as described above, are used to analyse passengers’ preferences for travel alternative choices. For the six travel alternatives in this study, the model includes five model-specific constants with the bus-ferry passengers travel alternative being excluded as the reference alternative because of their low percentage of market share (1%). Travel characteristic variables including travel time, travel cost, travel zone, weekday trip, peak hour trip, and commuter trip are specified as generic variables. The variables ‘9 journey trip’ and ‘feeder bus density’ are considered as alternative specific variables which are then able to influence each travel alternative differently. The proper number of segments was assessed by BIC and AIC. Table 2 shows the results of the modelling for the number of segments. As discussed above, this is a sequential process in which an additional segment is added until the addition of a further segment does not add sufficiently to goodness of fit. Table 2 shows the four segment model is the preferred model as this has the maximum number of parameters, the largest non-adjusted and adjusted log likelihood ratios and the lowest BIC and AIC values. In addition it was the only model in which the parameter coefficients were in line with expectations. There, we adopted for-segment solutions for the proposed latent class NL model 2. Table 2 Goodness-of-fit measure of latent class NL models
Segment number(s)
Number of parameters Final log-likelihood Likelihood ratio Adjusted likelihood ratio BIC AIC
1 26 -6839.99 0.073 0.066 13679 13731
2 44 -5733.41 0.212 0.2 11466 11554
3 70 -5238.29 0.282 0.273 10476 10616
4 96 -4732.84 0.338 0.332 10441 9657
Table 3 presents the results of the preferred four-segment latent class NL model, including the socioeconomic characteristics (population density, age and income, etc) that drive the segment membership. The goodness of fit measures suggest the model fits the data well, according to the higher value of adjusted likelihood ratio index (0.332). Passengers in segment 1 and segment 2 account for 74% of the sample. These segments are relatively large and have considerable potential for the public transport market. The advantage of this latent class model relative to the simple multinomial logit model is that it allows for identification of distinct groups of passengers' differences in travel mode preferences. In the set of trip characteristic variables, the parameters for commuter trip and the 9 journey trip (for all alternatives) in segment 1 are larger than those in segment 2. In contrast, the passengers in segment 2 were more sensitive to the variable of travel zone as shown by the larger negative parameter..

4034 Barbara T.H. Yen et al. / Transportation Research Procedia 25C (2017) 4023–404112 Yen et al./ Transportation Research Procedia00 (2017) 000–000
Table 3 Estimation results for four-segment latent class NL model 2 with individual characteristics in membership functions
Segment 1 Segment 2 Segment 3 Segment 4 Constant
Bus 1.993(6.27)*** 2.773(2.05)** 2.314(3.66)*** 1.502(1.93)** Train 2.151(2.99)** 2.465(3.13)*** 1.172(1.70)* 1.209(4.39)*** Ferry 0.536(1.76)* 0.371(1.64)* 0.833(1.72)* 0.283(1.66)* Bus-bus 2.250(1.98)** 1.821(2.22)** 2.207(2.01)** 0.322(1.99)** Bus-train 2.971(1.83)* 1.579(1.69)* 1.689(1.84)* 0.304(2.01)**
Trip characteristic variables Travel time -1.364(-3.44)*** -1.298(-3.02)*** -1.883(-2.11)** -0.932(-1.97)** Travel cost -1.698(-1.96)** -1.002(-1.82)* -0.922(-2.08)** -1.030(-1.66)* Travel zone -1.281(-4.19)*** -2.207(-3.81)*** -1.127(-1.78)* -1.318(-2.01)** Weekday trip 1.095(1.69)* 1.687(2.42)** 0.822(1.92)* 0.533(3.84)*** Peak hour trip 1.923(6.99)*** 2.162(3.98)*** 1.281(2.03)** -1.233(-1.99)** Commuter trip 1.667(1.67)* 1.222(1.72)** 0.739(1.81)* 0.112(2.16)** 9 journey trip_ bus 0.732(1.99)** 0.541(1.64)* 0.272(1.97)** 0.222(1.72)* 9 journey trip_ train 1.032(1.72)* 0.839(2.06)** 0.296(1.72)* 0.372(1.66)* 9 journey trip_ bus-bus 0.082(1.66)* 0.069(1.77)* 0.076(1.88)* 0.001(1.65)* 9 journey trip_ bus-train 0.048(1.92)* 0.017(1.96)** 0.009(1.69)* 0.003(1.70)*
Service variables Feeder bus density_ bus-train 3.220(6.29)*** 0.992(1.86)* 1.298(2.14)** 0.394(1.65)*
1j4( t-value vs.1) Direct nest 0.473(7.52)*** 0.451(7.28)*** 0.272(1.98)** 0.528(3.17)*** Transfer nest 0.345(3.26)*** 0.451(2.54)** 0.638(1.77)* 0.267(3.03)***
Membership function Constant 0.289(1.77)* 0.187(2.23)** 0.093(1.82)* Population density 0.992(1.66)* 0.983(1.71)* 0.533(1.92)* Age (>65 years) -1.382(-1.69)* -1.922(-2.00)** -1.287(-1.86)* Student (>4 years) 1.842(1.90)* 2.334(1.82)* 1.111(1.93)* Employment 2.678(2.31)** 1.992(1.99)** 1.867(2.11)** Main public transport 1.928(4.88)*** 1.673(2.22)** -1.368(-2.52)*** Car number (more than 2) -0.287(-2.24)** -0.773(-3.69)*** 3.921(1.74)* High income(>$1,500/pw) -0.382(-1.82)* -0.672(-2.19)** 3.886(1.98)**
Segment size 39% 35% 17% 9% Number of parameters 96 Final log-likelihood -4732.837 Likelihood ratio 0.338 Adjusted likelihood ratio 0.332 BIC 10441.011 AIC 9657.674
Note: * indicates 0.1 level of significance; ** indicates 0.05 level of significance; *** indicates 0.01 level of significance. In general, most variables show the expected sign (i.e. negative impact on utilities for travel time, travel cost and travel zone) at a significance level of 90% or higher which suggests that passengers' utility is expected to be higher with lower travel time, travel cost and/or travel zone. The other generic variables, including weekday trip, peak hour trip and commuter trip have a positive effect on the passengers’ travel utility but the peak hour trip in segment 4 has a negative impact on the passengers in this segment. Taken together, this suggests that most passengers' utility is expected to increase if passengers are high frequency users who travel during peak period on weekdays. The remaining explanatory variables are alternative specific to the alternatives. The ‘9 journey trip’ has different and significant positive coefficients for each alternative across the different segments. The results show this variable has a larger impact on passengers who select a direct travel alternative (i.e. bus and/or train only trip). This suggests that passengers who are eligible for a 9 journey discount tend to travel without transfers. In terms of the public transport service variable, the public transport service variable assured as feeder bus stop density does have the expected impact with a significant and positive effect on bus-train passengers. This variable also has the greatest impact on passengers in segment 1: the characteristics of the segmentation analysis is considered next. For the segmentation analysis, a set of the socioeconomic characteristics is used to categorize passengers into four segments. The possible segments groups are defined by comparing each segment's socioeconomic characteristics to the base segment.
Barbara T.H. Yen et al. / Transportation Research Procedia 25C (2017) 4023–4041 4035 Yen et al./ Transportation Research Procedia 00 (2017) 000–000 13
Segment 4 is selected as the base segment because it has the smallest membership size. A detailed passenger segmentation analysis is introduced in next section (section 5.3).
5.3. Passenger segmentation analysis
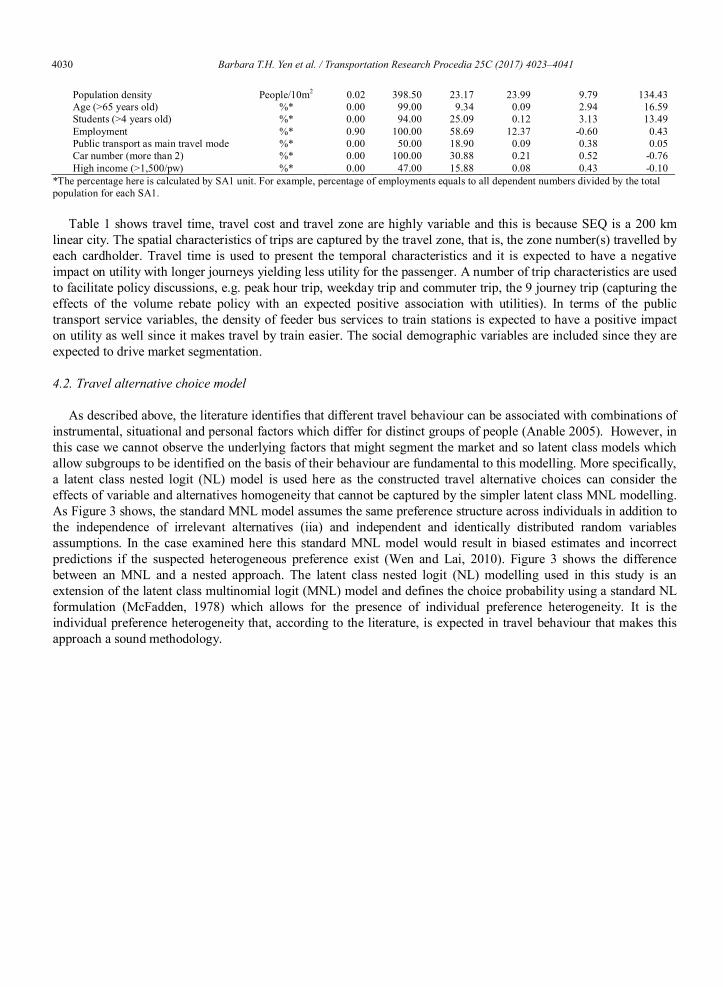
Table 3 includes the estimation results for the preferred four-segment NL model, including showing the individual characteristics in the segment membership function. Segment 4 is chosen as the base because of its small membership size (9% only) and where all of the membership coefficients are normalized to zero. The estimates for all other segments are interpreted relative to segment 4. Segment 1 is the largest segment with 39% of passengers. Passengers in segment 1 are more sensitive to travel costs as compared with passengers in the other segments; the larger alternative coefficient (alternative specific constants) suggests that, relatively speaking, they prefer travel with an interchange, i.e. inter-transfer (i.e. bus-train), and/or intra-transfer (bus-bus). The individual profile of segment 1 members suggest workers with fixed times of work because their utility increases if they are commuters and travel in the peak periods on weekdays. Segment 1 passengers are younger than the older reference membership of segment 4 (age of over 65) and have the highest coefficient of employment rate. Members of segment 1 tend to reside in the regions with the highest population density and show the strongest preference, relative to segment 4 for the use of public transport as a mode of travel. Segment 1 members show the highest sensitivity to feeder bus as there is a strong preference for travel alternatives using the train (both direct and transfer trips). The passengers in segment 2 (35% of the total passengers) prefer to commute using a direct service, especially a direct bus service. Segment 2 passengers are very sensitive to travel distance (travel zone) but not to travel time. The results provide evidence that most passengers in this segment might be low-income students who do not own cars, because this segment has the lowest coefficient of older people (age < 65 years old), lowest car ownership, the most negative income and the highest coefficient of student residents, across the four segments. Segment 3 consists of time-sensitive passengers who prefer to use the bus whether or not a transfer is needed. In this segment, most individuals have higher incomes and own more than two cars. The resident regions for segment 3 are low population density regions with lowest percentage of students relative to segment 4. These residents tend not to use public transport as their main transport mode. Passengers in segment 3 are relatively wealthy compared to all other segments. Segment 4 comprises the smallest percentage of passengers (9%) who live in the low population density areas. Segment 4 passengers are sensitive to travel costs and prefer to use a direct service, especially a direct bus service. The passengers in this segment might be elderly residents who tend to travel in off-peak periods. In other words, passengers in segment 4 tend to be senior passengers. Table 4 summarises the characteristics of each segment and labels the possible groups as employees, students, wealthier people and seniors. Compared to all other segments, segment 1 has the highest employment rate, thus segment 1 has been identified as the "employee" group. This study uses the most outstanding characteristic(s) in socio economic characteristics to identify possible groups for each segment. The same rule applies for other segments. Therefore, segments 2/3/4 areidentified as "student"/"wealthier people"/"senior" because of the high percentage of students attending school/high income and high car ownership level/elderly people. Table 4 Segment characteristics and classification Segment Segment 1 Segment 2 Segment 3 Segment 4 Classification Employees Students Wealthier people Seniors
Characteristics
Population density HH H M L Elderly people (%) M L H HH Students (%) H HH M L Employment (%) HH H M L Main public transport (%) HH H L M Car number M L HH H High income M L HH H
* HH/H/M/L indicates the highest/high/medium/low level.
4036 Barbara T.H. Yen et al. / Transportation Research Procedia 25C (2017) 4023–404114 Yen et al./ Transportation Research Procedia00 (2017) 000–000
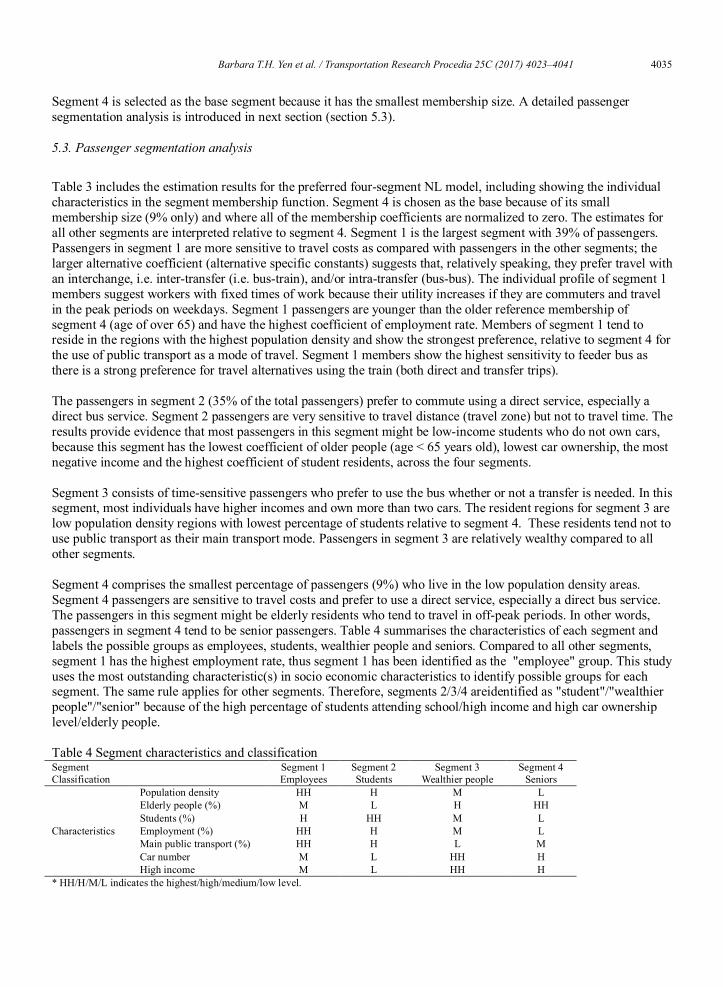
Table 5 lists the alternative share of each segment. This reflects the discussion above with the employee segment preferring interchange alternatives (more than 50%), the student and senior segments preferring direct travel alternatives and the wealthier people segment showing more equal preference for both direct and trips requiring a transfer. Employee segment, in particular, prefer inter mode transfer (e.g., bus to train or vice versa). Table 5 Alternative share (%) of each segment Segment Segment size (%)
Direct trip Transfer requirement Bus Train Ferry Bus-Bus Bus-Train Bus-Ferry
Employees 39 20 21 5 22 30 2 Students 35 30 27 4 20 17 2 Wealthy people 17 28 14 10 26 19 3 Seniors 9 41 33 7 8 8 3 Average - 30 24 7 19 19 3
6. Transfer policies
In SEQ, this zone based system omits the impact of interchange on the network effect. Currently, a quarter of the trips identified in the Go-card data are transfer trips. An early study (Thompson, 1977) analysed the benefits of the network effect in a public transport system and concluded that good design for a network based on interchange can attract more passengers than a network design with a radial system and this has been shown to be the case in cities such as Zurich, Switzerland. From a policy point of view, this section looks at two possible policies to enhance interchange: first providing fare discounts to transfer trips and second, increasing the density of feeder bus stops thereby improving service quality of bus services to train stations.. There are two types of possible transfer fare discount policies: the first would give a discount to all transfer trips and the second would give a discount to inter-modal transfer trips only (i.e. train-bus and bus-ferry). Figures 5 and 6 show the simulation results for segment 1, the employee segment for these two policy options. Various increases in levels of fare discounts are simulated; holding all other factors constant. In Figure 5, a fare discount is provided to every transfer trip, all transfer related alternatives increase their share and direct trips will decrease in share, as expected. If we provide a discount only to inter-mode transfer trips (Figure 6), the number of train-bus passengers will almost double because of the free transfer. This inter-modal transfer trip increase is mainly coming from bus-bus passengers with all other travel alternatives only showings light changes. The conclusions is that for these two fare discount policies, the simulation results confirm that the effect would be to encourage transfers and this may enhance the network effect for the public transport system in SEQ. However, providing transfer fare discounts to all transport modes will, as expected, bring larger network effects as compared to providing a transfer discount to inter-mode transfers only. All other segments show the same transfer shifting patterns but with different alternative shares.

Barbara T.H. Yen et al. / Transportation Research Procedia 25C (2017) 4023–4041 4037 Yen et al./ Transportation Research Procedia 00 (2017) 000–000 15
Figure 5 Alternative share changes in various decreasing levels of fare discounts on all transfer trips for Segment 1
Figure 6 Alternative share changes in various decreasing levels of fare discounts on inter-mode transfer trips for Segment 1 A second policy option is to improve the accessibility of trains by enhancing the feeder bus services. The simulation for this increases the density of feeder bus stops within the catchment area of train stations in order to improve inter-modal integration. Taking the employee segment again as an example, the simulation results in Figure 7 suggest that inter-mode transfers, especially for bus-train, would increase significantly and would shift from both bus only and bus-bus alternatives. A similar pattern can be found for the wealthier people segment, segment 3. Figure 8 shows the impact for the segment 2, the typical student segment, and a similar pattern emerges for the seniors segment (not shown). As might be expected, an increase in the density of feeder bus stops increases the bus-train share but this is a shift from the train only alternative. For the student and senior segments, their move from direct to a transfer trip could be consistent with taking a feeder bus to a train station, rather than being given a lift or driving themselves. Again this is a policy that would appear to increase the network effect.
0
10
20
30
40
50
60
10% 20% 30% 40% 50% 60% 70% 80% 90% 100%
Bus Train Ferry Bus-Bus Bus-Train Bus-Ferry
0
10
20
30
40
50
60
10% 20% 30% 40% 50% 60% 70% 80% 90% 100%
Bus Train Ferry Bus-Bus Bus-Train Bus-Ferry

4038 Barbara T.H. Yen et al. / Transportation Research Procedia 25C (2017) 4023–404116 Yen et al./ Transportation Research Procedia00 (2017) 000–000
Figure 7 Alternative share changes in various increasing levels of density of feeder bus stops for the employee segment (segment 1)
Figure 8 Alternative share changes in various increasing levels in density of feeder bus stops for the student segment (segment 2)
7. Conclusions
This paper explores the interchange behaviour of passengers and has categorized passengers into different groups by modelling passenger travel behaviour in SEQ, Australia. The data used to investigate transfer behaviour were obtained from Go-card smart card transaction data in SEQ together with socioeconomic data from the census. The modelling results identified passengers' heterogeneous preferences towards travel alternatives with markedly different market segments. The modelling results show that at 90 % level of confidence (or better) the relative utility associated with each alternative was significant influenced by trip characteristics and the public transport service level, with individual social demographic characteristics in the segment membership function. The empirical results identified passengers categorised into four segments of employees, students, wealthier people and seniors. The findings suggest that public transport network effects are most important to the employee segment with student and senior segments being more likely to choose direct alternatives over alternatives involving interchange.
0
10
20
30
40
50
60
70
10% 20% 30% 40% 50% 60% 70% 80% 90% 100%
Bus Train Ferry Bus-Bus Bus-Train Bus-Ferry
0
5
10
15
20
25
30
35
10% 20% 30% 40% 50% 60% 70% 80% 90% 100%
Bus Train Ferry Bus-Bus Bus-Train Bus-Ferry

Barbara T.H. Yen et al. / Transportation Research Procedia 25C (2017) 4023–4041 403916 Yen et al./ Transportation Research Procedia00 (2017) 000–000
Figure 7 Alternative share changes in various increasing levels of density of feeder bus stops for the employee segment (segment 1)
Figure 8 Alternative share changes in various increasing levels in density of feeder bus stops for the student segment (segment 2)
7. Conclusions
This paper explores the interchange behaviour of passengers and has categorized passengers into different groups by modelling passenger travel behaviour in SEQ, Australia. The data used to investigate transfer behaviour were obtained from Go-card smart card transaction data in SEQ together with socioeconomic data from the census. The modelling results identified passengers' heterogeneous preferences towards travel alternatives with markedly different market segments. The modelling results show that at 90 % level of confidence (or better) the relative utility associated with each alternative was significant influenced by trip characteristics and the public transport service level, with individual social demographic characteristics in the segment membership function. The empirical results identified passengers categorised into four segments of employees, students, wealthier people and seniors. The findings suggest that public transport network effects are most important to the employee segment with student and senior segments being more likely to choose direct alternatives over alternatives involving interchange.
0
10
20
30
40
50
60
70
10% 20% 30% 40% 50% 60% 70% 80% 90% 100%
Bus Train Ferry Bus-Bus Bus-Train Bus-Ferry
0
5
10
15
20
25
30
35
10% 20% 30% 40% 50% 60% 70% 80% 90% 100%
Bus Train Ferry Bus-Bus Bus-Train Bus-Ferry
Yen et al./ Transportation Research Procedia 00 (2017) 000–000 17
This paper contributes to the literature by identifying the transfer effects for different groups of people. The modelling approach, using latent class NL modelling, provides information as to how different levels influence utility is influenced by the selection of different public transport travel options. This allows a better understanding of the passenger market and what modes of public transport passengers actually prefer. In order to enhance the public transport network effect, some two policies to encourage transfers by passengers are investigated using simulations. The results show that the network effect for the SEQ public transport system can be improved by providing fare discounts to trips requiring transfer and increasing accessibility to train stations.
Future research will focus on the investigation of other potential determinants influencing different areas, including the role of public transport network design, and/or mode service levels (e.g., bus service frequency, service coverage, etc.). Further segmentation of the peak/off-peak time periods will also be considered as a way of improving model fit and interpreting fare policies. A further consideration might be to consider a distance based fare system as opposed to the current zonal system which would provide insights into the financial effects of public transport fare policies. Finally, underpinning the modelling is that passengers are public transport captive and have access to the public mode options, bus, train and ferry in this study. This is a limitation of the smart card data which does not include private vehicle use. This assumption may or may not be true in practice, and an area for future research would be to build transport by car into the modelling as a possible alternative for passengers, to see how the market share might change.
Acknowledgements
This research was sponsored in part by National Science Council, Republic of China (NSC 104-2917-I-564-078).
References
Abkowitz, M., Josef, R., Tozz, J., Driscoll, M.K., 1987.Operational feasibility of timed transfer in transit system. Journal of Transportation Engineering, 113 (2), 168-177.
Anable, J. 2005. ‘Complacent Car Addicts’ or ‘Aspiring Environmentalists’? Identifying travel behaviour segments using attitude theory. Transport Policy 12, 68-78.
Atkins, S. T. 1990. Personal security as a transport issue: A state-of-the-art review. Transportation Reviews 10, 111-125. Bagchi, M., White, P.R., 2004. What role for smart-card from bus system? Municipal Engineer 157, 39-46. Bagchi, M., White, P.R., 2005.The potential of public transport smart card data. Transport Policy 12, 464-474. Bekhor, S., Elgar, A., 2007. Investment in mobility by car as an explanatory variable for market segmentation. Journal of Public Transportation
10, 17–32. Blythe, P., 2004.Improving public transport ticketing through smart cards. Proceedings of the Institute of Civil Engineer, Municipal Engineer 157,
47-54. Callaghan, L., and W. Vincent. 2007. Preliminary evaluation of Metro Orange Line Bus Rapid Transit Project. Transportation Research Record
2034, 37-44. Carey, M., 1994.Reliability of interconnected scheduled service. European Journal of Operational Research 97, 51-72. Chowdhury, S., Ceder, A., 2013. Definition of Planned and Unplanned Transfer of Public Transport Service and User Decisions to Use Routes
with Transfers. Journal of Public Transportation 16, 1-20. Chowdhury, S., Ceder, A., Schwalger, B., 2015. The effects of travel time and cost savings on commuters' decision to travel on public transport
routes involving transfer. Journal of Transport Geography 43, 151-159. Clever, R. 1997. Integrated timed transfer. Transportation Research Record 1571, 109-115. Currie, G., Loader, C., 2010. Bus network planning for transfers and the network effect in Melbourne, Australia. Transportation Research Record
2145, 8-17. Garling, T., Eek, D., Loukopoulos, P., Fujii, S., Johansson Stenman, O., Kitamura, R., Pendyala, R., Vilhelmson, B., 2002. A conceptual analysis
of the impact of travel demand management on private car use. Transport Policy 9, 59-70. Golotta, K., Hensher, S.A., 2008. Why is the Brisbane bus Rapid transit system deemed a success? Road and Transport Research 17, 3-16. Guo, Z., Wilson, H.H.M., 2011. Assessing the cost of transfer inconvenience in public transport system: A case study of the London
Underground. Transport Research Part A 45, 91-104. Gupta, S., Chintagunta, P.K., 1994. On using demographic variables to determine segment membership in logit mixture models. Journal of

4040 Barbara T.H. Yen et al. / Transportation Research Procedia 25C (2017) 4023–404118 Yen et al./ Transportation Research Procedia00 (2017) 000–000
Marketing Research 13, 128–136. Hair, J., Anderson, R., Tatham, R., Black, W., 1998. Multivariate Data Analysis, Fifth ed Prentice Hall, Englewood Cliffs, NJ. Harmer. C., Millard, K., Plamer, D., Ubbels, B., Monzon, A., Hernandez, S., 2014. What makes a successful urban interchange? results from an
evidence review. Transport Research Arena Proceedings. Harvey, G., 1986. Study of airport access mode choice. Journal of Transportation Engineering 112 (5), 525–545. Hensher, D.A., Puckett, S.M., 2007. Congestion and variable user charging as an effective travel demand management instrument.
Transportation Research Part A 41, 615-626. Hine, J., Scott, J., 2000. Seamless, accessible travel: users' view of the public transport journey and interchange. Transport Policy 7, 217-226. Hoeven, F.v.d., Egmond, P.v., Spek, S.v.d., Nes, A.v., Cre, I., Berends, H., Hoogendoorn, C., 2014. New tools for design and operation of urban
transport interchange facilities zones and development areas. Transport Research Arena Proceedings. Horowitz, A.J., Thompson, N.A., 1995. Generic objectives for evaluation of intermodal passenger transfer facilities. Transportation research
record 1503, 104-110. Iseki, H., and B. D. Taylor. 2009. Not all transfers are created equal: Towards a framework relating transfer connectivity to travel behaviour.
Transport Reviews 29, 777-800. Kamakura, W.A., Kim, B.-D., Lee, J., 1996. Modeling preference and structural heterogeneity in consumer choice. Marketing Science 15, 152–
172. Kamakura, W.A., Russell, G.A., 1989. A probabilistic choice model for market segmentation and elasticity structure. Journal of Marketing
Research 26, 379–390. Meyer, M.D., 1999. Demand management as an element of transportation policy: using carrots and sticks to influence travel behaviour.
Transportation Research Part A 33, 575-599. Morency, C., Trepanier, M., Agard, B., 2007.Measuring transit use variability with smart-card data. Transport Policy 14, 193-203. Munizaga, M., Palma, C., Mora, P., 2010.Public transport OD matrix estimation from smart card payment system data. The 12th World
Conference in Transport Research, Lisbon. Murray, A.T., 2001.Strategic analysis of public transport coverage. Socio-Economic Planning Sciences 35, 175-188. Ortúzar, J.de D., Willumsen, L.G., 2001. Modelling Transport. John Wiley & Sons, Ltd. Pelletier, M.P., Trepanier, M., Morency, C., 2011. Smart card data use in public transit: a literature review. Transportation Research Part C 19,
557- 568. Psaraki, V., Abacoumkin, C., 2002. Access mode choice for relocated airports: the new Athens international airport. Journal of Air Transport
Management 8, 89–98. Rastogi, R., Rao, K.V.K., 2009. Segmentation analysis of commuters accessing transit: Mumbai study. Journal of Transportation Engineering
135, 506–515. Rietveld, P., Bruinsma, F.R., Vuuren, D.J.V., 2001.Coping with unreliability in public transport chains: A case study for
Netherlands.Transportation Research Part A 35, 539-559. Seaborn, C., Wilson, N.H., Attanucci, J., 2009. Using smart card fare payment data to analysis multi-modal public transport journeys (London,
UK). The 88th Annual Meeting of the Transportation Research Board, Washington. Shafahi, Y., Khani, A., 2010. A practical model for transfer optimization in a transit network: Model formulations and solutions. Transport
Research Part A 44, 377-389. Smart, M., Miller, M.A., Taylor, B.D.,2009. Transit stops and stations: transit managers' perspectives on evaluating performance. Journal of
Public Transportation 12, 59-77. Spearritt, P., 2009. The 200 km city: Brisbane, the Gold Coast, and Sunshine Coast. Australian Economic History Review 49, 87-106. Stopher, P., FitzGerald, C., Xu, M., 2007.Assessing the accuracy of the Sydney household travel survey with GPS. Transportation 34, 723-741. Thompson, G, 1977. Planning Considerations for Alternative Transit Route Structures. Journal of the American Institute of Planners, 43(2), 158-
168. Thompson, R., Burroughs, R. and Smythe, T., 2006. Exploring the Connections Between Ferries and Urban Form: Some considerations before
jumping on board. Journal of Urban Technology 13(2), 25-52. Train, K.E., 2003. Discrete Choice Methods with Simulation. Cambridge University Press. Trepanier, M., Morency, C., 2010.Assessing transit loyalty with smart card data. The 12th World Conference on Intelligent Transport System.
New York, USA. Tsai, C., Mulley, C., Burke, M.I., Yen, B.T.H., 2014.Exploring property value effects of ferry terminals: Evidence from Brisbane, Australia.
World Symposium on Transport and Land Use Research, ed. D. Levinson (Delft, the Netherlands: World Society for Transport and Land Use Research, 2014).
Tsamboulas, D., Golias, J., Vlahoyannis, M., 1992. Model development for metro station access mode choice. Transportation 19, 231–244. Vande Walle, S., and T. Steenberghen. 2006. Space and time related determinants of public transport use in trip chains. Transportation Research
Part A 40, 151-162. Vassalo, J.M., Ciommon, F.D., Garcia, A., 2012. Inter modal exchange stations in the city of Madrid. Transportation 39, 975-995. Vuchic, V.R.,2006.Urban Transit System and Technology. John Wiley & Sons, Hoboken, NJ. Wedel, M., Kamakura, W.A. (Eds.), 1998. Market Segmentation: Conceptual and Methodological Foundations. Kluwer Academic Publishers,
Dordrecht.

Barbara T.H. Yen et al. / Transportation Research Procedia 25C (2017) 4023–4041 4041 Yen et al./ Transportation Research Procedia 00 (2017) 000–000 19
Wen, C.H., Lai, S.C., 2010. Latent class model of international air carrier choice. Transport Research Part E 46, 211-221. Wen, C.H., Wang, W.C., Fu, C., 2012. Latent class nested logit model for analyzing high-speed rail access mode choice. Transportation
Research Part E 48, 545–554. Xumei, C., L. Qiaoxian, and D. Guang. 2011. Estimation of travel time values for urban public transport passengers based on SP survey. Journal
of Transportation Systems Engineering and Information Technology 11, 77-84.